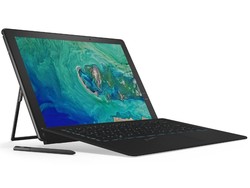
Breve Análise do Conversível Acer Switch 7 Black Edition (i7-8550U, MX150)


| SD Card Reader | |
| average JPG Copy Test (av. of 3 runs) | |
| Lenovo ThinkPad X1 Yoga 2018-20LES01W00 (Toshiba Exceria Pro M501) | |
| Microsoft Surface Pro 6, Core i7, 512 GB (Toshiba Exceria Pro M501 microSDXC 64GB) | |
| Fujitsu Stylistic Q738 (Toshiba Exceria Pro M501 microSDXC 64GB) | |
| Acer Switch 7 BE SW713-51GNP (Toshiba Exceria Pro M501 microSDXC 64GB) | |
| Média da turma Convertible (29.4 - 186, n=21, últimos 2 anos) | |
| maximum AS SSD Seq Read Test (1GB) | |
| Lenovo ThinkPad X1 Yoga 2018-20LES01W00 (Toshiba Exceria Pro M501) | |
| Média da turma Convertible (67.5 - 254, n=20, últimos 2 anos) | |
| Microsoft Surface Pro 6, Core i7, 512 GB (Toshiba Exceria Pro M501 microSDXC 64GB) | |
| Acer Switch 7 BE SW713-51GNP (Toshiba Exceria Pro M501 microSDXC 64GB) | |
| Fujitsu Stylistic Q738 (Toshiba Exceria Pro M501 microSDXC 64GB) | |
| |||||||||||||||||||||||||
iluminação: 82 %
iluminação com acumulador: 379 cd/m²
Contraste: 868:1 (Preto: 0.44 cd/m²)
ΔE ColorChecker Calman: 6.23 | ∀{0.5-29.43 Ø4.71}
calibrated: 2.62
ΔE Greyscale Calman: 8.34 | ∀{0.09-98 Ø4.96}
95% sRGB (Argyll 1.6.3 3D)
61% AdobeRGB 1998 (Argyll 1.6.3 3D)
66.1% AdobeRGB 1998 (Argyll 3D)
94.8% sRGB (Argyll 3D)
66.4% Display P3 (Argyll 3D)
Gamma: 2.43
CCT: 7853 K
| Acer Switch 7 BE SW713-51GNP KL.1350W.001, , 2256x1504, 13.5" | Microsoft Surface Pro 6, Core i7, 512 GB LGPhilips LP123WQ112604, , 2736x1824, 12.3" | HP Elite x2 1013 G3-2TT14EA AU Optronics AUO101A, , 3000x2000, 13" | Lenovo ThinkPad X1 Yoga 2018-20LES01W00 Lenovo 40AE / B140QAN02.0, , 2560x1440, 14" | Fujitsu Stylistic Q738 Sharp SHP149B, , 1920x1080, 13.3" | |
|---|---|---|---|---|---|
| Display | 2% | 2% | 28% | 3% | |
| Display P3 Coverage (%) | 66.4 | 67.1 1% | 67.5 2% | 86.5 30% | 67.8 2% |
| sRGB Coverage (%) | 94.8 | 95.5 1% | 96.7 2% | 100 5% | 96.6 2% |
| AdobeRGB 1998 Coverage (%) | 66.1 | 67.9 3% | 68.2 3% | 99.4 50% | 69.4 5% |
| Response Times | 32% | 28% | 22% | 43% | |
| Response Time Grey 50% / Grey 80% * (ms) | 59 ? | 43 ? 27% | 47 ? 20% | 56.8 ? 4% | 35 ? 41% |
| Response Time Black / White * (ms) | 40 ? | 25 ? 37% | 26 ? 35% | 24 ? 40% | 22 ? 45% |
| PWM Frequency (Hz) | 22000 ? | 208 ? | |||
| Screen | 32% | 19% | 46% | 14% | |
| Brightness middle (cd/m²) | 382 | 484 27% | 452 18% | 562 47% | 292 -24% |
| Brightness (cd/m²) | 344 | 473 38% | 412 20% | 522 52% | 277 -19% |
| Brightness Distribution (%) | 82 | 91 11% | 85 4% | 86 5% | 90 10% |
| Black Level * (cd/m²) | 0.44 | 0.33 25% | 0.48 -9% | 0.3 32% | 0.32 27% |
| Contrast (:1) | 868 | 1467 69% | 942 9% | 1873 116% | 913 5% |
| Colorchecker dE 2000 * | 6.23 | 4.29 31% | 4.05 35% | 2.8 55% | 3.69 41% |
| Colorchecker dE 2000 max. * | 12.41 | 6.46 48% | 6.64 46% | 5.8 53% | 6.9 44% |
| Colorchecker dE 2000 calibrated * | 2.62 | 1.34 49% | 1.56 40% | ||
| Greyscale dE 2000 * | 8.34 | 4.3 48% | 4.87 42% | 4.5 46% | 4.11 51% |
| Gamma | 2.43 91% | 2.51 88% | 2.71 81% | 2.16 102% | 2.3 96% |
| CCT | 7853 83% | 7315 89% | 7160 91% | 7205 90% | 7140 91% |
| Color Space (Percent of AdobeRGB 1998) (%) | 61 | 62 2% | 62 2% | 88.9 46% | 63 3% |
| Color Space (Percent of sRGB) (%) | 95 | 95 0% | 97 2% | 100 5% | 97 2% |
| Média Total (Programa/Configurações) | 22% /
26% | 16% /
17% | 32% /
39% | 20% /
16% |
* ... menor é melhor
Exibir tempos de resposta
| ↔ Tempo de resposta preto para branco | ||
|---|---|---|
| 40 ms ... ascensão ↗ e queda ↘ combinadas | ↗ 22 ms ascensão | 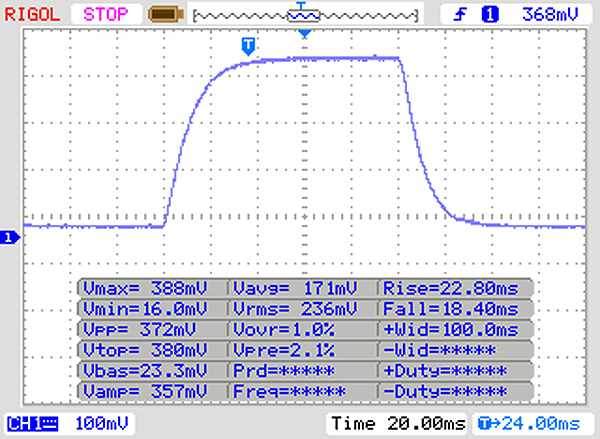 |
| ↘ 18 ms queda | ||
| A tela mostra taxas de resposta lentas em nossos testes e será insatisfatória para os jogadores. Em comparação, todos os dispositivos testados variam de 0.1 (mínimo) a 240 (máximo) ms. » 97 % de todos os dispositivos são melhores. Isso significa que o tempo de resposta medido é pior que a média de todos os dispositivos testados (19.8 ms). | ||
| ↔ Tempo de resposta 50% cinza a 80% cinza | ||
| 59 ms ... ascensão ↗ e queda ↘ combinadas | ↗ 29 ms ascensão | 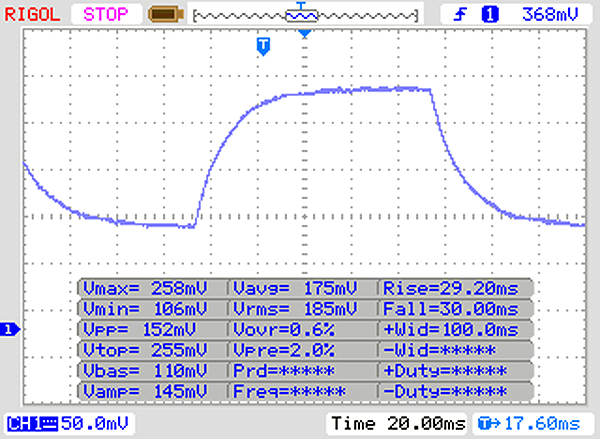 |
| ↘ 30 ms queda | ||
| A tela mostra taxas de resposta lentas em nossos testes e será insatisfatória para os jogadores. Em comparação, todos os dispositivos testados variam de 0.165 (mínimo) a 636 (máximo) ms. » 95 % de todos os dispositivos são melhores. Isso significa que o tempo de resposta medido é pior que a média de todos os dispositivos testados (30.9 ms). | ||
Cintilação da tela / PWM (modulação por largura de pulso)
| Tela tremeluzindo / PWM não detectado | 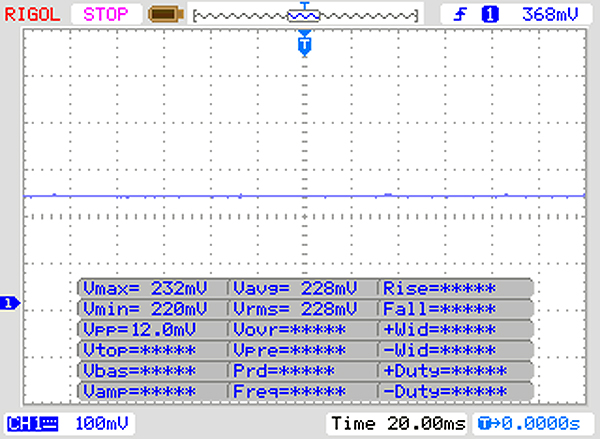 | ||
[pwm_comparison] Em comparação: 52 % de todos os dispositivos testados não usam PWM para escurecer a tela. Se PWM foi detectado, uma média de 7744 (mínimo: 5 - máximo: 343500) Hz foi medida. | |||

| PCMark 8 Home Score Accelerated v2 | 3306 pontos | |
| PCMark 8 Work Score Accelerated v2 | 4450 pontos | |
| PCMark 10 Score | 3056 pontos | |
Ajuda | ||
| Acer Switch 7 BE SW713-51GNP Liteonit CV3-SD512 | Microsoft Surface Pro 6, Core i7, 512 GB Toshiba KBG30ZPZ512G | HP Elite x2 1013 G3-2TT14EA Samsung PM961 MZVLW256HEHP | Lenovo ThinkPad X1 Yoga 2018-20LES01W00 Samsung SSD PM981 MZVLB512HAJQ | Fujitsu Stylistic Q738 Samsung SSD PM871b MZNLN256HAJQ | Média Liteonit CV3-SD512 | |
|---|---|---|---|---|---|---|
| CrystalDiskMark 5.2 / 6 | 69% | 173% | 260% | 1% | 0% | |
| Write 4K (MB/s) | 61.4 | 83.2 36% | 91 48% | 138.8 126% | 79.5 29% | 61.4 ? 0% |
| Read 4K (MB/s) | 29.98 | 43.84 46% | 36.84 23% | 45.21 51% | 19.71 -34% | 30 ? 0% |
| Write Seq (MB/s) | 432.8 | 636 47% | 1197 177% | 1896 338% | 385.2 -11% | 433 ? 0% |
| Read Seq (MB/s) | 448 | 900 101% | 1705 281% | 2070 362% | 435.9 -3% | 448 ? 0% |
| Write 4K Q32T1 (MB/s) | 226.7 | 192.9 -15% | 355.8 57% | 483.3 113% | 222.4 -2% | 227 ? 0% |
| Read 4K Q32T1 (MB/s) | 302.2 | 247.4 -18% | 256.9 -15% | 451.8 50% | 212.8 -30% | 302 ? 0% |
| Write Seq Q32T1 (MB/s) | 353 | 861 144% | 1222 246% | 2066 485% | 534 51% | 353 ? 0% |
| Read Seq Q32T1 (MB/s) | 521 | 1615 210% | 3460 564% | 3423 557% | 544 4% | 521 ? 0% |
| AS SSD | 4% | 126% | 13% | 0% | ||
| Seq Read (MB/s) | 509 | 1154 127% | 2062 305% | 432.9 -15% | 509 ? 0% | |
| Seq Write (MB/s) | 456.9 | 393.6 -14% | 832 82% | 253.6 -44% | 457 ? 0% | |
| 4K Read (MB/s) | 22.65 | 34.42 52% | 41.45 83% | 22.47 -1% | 22.7 ? 0% | |
| 4K Write (MB/s) | 43.98 | 68.9 57% | 91.1 107% | 76.7 74% | 44 ? 0% | |
| 4K-64 Read (MB/s) | 325.5 | 494.1 52% | 669 106% | 377.8 16% | 326 ? 0% | |
| 4K-64 Write (MB/s) | 243.7 | 171.3 -30% | 596 145% | 282.1 16% | 244 ? 0% | |
| Access Time Read * (ms) | 0.213 | 0.063 | 0.148 | |||
| Access Time Write * (ms) | 0.08 | 0.3 -275% | 0.041 49% | 0.046 43% | 0.08 ? -0% | |
| Score Read (Points) | 399 | 644 61% | 917 130% | 444 11% | 399 ? 0% | |
| Score Write (Points) | 333 | 280 -16% | 770 131% | 384 15% | 333 ? 0% | |
| Score Total (Points) | 941 | 1225 30% | 2105 124% | 1052 12% | 941 ? 0% | |
| Copy ISO MB/s (MB/s) | 985 | 761 | ||||
| Copy Program MB/s (MB/s) | 143.1 | 237.3 | ||||
| Copy Game MB/s (MB/s) | 676 | 512 | ||||
| Média Total (Programa/Configurações) | 37% /
33% | 150% /
147% | 260% /
260% | 7% /
7% | 0% /
0% |
* ... menor é melhor

| 3DMark 11 Performance | 3800 pontos | |
| 3DMark Cloud Gate Standard Score | 12420 pontos | |
| 3DMark Fire Strike Score | 2575 pontos | |
Ajuda | ||
| Thief | |
| 1920x1080 Very High Preset AA:FXAA & High SS AF:8x | |
| Média NVIDIA GeForce MX150 (16 - 23.2, n=6) | |
| Acer Switch 7 BE SW713-51GNP | |
| 1366x768 High Preset AA:FXAA & Low SS AF:4x | |
| Média NVIDIA GeForce MX150 (30.2 - 44.1, n=6) | |
| Acer Switch 7 BE SW713-51GNP | |
| Microsoft Surface Pro 6, Core i7, 512 GB | |
| 1366x768 Normal Preset AA:FX | |
| Acer Switch 7 BE SW713-51GNP | |
| Média NVIDIA GeForce MX150 (32.5 - 51.9, n=6) | |
| Microsoft Surface Pro 6, Core i7, 512 GB | |
| 1024x768 Very Low Preset | |
| Acer Switch 7 BE SW713-51GNP | |
| Média NVIDIA GeForce MX150 (41.5 - 79.2, n=6) | |
| Microsoft Surface Pro 6, Core i7, 512 GB | |
| Rise of the Tomb Raider | |
| 1024x768 Lowest Preset | |
| Média NVIDIA GeForce MX150 (41.6 - 86, n=28) | |
| Acer Switch 7 BE SW713-51GNP | |
| Microsoft Surface Pro 6, Core i7, 512 GB | |
| Lenovo ThinkPad X1 Yoga 2018-20LES01W00 | |
| HP Elite x2 1013 G3-2TT14EA | |
| 1366x768 Medium Preset AF:2x | |
| Média NVIDIA GeForce MX150 (28.2 - 60, n=29) | |
| Acer Switch 7 BE SW713-51GNP | |
| Microsoft Surface Pro 6, Core i7, 512 GB | |
| HP Elite x2 1013 G3-2TT14EA | |
| 1920x1080 High Preset AA:FX AF:4x | |
| Média NVIDIA GeForce MX150 (14.8 - 27, n=28) | |
| Acer Switch 7 BE SW713-51GNP | |
| Microsoft Surface Pro 6, Core i7, 512 GB | |
| HP Elite x2 1013 G3-2TT14EA | |
| 1920x1080 Very High Preset AA:FX AF:16x | |
| Média NVIDIA GeForce MX150 (14.8 - 26, n=23) | |
| Acer Switch 7 BE SW713-51GNP | |
| HP Elite x2 1013 G3-2TT14EA | |
| baixo | média | alto | ultra | |
|---|---|---|---|---|
| BioShock Infinite (2013) | 125 | 93 | 88 | 30 |
| Thief (2014) | 70 | 43 | 32 | 16 |
| The Witcher 3 (2015) | 19 | |||
| Rise of the Tomb Raider (2016) | 59 | 34 | 18 | 15 |
(±) A temperatura máxima no lado superior é 43.4 °C / 110 F, em comparação com a média de 35.4 °C / 96 F , variando de 19.6 a 60 °C para a classe Convertible.
(-) A parte inferior aquece até um máximo de 45.3 °C / 114 F, em comparação com a média de 36.9 °C / 98 F
(-) Em uso inativo, a temperatura média para o lado superior é 52 °C / 126 F, em comparação com a média do dispositivo de 30.3 °C / ### class_avg_f### F.
(-) Os apoios para as mãos e o touchpad podem ficar muito quentes ao toque, com um máximo de 42.2 °C / 108 F.
(-) A temperatura média da área do apoio para as mãos de dispositivos semelhantes foi 28 °C / 82.4 F (-14.2 °C / -25.6 F).
Acer Switch 7 BE SW713-51GNP análise de áudio
(-) | alto-falantes não muito altos (###valor### dB)
Graves 100 - 315Hz
(±) | graves reduzidos - em média 6.8% menor que a mediana
(±) | a linearidade dos graves é média (7.3% delta para a frequência anterior)
Médios 400 - 2.000 Hz
(±) | médios mais altos - em média 7.2% maior que a mediana
(±) | a linearidade dos médios é média (8.9% delta para frequência anterior)
Altos 2 - 16 kHz
(+) | agudos equilibrados - apenas 4.8% longe da mediana
(+) | os máximos são lineares (6.6% delta da frequência anterior)
Geral 100 - 16.000 Hz
(±) | a linearidade do som geral é média (26.9% diferença em relação à mediana)
Comparado com a mesma classe
» 83% de todos os dispositivos testados nesta classe foram melhores, 3% semelhantes, 14% piores
» O melhor teve um delta de 6%, a média foi 20%, o pior foi 57%
Comparado com todos os dispositivos testados
» 82% de todos os dispositivos testados foram melhores, 4% semelhantes, 14% piores
» O melhor teve um delta de 4%, a média foi 23%, o pior foi 134%
Apple MacBook 12 (Early 2016) 1.1 GHz análise de áudio
(+) | os alto-falantes podem tocar relativamente alto (###valor### dB)
Graves 100 - 315Hz
(±) | graves reduzidos - em média 11.3% menor que a mediana
(±) | a linearidade dos graves é média (14.2% delta para a frequência anterior)
Médios 400 - 2.000 Hz
(+) | médios equilibrados - apenas 2.4% longe da mediana
(+) | médios são lineares (5.5% delta para frequência anterior)
Altos 2 - 16 kHz
(+) | agudos equilibrados - apenas 2% longe da mediana
(+) | os máximos são lineares (4.5% delta da frequência anterior)
Geral 100 - 16.000 Hz
(+) | o som geral é linear (10.2% diferença em relação à mediana)
Comparado com a mesma classe
» 7% de todos os dispositivos testados nesta classe foram melhores, 2% semelhantes, 90% piores
» O melhor teve um delta de 5%, a média foi 18%, o pior foi 53%
Comparado com todos os dispositivos testados
» 5% de todos os dispositivos testados foram melhores, 1% semelhantes, 94% piores
» O melhor teve um delta de 4%, a média foi 23%, o pior foi 134%
| desligado | |
| Ocioso | |
| Carga |
|
Key:
min: | |
| Acer Switch 7 BE SW713-51GNP i5-8550U, GeForce MX150, Liteonit CV3-SD512, IPS, 2256x1504, 13.5" | Microsoft Surface Pro 6, Core i7, 512 GB i7-8650U, UHD Graphics 620, Toshiba KBG30ZPZ512G, IPS, 2736x1824, 12.3" | HP Elite x2 1013 G3-2TT14EA i5-8350U, UHD Graphics 620, Samsung PM961 MZVLW256HEHP, IPS, 3000x2000, 13" | Lenovo ThinkPad X1 Yoga 2018-20LES01W00 i5-8550U, UHD Graphics 620, Samsung SSD PM981 MZVLB512HAJQ, IPS Dolby Vision HDR, 2560x1440, 14" | Fujitsu Stylistic Q738 i5-8350U, UHD Graphics 620, Samsung SSD PM871b MZNLN256HAJQ, IPS, 1920x1080, 13.3" | Média NVIDIA GeForce MX150 | Média da turma Convertible | |
|---|---|---|---|---|---|---|---|
| Power Consumption | 14% | 5% | -11% | 31% | -8% | -0% | |
| Idle Minimum * (Watt) | 4.5 | 3.2 29% | 4.9 -9% | 3.4 24% | 4.2 7% | 4.48 ? -0% | 4.28 ? 5% |
| Idle Average * (Watt) | 7.6 | 8.7 -14% | 8.9 -17% | 8.8 -16% | 7 8% | 7.88 ? -4% | 6.96 ? 8% |
| Idle Maximum * (Watt) | 10.2 | 10.4 -2% | 11 -8% | 11.9 -17% | 7.9 23% | 9.76 ? 4% | 8.67 ? 15% |
| Load Average * (Watt) | 48 | 29.2 39% | 32 33% | 50.4 -5% | 19.8 59% | 54.7 ? -14% | 45.1 ? 6% |
| Load Maximum * (Watt) | 50.3 | 40.8 19% | 36 28% | 71.2 -42% | 22 56% | 63.5 ? -26% | 67.7 ? -35% |
* ... menor é melhor
| Acer Switch 7 BE SW713-51GNP i5-8550U, GeForce MX150, Wh | Microsoft Surface Pro 6, Core i7, 512 GB i7-8650U, UHD Graphics 620, 45 Wh | HP Elite x2 1013 G3-2TT14EA i5-8350U, UHD Graphics 620, 50 Wh | Lenovo ThinkPad X1 Yoga 2018-20LES01W00 i5-8550U, UHD Graphics 620, 54 Wh | Fujitsu Stylistic Q738 i5-8350U, UHD Graphics 620, Wh | Média da turma Convertible | |
|---|---|---|---|---|---|---|
| Duração da bateria | 198% | 141% | 207% | 56% | 307% | |
| Reader / Idle (h) | 3.2 | 18.1 466% | 13 306% | 20.1 528% | 26.7 ? 734% | |
| WiFi v1.3 (h) | 4.1 | 8.5 107% | 7.7 88% | 8.6 110% | 6.4 56% | 12 ? 193% |
| Load (h) | 1.8 | 2.2 22% | 2.3 28% | 1.5 -17% | 1.713 ? -5% |
Pro
Contra
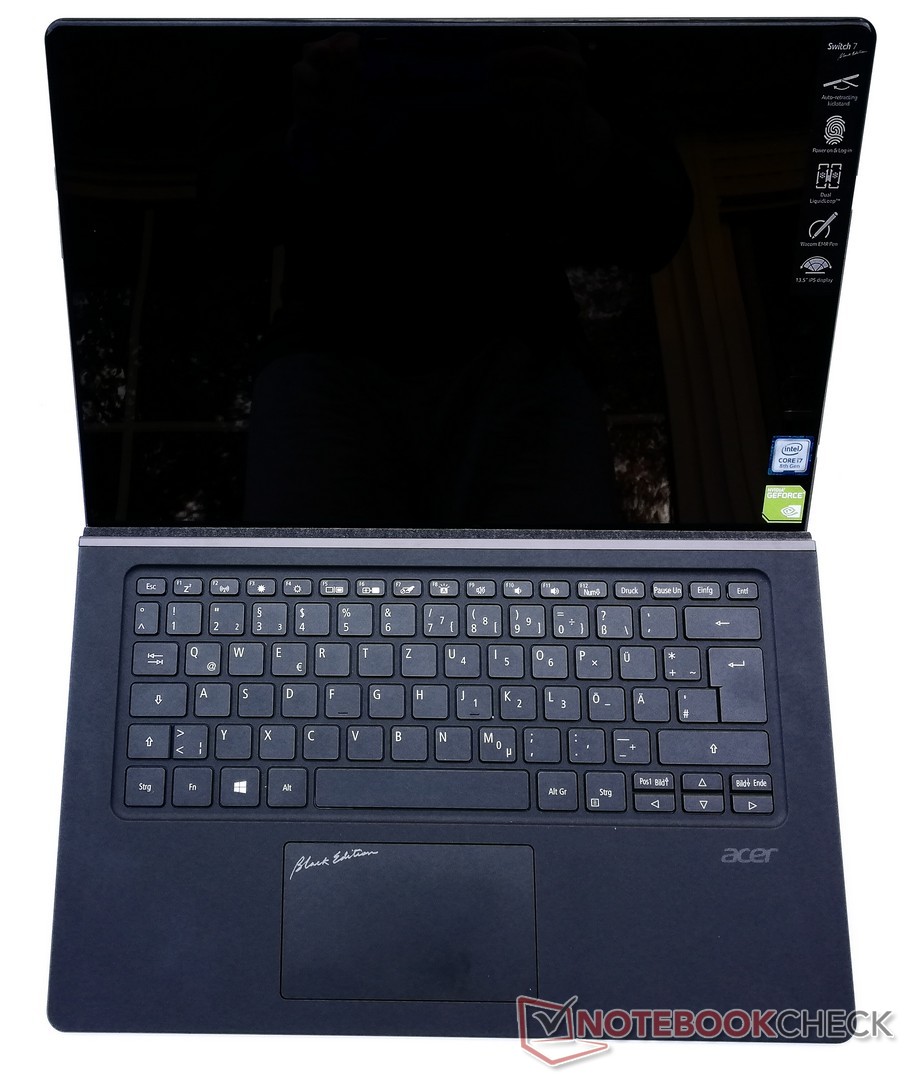
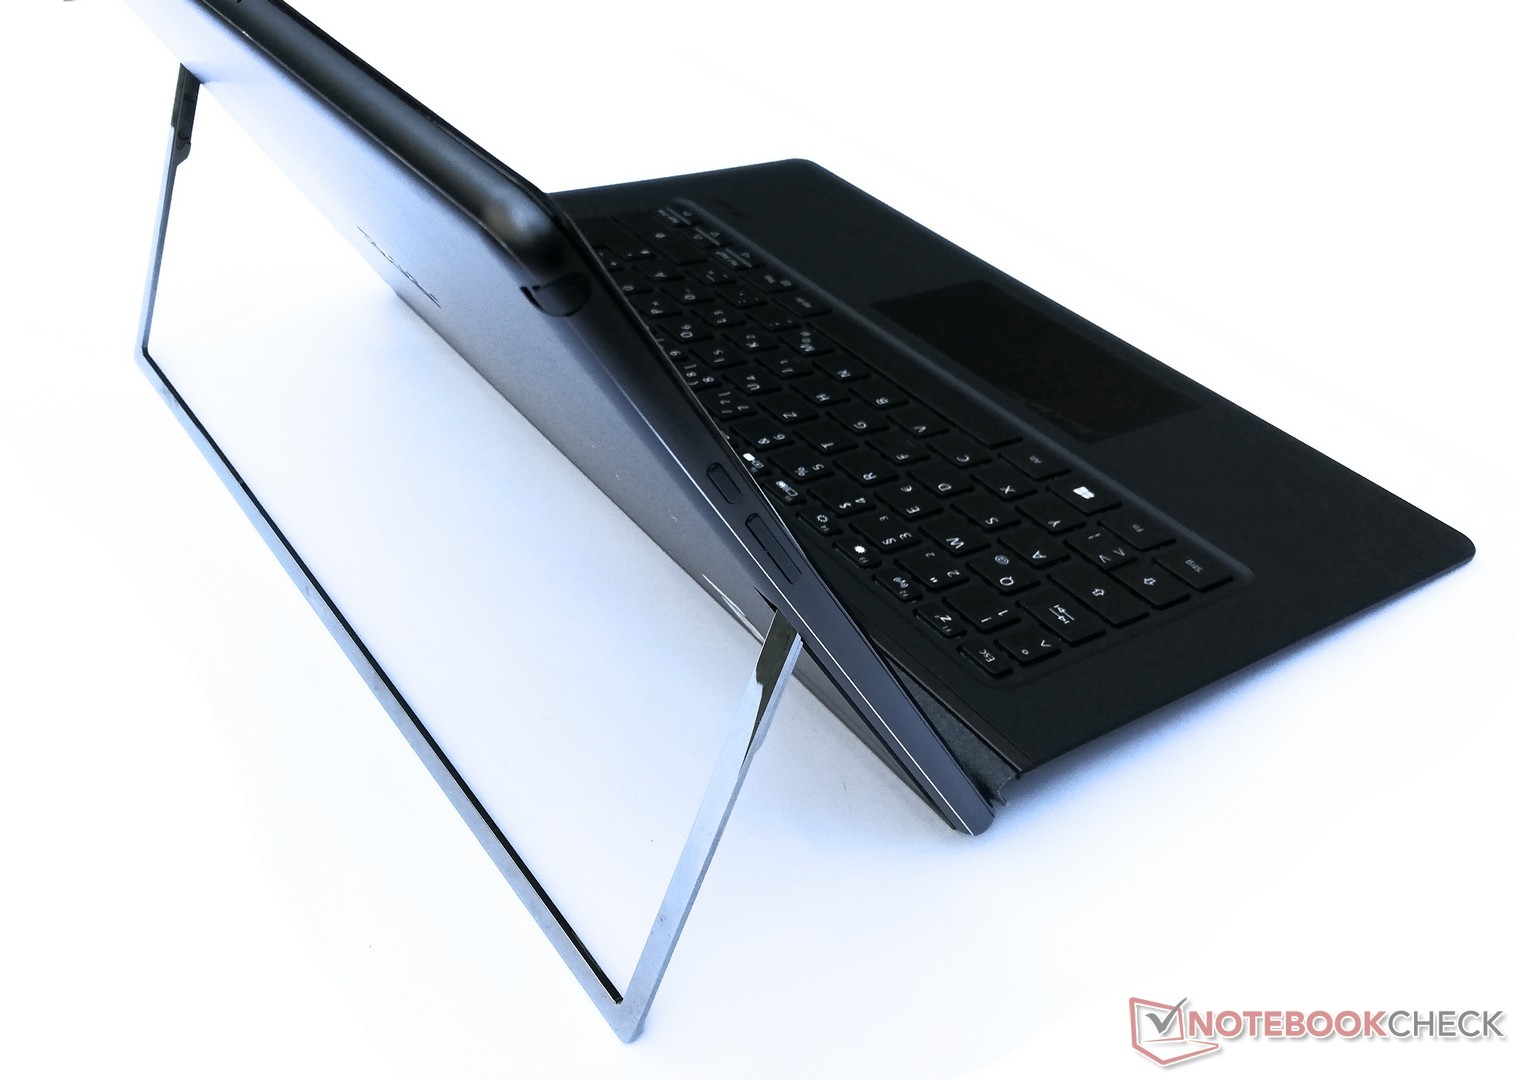
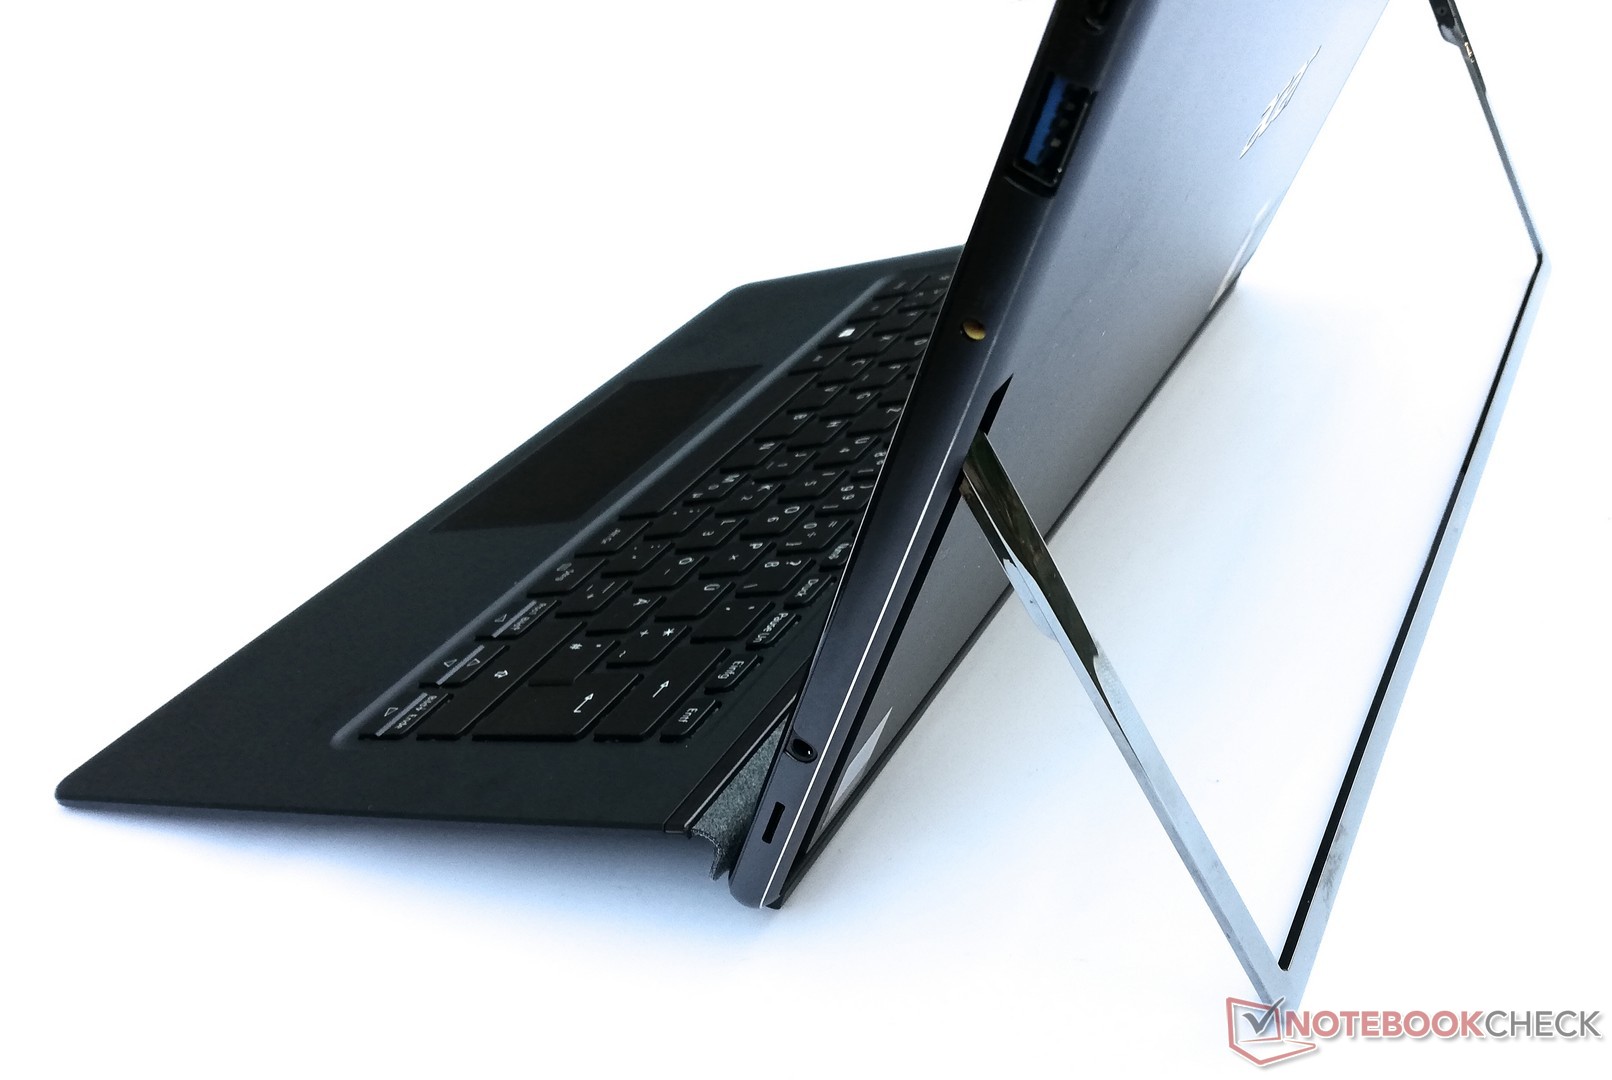
Na nossa análise, o Acer Switch 7 Black Edition demonstra ser um poderoso conversível Windows. O desempenho do sistema está em um bom nível e o hardware incluído deixa a concorrência atrás. No entanto, houve alguns compromissos feitos em termos de seleção de portas. Dito isto, você pode conectar uma estação de encaixe através da porta Thunderbolt para recriar todas as portas que faltam.
Graças ao Nvidia’s dedicated GeForce MX150, o Switch 7 oferece desempenho de jogo muito melhor que os concorrentes com GPUs integrados. No entanto, o Switch 7 pode ficar muito quente. Isso leva ao afogamento térmico e, quanto maior a utilização, mais rápido serão os afogamentos do Switch 7. Os profissionais criativos que fazem muita edição de imagem e precisam de uma caneta devem dar uma olhada mais de perto no Switch 7. Dito isto, o alto peso do tablet pode dificultar o trabalho em algumas circunstâncias.
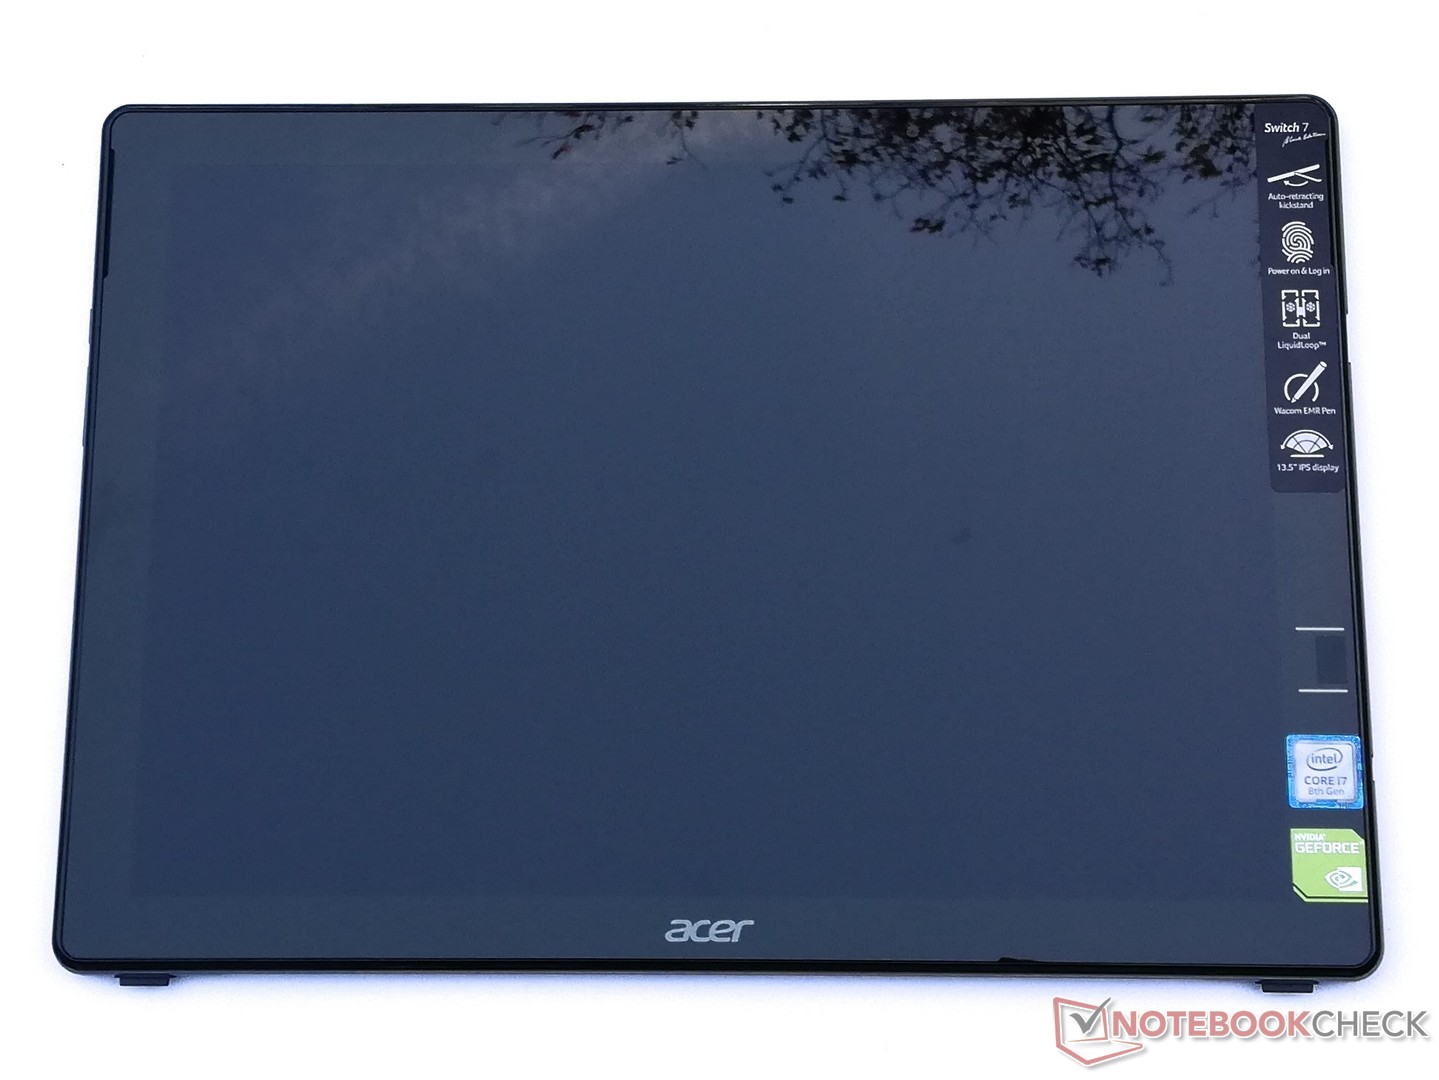
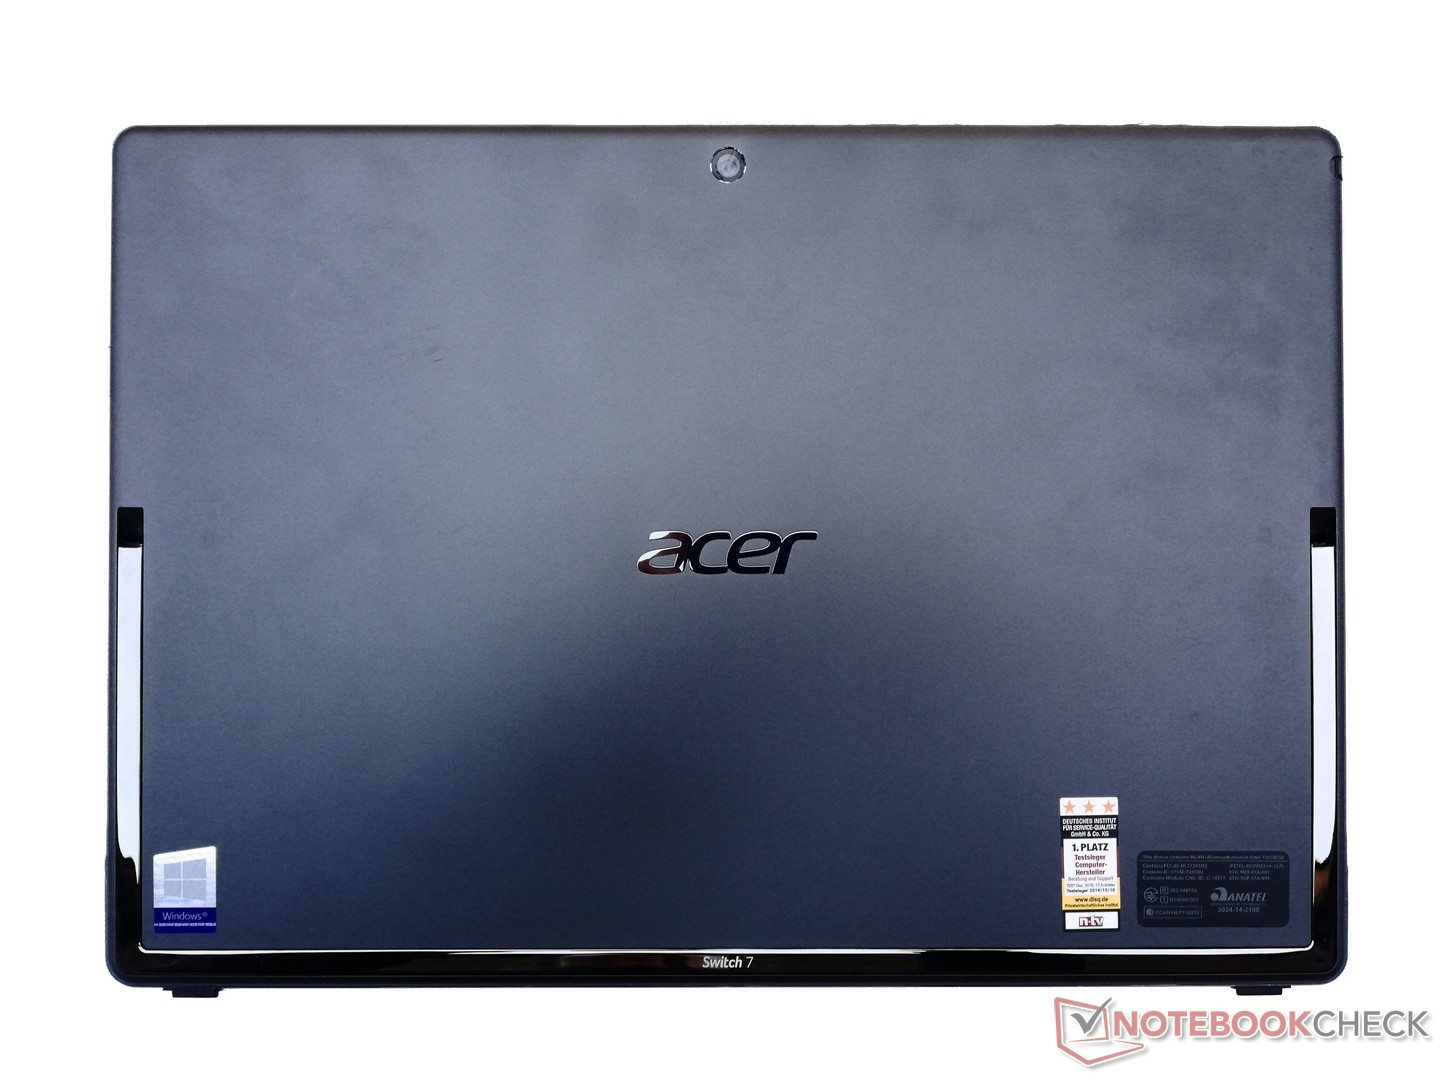
O Acer Switch 7 Black Edition é um conversível Windows muito poderoso que é adequado para várias tarefas.
Acer Switch 7 BE SW713-51GNP
- 11/19/2018 v6 (old)
Mike Wobker