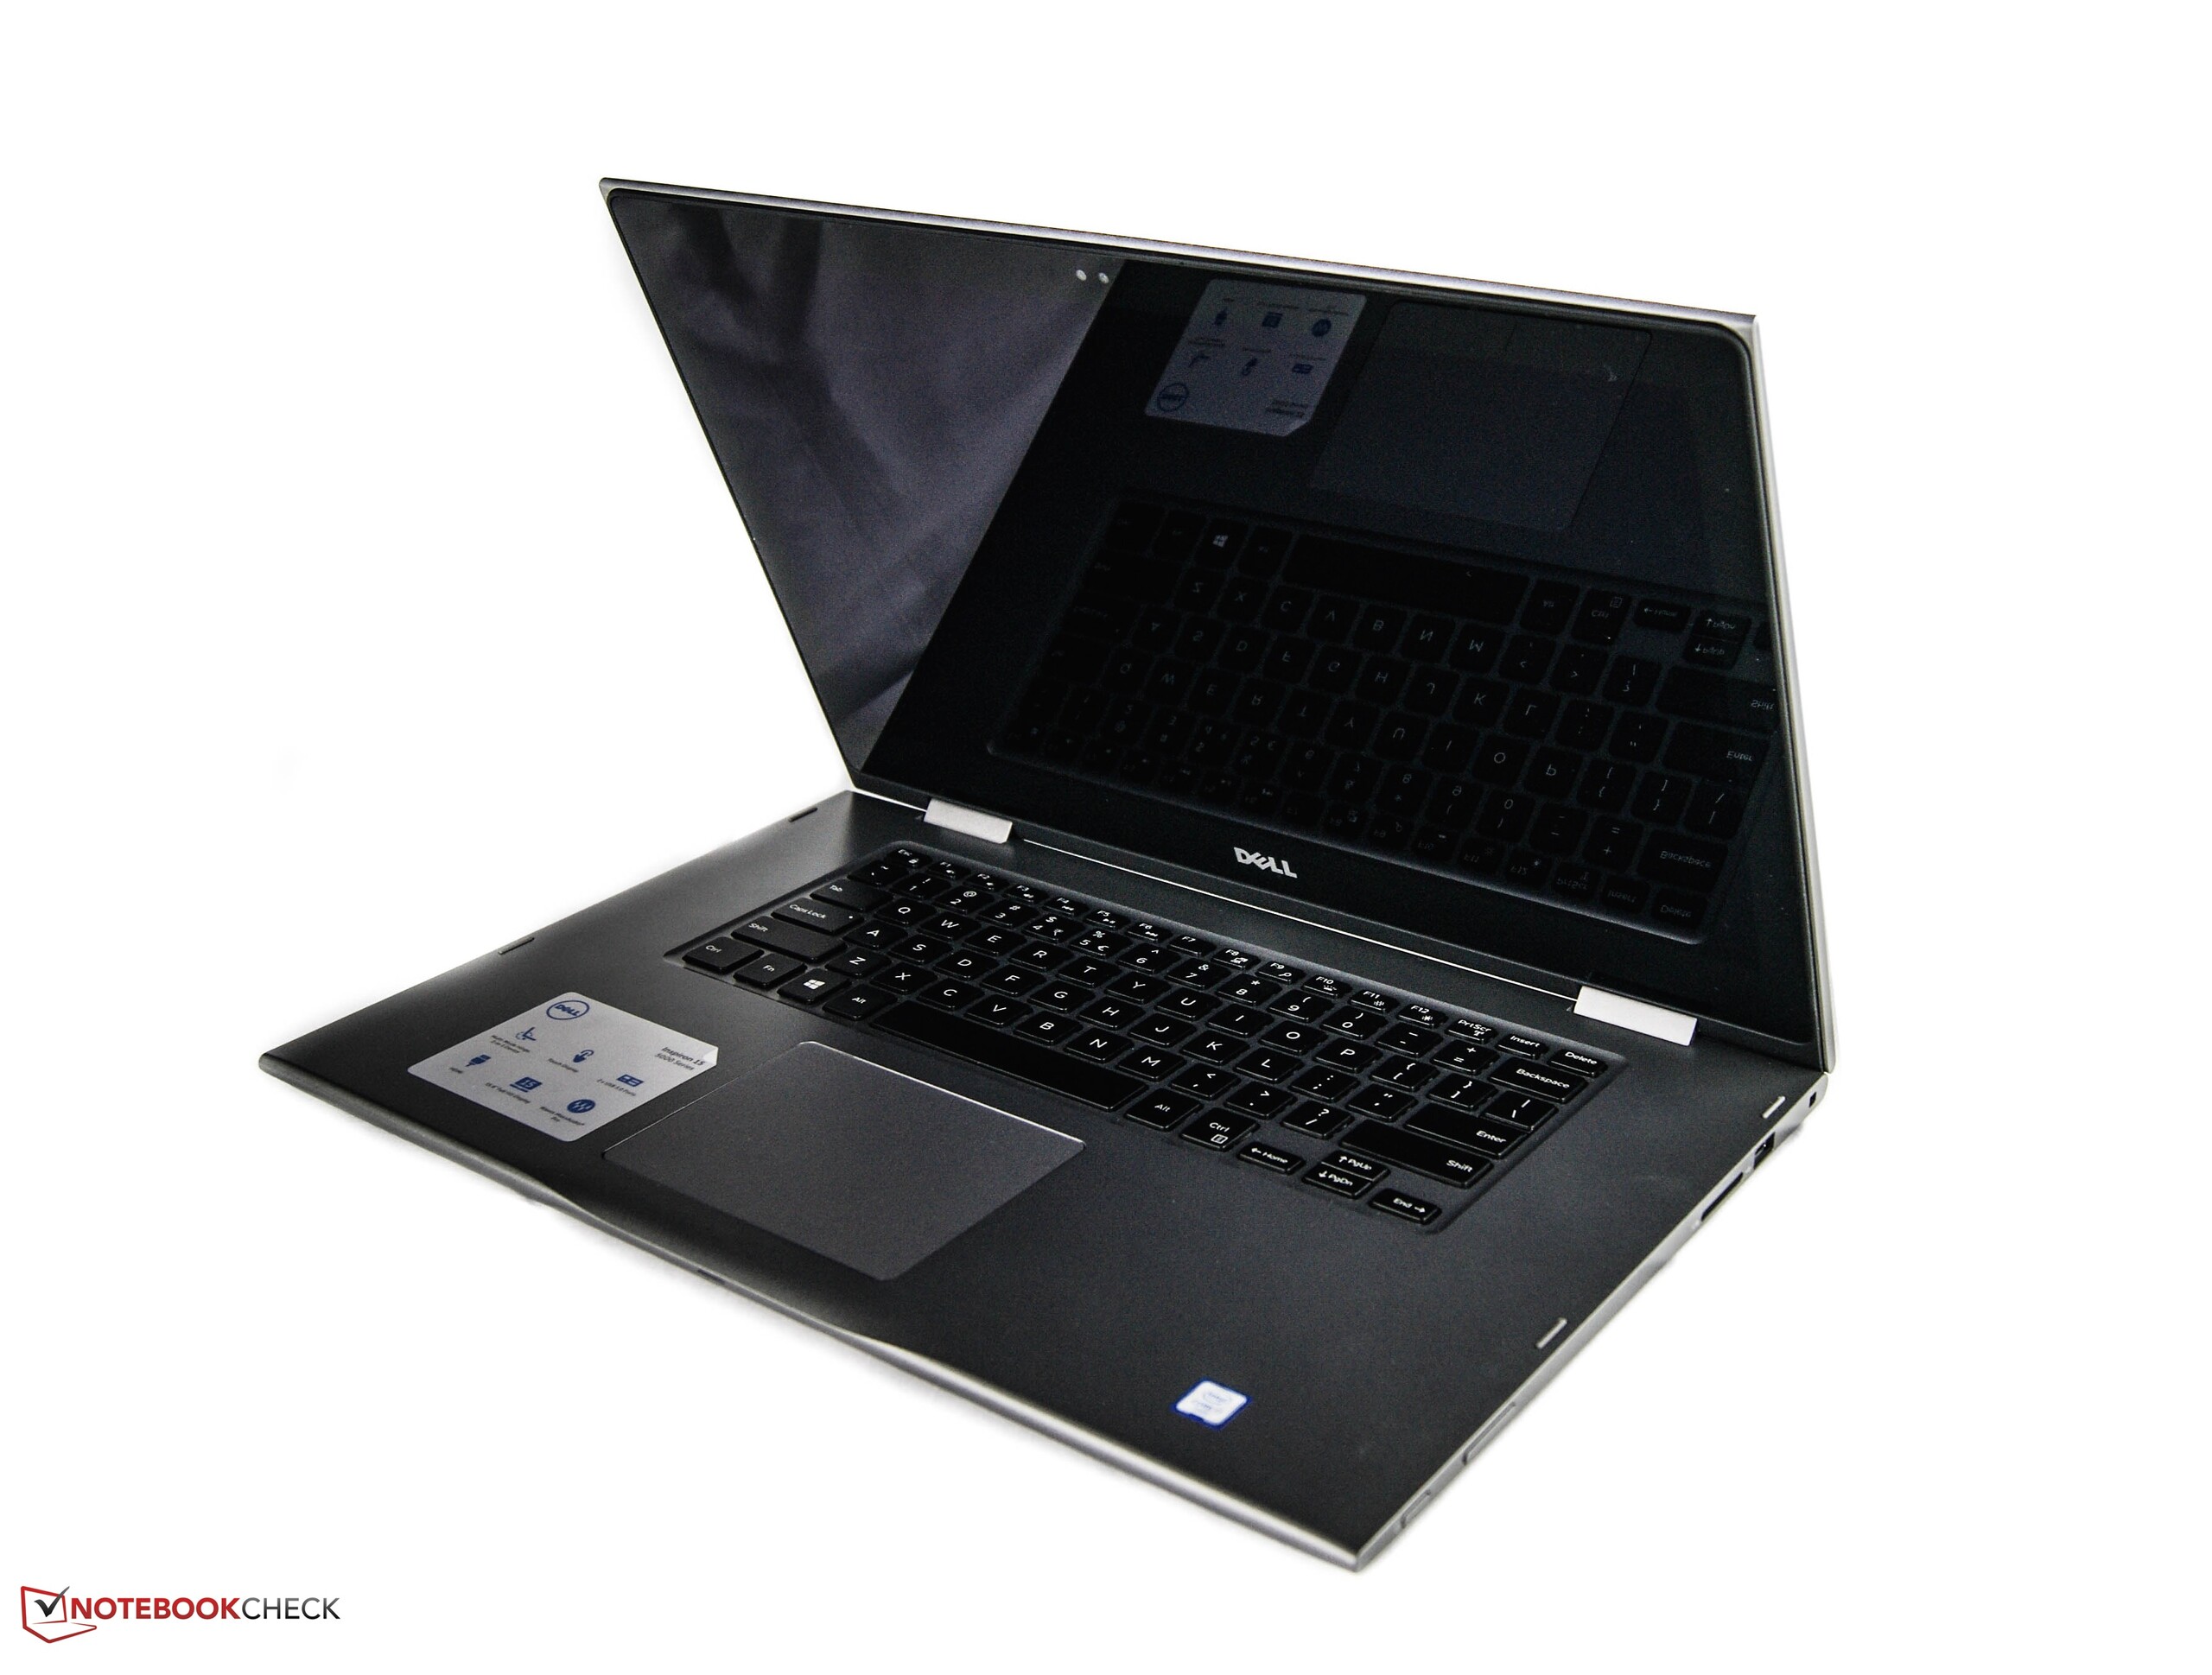
Breve Análise do Conversível Dell Inspiron 15 5568
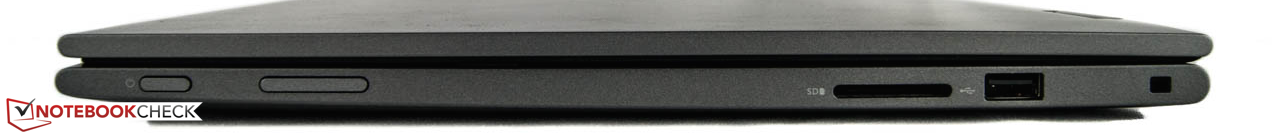


| SD Card Reader | |
| average JPG Copy Test (av. of 3 runs) | |
| Dell XPS 13 2016 9350 (FHD, i7-6560U) | |
| Lenovo Yoga 510-15ISK | |
| HP Envy 15-w103ng x360 | |
| Dell Inspiron 15 5568 | |
| Acer Aspire R14 R5-471T-79GQ | |
| Lenovo Ideapad 500-15ISK 80NT005WGE | |
| maximum AS SSD Seq Read Test (1GB) | |
| Dell XPS 13 2016 9350 (FHD, i7-6560U) | |
| HP Envy 15-w103ng x360 | |
| Lenovo Yoga 510-15ISK | |
| Dell Inspiron 15 5568 | |
| Lenovo Ideapad 500-15ISK 80NT005WGE | |
| Acer Aspire R14 R5-471T-79GQ | |
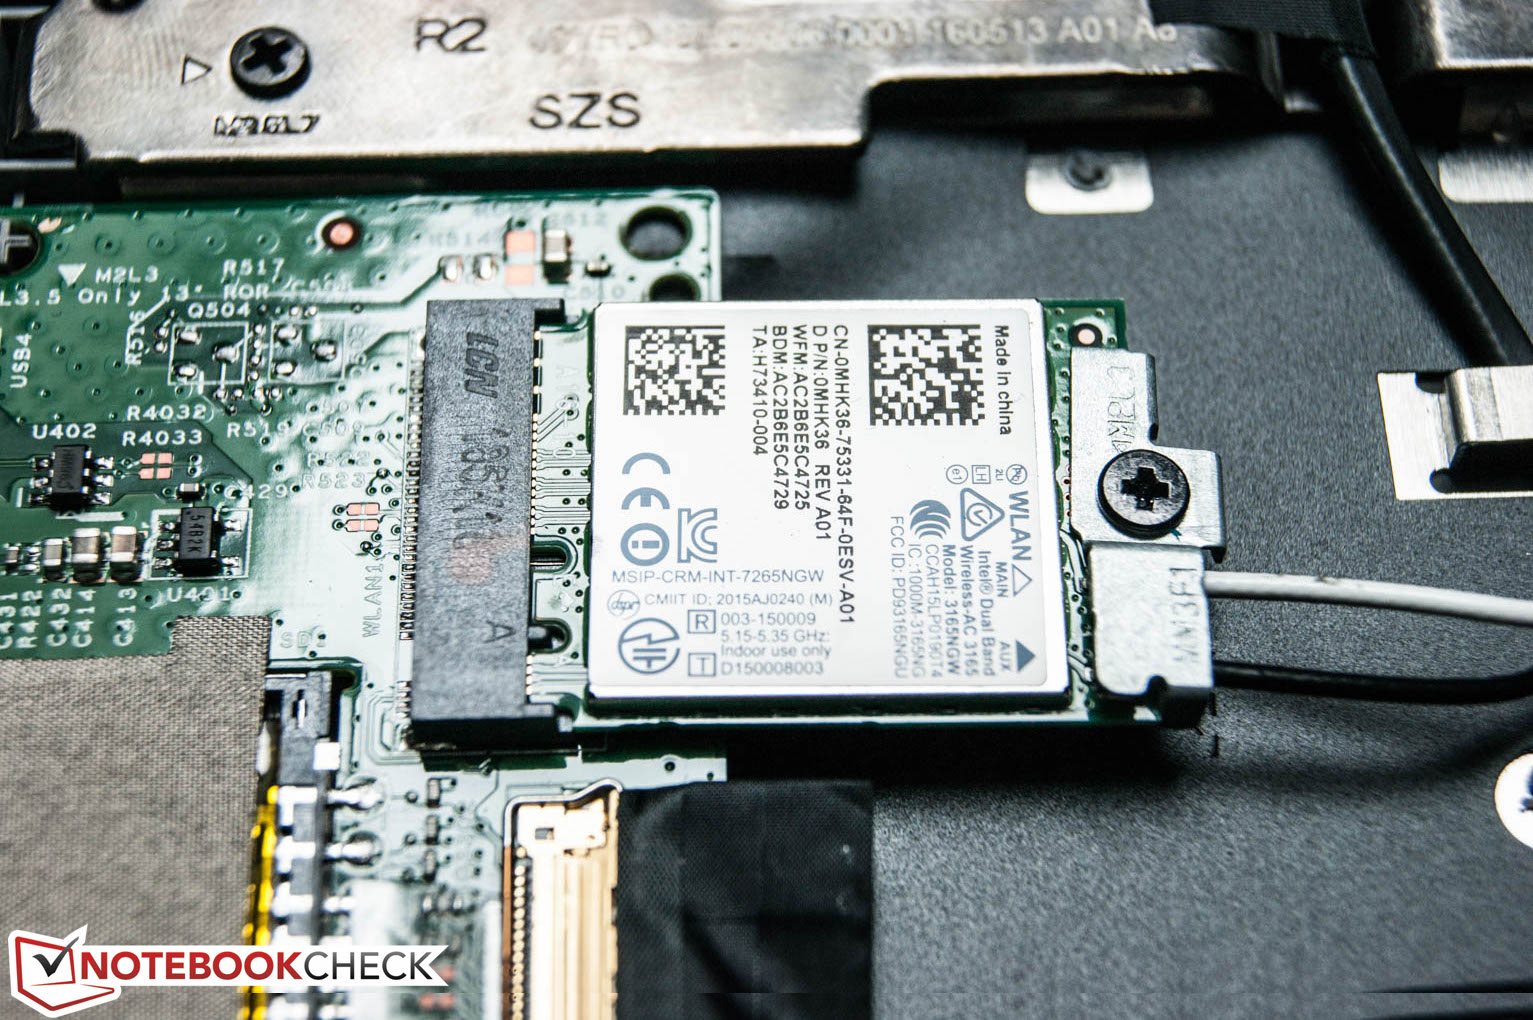
| Networking | |
| iperf Server (receive) TCP 1 m | |
| Dell Inspiron 15 5568 | |
| HP x2 210 G1 | |
| iperf Client (transmit) TCP 1 m | |
| Dell Inspiron 15 5568 | |
| HP x2 210 G1 | |
| |||||||||||||||||||||||||
iluminação: 85 %
iluminação com acumulador: 266 cd/m²
Contraste: 1023:1 (Preto: 0.26 cd/m²)
ΔE ColorChecker Calman: 4.98 | ∀{0.5-29.43 Ø4.71}
ΔE Greyscale Calman: 2.68 | ∀{0.09-98 Ø4.96}
57% sRGB (Argyll 1.6.3 3D)
36% AdobeRGB 1998 (Argyll 1.6.3 3D)
39.3% AdobeRGB 1998 (Argyll 3D)
57.1% sRGB (Argyll 3D)
38.04% Display P3 (Argyll 3D)
Gamma: 2.27
CCT: 6583 K
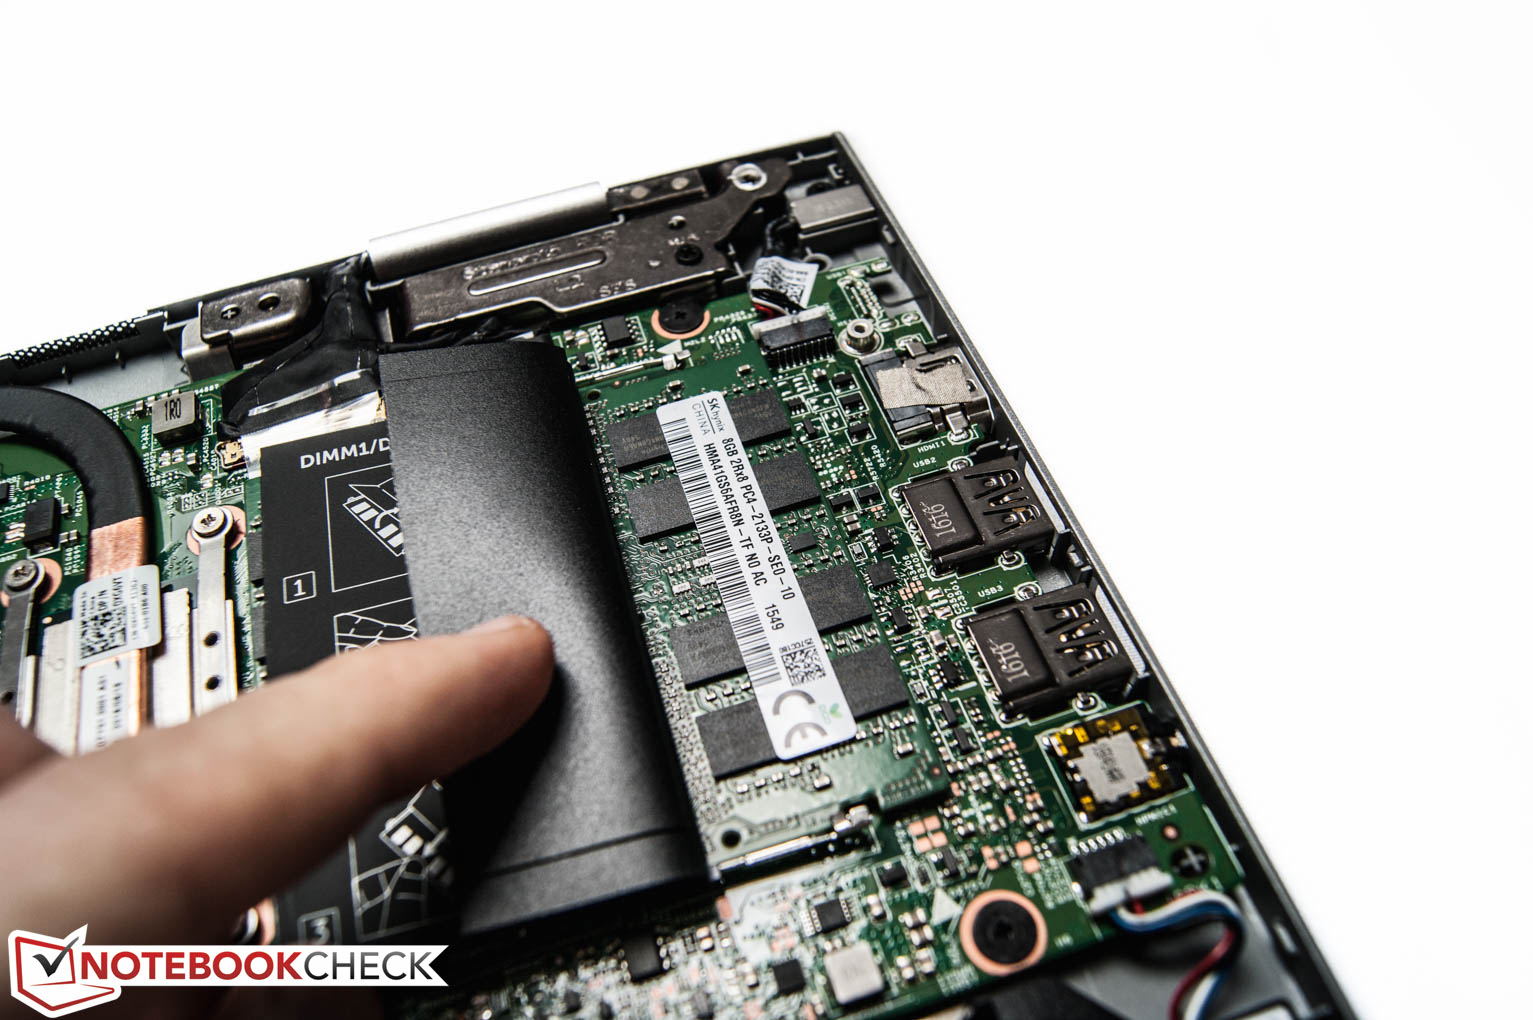
| Dell Inspiron 15 5568 HD Graphics 520, 6500U, Toshiba THNSNK256GCS8 | HP Spectre x360 15-ap012dx HD Graphics 520, 6200U, Sandisk X300 SD7SN6S-256G-1006 | HP Envy 15-w103ng x360 GeForce 930M, 6200U, Samsung SSD PM851 256 GB MZNTE256HMHP | Lenovo Yoga 510-15ISK Radeon R7 M460, 6200U, Liteonit CV3-DE256 | Acer Aspire R14 R5-471T-79GQ HD Graphics 520, 6500U | |
|---|---|---|---|---|---|
| Display | 61% | 5% | 12% | -3% | |
| Display P3 Coverage (%) | 38.04 | 62.8 65% | 39.97 5% | 42.58 12% | 36.92 -3% |
| sRGB Coverage (%) | 57.1 | 88.2 54% | 59.8 5% | 63.9 12% | 55.4 -3% |
| AdobeRGB 1998 Coverage (%) | 39.3 | 63.9 63% | 41.32 5% | 43.99 12% | 38.15 -3% |
| Response Times | -3% | -8% | -22% | -63% | |
| Response Time Grey 50% / Grey 80% * (ms) | 42 ? | 32.8 ? 22% | 37 ? 12% | 43.2 ? -3% | 80 ? -90% |
| Response Time Black / White * (ms) | 22 ? | 28 ? -27% | 28 ? -27% | 30.8 ? -40% | 30 ? -36% |
| PWM Frequency (Hz) | |||||
| Screen | 4% | -30% | 4% | -7% | |
| Brightness middle (cd/m²) | 266 | 298 12% | 208 -22% | 254 -5% | 215 -19% |
| Brightness (cd/m²) | 249 | 295 18% | 205 -18% | 230 -8% | 203 -18% |
| Brightness Distribution (%) | 85 | 88 4% | 80 -6% | 86 1% | 85 0% |
| Black Level * (cd/m²) | 0.26 | 0.57 -119% | 0.26 -0% | 0.26 -0% | 0.25 4% |
| Contrast (:1) | 1023 | 523 -49% | 800 -22% | 977 -4% | 860 -16% |
| Colorchecker dE 2000 * | 4.98 | 4.43 11% | 6.97 -40% | 4.23 15% | 5.04 -1% |
| Colorchecker dE 2000 max. * | 11.82 | 6.62 44% | 9.5 20% | 10.6 10% | |
| Greyscale dE 2000 * | 2.68 | 2.45 9% | 7.37 -175% | 2.87 -7% | 3.3 -23% |
| Gamma | 2.27 97% | 2.45 90% | 2.34 94% | 2.35 94% | 2.35 94% |
| CCT | 6583 99% | 6326 103% | 6823 95% | 5965 109% | 6370 102% |
| Color Space (Percent of AdobeRGB 1998) (%) | 36 | 57.2 59% | 38 6% | 40.35 12% | 35 -3% |
| Color Space (Percent of sRGB) (%) | 57 | 87.8 54% | 59 4% | 63.48 11% | 55 -4% |
| Média Total (Programa/Configurações) | 21% /
15% | -11% /
-20% | -2% /
2% | -24% /
-14% |
* ... menor é melhor
Exibir tempos de resposta
| ↔ Tempo de resposta preto para branco | ||
|---|---|---|
| 22 ms ... ascensão ↗ e queda ↘ combinadas | ↗ 6 ms ascensão | 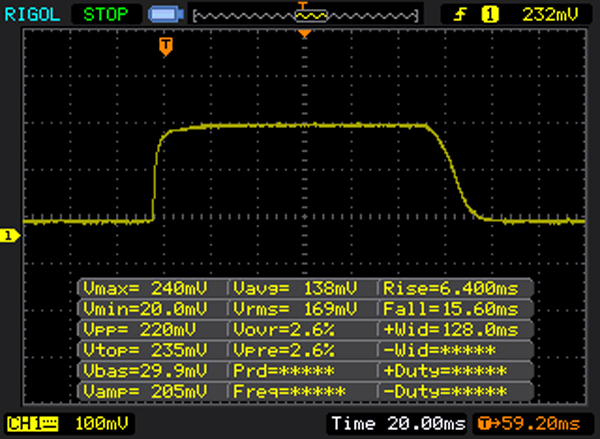 |
| ↘ 16 ms queda | ||
| A tela mostra boas taxas de resposta em nossos testes, mas pode ser muito lenta para jogadores competitivos. Em comparação, todos os dispositivos testados variam de 0.1 (mínimo) a 240 (máximo) ms. » 49 % de todos os dispositivos são melhores. Isso significa que o tempo de resposta medido é pior que a média de todos os dispositivos testados (19.8 ms). | ||
| ↔ Tempo de resposta 50% cinza a 80% cinza | ||
| 42 ms ... ascensão ↗ e queda ↘ combinadas | ↗ 19 ms ascensão | 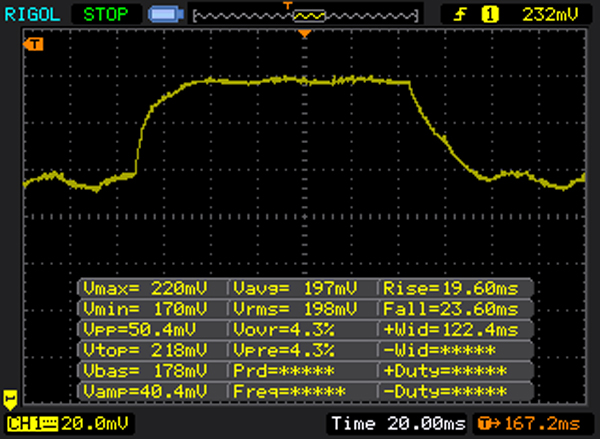 |
| ↘ 23 ms queda | ||
| A tela mostra taxas de resposta lentas em nossos testes e será insatisfatória para os jogadores. Em comparação, todos os dispositivos testados variam de 0.165 (mínimo) a 636 (máximo) ms. » 67 % de todos os dispositivos são melhores. Isso significa que o tempo de resposta medido é pior que a média de todos os dispositivos testados (30.9 ms). | ||
Cintilação da tela / PWM (modulação por largura de pulso)
| Tela tremeluzindo / PWM não detectado | ||
[pwm_comparison] Em comparação: 52 % de todos os dispositivos testados não usam PWM para escurecer a tela. Se PWM foi detectado, uma média de 7748 (mínimo: 5 - máximo: 343500) Hz foi medida. | ||
| Cinebench R15 | |
| CPU Multi 64Bit | |
| Lenovo Ideapad 500-15ISK 80NT005WGE | |
| Acer Aspire R14 R5-471T-79GQ | |
| HP Spectre x360 15-ap012dx | |
| Dell Inspiron 15 5568 | |
| HP Envy 15-w103ng x360 | |
| Lenovo Yoga 510-15ISK | |
| CPU Single 64Bit | |
| Lenovo Ideapad 500-15ISK 80NT005WGE | |
| Acer Aspire R14 R5-471T-79GQ | |
| Dell Inspiron 15 5568 | |
| HP Spectre x360 15-ap012dx | |
| HP Envy 15-w103ng x360 | |
| Lenovo Yoga 510-15ISK | |
| PCMark 8 - Home Score Accelerated v2 | |
| Lenovo Yoga 510-15ISK | |
| Dell Inspiron 15 5568 | |
| Lenovo Ideapad 500-15ISK 80NT005WGE | |
| Acer Aspire R14 R5-471T-79GQ | |
| HP Envy 15-w103ng x360 | |
| HP Spectre x360 15-ap012dx | |
| PCMark 8 Home Score Accelerated v2 | 3607 pontos | |
| PCMark 8 Work Score Accelerated v2 | 4433 pontos | |
Ajuda | ||
| Dell Inspiron 15 5568 HD Graphics 520, 6500U, Toshiba THNSNK256GCS8 | HP Spectre x360 15-ap012dx HD Graphics 520, 6200U, Sandisk X300 SD7SN6S-256G-1006 | HP Envy 15-w103ng x360 GeForce 930M, 6200U, Samsung SSD PM851 256 GB MZNTE256HMHP | Acer Aspire R14 R5-471T-79GQ HD Graphics 520, 6500U | Lenovo Yoga 510-15ISK Radeon R7 M460, 6200U, Liteonit CV3-DE256 | |
|---|---|---|---|---|---|
| CrystalDiskMark 3.0 | 14% | 13% | -9% | 18% | |
| Read Seq (MB/s) | 458.6 | 475.6 4% | 515 12% | 503 10% | 487 6% |
| Write Seq (MB/s) | 270 | 425 57% | 240.7 -11% | 161.6 -40% | 450.7 67% |
| Read 512 (MB/s) | 397.4 | 258.4 -35% | 391.3 -2% | 319.7 -20% | 384.5 -3% |
| Write 512 (MB/s) | 242 | 318.9 32% | 240 -1% | 161.5 -33% | 356.3 47% |
| Read 4k (MB/s) | 19.88 | 35.48 78% | 27.64 39% | 26.04 31% | 27.05 36% |
| Write 4k (MB/s) | 86.7 | 93 7% | 95.2 10% | 81.6 -6% | 63.7 -27% |
| Read 4k QD32 (MB/s) | 275.3 | 281.2 2% | 367.9 34% | 278.5 1% | 281.5 2% |
| Write 4k QD32 (MB/s) | 197.6 | 138.7 -30% | 239 21% | 161.6 -18% | 232 17% |

| 3DMark 11 - 1280x720 Performance | |
| Lenovo Ideapad 500-15ISK 80NT005WGE | |
| HP Envy 15-w103ng x360 | |
| Lenovo Yoga 510-15ISK | |
| Dell Inspiron 15 5568 | |
| Acer Aspire R14 R5-471T-79GQ | |
| HP Spectre x360 15-ap012dx | |
| 3DMark 11 Performance | 1672 pontos | |
| 3DMark Cloud Gate Standard Score | 6323 pontos | |
Ajuda | ||
| Tomb Raider | |
| 1366x768 Normal Preset AA:FX AF:4x | |
| HP Envy 15-w103ng x360 | |
| Dell Inspiron 15 5568 | |
| Lenovo Ideapad 500-15ISK 80NT005WGE | |
| Acer Aspire R14 R5-471T-79GQ | |
| Lenovo Yoga 510-15ISK | |
| Asus ASUSPRO P2530UA-DM0046E | |
| Acer TravelMate P648-M-757N | |
| Lenovo ThinkPad X260-20F6007RGE | |
| 1366x768 High Preset AA:FX AF:8x | |
| HP Envy 15-w103ng x360 | |
| Lenovo Ideapad 500-15ISK 80NT005WGE | |
| Lenovo Yoga 510-15ISK | |
| Dell Inspiron 15 5568 | |
| Asus ASUSPRO P2530UA-DM0046E | |
| Acer Aspire R14 R5-471T-79GQ | |
| Acer TravelMate P648-M-757N | |
| Lenovo ThinkPad X260-20F6007RGE | |
| baixo | média | alto | ultra | |
|---|---|---|---|---|
| Tomb Raider (2013) | 84.1 | 42.7 | 27.9 | 12.6 |
| BioShock Infinite (2013) | 54.4 | 31.5 | 27.7 | 8.2 |
| Rise of the Tomb Raider (2016) | 17.6 | 10.8 | 6.2 |
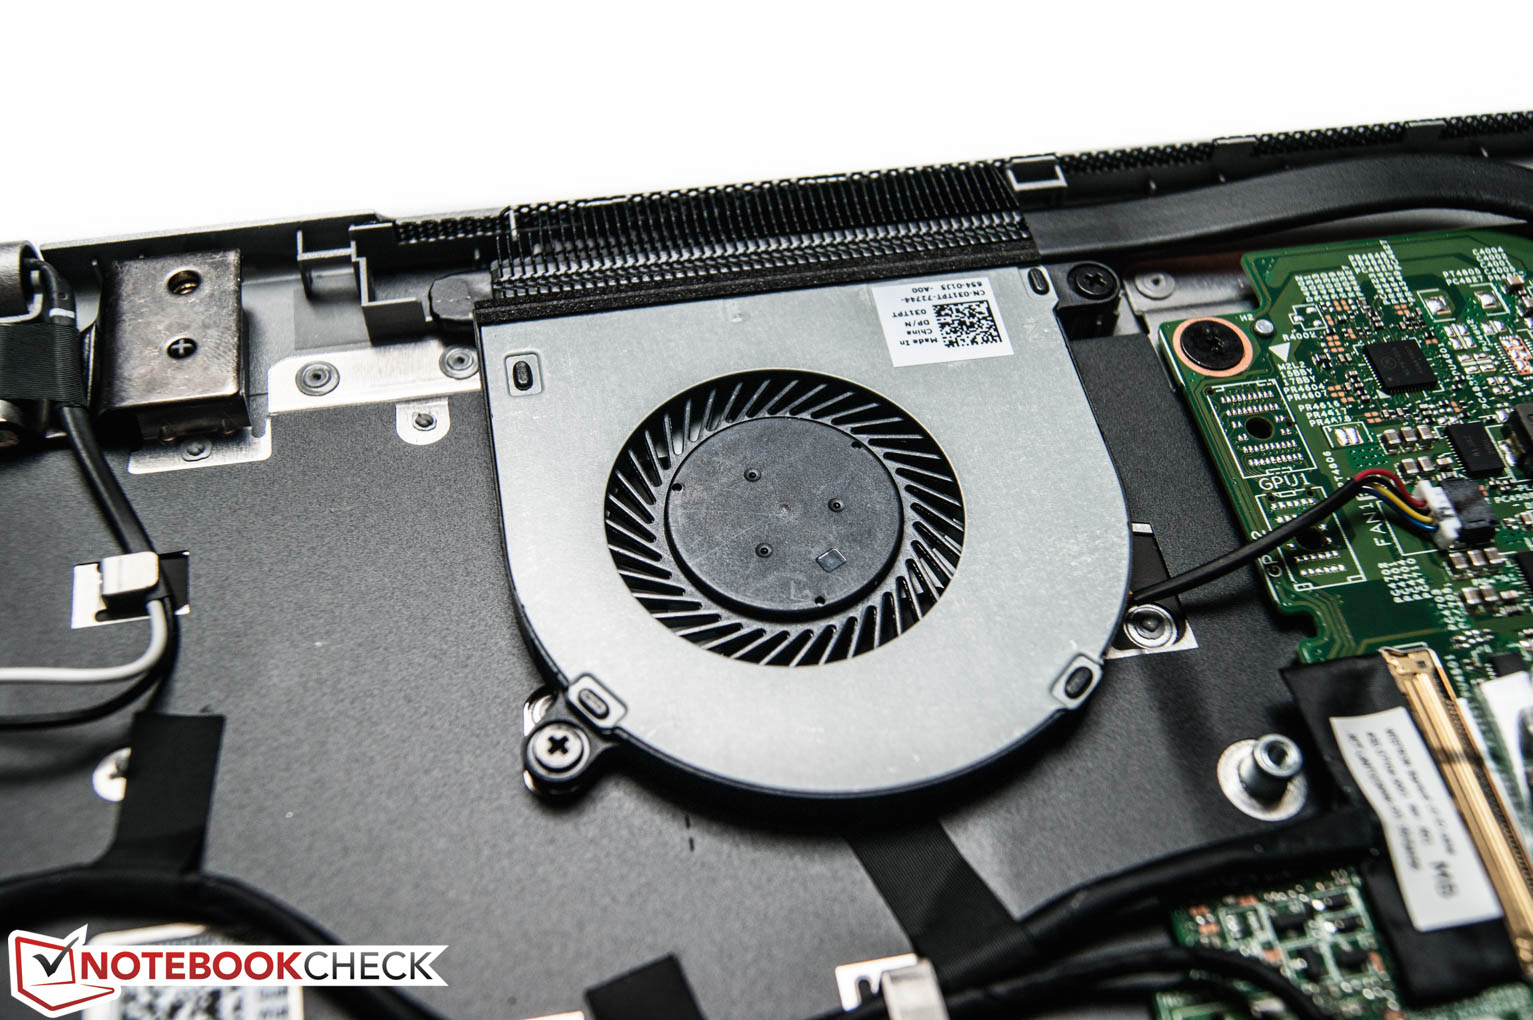
Barulho
| Ocioso |
| 32.8 / 32.8 / 33.8 dB |
| Carga |
| 36.3 / 36.3 dB |
 | ||
30 dB silencioso 40 dB(A) audível 50 dB(A) ruidosamente alto |
||
min: | ||
(+) A temperatura máxima no lado superior é 37.2 °C / 99 F, em comparação com a média de 35.4 °C / 96 F , variando de 19.6 a 60 °C para a classe Convertible.
(-) A parte inferior aquece até um máximo de 50.6 °C / 123 F, em comparação com a média de 36.9 °C / 98 F
(+) Em uso inativo, a temperatura média para o lado superior é 26.2 °C / 79 F, em comparação com a média do dispositivo de 30.3 °C / ### class_avg_f### F.
(+) Os apoios para as mãos e o touchpad são mais frios que a temperatura da pele, com um máximo de 25.2 °C / 77.4 F e, portanto, são frios ao toque.
(+) A temperatura média da área do apoio para as mãos de dispositivos semelhantes foi 28 °C / 82.4 F (+2.8 °C / 5 F).
| desligado | |
| Ocioso | |
| Carga |
|
Key:
min: | |
| Dell Inspiron 15 5568 HD Graphics 520, 6500U, Toshiba THNSNK256GCS8 | HP Spectre x360 15-ap012dx HD Graphics 520, 6200U, Sandisk X300 SD7SN6S-256G-1006 | HP Envy 15-w103ng x360 GeForce 930M, 6200U, Samsung SSD PM851 256 GB MZNTE256HMHP | Lenovo Yoga 510-15ISK Radeon R7 M460, 6200U, Liteonit CV3-DE256 | Acer Aspire R14 R5-471T-79GQ HD Graphics 520, 6500U | |
|---|---|---|---|---|---|
| Power Consumption | -45% | -13% | -20% | 4% | |
| Idle Minimum * (Watt) | 4.34 | 6.5 -50% | 4.15 4% | 4 8% | 4 8% |
| Idle Average * (Watt) | 7.5 | 13.3 -77% | 8.2 -9% | 7.5 -0% | 6.6 12% |
| Idle Maximum * (Watt) | 8.4 | 15.1 -80% | 8.2 2% | 8.1 4% | 8.6 -2% |
| Load Average * (Watt) | 30.4 | 30.8 -1% | 34.6 -14% | 40.8 -34% | 30.5 -0% |
| Load Maximum * (Watt) | 32.5 | 38.5 -18% | 48 -48% | 57.3 -76% | 32.2 1% |
* ... menor é melhor
| Dell Inspiron 15 5568 HD Graphics 520, 6500U, Toshiba THNSNK256GCS8 | HP Spectre x360 15-ap012dx HD Graphics 520, 6200U, Sandisk X300 SD7SN6S-256G-1006 | HP Envy 15-w103ng x360 GeForce 930M, 6200U, Samsung SSD PM851 256 GB MZNTE256HMHP | Acer Aspire R14 R5-471T-79GQ HD Graphics 520, 6500U | Lenovo Yoga 510-15ISK Radeon R7 M460, 6200U, Liteonit CV3-DE256 | |
|---|---|---|---|---|---|
| Duração da bateria | 40% | 32% | 50% | 23% | |
| Reader / Idle (h) | 7.5 | 11.8 57% | 12.2 63% | ||
| H.264 (h) | 5 | 5.6 12% | |||
| WiFi v1.3 (h) | 5 | 7.2 44% | 6.6 32% | 7.5 50% | 5.6 12% |
| Load (h) | 1.6 | 1.9 19% | 1.7 6% |
Pro
Contra
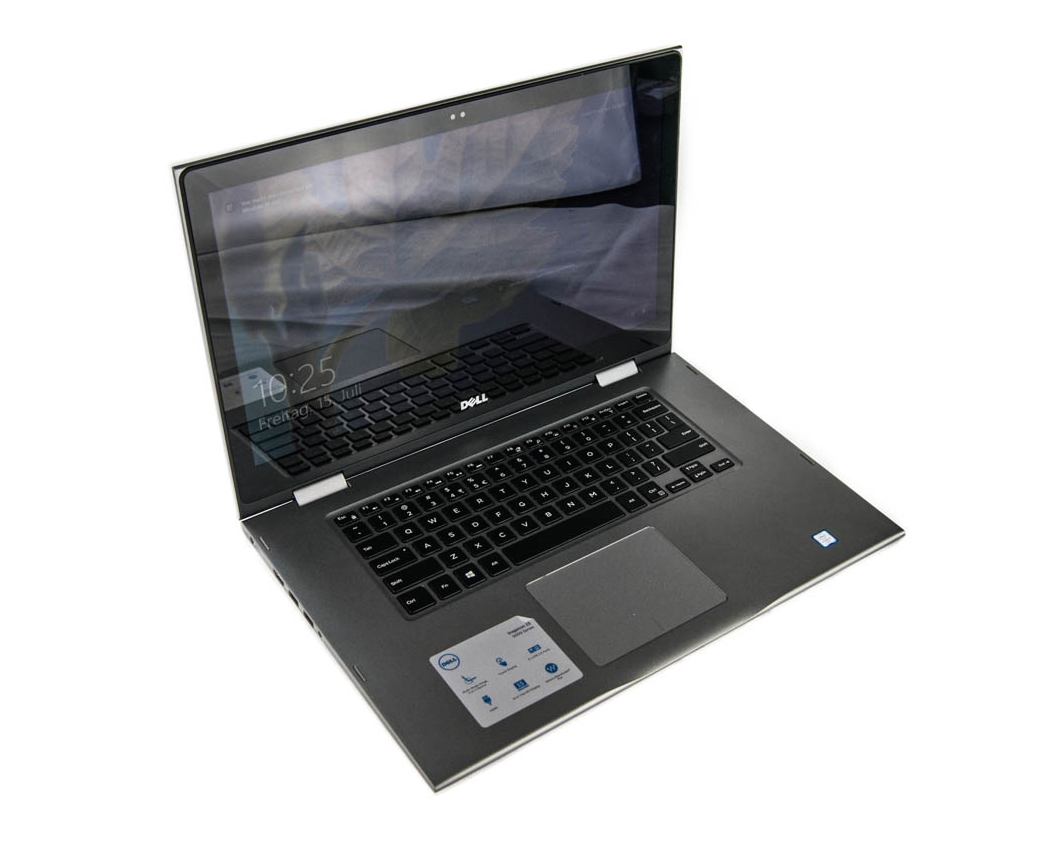
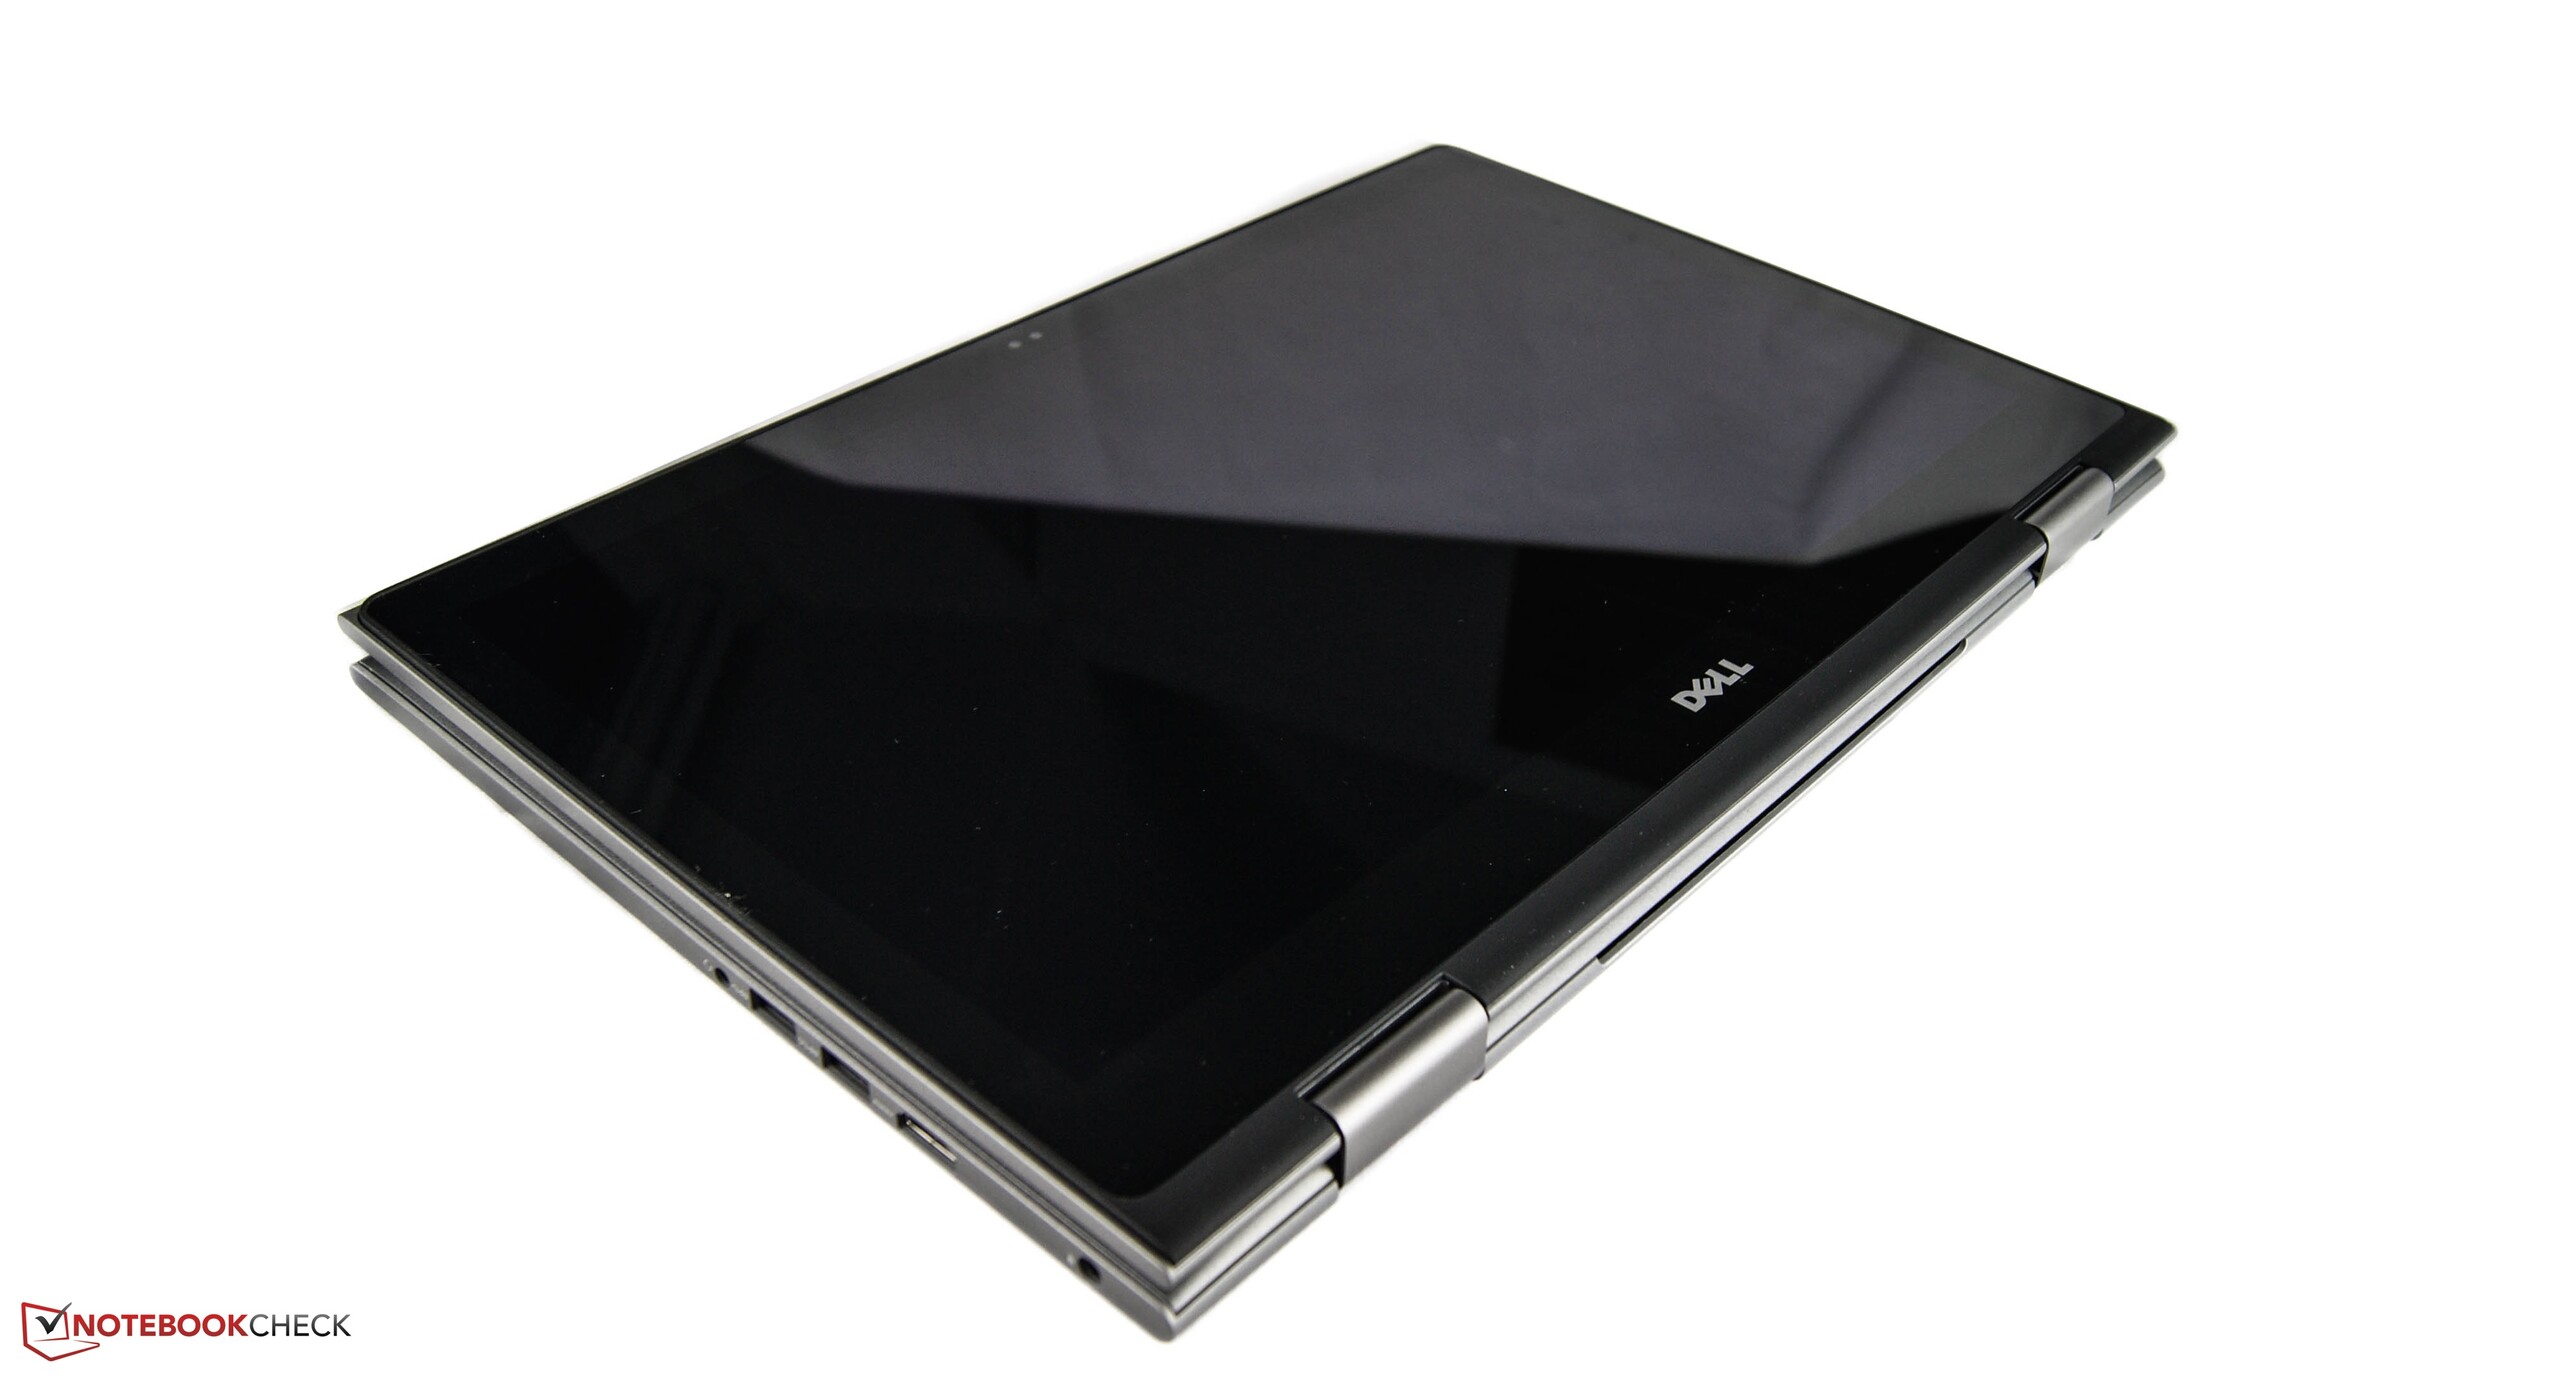
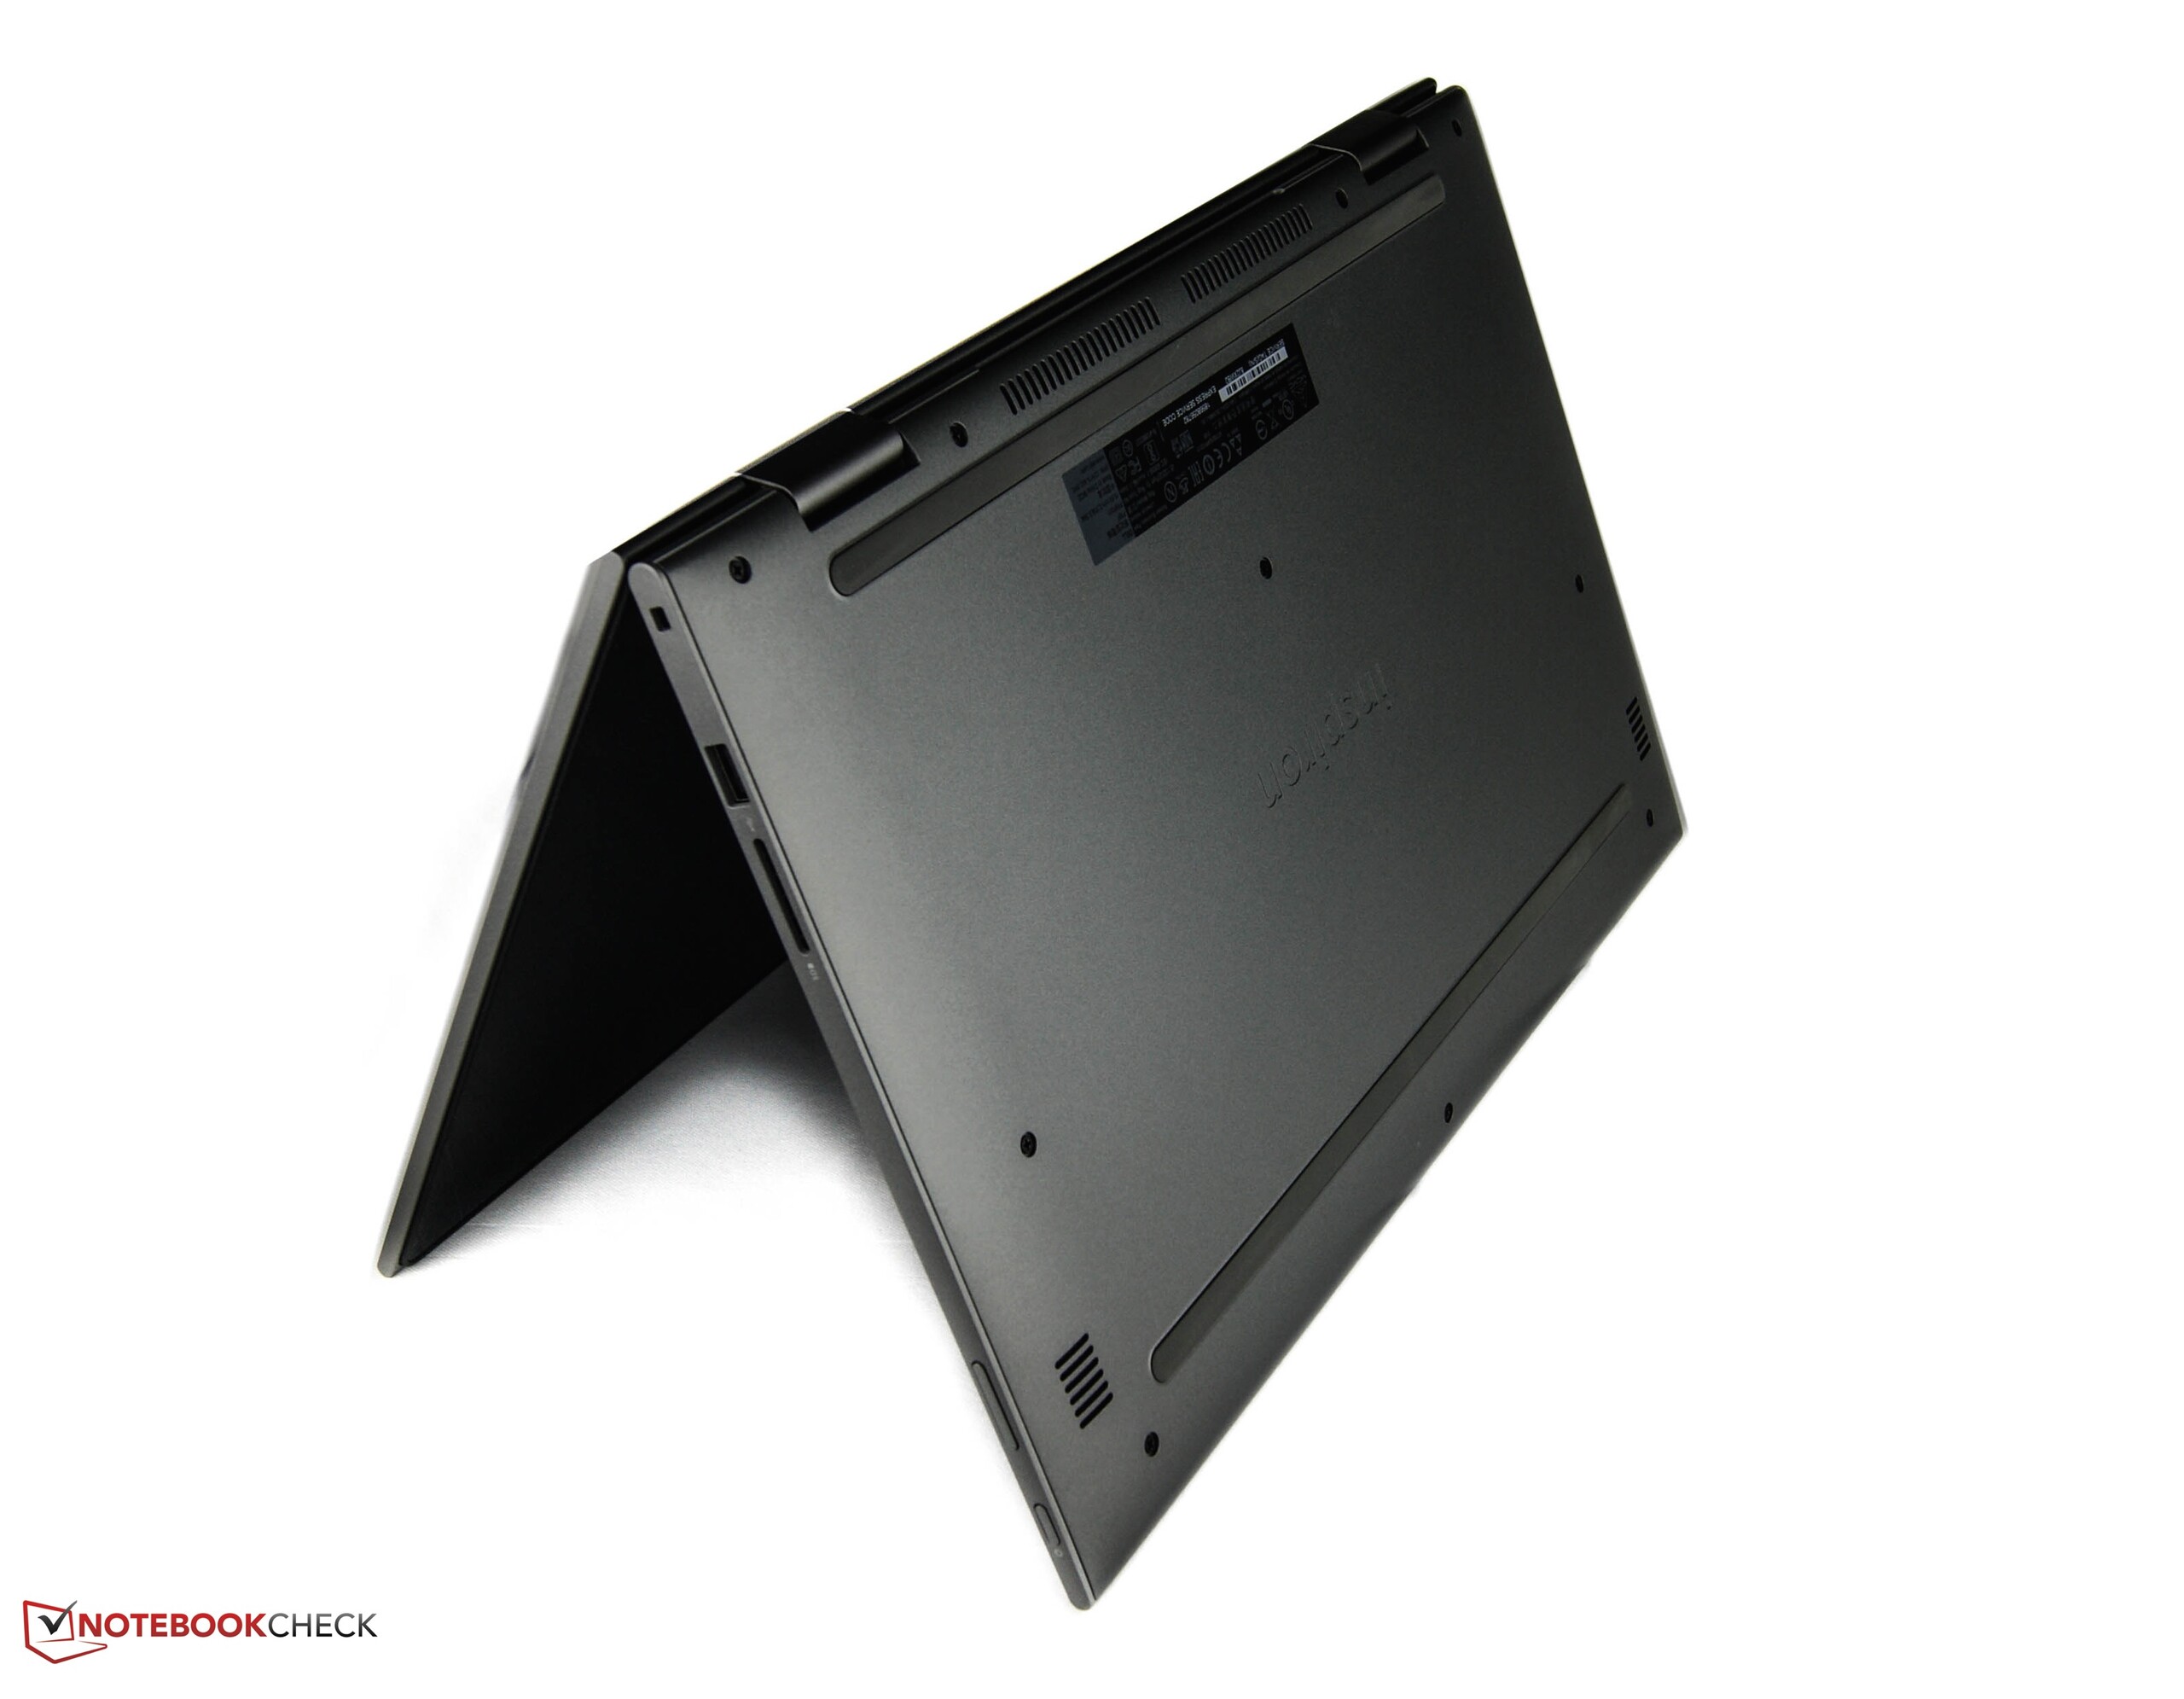
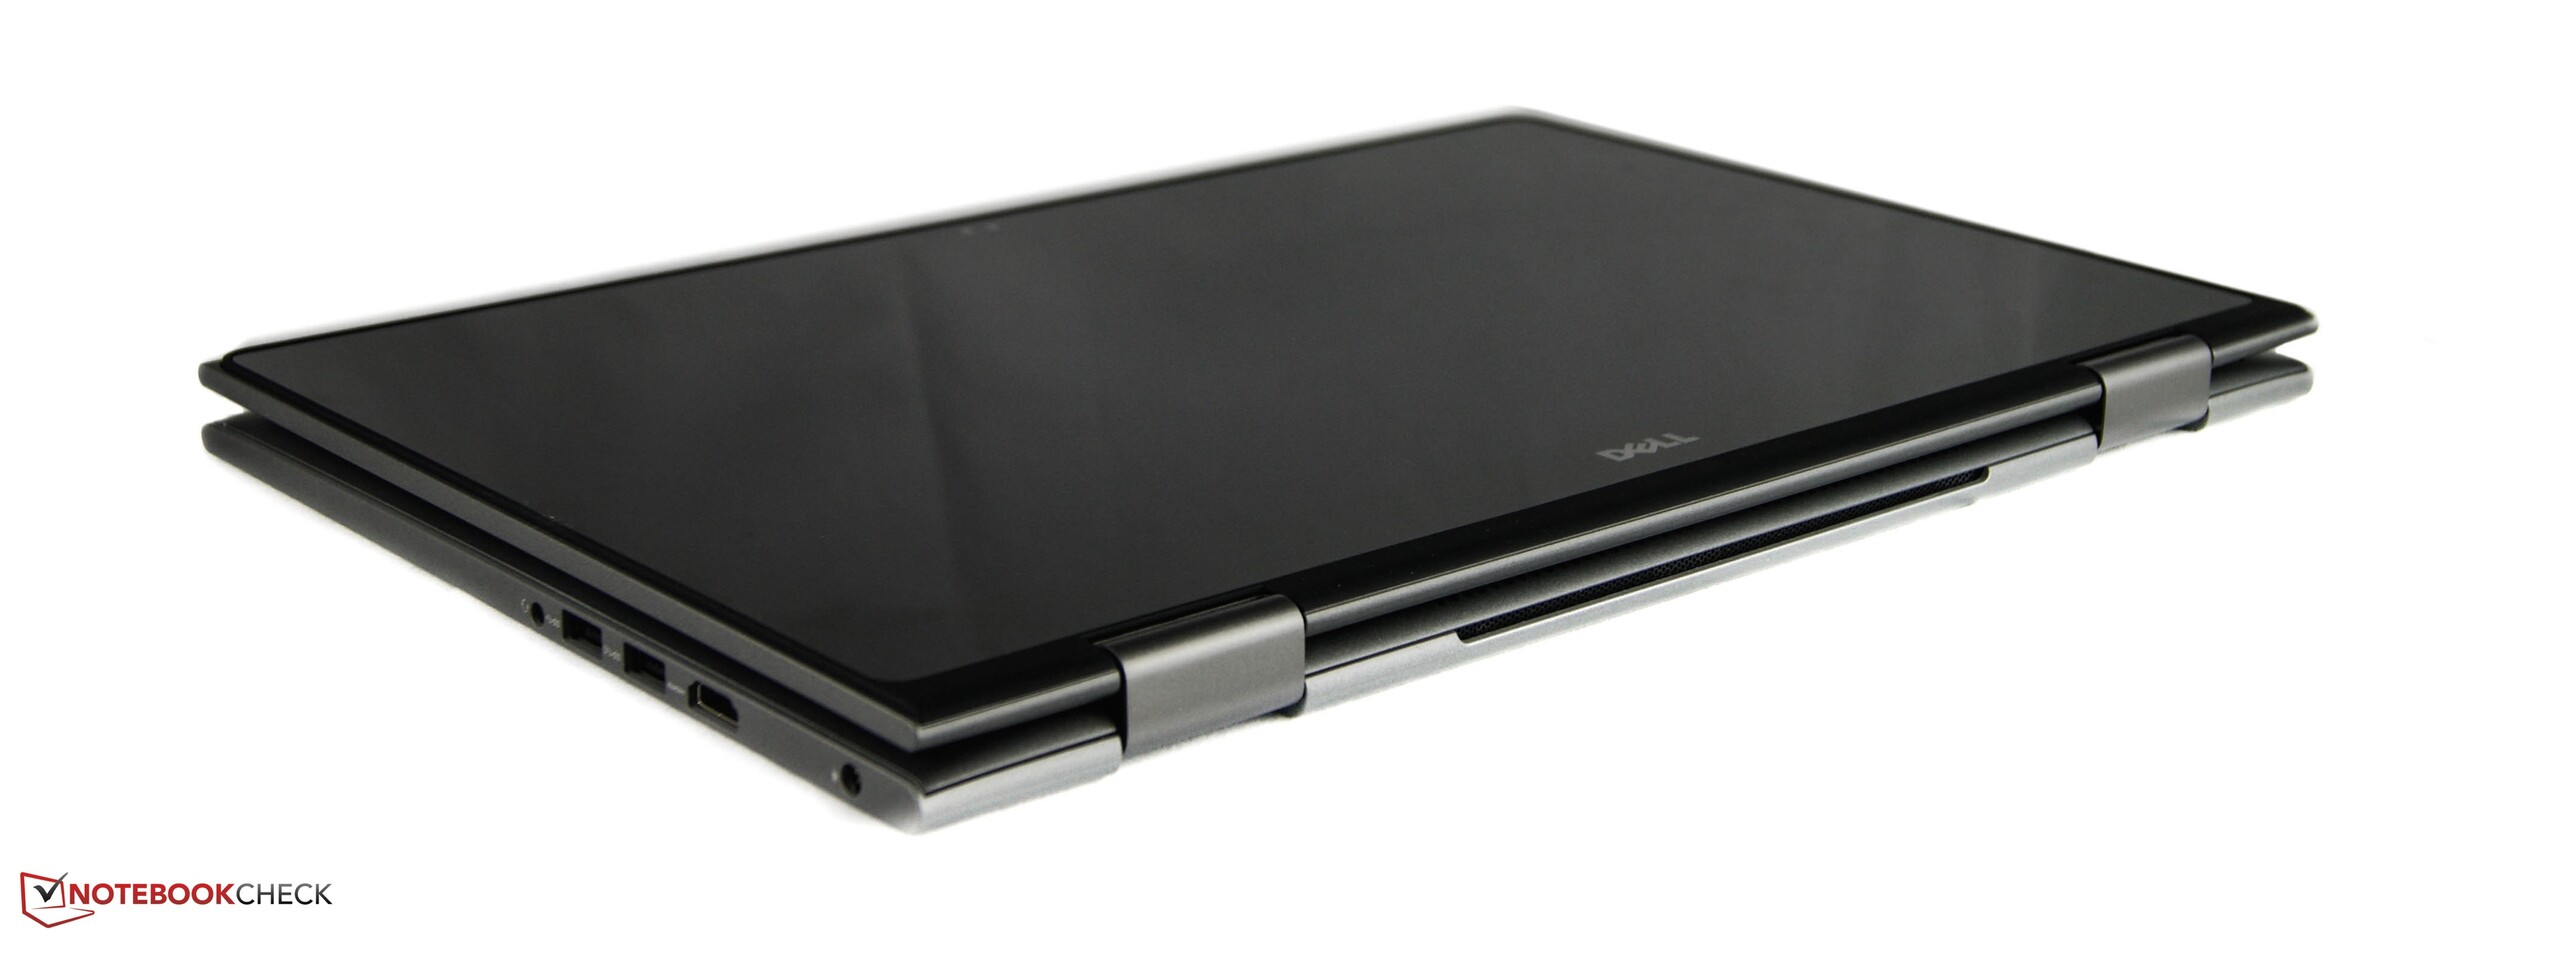
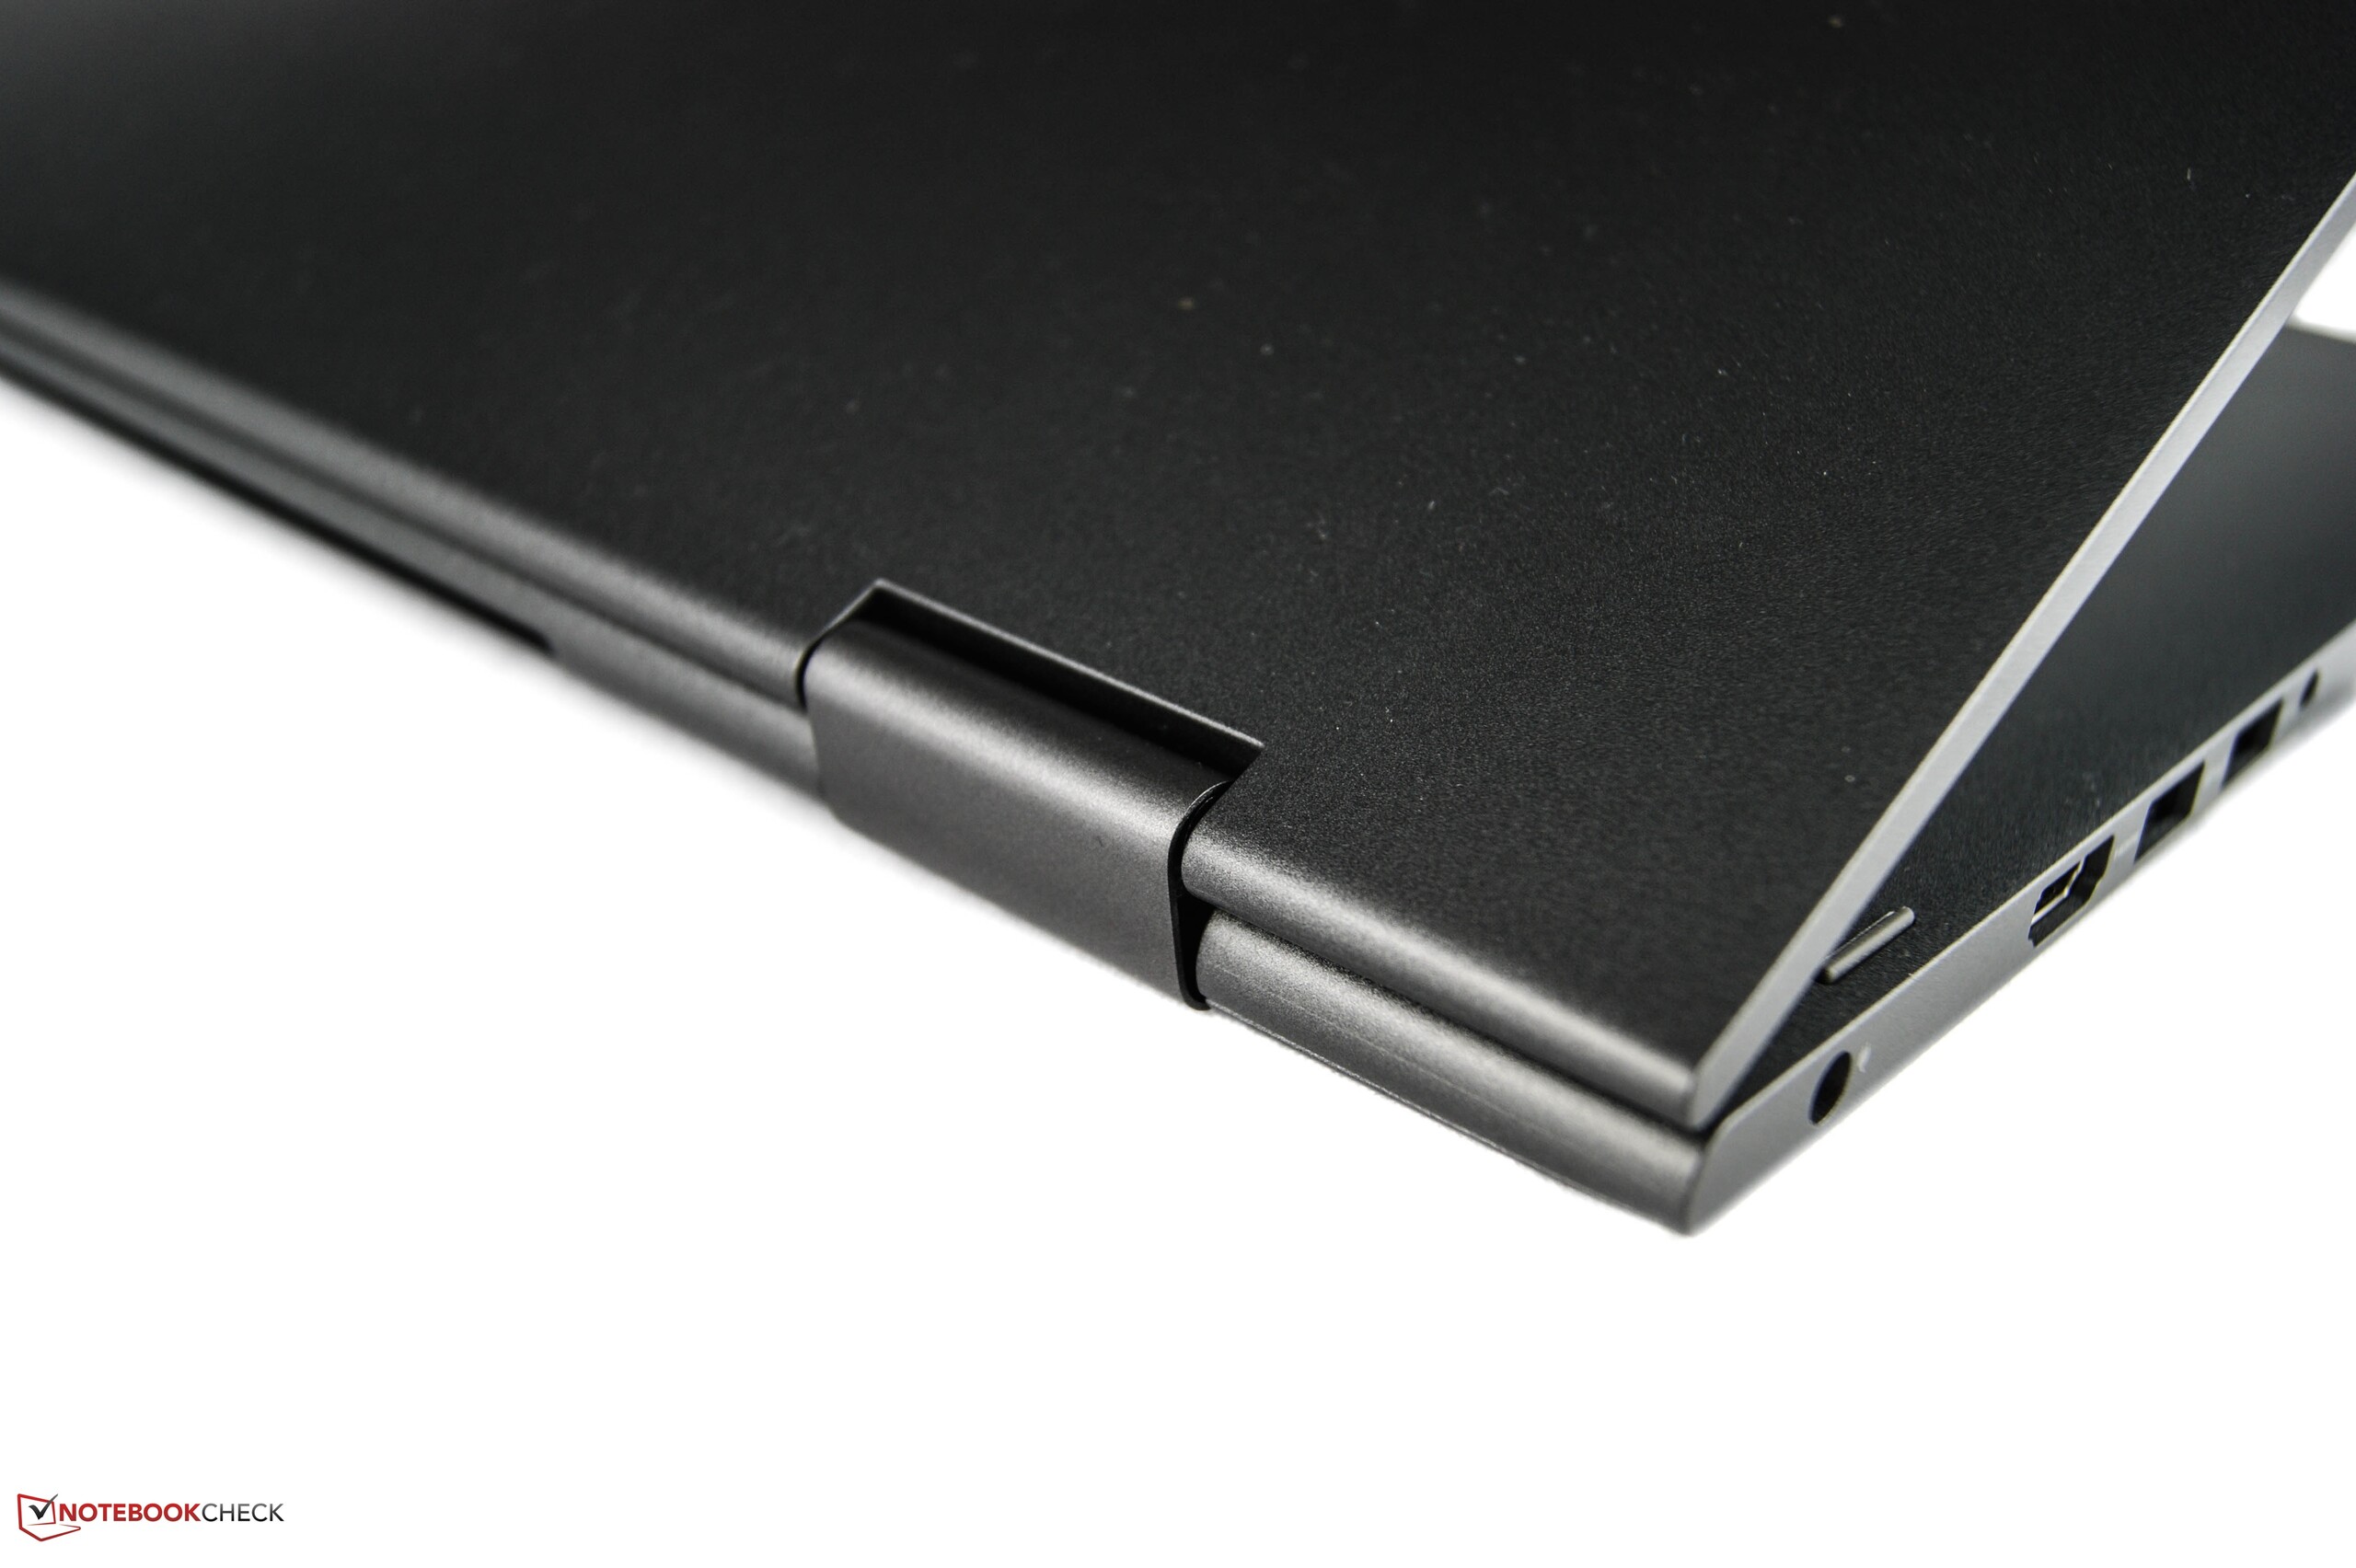
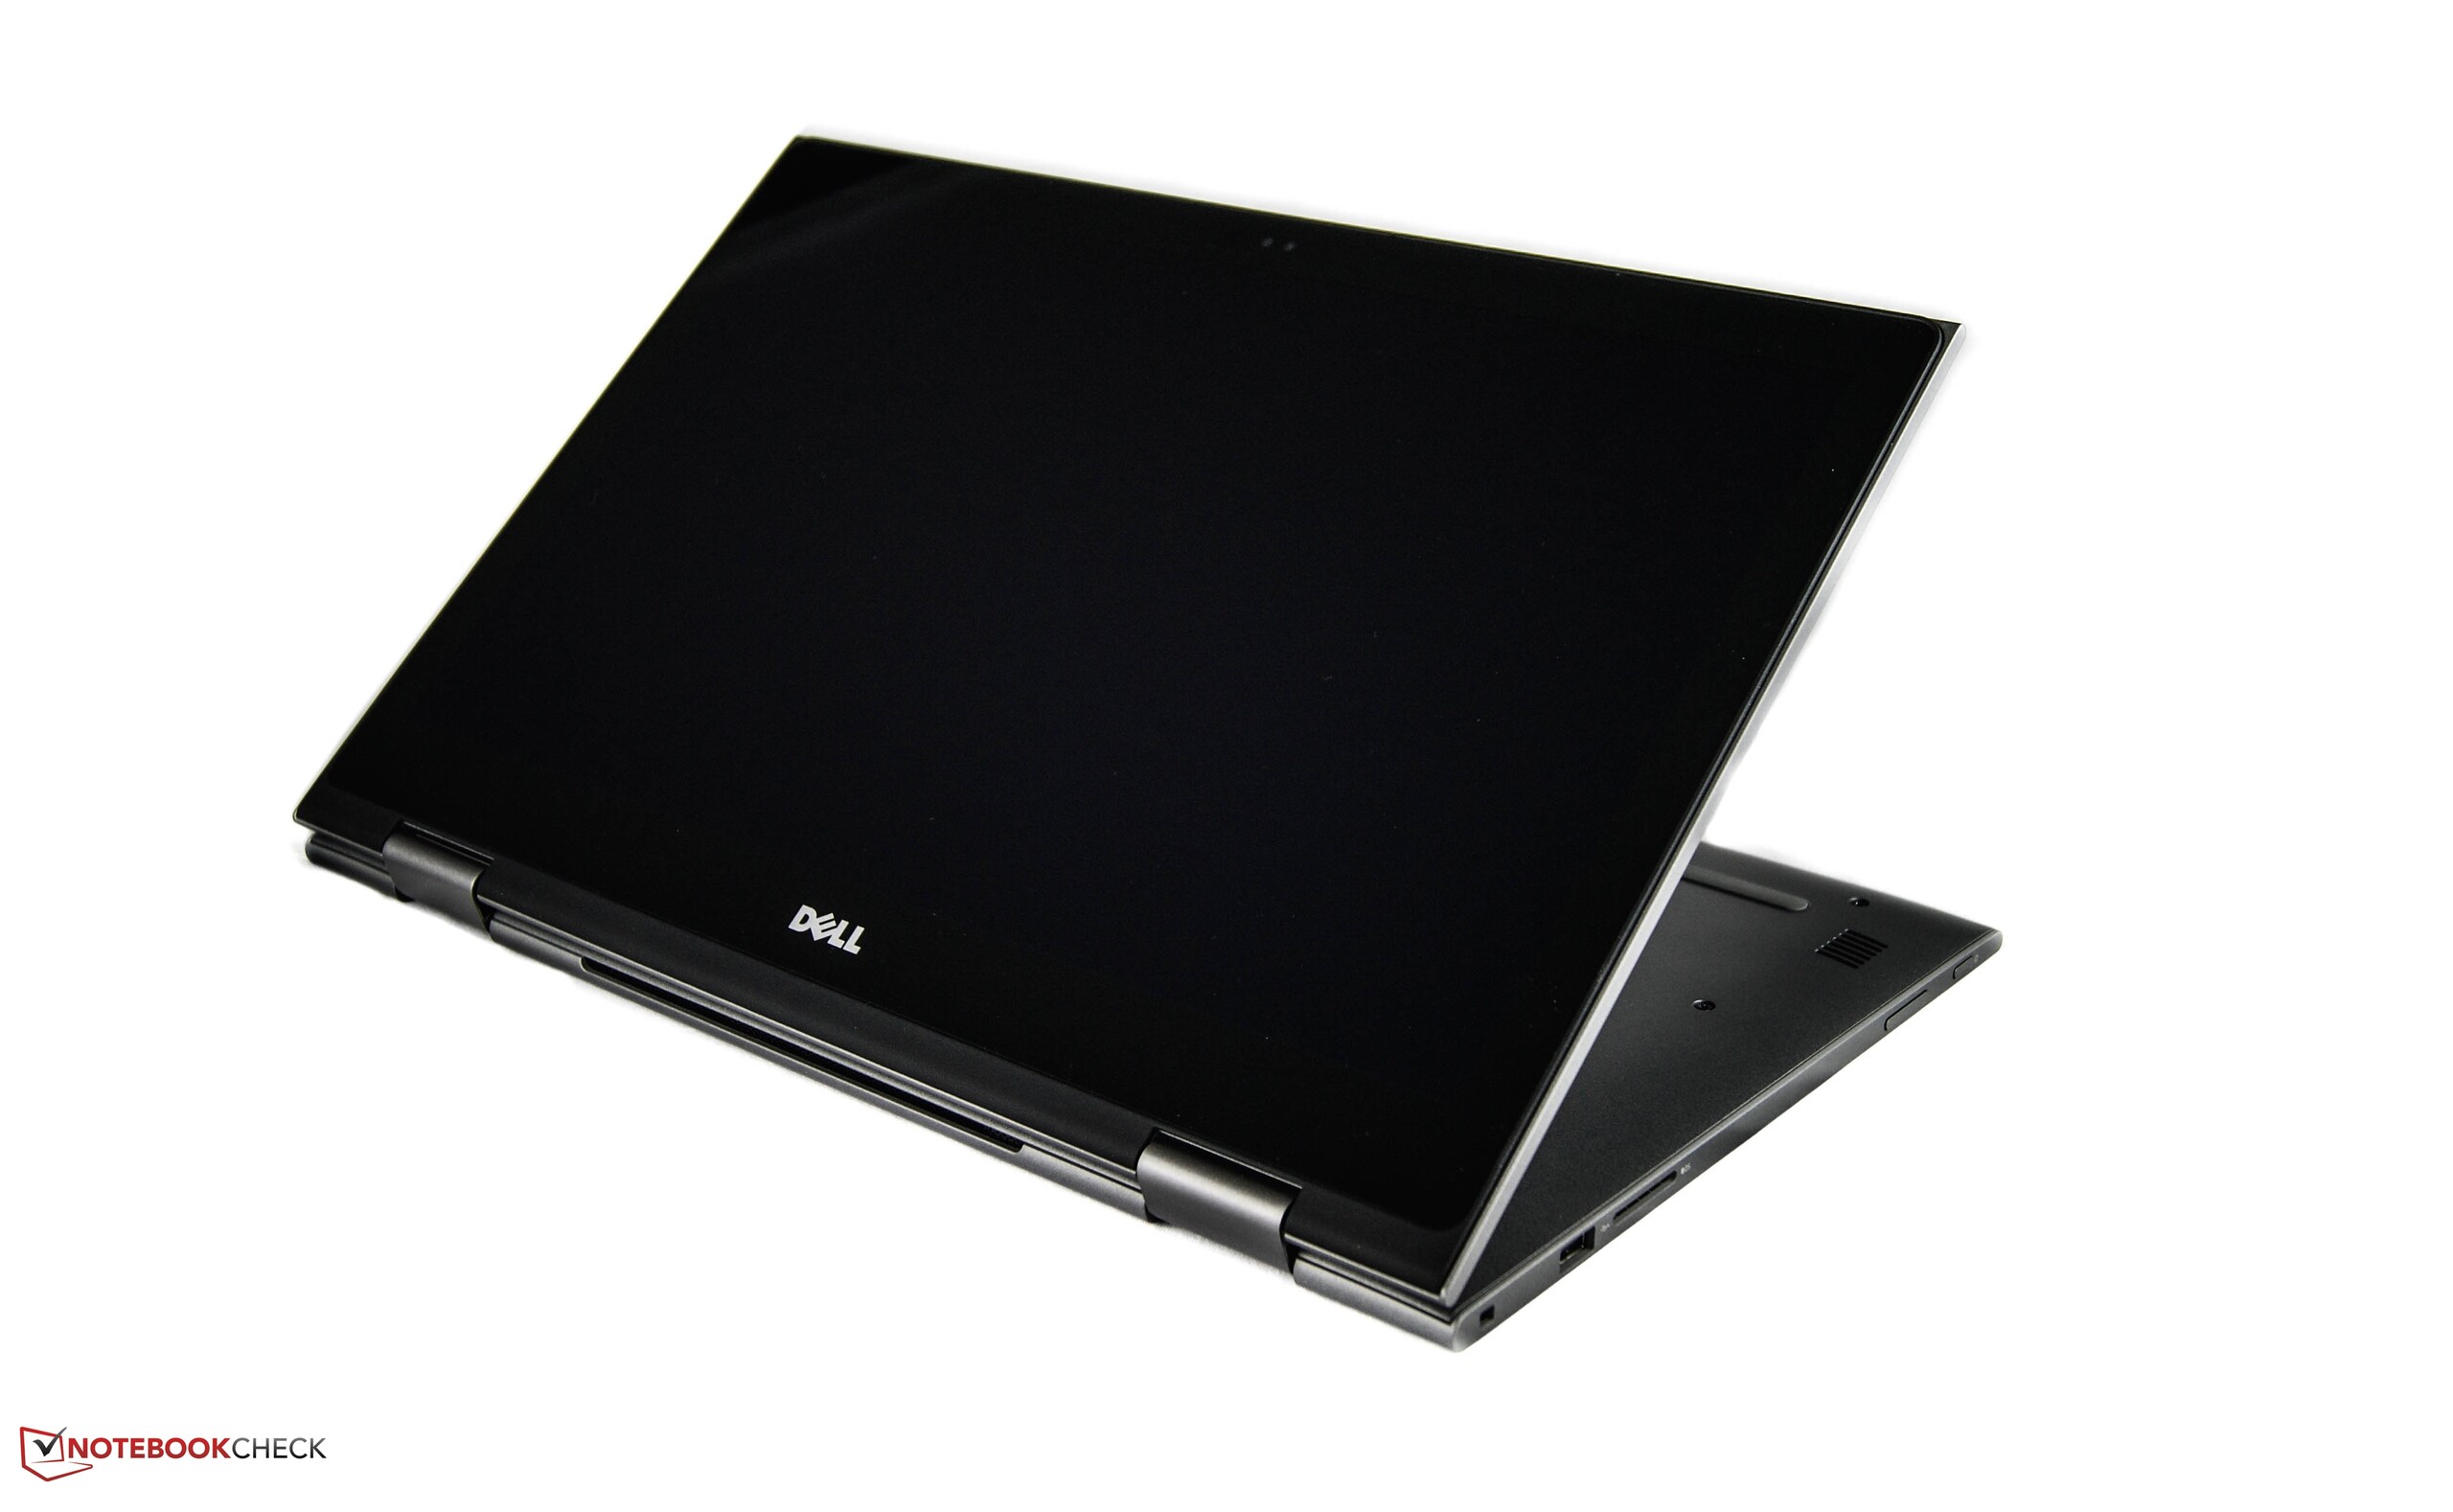
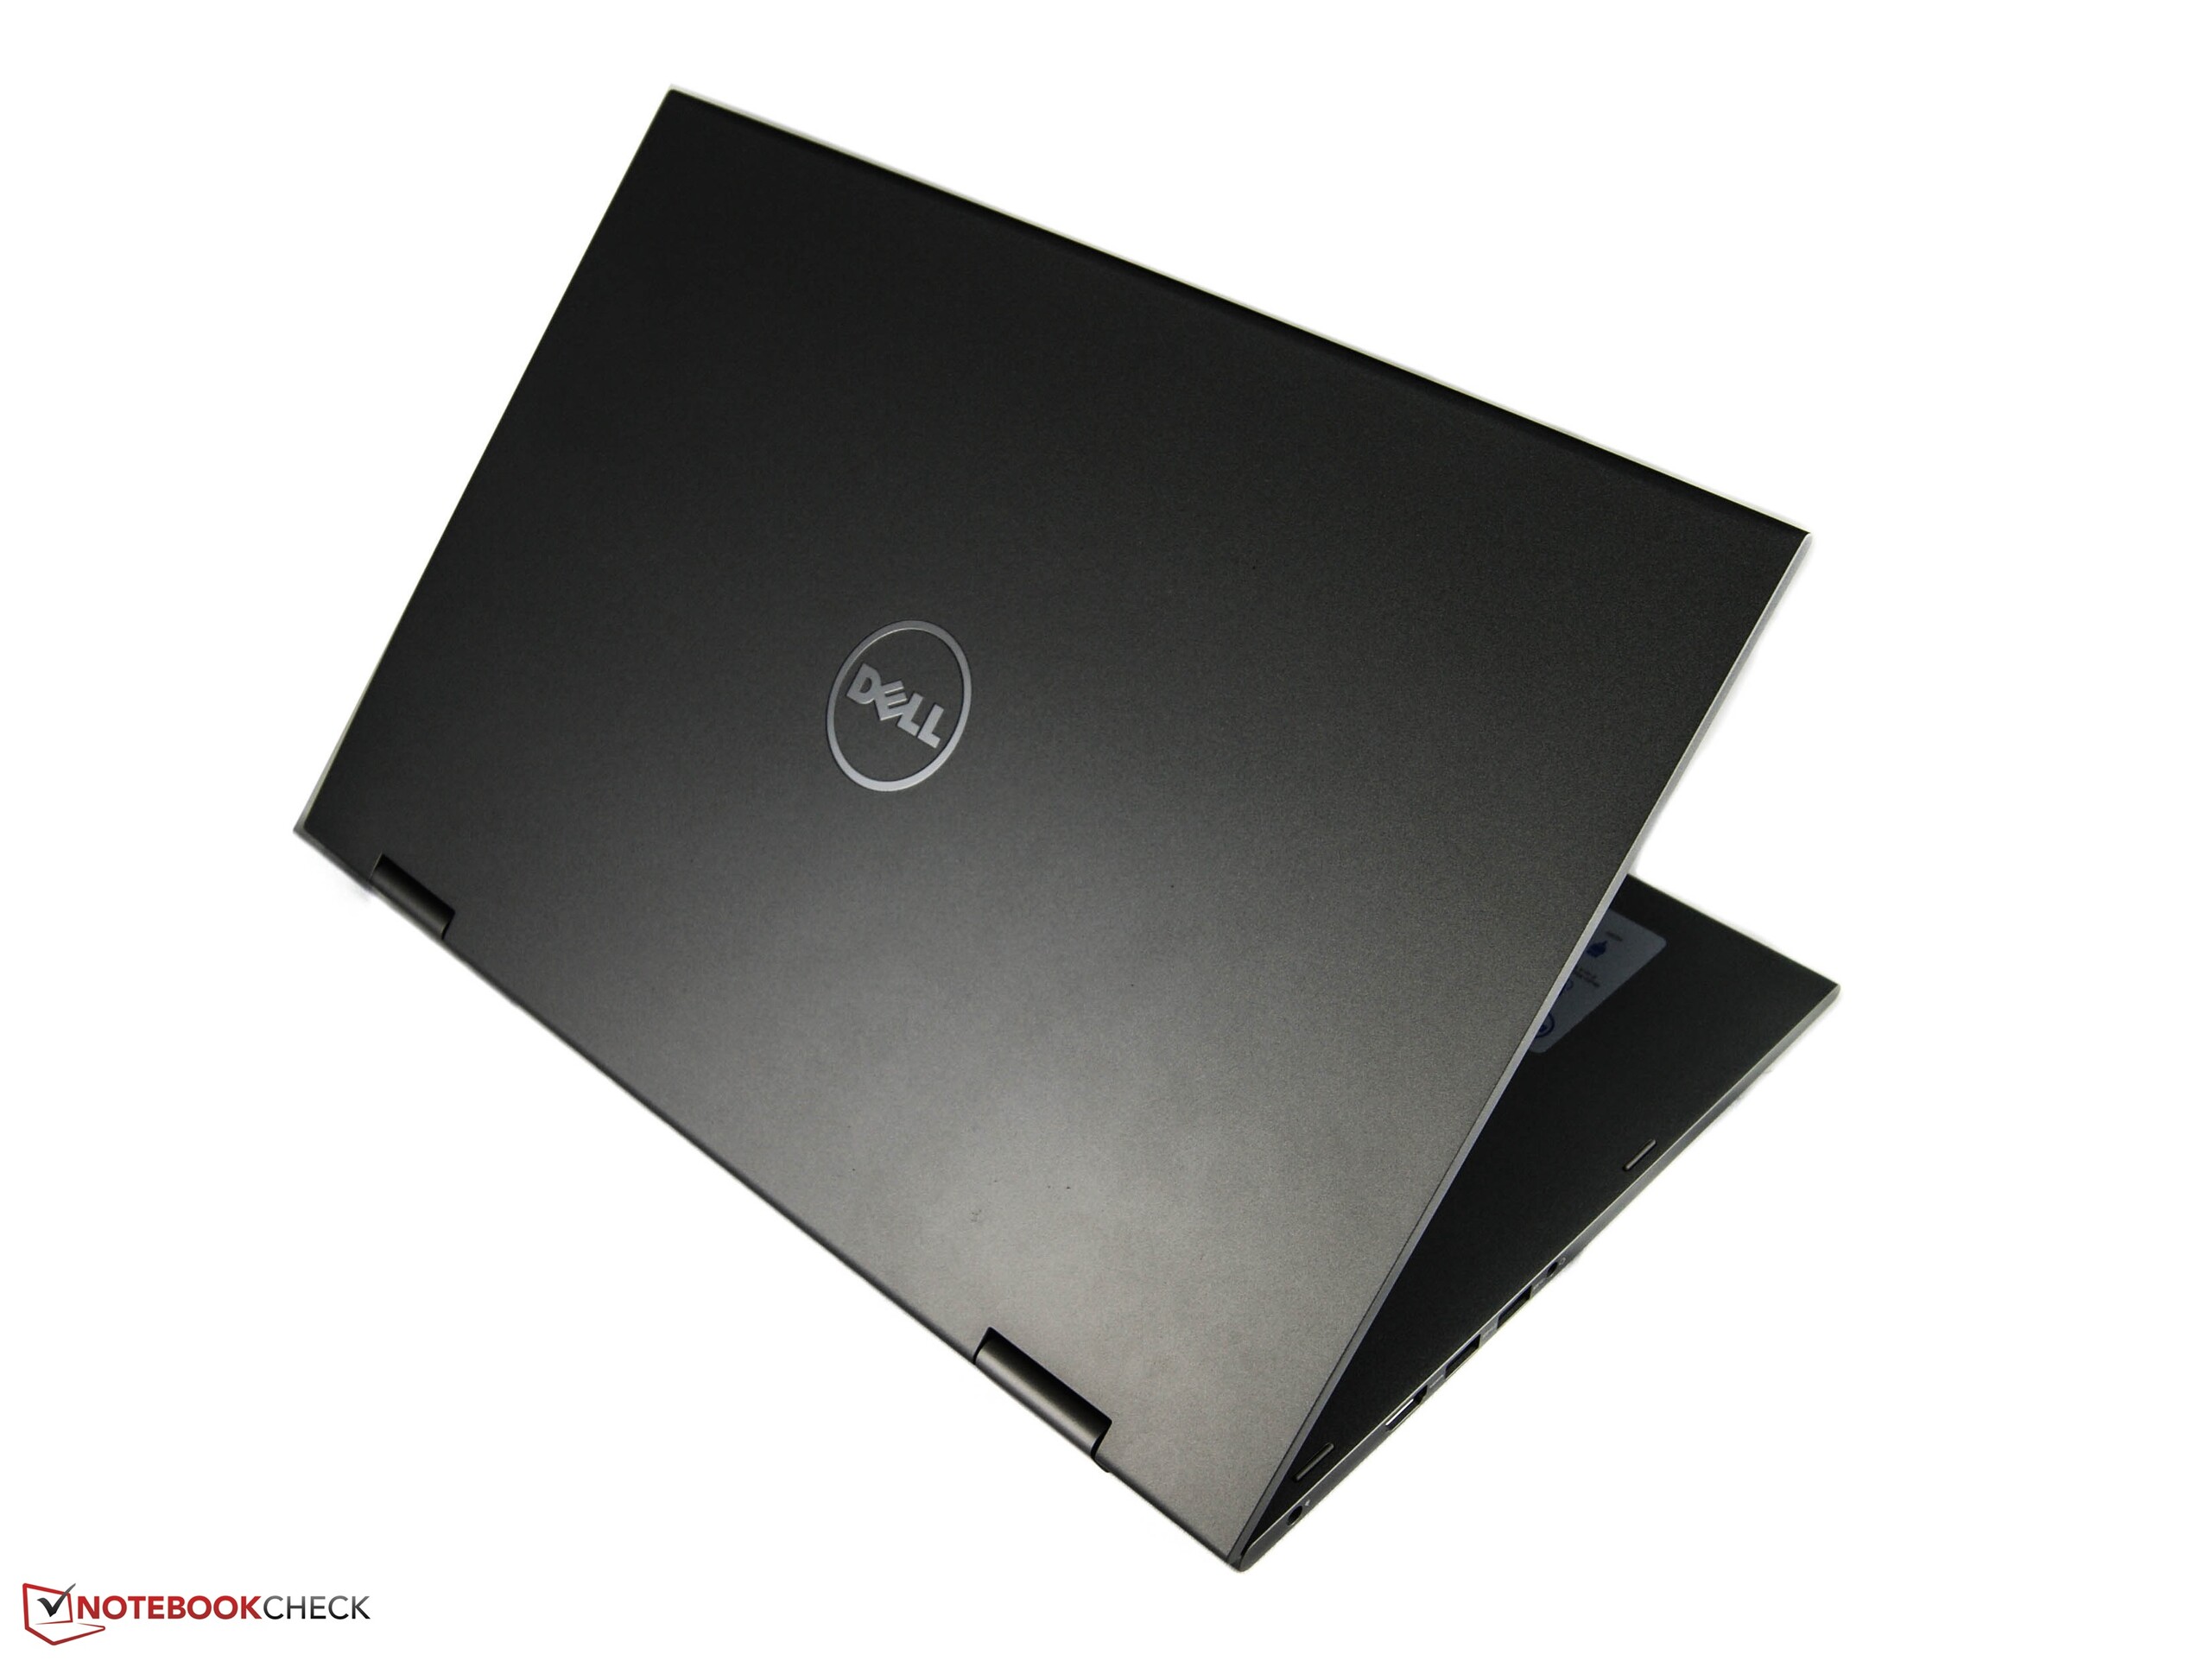
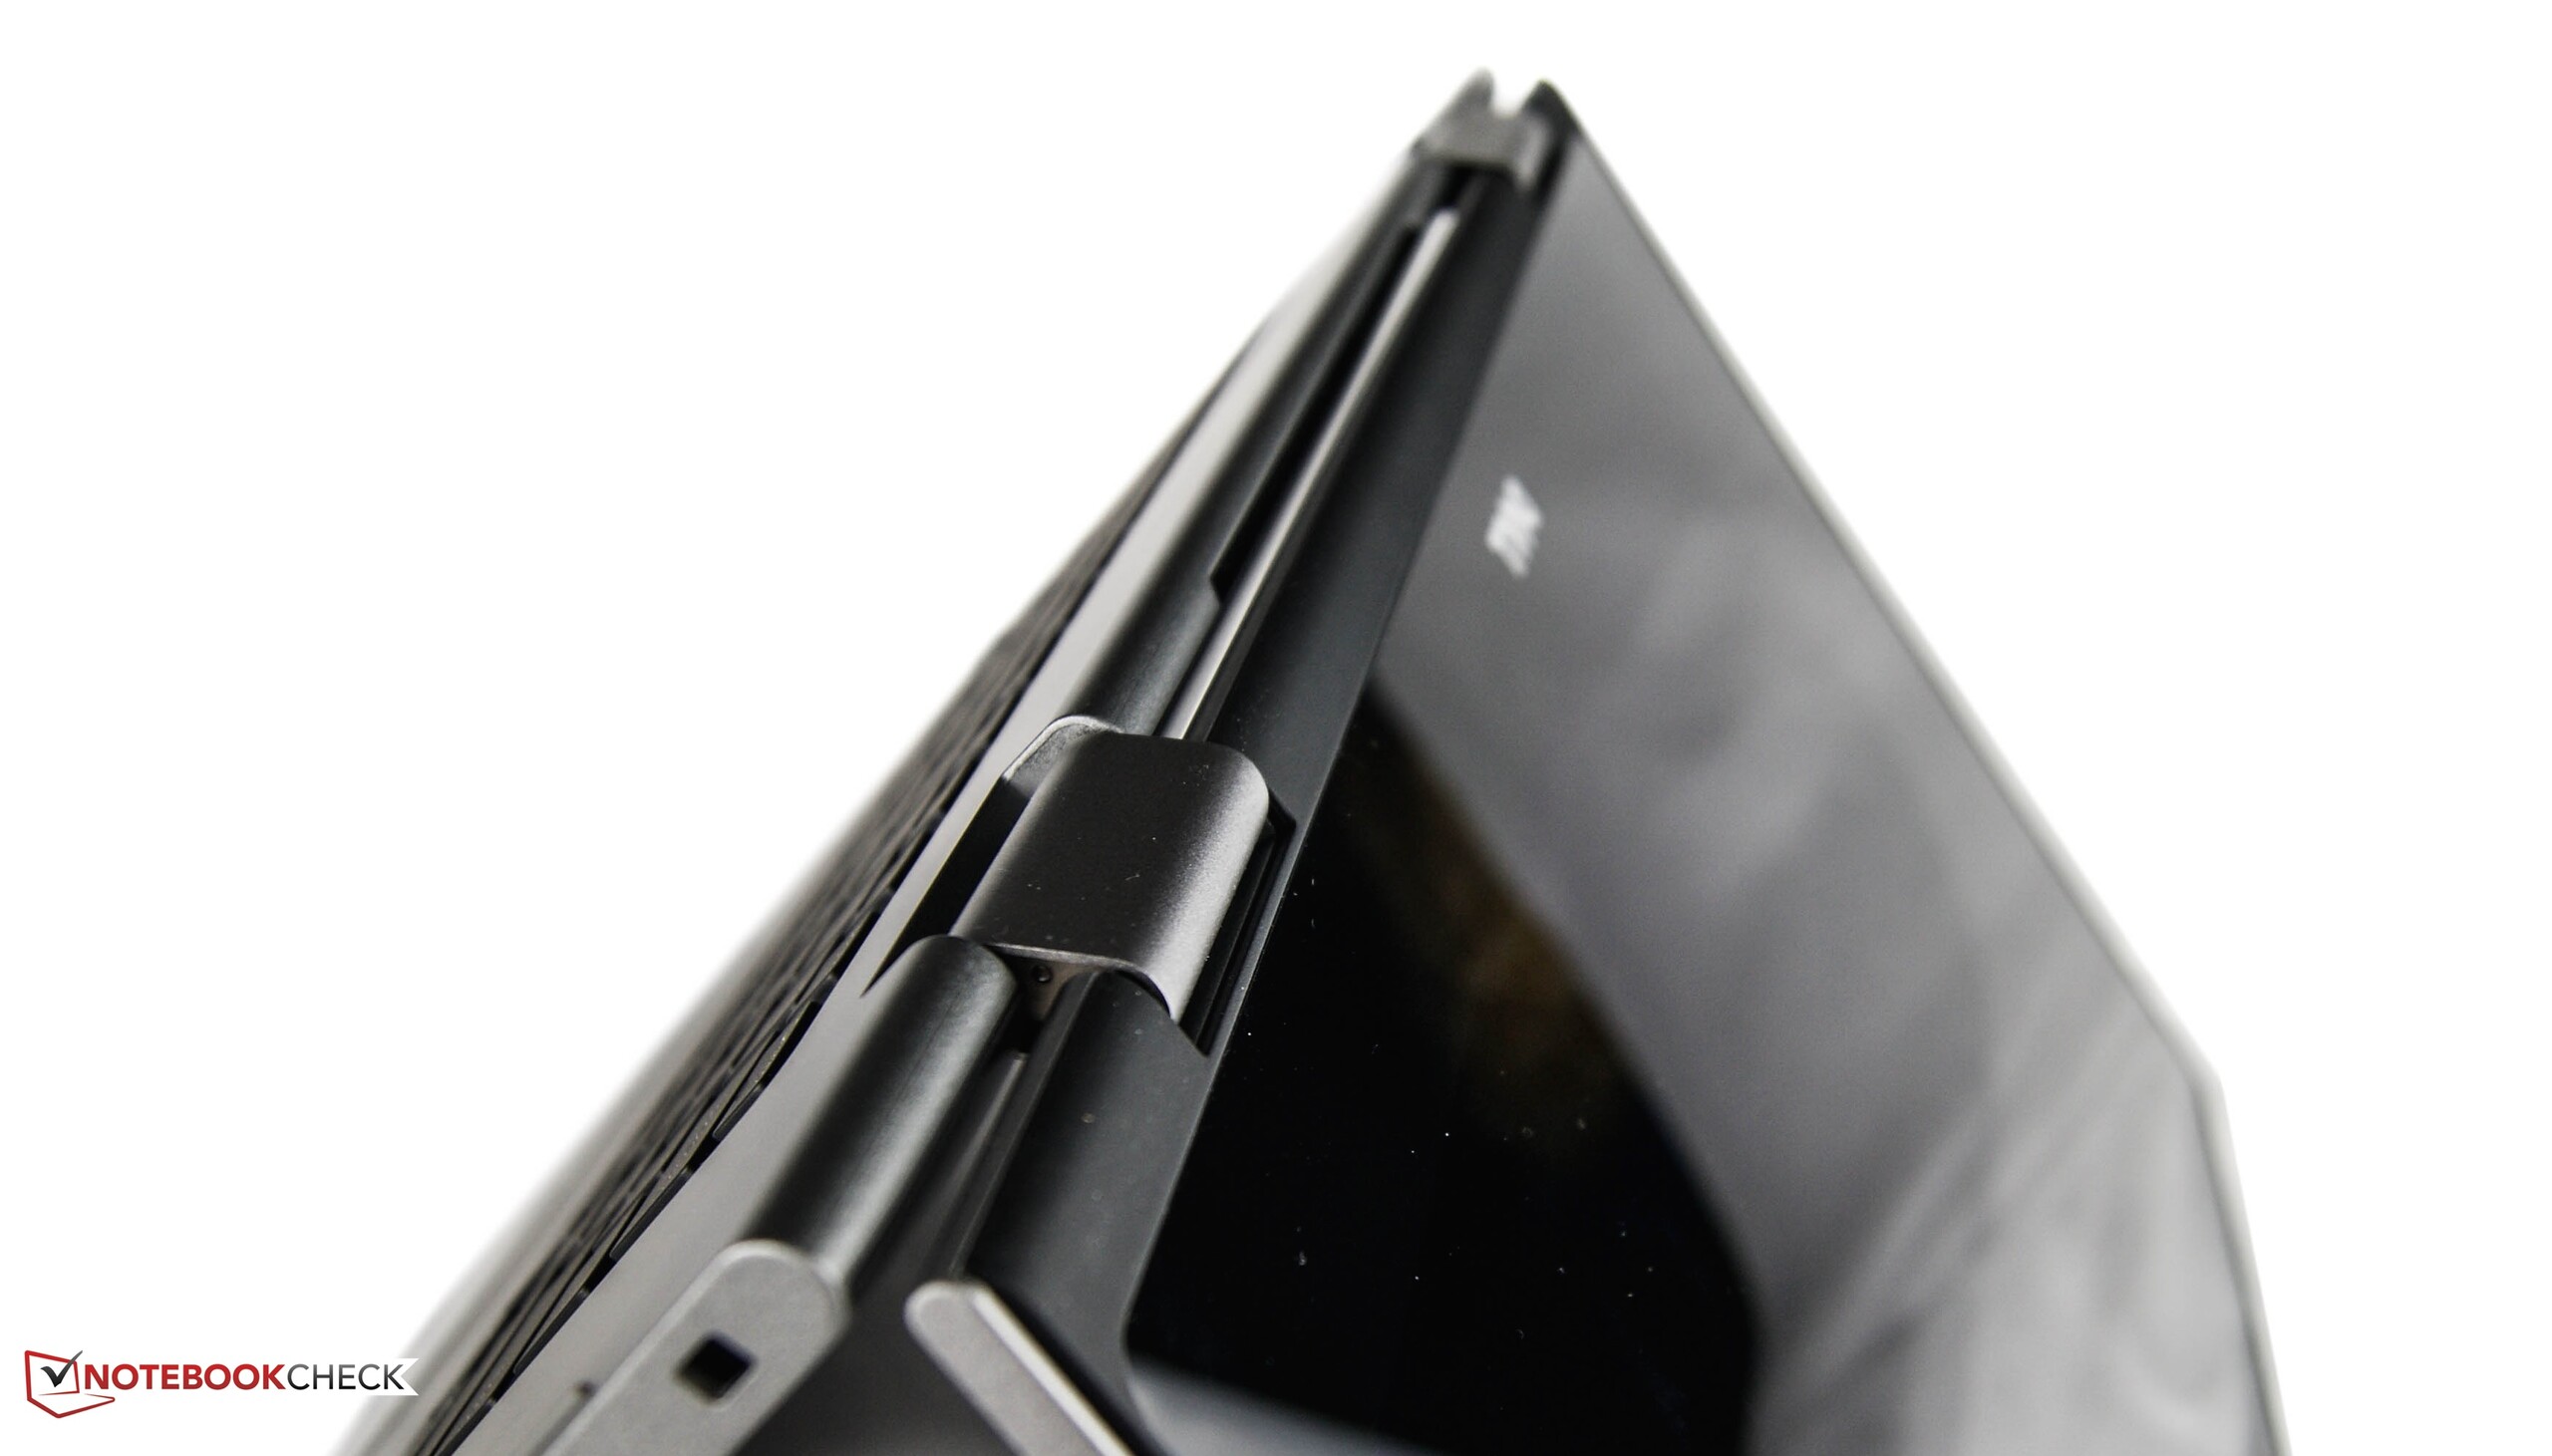
Para cumprir com os requisitos de um conversível, o aparelho deve ser equipado com um bom equilíbrio de desempenho, alta-qualidade de construção e mobilidade. Além de algumas exceções, a Dell consegue isso em seu novo Inspiron 15 5568. A carcaça consegue se destacar entre a concorrência exceto por algumas fraquezas. Achamos a boa qualidade particularmente positiva. Apenas a traseira da tela deve ser mais robusta, e o peso e sua distribuição deve melhorar no futuro. Não temos muitas críticas para a tela; no entanto um brilho um pouco mais alto seria bem-vindo. O seguinte critério importante é a prontidão do desempenho e tempos de resposta em particular. Dado que a Dell instalou exclusivamente hardware de alto desempenho, nosso modelo de teste poderia exibir suas fortalezas nos benchmarks dos sistemas. No entanto, isto tem um impacto na temperatura. O calor é bastante pronunciado em um lado, e por isso o Inspiron esquenta muito em um lugar durante uso intenso permanente. Além disso, a duração da bateria é um pouco curta, a qual é consideravelmente mais longa em alguns oponentes.
Os usuários procurando um conversível elegante, versátil e sempre pronto em um tamanho de 15 polegadas encontrarão isto na nova série Inspiron 5000 da Dell.
Os compradores que não estiverem dispostos a gastar 1000 Euros (~$1099) também podem dar uma olhada na alternativa de 200 Euros (~$220) a menos desta linha. A concorrência não deve ser deixada de lado. Um exemplo a ser mencionado é, mais uma vez o HP Spectre x360 que representa uma opção interessante com uma tela mais brilhante, duração mais longa da bateria, e peso geral inferior.
Esta é uma versão reduzida da análise original. Você pode ler a análise completa em inglês aqui.
Dell Inspiron 15 5568
- 07/19/2016 v5.1 (old)
Nino Ricchizzi