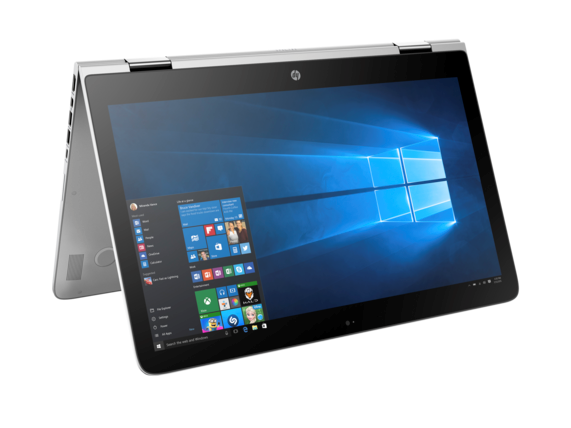
Breve Análise do Conversível HP Spectre x360 15-ap012dx
| |||||||||||||||||||||||||
iluminação: 88 %
iluminação com acumulador: 298 cd/m²
Contraste: 523:1 (Preto: 0.57 cd/m²)
ΔE ColorChecker Calman: 4.43 | ∀{0.5-29.43 Ø4.71}
ΔE Greyscale Calman: 2.45 | ∀{0.09-98 Ø4.96}
87.8% sRGB (Argyll 1.6.3 3D)
57.2% AdobeRGB 1998 (Argyll 1.6.3 3D)
63.9% AdobeRGB 1998 (Argyll 3D)
88.2% sRGB (Argyll 3D)
62.8% Display P3 (Argyll 3D)
Gamma: 2.45
CCT: 6326 K
| HP Spectre x360 15-ap012dx 15.6", 3840x2160 | HP Spectre x360 15-ap011dx 15.6", 1920x1080 | Toshiba Satellite L50-C-275 15.6", 1920x1080 | Dell XPS 15 9550 i7 FHD 15.6", 1920x1080 | HP Envy 15-w103ng x360 15.6", 1920x1080 | Lenovo Ideapad 500s-14ISK 14", 1920x1080 | |
|---|---|---|---|---|---|---|
| Display | -2% | -3% | 10% | -34% | -33% | |
| Display P3 Coverage (%) | 62.8 | 64.8 3% | 64.1 2% | 68.5 9% | 39.97 -36% | 40.74 -35% |
| sRGB Coverage (%) | 88.2 | 83.5 -5% | 82.9 -6% | 97.2 10% | 59.8 -32% | 60.6 -31% |
| AdobeRGB 1998 Coverage (%) | 63.9 | 61 -5% | 60.6 -5% | 70.4 10% | 41.32 -35% | 42.15 -34% |
| Response Times | -16% | 26% | -87% | -7% | -7% | |
| Response Time Grey 50% / Grey 80% * (ms) | 32.8 ? | 40 ? -22% | 24 ? 27% | 64 ? -95% | 37 ? -13% | 43 ? -31% |
| Response Time Black / White * (ms) | 28 ? | 30.4 ? -9% | 21 ? 25% | 50 ? -79% | 28 ? -0% | 23 ? 18% |
| PWM Frequency (Hz) | 50 ? | |||||
| Screen | -2% | 2% | 3% | -32% | -64% | |
| Brightness middle (cd/m²) | 298 | 289.9 -3% | 294 -1% | 371.5 25% | 208 -30% | 249 -16% |
| Brightness (cd/m²) | 295 | 275 -7% | 285 -3% | 356 21% | 205 -31% | 235 -20% |
| Brightness Distribution (%) | 88 | 88 0% | 83 -6% | 92 5% | 80 -9% | 87 -1% |
| Black Level * (cd/m²) | 0.57 | 0.289 49% | 0.26 54% | 0.252 56% | 0.26 54% | 0.44 23% |
| Contrast (:1) | 523 | 1003 92% | 1131 116% | 1474 182% | 800 53% | 566 8% |
| Colorchecker dE 2000 * | 4.43 | 5.24 -18% | 5.07 -14% | 5.55 -25% | 6.97 -57% | 9.47 -114% |
| Colorchecker dE 2000 max. * | 6.62 | 9.55 -44% | 9.33 -41% | 10.95 -65% | 15.41 -133% | |
| Greyscale dE 2000 * | 2.45 | 4.46 -82% | 4.25 -73% | 7.1 -190% | 7.37 -201% | 10.22 -317% |
| Gamma | 2.45 90% | 2.31 95% | 2.49 88% | 2.1 105% | 2.34 94% | 2.34 94% |
| CCT | 6326 103% | 6818 95% | 6597 99% | 6823 95% | 11451 57% | |
| Color Space (Percent of AdobeRGB 1998) (%) | 57.2 | 54.7 -4% | 54 -6% | 63.4 11% | 38 -34% | 39 -32% |
| Color Space (Percent of sRGB) (%) | 87.8 | 83.3 -5% | 83 -5% | 97.9 12% | 59 -33% | 57 -35% |
| Média Total (Programa/Configurações) | -7% /
-4% | 8% /
4% | -25% /
-8% | -24% /
-29% | -35% /
-50% |
* ... menor é melhor
Exibir tempos de resposta
| ↔ Tempo de resposta preto para branco | ||
|---|---|---|
| 28 ms ... ascensão ↗ e queda ↘ combinadas | ↗ 4.8 ms ascensão | 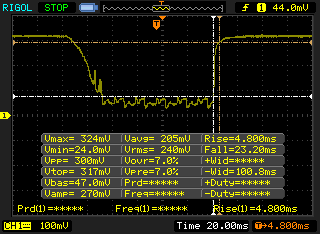 |
| ↘ 23.2 ms queda | ||
| A tela mostra taxas de resposta relativamente lentas em nossos testes e pode ser muito lenta para os jogadores. Em comparação, todos os dispositivos testados variam de 0.1 (mínimo) a 240 (máximo) ms. » 71 % de todos os dispositivos são melhores. Isso significa que o tempo de resposta medido é pior que a média de todos os dispositivos testados (19.8 ms). | ||
| ↔ Tempo de resposta 50% cinza a 80% cinza | ||
| 32.8 ms ... ascensão ↗ e queda ↘ combinadas | ↗ 14.8 ms ascensão | 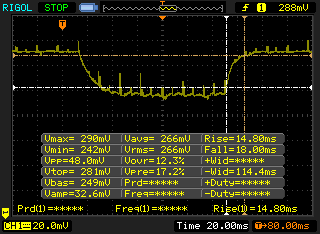 |
| ↘ 18 ms queda | ||
| A tela mostra taxas de resposta lentas em nossos testes e será insatisfatória para os jogadores. Em comparação, todos os dispositivos testados variam de 0.165 (mínimo) a 636 (máximo) ms. » 45 % de todos os dispositivos são melhores. Isso significa que o tempo de resposta medido é semelhante à média de todos os dispositivos testados (31 ms). | ||
Cintilação da tela / PWM (modulação por largura de pulso)
| Tela tremeluzindo / PWM não detectado | 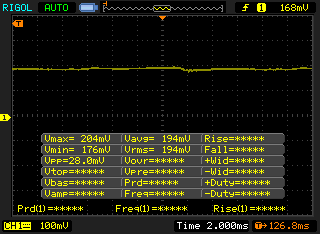 | ||
[pwm_comparison] Em comparação: 52 % de todos os dispositivos testados não usam PWM para escurecer a tela. Se PWM foi detectado, uma média de 7754 (mínimo: 5 - máximo: 343500) Hz foi medida. | |||
| Cinebench R15 | |
| CPU Single 64Bit (classificar por valor) | |
| HP Spectre x360 15-ap012dx | |
| Lenovo IdeaPad Y50 | |
| Microsoft Surface Pro 4 Core i7 | |
| Razer Blade Stealth UHD i7-6500U | |
| HP EliteBook Folio 1040 G2 | |
| Lenovo ThinkPad T440s 20AQ006BGE | |
| CPU Multi 64Bit (classificar por valor) | |
| HP Spectre x360 15-ap012dx | |
| Lenovo IdeaPad Y50 | |
| Microsoft Surface Pro 4 Core i7 | |
| Razer Blade Stealth UHD i7-6500U | |
| HP EliteBook Folio 1040 G2 | |
| Lenovo ThinkPad T440s 20AQ006BGE | |
| Cinebench R11.5 | |
| CPU Single 64Bit (classificar por valor) | |
| HP Spectre x360 15-ap012dx | |
| Lenovo IdeaPad Y50 | |
| Microsoft Surface Pro 4 Core i7 | |
| Razer Blade Stealth UHD i7-6500U | |
| HP EliteBook Folio 1040 G2 | |
| Lenovo ThinkPad T440s 20AQ006BGE | |
| CPU Multi 64Bit (classificar por valor) | |
| HP Spectre x360 15-ap012dx | |
| Lenovo IdeaPad Y50 | |
| Microsoft Surface Pro 4 Core i7 | |
| Razer Blade Stealth UHD i7-6500U | |
| HP EliteBook Folio 1040 G2 | |
| Lenovo ThinkPad T440s 20AQ006BGE | |
| Cinebench R10 | |
| Rendering Single CPUs 64Bit (classificar por valor) | |
| Lenovo IdeaPad Y50 | |
| Microsoft Surface Pro 4 Core i7 | |
| Lenovo ThinkPad T440s 20AQ006BGE | |
| Rendering Multiple CPUs 64Bit (classificar por valor) | |
| Lenovo IdeaPad Y50 | |
| Microsoft Surface Pro 4 Core i7 | |
| Lenovo ThinkPad T440s 20AQ006BGE | |
| wPrime 2.10 - 1024m (classificar por valor) | |
| HP Spectre x360 15-ap012dx | |
| Lenovo IdeaPad Y50 | |
| Microsoft Surface Pro 4 Core i7 | |
| Razer Blade Stealth UHD i7-6500U | |
| Super Pi Mod 1.5 XS 32M - 32M (classificar por valor) | |
| HP Spectre x360 15-ap012dx | |
| Lenovo IdeaPad Y50 | |
| Microsoft Surface Pro 4 Core i7 | |
| Razer Blade Stealth UHD i7-6500U | |
* ... menor é melhor
| PCMark 7 - Score (classificar por valor) | |
| HP Spectre x360 15-ap012dx | |
| Microsoft Surface Pro 4 Core i7 | |
| Dell XPS 15 9550 i7 FHD | |
| Lenovo IdeaPad Y50-70-59441231 | |
| HP Envy 15-w000ng x360 | |
| PCMark 7 Score | 5326 pontos | |
| PCMark 8 Home Score Accelerated v2 | 2847 pontos | |
| PCMark 8 Creative Score Accelerated v2 | 3796 pontos | |
| PCMark 8 Work Score Accelerated v2 | 3576 pontos | |
Ajuda | ||

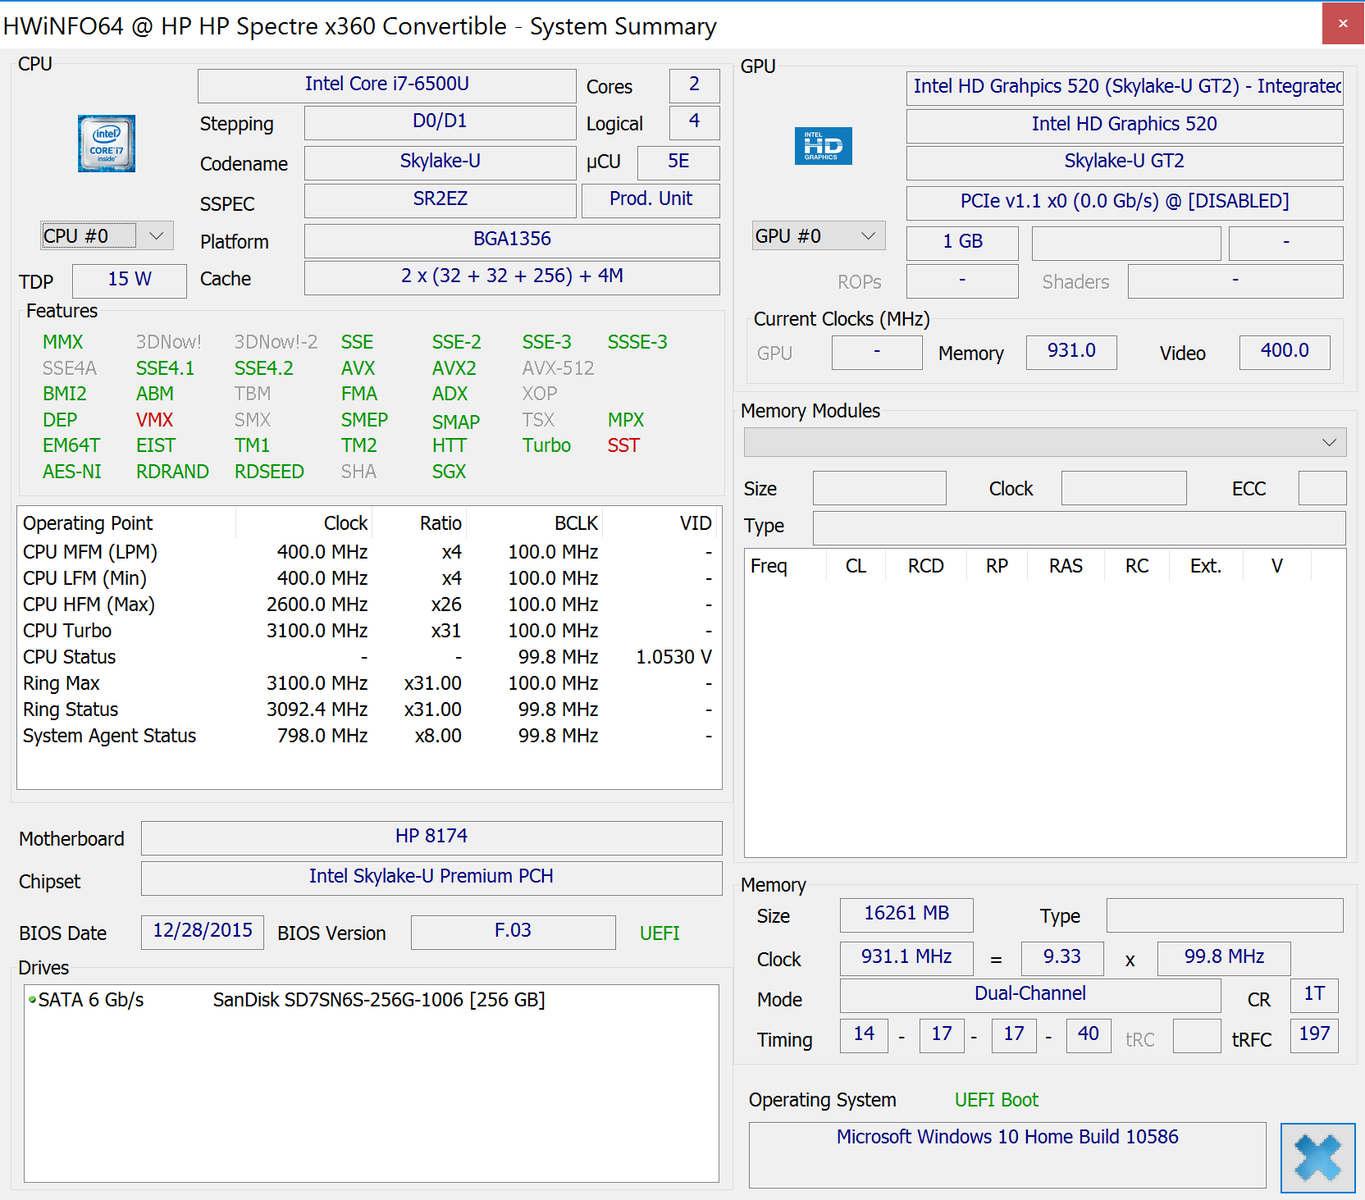
| HP Spectre x360 15-ap012dx HD Graphics 520, 6200U, Sandisk X300 SD7SN6S-256G-1006 | HP Spectre x360 15-ap011dx HD Graphics 520, 6200U, Liteon L8H-256V2G | Toshiba Satellite L50-C-275 GeForce 930M, 6200U, Samsung SSD PM871 MZNLN256HCHP | Dell XPS 15 9550 i7 FHD GeForce GTX 960M, 6700HQ, Samsung PM951 NVMe 512 GB | HP Envy 15-w103ng x360 GeForce 930M, 6200U, Samsung SSD PM851 256 GB MZNTE256HMHP | Lenovo Ideapad 500s-14ISK GeForce 940M, 6500U, Samsung PM871 MZYLN256HCHP | |
|---|---|---|---|---|---|---|
| AS SSD | 1% | 6% | 134% | -3% | 8% | |
| Copy Game MB/s (MB/s) | 307.7 | 208.1 -32% | 178.3 -42% | 805 162% | 196.1 -36% | 197.6 -36% |
| Copy Program MB/s (MB/s) | 215.3 | 185.6 -14% | 105.3 -51% | 325.3 51% | 137.9 -36% | 168.7 -22% |
| Copy ISO MB/s (MB/s) | 403.4 | 224.2 -44% | 244.1 -39% | 1127 179% | 436.8 8% | 236 -41% |
| Score Total (Points) | 850 | 882 4% | 1080 27% | 2410 184% | 950 12% | 1032 21% |
| Score Write (Points) | 250 | 353 41% | 381 52% | 675 170% | 303 21% | 336 34% |
| Score Read (Points) | 397 | 352 -11% | 463 17% | 1180 197% | 432 9% | 460 16% |
| Access Time Write * (ms) | 0.057 | 0.05 12% | 0.041 28% | 0.035 39% | 0.044 23% | 0.041 28% |
| Access Time Read * (ms) | 0.08 | 0.067 16% | 0.102 -27% | 0.038 52% | 0.131 -64% | 0.067 16% |
| 4K-64 Write (MB/s) | 143.8 | 252.9 76% | 271.8 89% | 513 257% | 201.8 40% | 223 55% |
| 4K-64 Read (MB/s) | 318 | 274.8 -14% | 380.8 20% | 990 211% | 356.5 12% | 376.6 18% |
| 4K Write (MB/s) | 78.3 | 74.1 -5% | 81.8 4% | 105.4 35% | 78.3 0% | 82.8 6% |
| 4K Read (MB/s) | 31.04 | 26 -16% | 32.34 4% | 31.86 3% | 25.25 -19% | 33.12 7% |
| Seq Write (MB/s) | 278.1 | 263.2 -5% | 273.9 -2% | 570 105% | 226.4 -19% | 298.7 7% |
| Seq Read (MB/s) | 475.3 | 513 8% | 498 5% | 1579 232% | 507 7% | 500 5% |
* ... menor é melhor
| 3DMark 11 | |
| 1280x720 Performance (classificar por valor) | |
| HP Spectre x360 15-ap012dx | |
| Microsoft Surface Pro 4 Core i7 | |
| Razer Blade Stealth UHD i7-6500U | |
| Lenovo IdeaPad 100-15IBD | |
| Dell Vostro 3546 JAN15HSW1601_1K9_Win | |
| 1280x720 Performance GPU (classificar por valor) | |
| HP Spectre x360 15-ap012dx | |
| Microsoft Surface Pro 4 Core i7 | |
| Razer Blade Stealth UHD i7-6500U | |
| Lenovo IdeaPad 100-15IBD | |
| Dell Vostro 3546 JAN15HSW1601_1K9_Win | |
| 3DMark 11 Performance | 1565 pontos | |
| 3DMark Ice Storm Standard Score | 41767 pontos | |
| 3DMark Cloud Gate Standard Score | 5217 pontos | |
| 3DMark Fire Strike Score | 825 pontos | |
| 3DMark Fire Strike Extreme Score | 373 pontos | |
Ajuda | ||
| HP Spectre x360 15-ap012dx HD Graphics 520, 6200U, Sandisk X300 SD7SN6S-256G-1006 | Toshiba Satellite L50-C-275 GeForce 930M, 6200U, Samsung SSD PM871 MZNLN256HCHP | HP Envy 15-w103ng x360 GeForce 930M, 6200U, Samsung SSD PM851 256 GB MZNTE256HMHP | Dell XPS 15 9550 i7 FHD GeForce GTX 960M, 6700HQ, Samsung PM951 NVMe 512 GB | Lenovo IdeaPad Y50-70-59441231 GeForce GTX 960M, 4710HQ, Samsung SSD PM851 512 GB MZ7TE512HMHP | Lenovo Yoga 500-14ISK GeForce 920M, 6200U, WDC Slim WD10SPCX-24HWST1 | |
|---|---|---|---|---|---|---|
| Noise | 2% | -10% | -4% | -14% | -8% | |
| desligado / ambiente * (dB) | 29.5 | 22 25% | 31.3 -6% | |||
| Idle Minimum * (dB) | 29.5 | 31.3 -6% | 32.9 -12% | 29.2 1% | 29.6 -0% | 32.8 -11% |
| Idle Average * (dB) | 29.5 | 31.3 -6% | 32.9 -12% | 29.3 1% | 31.1 -5% | 32.8 -11% |
| Idle Maximum * (dB) | 29.6 | 32.2 -9% | 32.9 -11% | 29.5 -0% | 34.3 -16% | 32.8 -11% |
| Load Average * (dB) | 38.1 | 36.4 4% | 37 3% | 36.5 4% | 45 -18% | 39.4 -3% |
| Load Maximum * (dB) | 38.2 | 36.6 4% | 46 -20% | 47.7 -25% | 49.2 -29% | 39.2 -3% |
* ... menor é melhor
Barulho
| Ocioso |
| 29.5 / 29.5 / 29.6 dB |
| Carga |
| 38.1 / 38.2 dB |
 | ||
30 dB silencioso 40 dB(A) audível 50 dB(A) ruidosamente alto |
||
min: | ||
(+) A temperatura máxima no lado superior é 39.9 °C / 104 F, em comparação com a média de 35.4 °C / 96 F , variando de 19.6 a 60 °C para a classe Convertible.
(±) A parte inferior aquece até um máximo de 41 °C / 106 F, em comparação com a média de 36.9 °C / 98 F
(+) Em uso inativo, a temperatura média para o lado superior é 24.1 °C / 75 F, em comparação com a média do dispositivo de 30.3 °C / ### class_avg_f### F.
(+) Os apoios para as mãos e o touchpad estão atingindo a temperatura máxima da pele (34.2 °C / 93.6 F) e, portanto, não estão quentes.
(-) A temperatura média da área do apoio para as mãos de dispositivos semelhantes foi 28 °C / 82.4 F (-6.2 °C / -11.2 F).
| HP Spectre x360 15-ap012dx HD Graphics 520, 6200U, Sandisk X300 SD7SN6S-256G-1006 | HP Spectre x360 15-ap011dx HD Graphics 520, 6200U, Liteon L8H-256V2G | Toshiba Satellite L50-C-275 GeForce 930M, 6200U, Samsung SSD PM871 MZNLN256HCHP | HP Envy 15-w103ng x360 GeForce 930M, 6200U, Samsung SSD PM851 256 GB MZNTE256HMHP | Lenovo IdeaPad Y50-70-59441229 GeForce GTX 960M, 4710HQ, Samsung SSD PM851 256 GB MZ7TE256HMHP | Dell XPS 15-9550 i7 GeForce GTX 960M, 6700HQ, Samsung PM951 NVMe 512 GB | |
|---|---|---|---|---|---|---|
| Power Consumption | 14% | 8% | 17% | -62% | -120% | |
| Idle Minimum * (Watt) | 6.5 | 5.8 11% | 4.7 28% | 4.15 36% | 4.3 34% | 12.5 -92% |
| Idle Average * (Watt) | 13.3 | 9.9 26% | 9.9 26% | 8.2 38% | 7.8 41% | 19.6 -47% |
| Idle Maximum * (Watt) | 15.1 | 11.1 26% | 10.1 33% | 8.2 46% | 10.6 30% | 22.8 -51% |
| Load Average * (Watt) | 30.8 | 30.6 1% | 36 -17% | 34.6 -12% | 99.7 -224% | 102 -231% |
| Load Maximum * (Watt) | 38.5 | 36.2 6% | 51 -32% | 48 -25% | 112.3 -192% | 107 -178% |
* ... menor é melhor
| desligado | |
| Ocioso | |
| Carga |
|
Key:
min: | |
| HP Spectre x360 15-ap012dx 65 Wh | HP Spectre x360 15-ap011dx 65 Wh | Toshiba Satellite L50-C-275 45 Wh | Dell XPS 15 9550 i7 FHD 84 Wh | HP Envy 15-w103ng x360 48 Wh | Lenovo IdeaPad Y50-70-59441229 56 Wh | |
|---|---|---|---|---|---|---|
| Duração da bateria | 24% | -19% | 20% | -8% | -42% | |
| Reader / Idle (h) | 11.8 | 13.7 16% | 16.3 38% | |||
| WiFi v1.3 (h) | 7.2 | 9 25% | 5.8 -19% | 9.1 26% | 6.6 -8% | 4.2 -42% |
| Load (h) | 1.9 | 2.5 32% | 1.8 -5% |
Pro
Contra
Você deveria comprar o SKU UHD 4K mais caro em vez do SKU FHD mais econômico? As vantagens são obvias incluindo os textos e imagens mais nítidos por multitarefas potencialmente melhores. Também estamos aliviados ao não ver grandes reduções no brilho da iluminação devido à contagem de pixels mais densa.
Enquanto a modificação para uma matriz de RGBW resultou em cores um pouco mais precisos antes da calibração, o contraste sofreu e a escala de cinzas é pior que o da contraparte FHD. A duração da bateria levou um golpe de mais de 2 horas durante o uso do WLAN. Somente podemos assumir que quanto mais alto for o SKU com o mais poderoso Core i7-6560U e Iris Graphics 540 reduzirá ainda mais a duração da bateria. Mesmo assim, sete horas de uso no mundo real é muito bom para um sistema de 15,6-polegadas.
O pequeno punhado de inconvenientes não é significativo o suficiente para dissuadir os potenciais compradores. Elas deveriam, no entanto, ser mais claras para os usuários, dado que as especificações como o brilho da luz, o contraste ou a precisão das cores não são sempre explicitamente declaradas pelo fabricante para cada opção de tela. Isso se aplica para todos os fabricantes e não apenas para a HP dado que registramos diferentes níveis de brilho, contraste, e gamas entre os SKUs do XPS 13, Zenbook UX303, e outros, devido a diferenças de resolução.
O Spectre x360 15 4K UHD SKU oferece uma tela táctil ainda mais incrível, como se esperava. A duração da bateria e o contraste levam golpes duros, mas ainda é um dos melhores conversíveis de 15-polegadas disponível atualmente.
Esta é uma versão reduzida da análise original. Você pode ler a análise completa em inglês aqui.
HP Spectre x360 15-ap012dx
- 02/27/2017 v6 (old)
Allen Ngo
Price comparison
