Breve Análise do Conversível HP Pavilion x2 12
| Networking | |
| iperf Server (receive) TCP 1 m | |
| Apple MacBook 12 (Early 2016) 1.1 GHz | |
| Lenovo IdeaPad MIIX 310-10ICR | |
| iperf Client (transmit) TCP 1 m | |
| Apple MacBook 12 (Early 2016) 1.1 GHz | |
| Lenovo IdeaPad MIIX 310-10ICR | |
| |||||||||||||||||||||||||
iluminação: 93 %
iluminação com acumulador: 314 cd/m²
Contraste: 654:1 (Preto: 0.48 cd/m²)
ΔE ColorChecker Calman: 6.12 | ∀{0.5-29.43 Ø4.71}
ΔE Greyscale Calman: 6.1 | ∀{0.09-98 Ø4.96}
71.74% sRGB (Argyll 1.6.3 3D)
46.81% AdobeRGB 1998 (Argyll 1.6.3 3D)
52.9% AdobeRGB 1998 (Argyll 3D)
72.4% sRGB (Argyll 3D)
53.2% Display P3 (Argyll 3D)
Gamma: 2.35
CCT: 7391 K
| HP Pavilion x2 12-b000ng LG Philips LGD04A5, IPS, 1920x1280, 12" | Microsoft Surface Pro 4, Core m3 Samsung SDC3853, IPS, 2736x1824, 12.3" | Acer Aspire Switch Alpha 12 SA5-271-56HM Panasonic VVX12T041N00, IPS, 2160x1440, 12" | Lenovo IdeaPad Miix 700 Samsung L_QLLTN120QL01L01, IPS, 2160x1440, 12" | Samsung Galaxy Tab Pro S W700N Digital Flat Panel (NoName), sAMOLED, 2160x1440, 12.1" | |
|---|---|---|---|---|---|
| Display | 30% | 27% | 32% | ||
| Display P3 Coverage (%) | 53.2 | 67.5 27% | 65.5 23% | 68.1 28% | |
| sRGB Coverage (%) | 72.4 | 96.6 33% | 96.1 33% | 97.4 35% | |
| AdobeRGB 1998 Coverage (%) | 52.9 | 69 30% | 66.9 26% | 70.2 33% | |
| Response Times | -18% | 11% | 31% | ||
| Response Time Grey 50% / Grey 80% * (ms) | 38 ? | 46 ? -21% | 20 ? 47% | 30 ? 21% | |
| Response Time Black / White * (ms) | 27 ? | 31 ? -15% | 34 ? -26% | 16 ? 41% | |
| PWM Frequency (Hz) | 50 ? | 1000 ? | 200 ? | ||
| Screen | 40% | 10% | 13% | 224% | |
| Brightness middle (cd/m²) | 314 | 389.2 24% | 345 10% | 341 9% | 363 16% |
| Brightness (cd/m²) | 308 | 392 27% | 328 6% | 318 3% | 378 23% |
| Brightness Distribution (%) | 93 | 92 -1% | 91 -2% | 87 -6% | 90 -3% |
| Black Level * (cd/m²) | 0.48 | 0.27 44% | 0.38 21% | 0.36 25% | 0.03 94% |
| Contrast (:1) | 654 | 1441 120% | 908 39% | 947 45% | 12100 1750% |
| Colorchecker dE 2000 * | 6.12 | 3.61 41% | 8.4 -37% | 6 2% | 4.8 22% |
| Colorchecker dE 2000 max. * | 10.92 | 11.9 -9% | 6.91 37% | ||
| Greyscale dE 2000 * | 6.1 | 3.8 38% | 4.3 30% | 8.12 -33% | 5.04 17% |
| Gamma | 2.35 94% | 2.16 102% | 2.63 84% | 2.23 99% | 2.57 86% |
| CCT | 7391 88% | 5969 109% | 7368 88% | 7011 93% | 7255 90% |
| Color Space (Percent of AdobeRGB 1998) (%) | 46.81 | 63 35% | 62 32% | 63.4 35% | 73 56% |
| Color Space (Percent of sRGB) (%) | 71.74 | 97 35% | 97.4 36% | ||
| Média Total (Programa/Configurações) | 17% /
30% | 16% /
14% | 25% /
20% | 224% /
224% |
* ... menor é melhor
Exibir tempos de resposta
| ↔ Tempo de resposta preto para branco | ||
|---|---|---|
| 27 ms ... ascensão ↗ e queda ↘ combinadas | ↗ 14 ms ascensão | 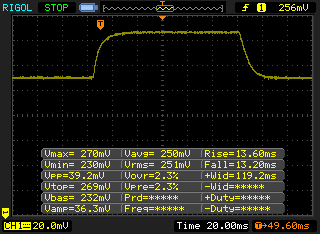 |
| ↘ 13 ms queda | ||
| A tela mostra taxas de resposta relativamente lentas em nossos testes e pode ser muito lenta para os jogadores. Em comparação, todos os dispositivos testados variam de 0.1 (mínimo) a 240 (máximo) ms. » 67 % de todos os dispositivos são melhores. Isso significa que o tempo de resposta medido é pior que a média de todos os dispositivos testados (19.8 ms). | ||
| ↔ Tempo de resposta 50% cinza a 80% cinza | ||
| 38 ms ... ascensão ↗ e queda ↘ combinadas | ↗ 17 ms ascensão | 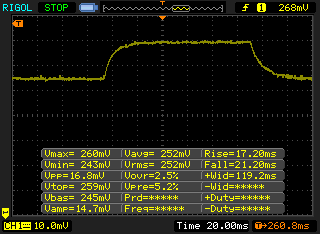 |
| ↘ 21 ms queda | ||
| A tela mostra taxas de resposta lentas em nossos testes e será insatisfatória para os jogadores. Em comparação, todos os dispositivos testados variam de 0.165 (mínimo) a 636 (máximo) ms. » 55 % de todos os dispositivos são melhores. Isso significa que o tempo de resposta medido é pior que a média de todos os dispositivos testados (30.9 ms). | ||
Cintilação da tela / PWM (modulação por largura de pulso)
| Tela tremeluzindo / PWM não detectado | ||
[pwm_comparison] Em comparação: 52 % de todos os dispositivos testados não usam PWM para escurecer a tela. Se PWM foi detectado, uma média de 7748 (mínimo: 5 - máximo: 343500) Hz foi medida. | ||
| HP Pavilion x2 12-b000ng SanDisk Z400s SD8SNAT-128G | Microsoft Surface Pro 4, Core m3 Samsung MZFLV128 NVMe | Acer Aspire Switch Alpha 12 SA5-271-56HM Kingston RBU-SNS8152S3256GG2 | Lenovo IdeaPad Miix 700 Samsung MZNLN128HCGR-000L2 | Apple MacBook 12 (Early 2016) 1.1 GHz Apple SSD AP0256 | |
|---|---|---|---|---|---|
| CrystalDiskMark 3.0 | 22% | 35% | 45% | 123% | |
| Read Seq (MB/s) | 477.3 | 663 39% | 518 9% | 497.9 4% | 754 58% |
| Write Seq (MB/s) | 184.3 | 158.2 -14% | 199.9 8% | 153.5 -17% | 638 246% |
| Read 512 (MB/s) | 226.2 | 313.1 38% | 374.9 66% | 401.2 77% | 616 172% |
| Write 512 (MB/s) | 176.2 | 158.2 -10% | 201 14% | 154.5 -12% | 678 285% |
| Read 4k (MB/s) | 21.12 | 30.14 43% | 29.3 39% | 36.2 71% | 14.6 -31% |
| Write 4k (MB/s) | 57.9 | 68 17% | 76.8 33% | 95.5 65% | 20.5 -65% |
| Read 4k QD32 (MB/s) | 136.4 | 243.7 79% | 272 99% | 389.5 186% | 464 240% |
| Write 4k QD32 (MB/s) | 173.2 | 149.2 -14% | 197.1 14% | 154 -11% | 315 82% |

| PCMark 7 Score | 4275 pontos | |
| PCMark 8 Home Score Accelerated v2 | 2831 pontos | |
| PCMark 8 Creative Score Accelerated v2 | 3198 pontos | |
| PCMark 8 Work Score Accelerated v2 | 3773 pontos | |
Ajuda | ||
| 3DMark 11 - 1280x720 Performance GPU | |
| Acer Aspire Switch Alpha 12 SA5-271-56HM | |
| Microsoft Surface Pro 4, Core m3 | |
| HP Pavilion x2 12-b000ng | |
| Lenovo IdeaPad Miix 700 | |
| Samsung Galaxy Tab Pro S W700N | |
| 3DMark | |
| 1280x720 Cloud Gate Standard Graphics | |
| Acer Aspire Switch Alpha 12 SA5-271-56HM | |
| Microsoft Surface Pro 4, Core m3 | |
| HP Pavilion x2 12-b000ng | |
| Lenovo IdeaPad Miix 700 | |
| Samsung Galaxy Tab Pro S W700N | |
| 1920x1080 Fire Strike Graphics | |
| Microsoft Surface Pro 4, Core m3 | |
| HP Pavilion x2 12-b000ng | |
| Lenovo IdeaPad Miix 700 | |
| Samsung Galaxy Tab Pro S W700N | |
| 3DMark 06 Standard Score | 7530 pontos | |
| 3DMark 11 Performance | 1260 pontos | |
| 3DMark Ice Storm Standard Score | 41366 pontos | |
| 3DMark Cloud Gate Standard Score | 4330 pontos | |
| 3DMark Fire Strike Score | 671 pontos | |
Ajuda | ||
| baixo | média | alto | ultra | |
|---|---|---|---|---|
| BioShock Infinite (2013) | 48 | 23.8 | 21.9 | |
| Battlefield 4 (2013) | 34.3 | 23.2 | 15.2 | |
| Dirt Rally (2015) | 57.8 | 16 | 12.5 |
(-) A temperatura máxima no lado superior é 49.6 °C / 121 F, em comparação com a média de 35.4 °C / 96 F , variando de 19.6 a 60 °C para a classe Convertible.
(-) A parte inferior aquece até um máximo de 46.5 °C / 116 F, em comparação com a média de 36.9 °C / 98 F
(+) Em uso inativo, a temperatura média para o lado superior é 31.6 °C / 89 F, em comparação com a média do dispositivo de 30.3 °C / ### class_avg_f### F.
(-) Os apoios para as mãos e o touchpad podem ficar muito quentes ao toque, com um máximo de 44.1 °C / 111.4 F.
(-) A temperatura média da área do apoio para as mãos de dispositivos semelhantes foi 28 °C / 82.4 F (-16.1 °C / -29 F).
HP Pavilion x2 12-b000ng análise de áudio
(±) | o volume do alto-falante é médio, mas bom (###valor### dB)
Graves 100 - 315Hz
(-) | quase nenhum baixo - em média 20.3% menor que a mediana
(±) | a linearidade dos graves é média (12.5% delta para a frequência anterior)
Médios 400 - 2.000 Hz
(±) | médios mais altos - em média 5.4% maior que a mediana
(±) | a linearidade dos médios é média (12.8% delta para frequência anterior)
Altos 2 - 16 kHz
(+) | agudos equilibrados - apenas 3.4% longe da mediana
(±) | a linearidade dos máximos é média (9.3% delta para frequência anterior)
Geral 100 - 16.000 Hz
(±) | a linearidade do som geral é média (27.6% diferença em relação à mediana)
Comparado com a mesma classe
» 84% de todos os dispositivos testados nesta classe foram melhores, 3% semelhantes, 13% piores
» O melhor teve um delta de 6%, a média foi 20%, o pior foi 57%
Comparado com todos os dispositivos testados
» 84% de todos os dispositivos testados foram melhores, 3% semelhantes, 13% piores
» O melhor teve um delta de 4%, a média foi 23%, o pior foi 134%
Apple MacBook 12 (Early 2016) 1.1 GHz análise de áudio
(+) | os alto-falantes podem tocar relativamente alto (###valor### dB)
Graves 100 - 315Hz
(±) | graves reduzidos - em média 11.3% menor que a mediana
(±) | a linearidade dos graves é média (14.2% delta para a frequência anterior)
Médios 400 - 2.000 Hz
(+) | médios equilibrados - apenas 2.4% longe da mediana
(+) | médios são lineares (5.5% delta para frequência anterior)
Altos 2 - 16 kHz
(+) | agudos equilibrados - apenas 2% longe da mediana
(+) | os máximos são lineares (4.5% delta da frequência anterior)
Geral 100 - 16.000 Hz
(+) | o som geral é linear (10.2% diferença em relação à mediana)
Comparado com a mesma classe
» 7% de todos os dispositivos testados nesta classe foram melhores, 2% semelhantes, 90% piores
» O melhor teve um delta de 5%, a média foi 18%, o pior foi 53%
Comparado com todos os dispositivos testados
» 5% de todos os dispositivos testados foram melhores, 1% semelhantes, 94% piores
» O melhor teve um delta de 4%, a média foi 23%, o pior foi 134%
| desligado | |
| Ocioso | |
| Carga |
|
Key:
min: | |
| HP Pavilion x2 12-b000ng 6Y30, HD Graphics 515, SanDisk Z400s SD8SNAT-128G, IPS, 1920x1280, 12" | Acer Aspire Switch Alpha 12 SA5-271-56HM 6200U, HD Graphics 520, Kingston RBU-SNS8152S3256GG2, IPS, 2160x1440, 12" | Lenovo IdeaPad Miix 700 6Y54, HD Graphics 515, Samsung MZNLN128HCGR-000L2, IPS, 2160x1440, 12" | Apple MacBook 12 (Early 2016) 1.1 GHz 6Y30, HD Graphics 515, Apple SSD AP0256, IPS, 2304x1440, 12" | Samsung Galaxy Tab Pro S W700N 6Y30, HD Graphics 515, Lite-On CV1-8B128, sAMOLED, 2160x1440, 12.1" | |
|---|---|---|---|---|---|
| Power Consumption | -26% | -9% | 27% | 21% | |
| Idle Minimum * (Watt) | 5.3 | 7.3 -38% | 4 25% | 2.7 49% | 3.4 36% |
| Idle Average * (Watt) | 8.2 | 10 -22% | 8.6 -5% | 2.7 67% | 8 2% |
| Idle Maximum * (Watt) | 9 | 10.15 -13% | 9.3 -3% | 7.2 20% | 9 -0% |
| Load Average * (Watt) | 20.7 | 25.2 -22% | 18.6 10% | 22 -6% | 12 42% |
| Load Maximum * (Watt) | 21.4 | 29.3 -37% | 36.3 -70% | 20.5 4% | 16.1 25% |
* ... menor é melhor
| HP Pavilion x2 12-b000ng 6Y30, HD Graphics 515, 33 Wh | Microsoft Surface Pro 4, Core m3 6Y30, HD Graphics 515, 38 Wh | Acer Aspire Switch Alpha 12 SA5-271-56HM 6200U, HD Graphics 520, 37 Wh | Lenovo IdeaPad Miix 700 6Y54, HD Graphics 515, 41 Wh | Apple MacBook 12 (Early 2016) 1.1 GHz 6Y30, HD Graphics 515, 41.4 Wh | Samsung Galaxy Tab Pro S W700N 6Y30, HD Graphics 515, 39.5 Wh | |
|---|---|---|---|---|---|---|
| Duração da bateria | 55% | 26% | 56% | 85% | 94% | |
| Reader / Idle (h) | 7.9 | 13.2 67% | 10.7 35% | 14.4 82% | 18.5 134% | |
| H.264 (h) | 5.2 | 7.8 50% | 7.5 44% | 8.5 63% | 8.6 65% | |
| WiFi v1.3 (h) | 4.8 | 8.1 69% | 5.4 13% | 7.3 52% | 8.4 75% | 8.8 83% |
| Load (h) | 1.8 | 2.3 28% | 1.9 6% | 2.6 44% | 3.9 117% |
Pro
Contra
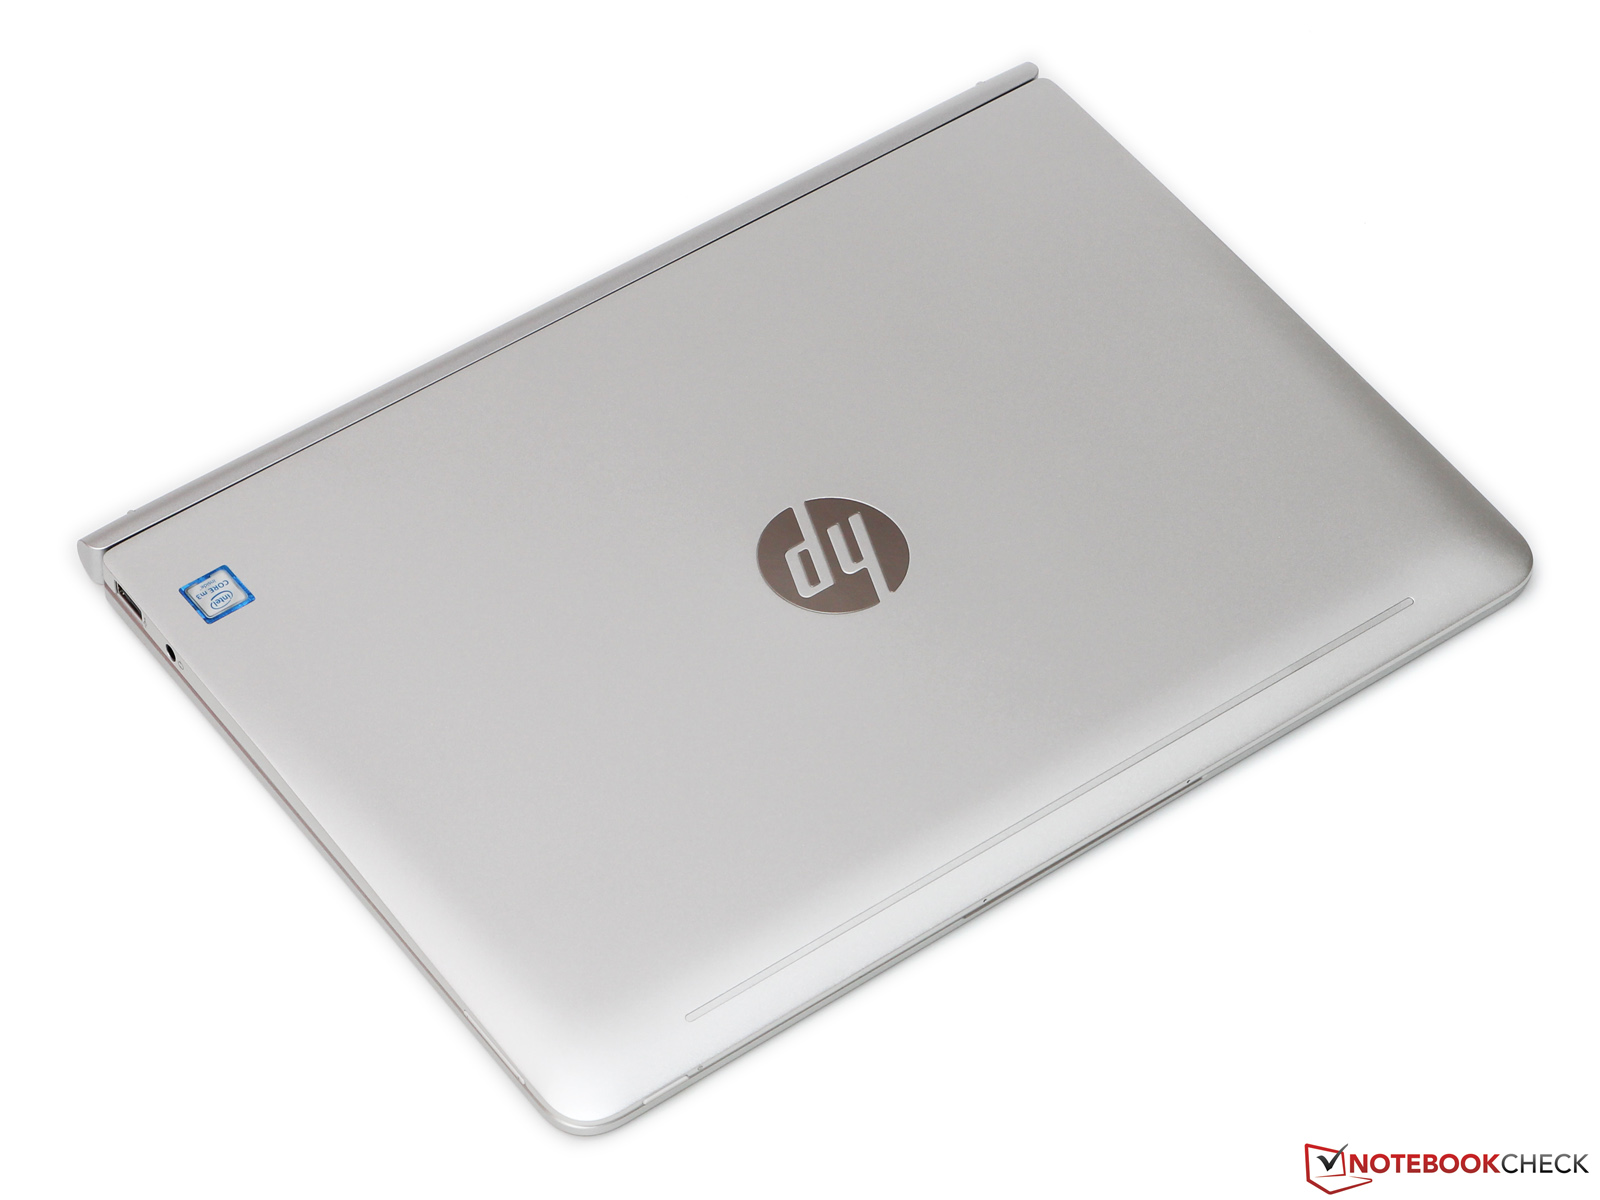
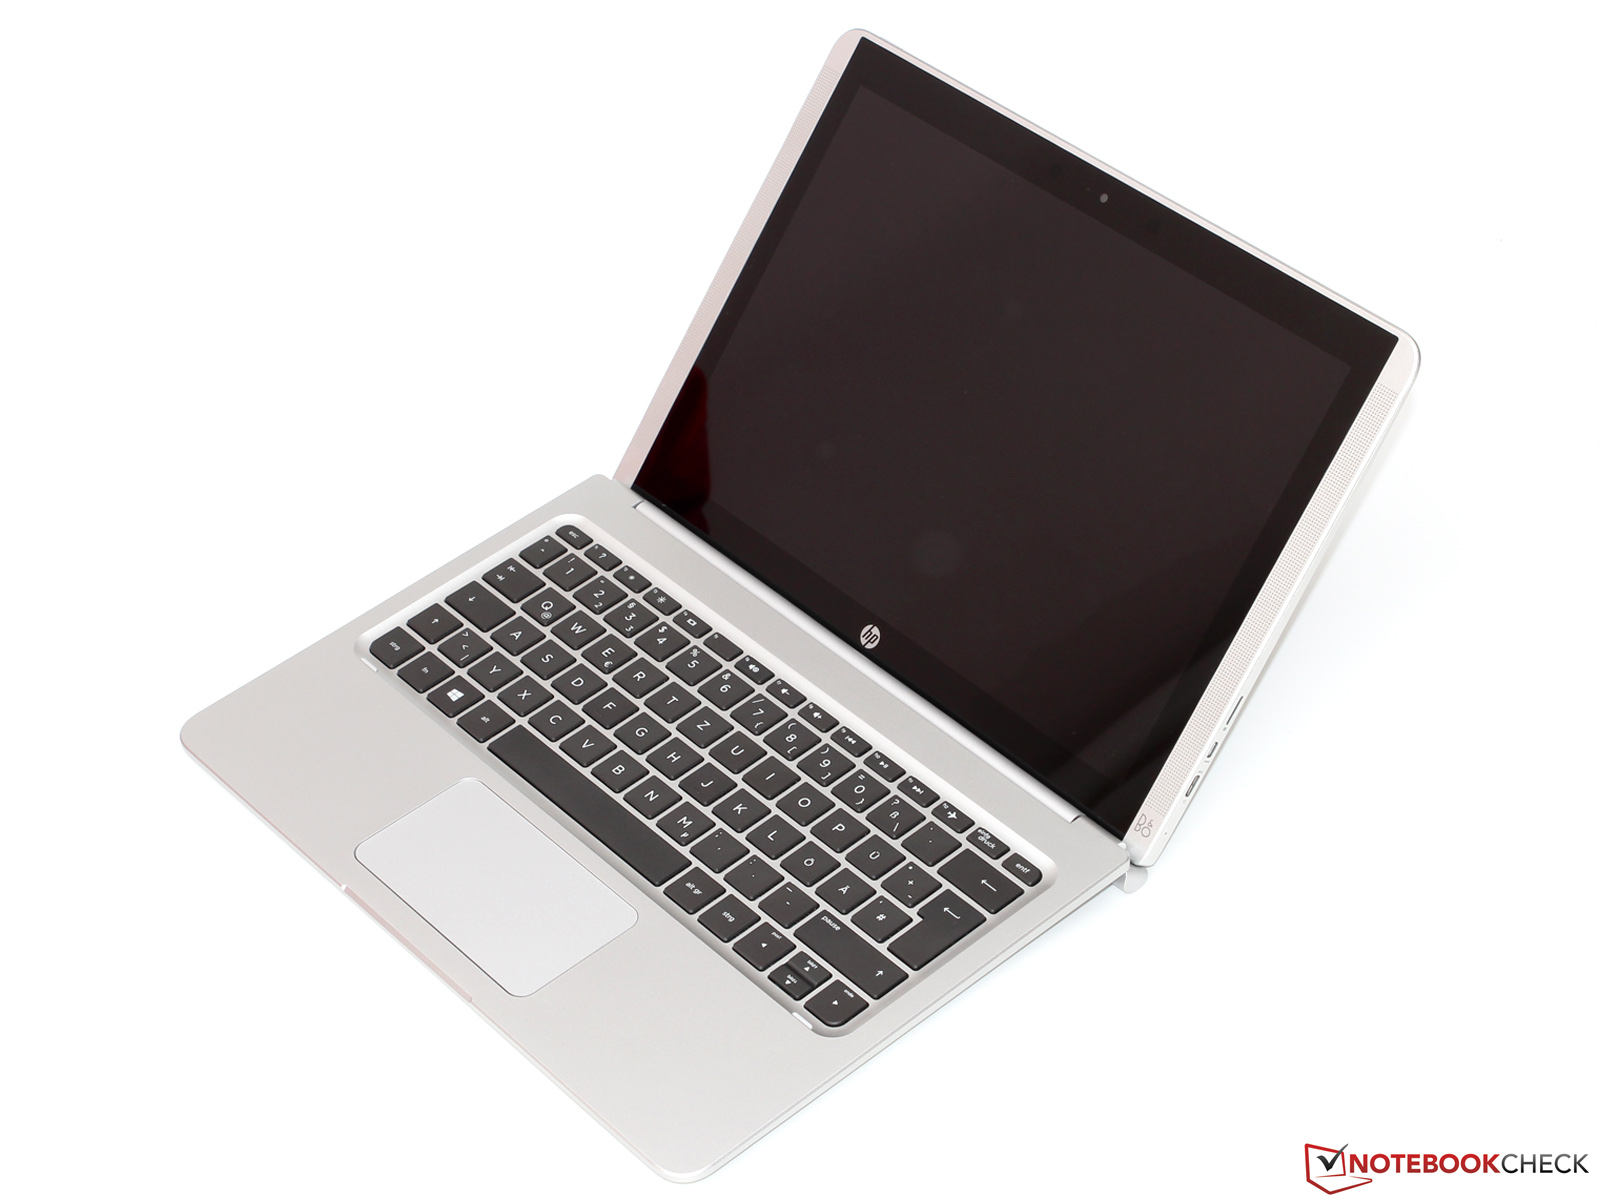
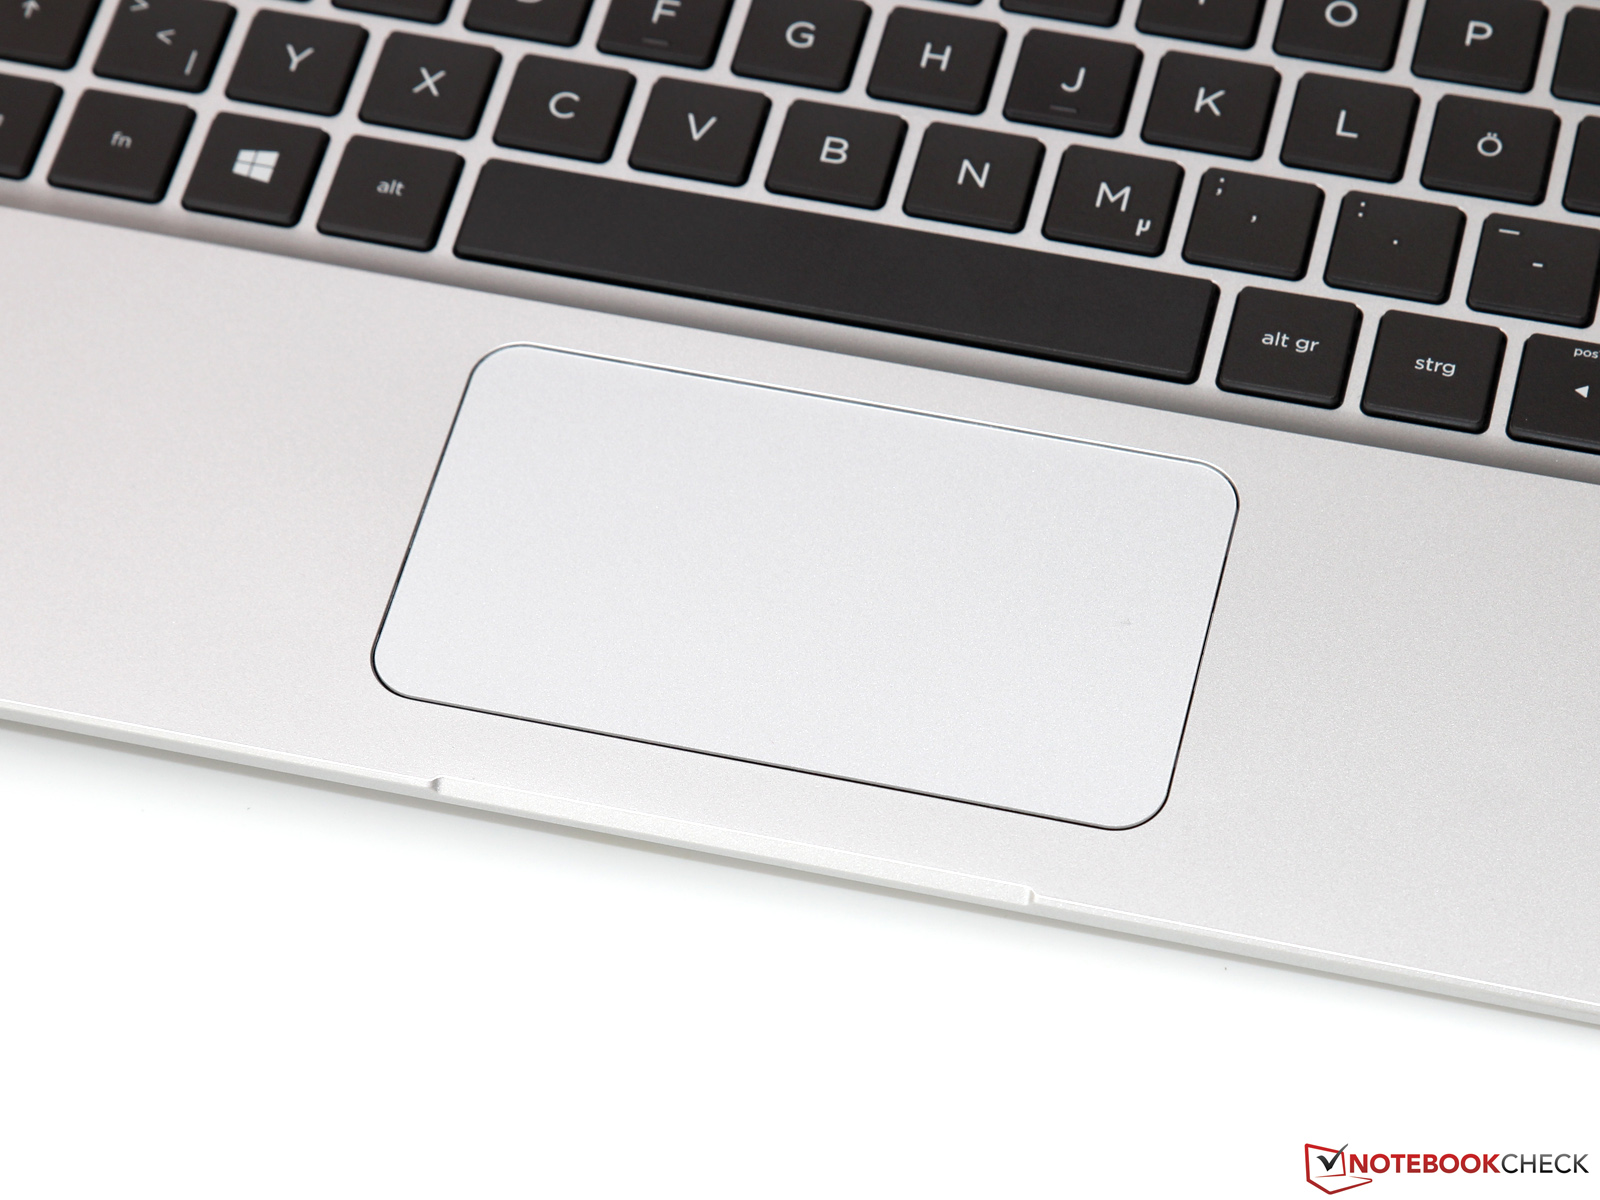
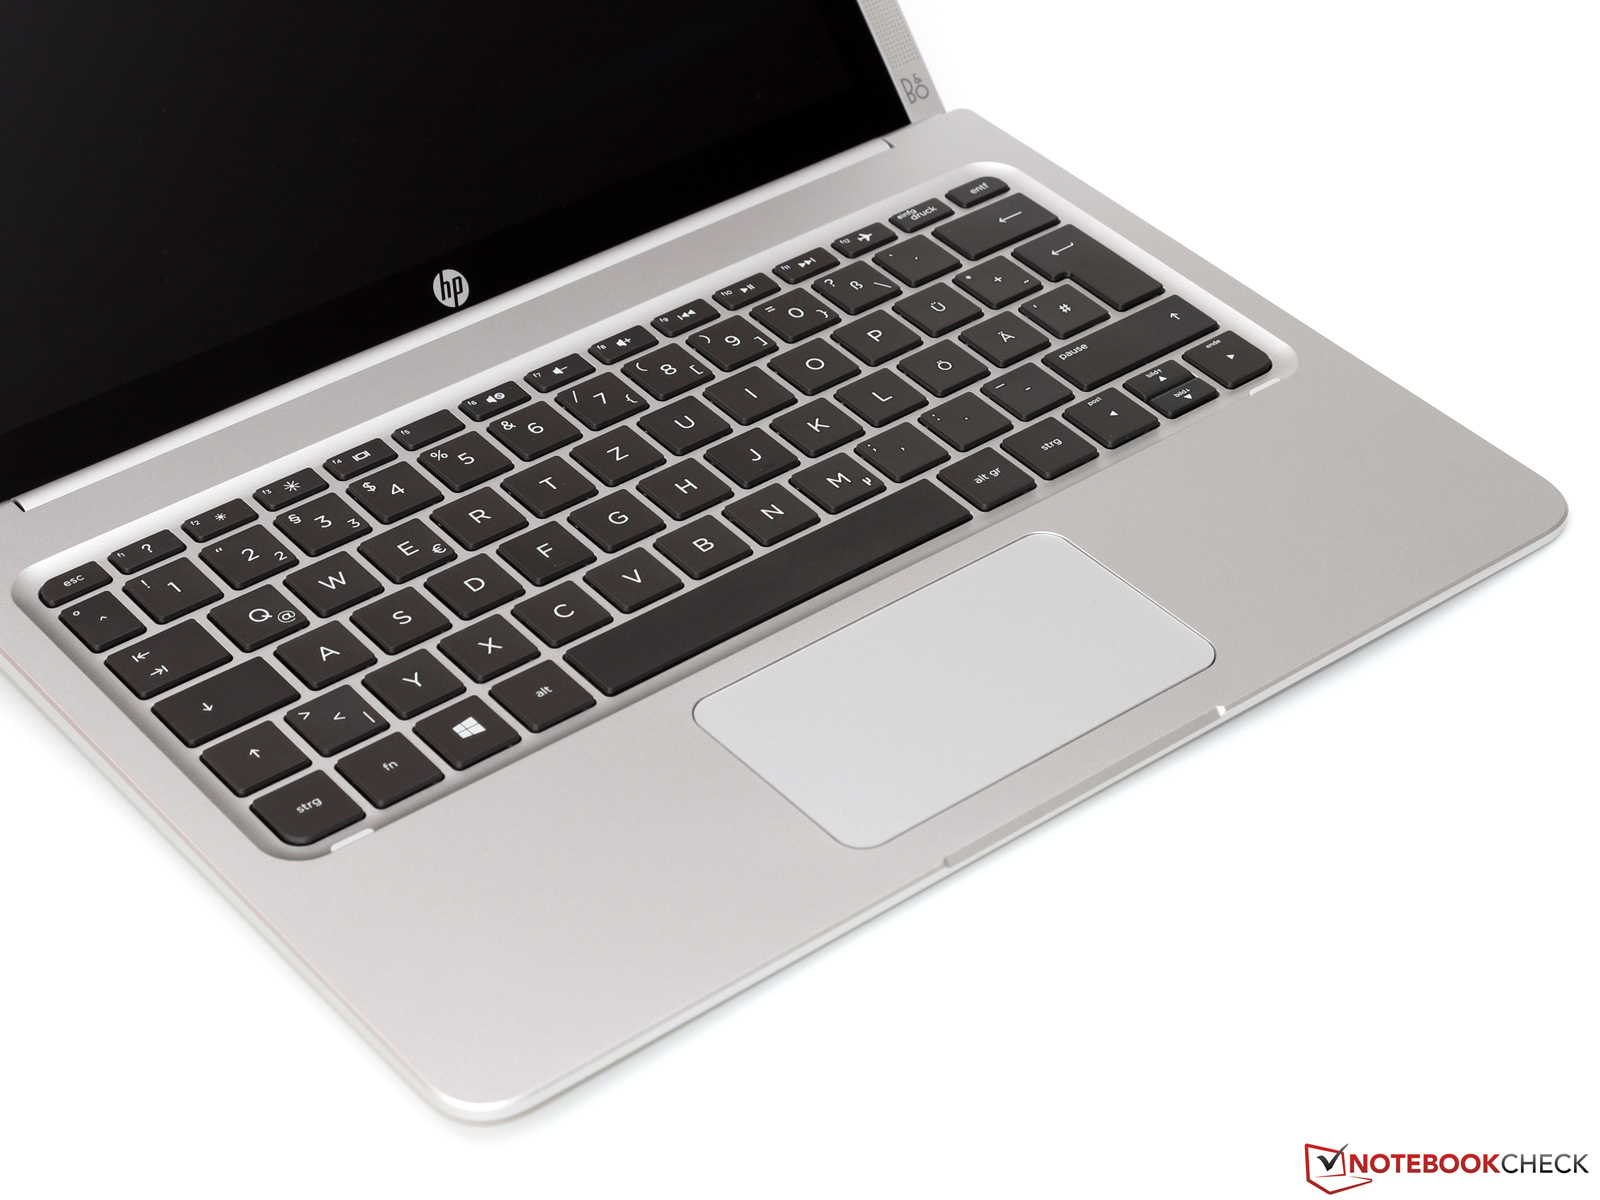
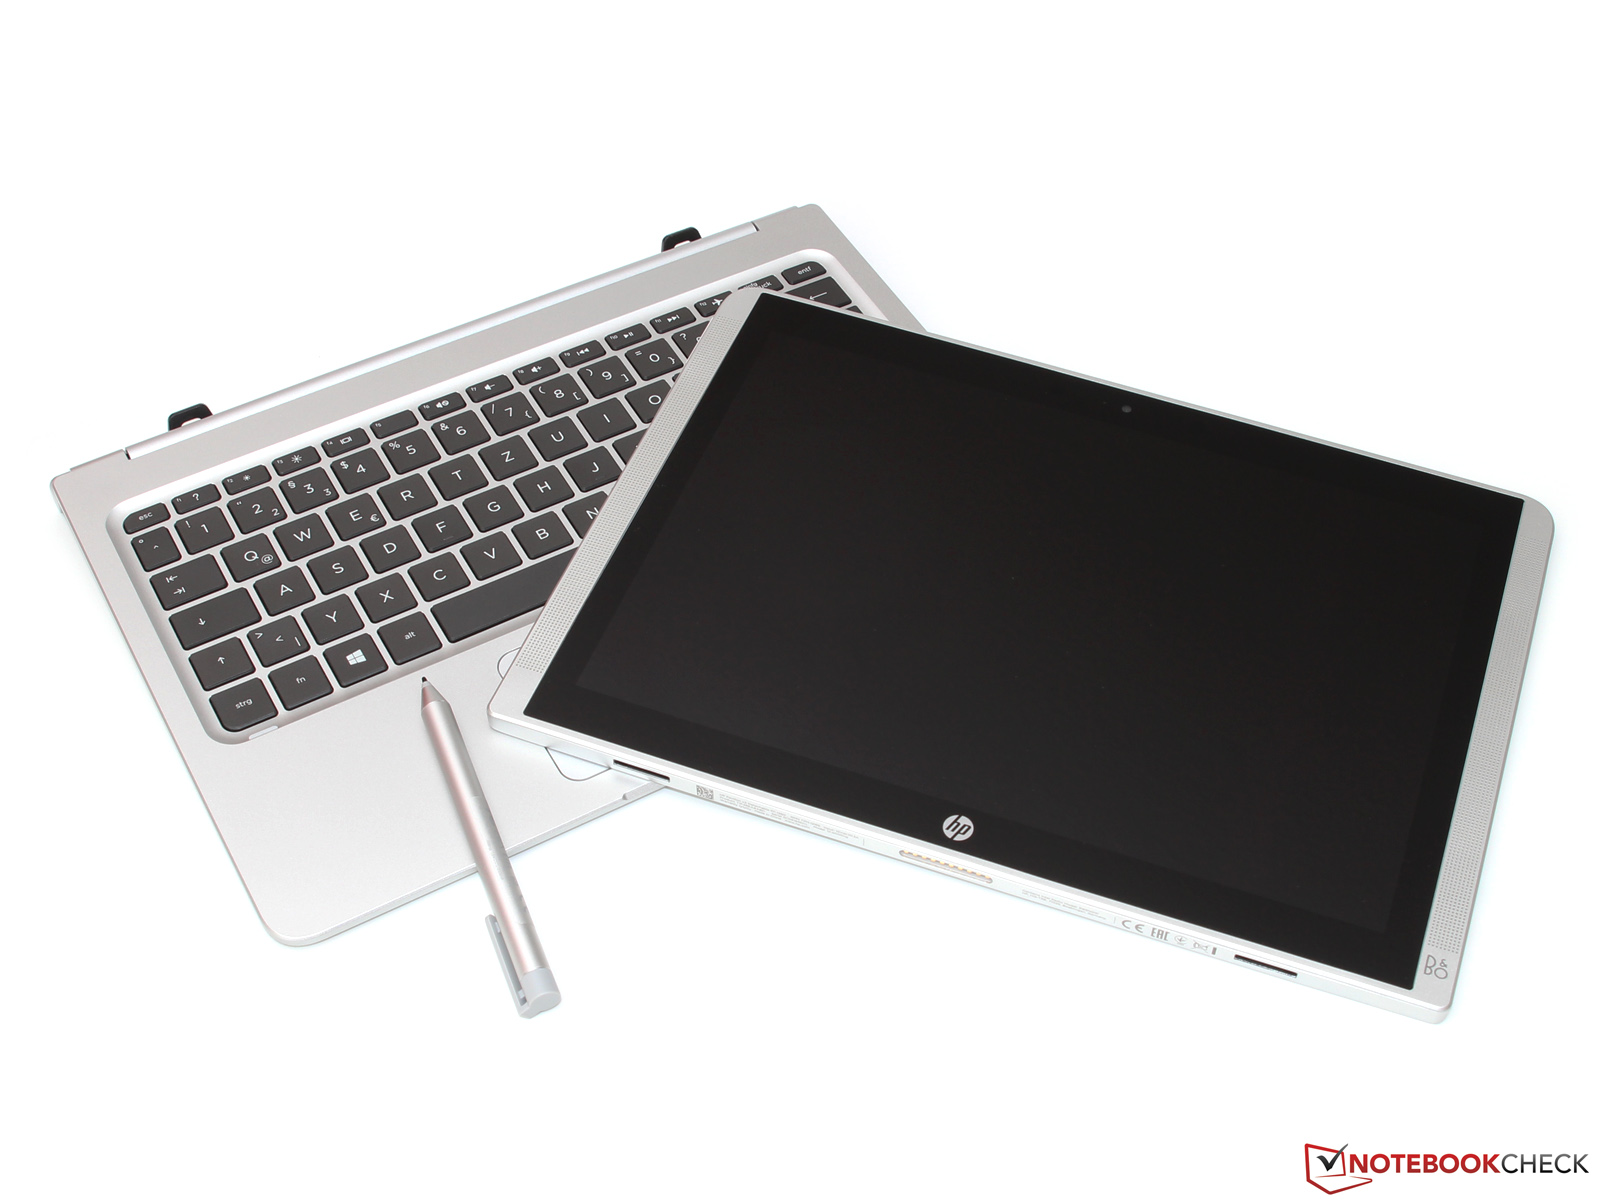
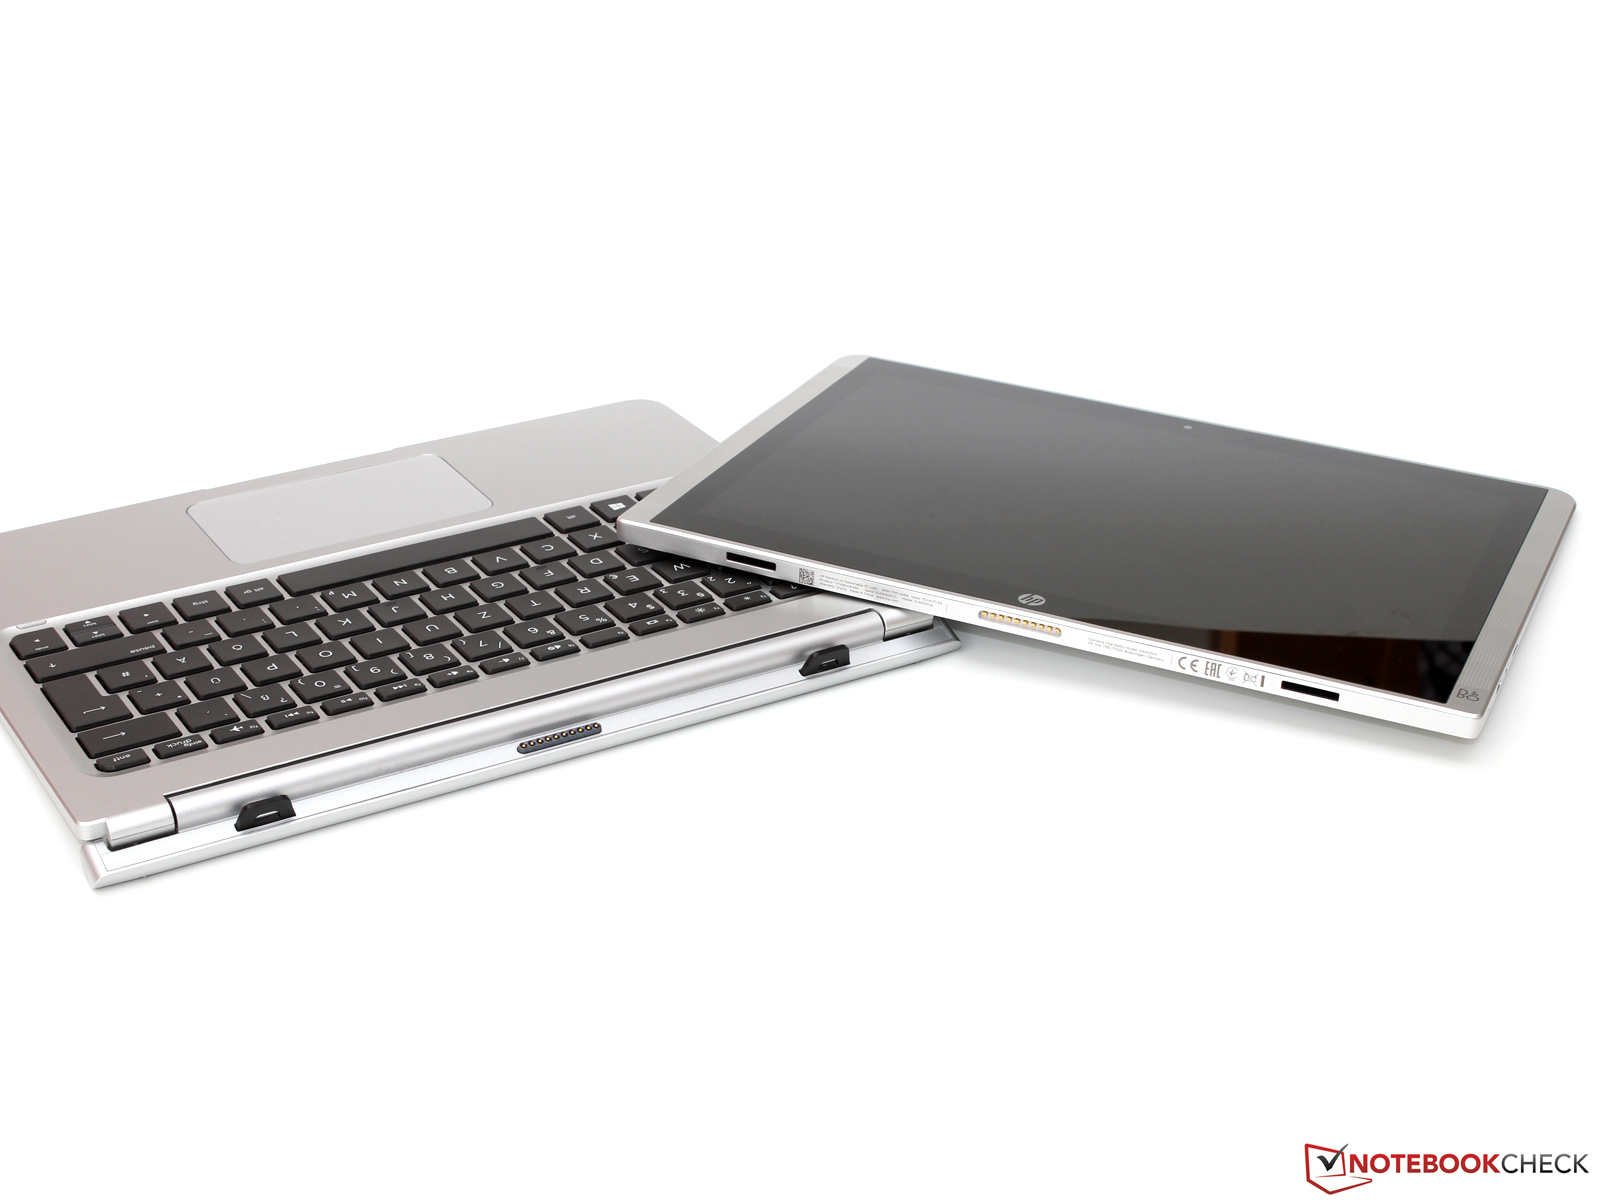
O HP Pavilion x2 12-b000ng é um portátil 2-em-1 comparativamente barato, que ainda consegue competir com rivais mais caros em muitos aspectos. Os destaques do conversível são a dobradiça da tela, um teclado firme, bem como a perfeita utilização do Turbo Boost do processador Core-m. A tela também não é ruim, embora alguns rivais possuam resoluções mais altas. Também é um dos poucos aparelhos neste segmento sem flickering potencial causado pelo controle PWM.
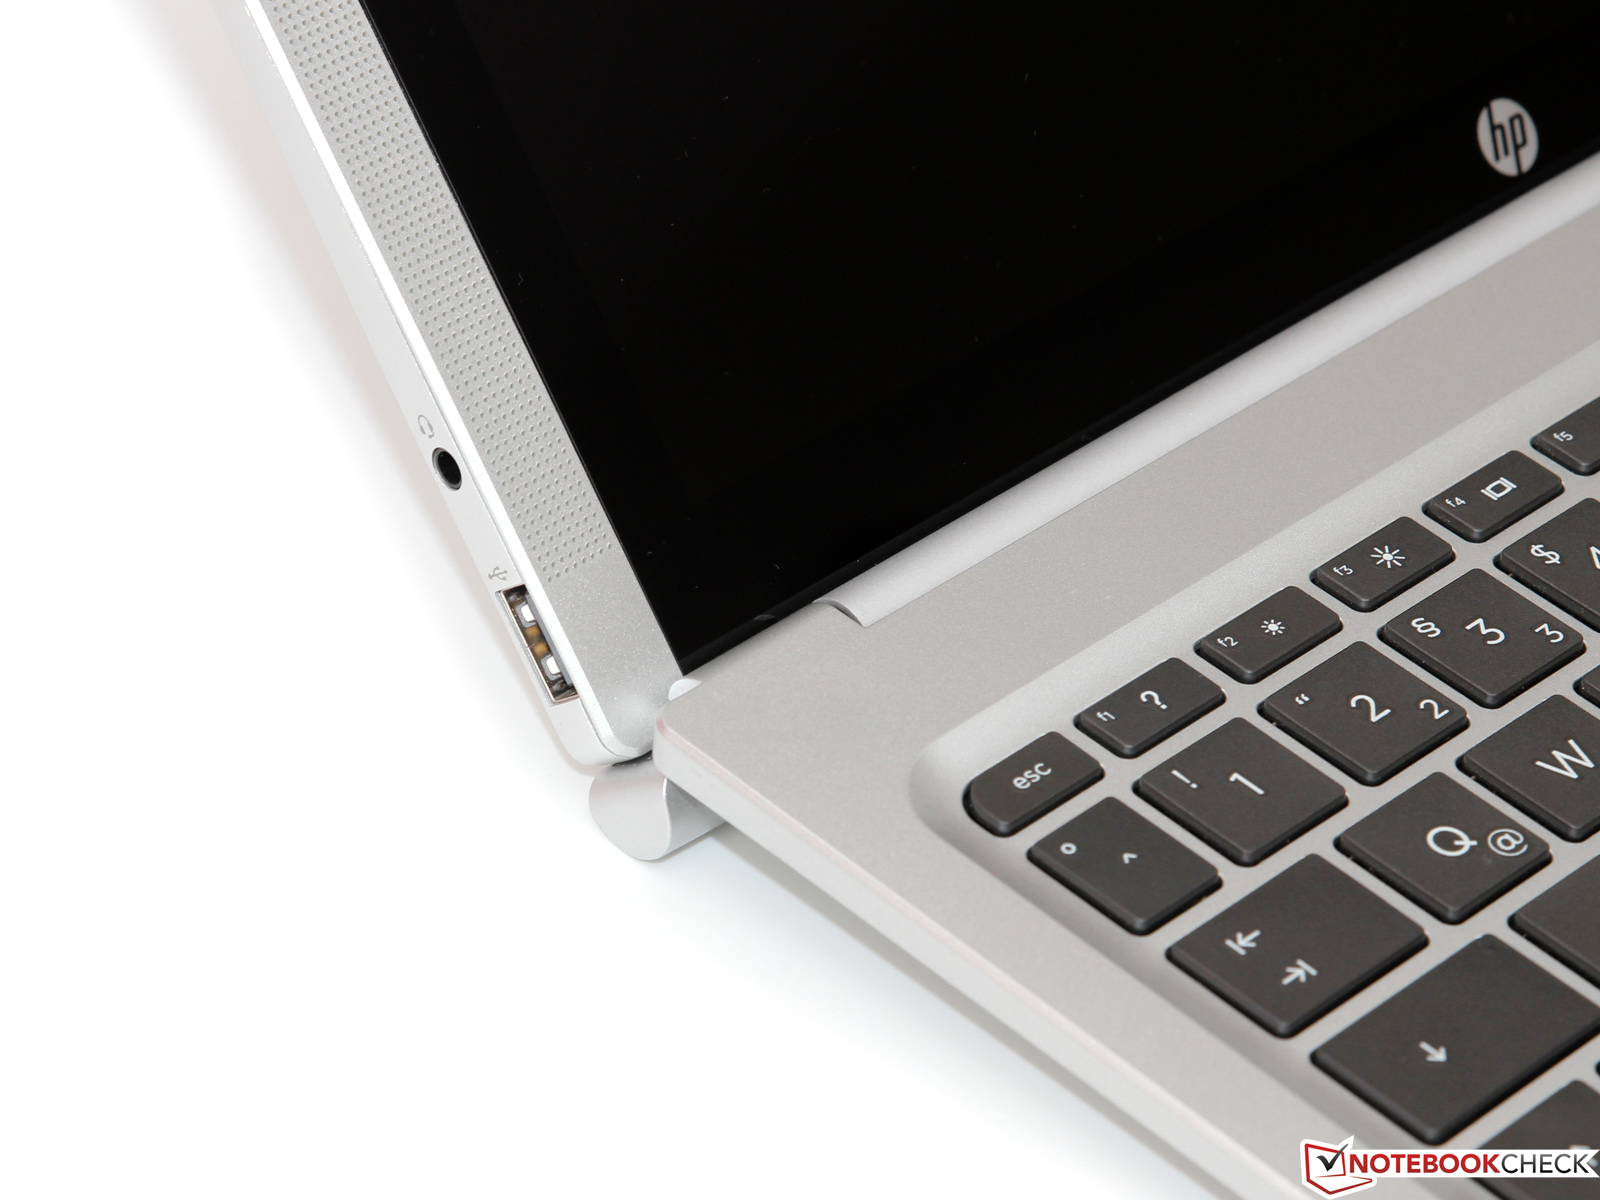
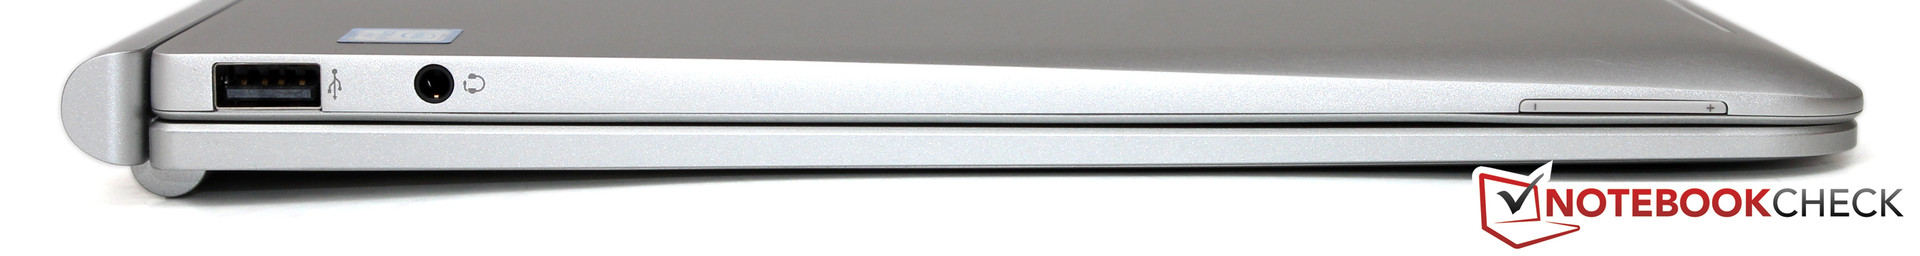
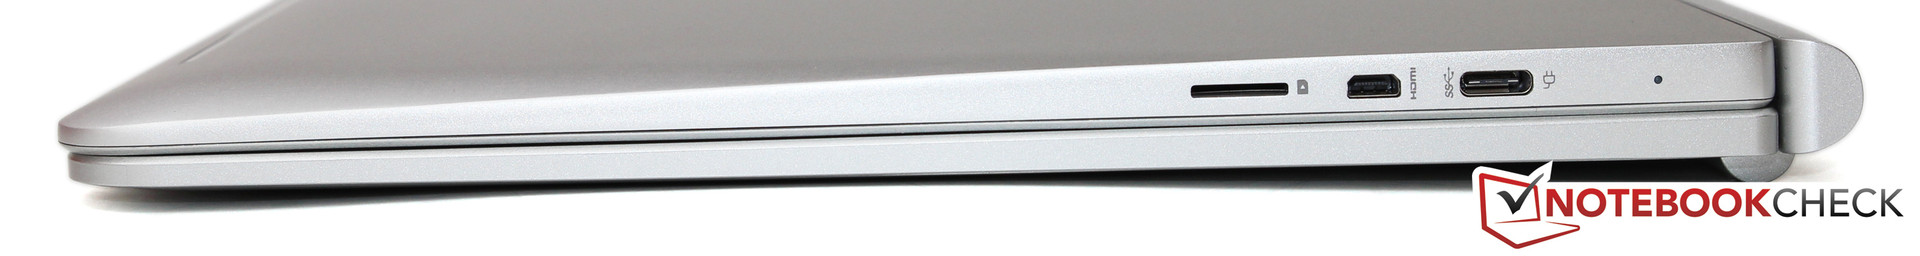
Também encontramos alguns problemas nesta análise, que afetam um pouco a impressão geral. Desde que você consiga viver com o limitado equipamento de memória, bem como com a falta de um módulo LTE considerando o preço, a pobre seleção de portas – nem sequer há uma porta USB 3.0 Type-A – é uma falha bastante irritante do design. Uma capacidade muito superior da bateria, conseguida preferentemente com uma bateria secundária dentro do teclado, também teria sido bom para o sistema.
Em resumo, o Pavilion x2 12 ainda é uma oferta justa por cerca de 700 Euros (~$790) – mas o desempenho não é suficientemente bom para derrotar o mais caro Microsoft Surface Pro 4.
HP Pavilion x2 12-b000ng
- 08/20/2016 v5.1 (old)
Till Schönborn
Price comparison
