Breve Análise do Conversível HP Pavilion x360 13t-u100
| SD Card Reader | |
| average JPG Copy Test (av. of 3 runs) | |
| Lenovo Yoga 3 Pro 13 80HE004LGE | |
| HP Pavilion x360 13t-u100 | |
| Dell Inspiron 13 5368 | |
| maximum AS SSD Seq Read Test (1GB) | |
| HP Pavilion x360 13t-u100 | |
| Lenovo Yoga 3 Pro 13 80HE004LGE | |
| Dell Inspiron 13 5368 | |
| Networking | |
| iperf Server (receive) TCP 1 m 512KB | |
| HP Spectre x360 13-w023dx | |
| Dell Inspiron 13 5368 | |
| HP Pavilion x360 13t-u100 | |
| iperf Client (transmit) TCP 1 m 512KB | |
| HP Spectre x360 13-w023dx | |
| Dell Inspiron 13 5368 | |
| HP Pavilion x360 13t-u100 | |
| |||||||||||||||||||||||||
iluminação: 84 %
iluminação com acumulador: 256.4 cd/m²
Contraste: 712:1 (Preto: 0.36 cd/m²)
ΔE ColorChecker Calman: 6.7 | ∀{0.5-29.43 Ø4.71}
ΔE Greyscale Calman: 5.4 | ∀{0.09-98 Ø4.96}
61% sRGB (Argyll 1.6.3 3D)
39% AdobeRGB 1998 (Argyll 1.6.3 3D)
42.2% AdobeRGB 1998 (Argyll 3D)
61% sRGB (Argyll 3D)
40.81% Display P3 (Argyll 3D)
Gamma: 2.21
CCT: 6235 K
| HP Pavilion x360 13t-u100 LGD052E, IPS, 13.3", 1366x768 | HP Spectre x360 13-w023dx Chi Mei CMN1367, IPS, 13.3", 1920x1080 | Dell Inspiron 13 5368 AUO B133HAB, IPS, 13.3", 1920x1080 | Asus VivoBook Flip TP301UA-DW006T BOE HB133WX1-402, TN, 13.3", 1920x1080 | Lenovo Yoga 3 Pro 13 80HE004LGE Samsung L_LLTN133YL03L01, IPS, 13.3", 3200x1800 | |
|---|---|---|---|---|---|
| Display | 55% | -5% | 2% | 53% | |
| Display P3 Coverage (%) | 40.81 | 65.4 60% | 38.88 -5% | 41.63 2% | 64.6 58% |
| sRGB Coverage (%) | 61 | 90.4 48% | 57.7 -5% | 62.6 3% | 89.5 47% |
| AdobeRGB 1998 Coverage (%) | 42.2 | 65.8 56% | 40.17 -5% | 43.02 2% | 65.5 55% |
| Response Times | 34% | 21% | 55% | 32% | |
| Response Time Grey 50% / Grey 80% * (ms) | 57.2 ? | 33.2 ? 42% | 44 ? 23% | 38 ? 34% | 36 ? 37% |
| Response Time Black / White * (ms) | 37.6 ? | 28 ? 26% | 31 ? 18% | 9 ? 76% | 28 ? 26% |
| PWM Frequency (Hz) | 50 ? | 1330 ? | |||
| Screen | 23% | 17% | 2% | 25% | |
| Brightness middle (cd/m²) | 256.4 | 334.6 30% | 240 -6% | 166 -35% | 314 22% |
| Brightness (cd/m²) | 251 | 319 27% | 229 -9% | 165 -34% | 294 17% |
| Brightness Distribution (%) | 84 | 90 7% | 92 10% | 90 7% | 83 -1% |
| Black Level * (cd/m²) | 0.36 | 0.336 7% | 0.24 33% | 0.44 -22% | 0.57 -58% |
| Contrast (:1) | 712 | 996 40% | 1000 40% | 377 -47% | 551 -23% |
| Colorchecker dE 2000 * | 6.7 | 6.21 7% | 4.75 29% | 4.07 39% | 2.18 67% |
| Colorchecker dE 2000 max. * | 25.5 | 12 53% | 9.09 64% | 6.38 75% | 6.48 75% |
| Greyscale dE 2000 * | 5.4 | 7.71 -43% | 4.3 20% | 3.99 26% | 2.45 55% |
| Gamma | 2.21 100% | 2.36 93% | 2.5 88% | 2.49 88% | 2.39 92% |
| CCT | 6235 104% | 6458 101% | 5893 110% | 7491 87% | 6745 96% |
| Color Space (Percent of AdobeRGB 1998) (%) | 39 | 58.6 50% | 36.79 -6% | 40 3% | 58 49% |
| Color Space (Percent of sRGB) (%) | 61 | 90 48% | 57.39 -6% | 63 3% | 89 46% |
| Média Total (Programa/Configurações) | 37% /
31% | 11% /
13% | 20% /
9% | 37% /
31% |
* ... menor é melhor
Exibir tempos de resposta
| ↔ Tempo de resposta preto para branco | ||
|---|---|---|
| 37.6 ms ... ascensão ↗ e queda ↘ combinadas | ↗ 8.4 ms ascensão | 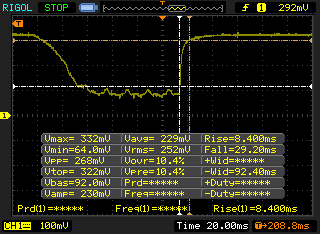 |
| ↘ 29.2 ms queda | ||
| A tela mostra taxas de resposta lentas em nossos testes e será insatisfatória para os jogadores. Em comparação, todos os dispositivos testados variam de 0.1 (mínimo) a 240 (máximo) ms. » 95 % de todos os dispositivos são melhores. Isso significa que o tempo de resposta medido é pior que a média de todos os dispositivos testados (19.8 ms). | ||
| ↔ Tempo de resposta 50% cinza a 80% cinza | ||
| 57.2 ms ... ascensão ↗ e queda ↘ combinadas | ↗ 23.2 ms ascensão | 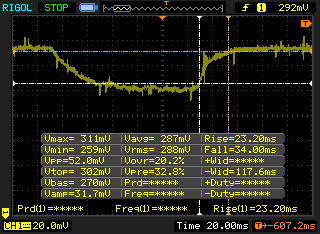 |
| ↘ 34 ms queda | ||
| A tela mostra taxas de resposta lentas em nossos testes e será insatisfatória para os jogadores. Em comparação, todos os dispositivos testados variam de 0.165 (mínimo) a 636 (máximo) ms. » 94 % de todos os dispositivos são melhores. Isso significa que o tempo de resposta medido é pior que a média de todos os dispositivos testados (31 ms). | ||
Cintilação da tela / PWM (modulação por largura de pulso)
| Tela tremeluzindo / PWM não detectado | 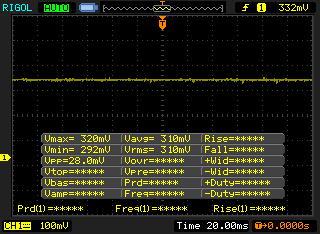 | ||
[pwm_comparison] Em comparação: 52 % de todos os dispositivos testados não usam PWM para escurecer a tela. Se PWM foi detectado, uma média de 7754 (mínimo: 5 - máximo: 343500) Hz foi medida. | |||
| Cinebench R11.5 | |
| CPU Single 64Bit | |
| HP Spectre x360 13-w023dx | |
| HP Pavilion x360 13t-u100 | |
| CPU Multi 64Bit | |
| HP Pavilion x360 13t-u100 | |
| HP Spectre x360 13-w023dx | |
| Cinebench R15 | |
| CPU Single 64Bit | |
| Dell Inspiron 13 5368 | |
| HP Spectre x360 13-w023dx | |
| HP Pavilion x360 13t-u100 | |
| Asus VivoBook Flip TP301UA-DW006T | |
| Lenovo Yoga 3 Pro 13 80HE004LGE | |
| CPU Multi 64Bit | |
| HP Pavilion x360 13t-u100 | |
| HP Spectre x360 13-w023dx | |
| Dell Inspiron 13 5368 | |
| Asus VivoBook Flip TP301UA-DW006T | |
| Lenovo Yoga 3 Pro 13 80HE004LGE | |
| wPrime 2.10 - 1024m | |
| HP Pavilion x360 13t-u100 | |
| HP Spectre x360 13-w023dx | |
| Super Pi Mod 1.5 XS 32M - 32M | |
| HP Pavilion x360 13t-u100 | |
| HP Spectre x360 13-w023dx | |
* ... menor é melhor
| PCMark 8 | |
| Home Score Accelerated v2 | |
| HP Spectre x360 13-w023dx | |
| Dell Inspiron 13 5368 | |
| HP Pavilion x360 13t-u100 | |
| Asus VivoBook Flip TP301UA-DW006T | |
| Lenovo Yoga 3 Pro 13 80HE004LGE | |
| Work Score Accelerated v2 | |
| HP Spectre x360 13-w023dx | |
| HP Pavilion x360 13t-u100 | |
| Dell Inspiron 13 5368 | |
| Asus VivoBook Flip TP301UA-DW006T | |
| Lenovo Yoga 3 Pro 13 80HE004LGE | |
| Creative Score Accelerated v2 | |
| HP Spectre x360 13-w023dx | |
| HP Pavilion x360 13t-u100 | |
| Lenovo Yoga 3 Pro 13 80HE004LGE | |
| PCMark 8 Home Score Accelerated v2 | 3694 pontos | |
| PCMark 8 Creative Score Accelerated v2 | 4365 pontos | |
| PCMark 8 Work Score Accelerated v2 | 4821 pontos | |
Ajuda | ||
| HP Pavilion x360 13t-u100 SanDisk Z400s SD8SNAT-128G | HP Spectre x360 13-w023dx Samsung PM951 NVMe MZVLV512 | Dell Inspiron 13 5368 Toshiba THNSNK256GCS8 | Asus VivoBook Flip TP301UA-DW006T Samsung CM871 MZ7LF128HCHP | Lenovo Yoga 3 Pro 13 80HE004LGE Samsung SSD PM851 MZNTE512HMJH | |
|---|---|---|---|---|---|
| CrystalDiskMark 3.0 | 157% | 35% | -56% | 47% | |
| Read Seq (MB/s) | 516 | 1376 167% | 479 -7% | 396 -23% | 521 1% |
| Write Seq (MB/s) | 185.2 | 571 208% | 270.1 46% | 133.5 -28% | 238.6 29% |
| Read 512 (MB/s) | 335.1 | 679 103% | 428.3 28% | 259.5 -23% | 417.3 25% |
| Write 512 (MB/s) | 179.5 | 571 218% | 267.9 49% | 23.86 -87% | 237.7 32% |
| Read 4k (MB/s) | 21.36 | 42.66 100% | 23.77 11% | 5.783 -73% | 35.9 68% |
| Write 4k (MB/s) | 73 | 137.9 89% | 81.4 12% | 8.507 -88% | 99.9 37% |
| Read 4k QD32 (MB/s) | 145 | 535 269% | 333.6 130% | 97.5 -33% | 366.6 153% |
| Write 4k QD32 (MB/s) | 176.7 | 361.2 104% | 200.9 14% | 8.515 -95% | 236.7 34% |

| 3DMark 11 | |
| 1280x720 Performance GPU | |
| HP Spectre x360 13-w023dx | |
| Dell Inspiron 13 5368 | |
| HP Pavilion x360 13t-u100 | |
| Asus VivoBook Flip TP301UA-DW006T | |
| Lenovo Yoga 3 Pro 13 80HE004LGE | |
| 1280x720 Performance Combined | |
| Dell Inspiron 13 5368 | |
| HP Spectre x360 13-w023dx | |
| HP Pavilion x360 13t-u100 | |
| Asus VivoBook Flip TP301UA-DW006T | |
| Lenovo Yoga 3 Pro 13 80HE004LGE | |
| 3DMark | |
| 1280x720 Cloud Gate Standard Graphics | |
| HP Spectre x360 13-w023dx | |
| Dell Inspiron 13 5368 | |
| HP Pavilion x360 13t-u100 | |
| Asus VivoBook Flip TP301UA-DW006T | |
| Lenovo Yoga 3 Pro 13 80HE004LGE | |
| 1920x1080 Fire Strike Graphics | |
| HP Spectre x360 13-w023dx | |
| HP Pavilion x360 13t-u100 | |
| Lenovo Yoga 3 Pro 13 80HE004LGE | |
| 1920x1080 Ice Storm Extreme Graphics | |
| HP Spectre x360 13-w023dx | |
| HP Pavilion x360 13t-u100 | |
| 3DMark 11 Performance | 1523 pontos | |
| 3DMark Ice Storm Standard Score | 44760 pontos | |
| 3DMark Cloud Gate Standard Score | 5061 pontos | |
| 3DMark Fire Strike Score | 653 pontos | |
Ajuda | ||
| Rise of the Tomb Raider | |
| 1024x768 Lowest Preset (classificar por valor) | |
| HP Pavilion x360 13t-u100 | |
| HP Spectre x360 13-w023dx | |
| Dell Inspiron 13 5368 | |
| Asus VivoBook Flip TP301UA-DW006T | |
| Lenovo Yoga 3 Pro 13 80HE004LGE | |
| 1366x768 Medium Preset AF:2x (classificar por valor) | |
| HP Pavilion x360 13t-u100 | |
| HP Spectre x360 13-w023dx | |
| Dell Inspiron 13 5368 | |
| Asus VivoBook Flip TP301UA-DW006T | |
| Lenovo Yoga 3 Pro 13 80HE004LGE | |
| BioShock Infinite | |
| 1280x720 Very Low Preset (classificar por valor) | |
| HP Pavilion x360 13t-u100 | |
| HP Spectre x360 13-w023dx | |
| Dell Inspiron 13 5368 | |
| Asus VivoBook Flip TP301UA-DW006T | |
| Lenovo Yoga 3 Pro 13 80HE004LGE | |
| 1366x768 Medium Preset (classificar por valor) | |
| HP Pavilion x360 13t-u100 | |
| HP Spectre x360 13-w023dx | |
| Dell Inspiron 13 5368 | |
| Asus VivoBook Flip TP301UA-DW006T | |
| Lenovo Yoga 3 Pro 13 80HE004LGE | |
| baixo | média | alto | ultra | |
|---|---|---|---|---|
| BioShock Infinite (2013) | 43 | 25 | 20 | |
| Rise of the Tomb Raider (2016) | 17 | 10 |
Barulho
| Ocioso |
| 28.9 / 28.9 / 29.2 dB |
| Carga |
| 36 / 40.3 dB |
 | ||
30 dB silencioso 40 dB(A) audível 50 dB(A) ruidosamente alto |
||
min: | ||
| HP Pavilion x360 13t-u100 HD Graphics 620, i5-7200U, SanDisk Z400s SD8SNAT-128G | HP Spectre x360 13-w023dx HD Graphics 620, i7-7500U, Samsung PM951 NVMe MZVLV512 | Dell Inspiron 13 5368 HD Graphics 520, 6500U, Toshiba THNSNK256GCS8 | Asus VivoBook Flip TP301UA-DW006T HD Graphics 520, 6100U, Samsung CM871 MZ7LF128HCHP | Lenovo Yoga 3 Pro 13 80HE004LGE HD Graphics 5300, 5Y70, Samsung SSD PM851 MZNTE512HMJH | |
|---|---|---|---|---|---|
| Noise | -2% | 3% | -3% | -1% | |
| desligado / ambiente * (dB) | 28.9 | 29.1 -1% | 29 -0% | 31 -7% | 31.2 -8% |
| Idle Minimum * (dB) | 28.9 | 29.1 -1% | 29 -0% | 31.3 -8% | 31.2 -8% |
| Idle Average * (dB) | 28.9 | 29.1 -1% | 29 -0% | 31.3 -8% | 31.4 -9% |
| Idle Maximum * (dB) | 29.2 | 31.2 -7% | 29 1% | 32.9 -13% | 31.8 -9% |
| Load Average * (dB) | 36 | 37.3 -4% | 31 14% | 35 3% | 32.3 10% |
| Load Maximum * (dB) | 40.3 | 39.6 2% | 40.3 -0% | 34.9 13% | 32 21% |
* ... menor é melhor
(±) A temperatura máxima no lado superior é 42 °C / 108 F, em comparação com a média de 35.4 °C / 96 F , variando de 19.6 a 60 °C para a classe Convertible.
(-) A parte inferior aquece até um máximo de 49 °C / 120 F, em comparação com a média de 36.9 °C / 98 F
(+) Em uso inativo, a temperatura média para o lado superior é 22.7 °C / 73 F, em comparação com a média do dispositivo de 30.3 °C / ### class_avg_f### F.
(+) Os apoios para as mãos e o touchpad são mais frios que a temperatura da pele, com um máximo de 22.2 °C / 72 F e, portanto, são frios ao toque.
(+) A temperatura média da área do apoio para as mãos de dispositivos semelhantes foi 28 °C / 82.4 F (+5.8 °C / 10.4 F).
HP Pavilion x360 13t-u100 análise de áudio
(±) | o volume do alto-falante é médio, mas bom (###valor### dB)
Graves 100 - 315Hz
(-) | quase nenhum baixo - em média 22.2% menor que a mediana
(±) | a linearidade dos graves é média (11.9% delta para a frequência anterior)
Médios 400 - 2.000 Hz
(±) | médios mais altos - em média 5.4% maior que a mediana
(±) | a linearidade dos médios é média (8% delta para frequência anterior)
Altos 2 - 16 kHz
(+) | agudos equilibrados - apenas 3.6% longe da mediana
(±) | a linearidade dos máximos é média (9.6% delta para frequência anterior)
Geral 100 - 16.000 Hz
(±) | a linearidade do som geral é média (27.6% diferença em relação à mediana)
Comparado com a mesma classe
» 84% de todos os dispositivos testados nesta classe foram melhores, 3% semelhantes, 13% piores
» O melhor teve um delta de 6%, a média foi 20%, o pior foi 57%
Comparado com todos os dispositivos testados
» 84% de todos os dispositivos testados foram melhores, 3% semelhantes, 13% piores
» O melhor teve um delta de 4%, a média foi 23%, o pior foi 134%
HP Spectre x360 13-w023dx análise de áudio
(±) | o volume do alto-falante é médio, mas bom (###valor### dB)
Graves 100 - 315Hz
(-) | quase nenhum baixo - em média 17% menor que a mediana
(±) | a linearidade dos graves é média (12.7% delta para a frequência anterior)
Médios 400 - 2.000 Hz
(+) | médios equilibrados - apenas 3.7% longe da mediana
(+) | médios são lineares (6.3% delta para frequência anterior)
Altos 2 - 16 kHz
(+) | agudos equilibrados - apenas 2.4% longe da mediana
(±) | a linearidade dos máximos é média (7.2% delta para frequência anterior)
Geral 100 - 16.000 Hz
(±) | a linearidade do som geral é média (21.9% diferença em relação à mediana)
Comparado com a mesma classe
» 63% de todos os dispositivos testados nesta classe foram melhores, 7% semelhantes, 30% piores
» O melhor teve um delta de 6%, a média foi 20%, o pior foi 57%
Comparado com todos os dispositivos testados
» 63% de todos os dispositivos testados foram melhores, 7% semelhantes, 30% piores
» O melhor teve um delta de 4%, a média foi 23%, o pior foi 134%
| desligado | |
| Ocioso | |
| Carga |
|
Key:
min: | |
| HP Pavilion x360 13t-u100 i5-7200U, HD Graphics 620, SanDisk Z400s SD8SNAT-128G, IPS, 1366x768, 13.3" | HP Spectre x360 13-w023dx i7-7500U, HD Graphics 620, Samsung PM951 NVMe MZVLV512, IPS, 1920x1080, 13.3" | Dell Inspiron 13 5368 6500U, HD Graphics 520, Toshiba THNSNK256GCS8, IPS, 1920x1080, 13.3" | Asus VivoBook Flip TP301UA-DW006T 6100U, HD Graphics 520, Samsung CM871 MZ7LF128HCHP, TN, 1920x1080, 13.3" | Lenovo Yoga 3 Pro 13 80HE004LGE 5Y70, HD Graphics 5300, Samsung SSD PM851 MZNTE512HMJH, IPS, 3200x1800, 13.3" | |
|---|---|---|---|---|---|
| Power Consumption | -25% | -11% | 7% | -25% | |
| Idle Minimum * (Watt) | 3.7 | 5.5 -49% | 4.4 -19% | 2.95 20% | 4.8 -30% |
| Idle Average * (Watt) | 6 | 6.7 -12% | 6.1 -2% | 5.6 7% | 10.7 -78% |
| Idle Maximum * (Watt) | 6.9 | 7.1 -3% | 6.8 1% | 7.7 -12% | 11.8 -71% |
| Load Average * (Watt) | 23.4 | 33.1 -41% | 29 -24% | 22.6 3% | 18.3 22% |
| Load Maximum * (Watt) | 28.8 | 35.2 -22% | 31.9 -11% | 23.5 18% | 19.7 32% |
* ... menor é melhor
| HP Pavilion x360 13t-u100 i5-7200U, HD Graphics 620, 43 Wh | HP Spectre x360 13-w023dx i7-7500U, HD Graphics 620, 57.8 Wh | Dell Inspiron 13 5368 6500U, HD Graphics 520, 42 Wh | Asus VivoBook Flip TP301UA-DW006T 6100U, HD Graphics 520, 55 Wh | Lenovo Yoga 3 Pro 13 80HE004LGE 5Y70, HD Graphics 5300, 44 Wh | |
|---|---|---|---|---|---|
| Duração da bateria | 35% | -25% | 39% | -33% | |
| Reader / Idle (h) | 14.7 | 20.6 40% | 11.2 -24% | 21 43% | |
| WiFi v1.3 (h) | 6.6 | 9.3 41% | 4 -39% | 4.8 -27% | 4.4 -33% |
| Load (h) | 1.6 | 2 25% | 1.4 -13% | 3.2 100% |
Pro
Contra


O Pavilion x360 13t-u100 é uma máquina sólida para um usuário alvo em particular, mas não sem seus compromissos. Especificamente, vale a pena considera-lo para alguém que não se preocupe muito com a qualidade da carcaça e com a durabilidade, manutenção flexível e atualizações, ou amenidades do grau de Ultrabooks de gama alta (como telas com resolução de 1080p+ , armazenamento NVMe, e duração da bateria excepcionalmente longa). Também existem outras desvantagens significantes, como a conectividades wireless abaixo da média e a falta de uma alternativa Ethernet. Dificilmente é o pacote completo, mas novamente, isso não é o que qualquer um deve estar esperando, especialmente por esse preço (atualmente $ 665 na Amazon).
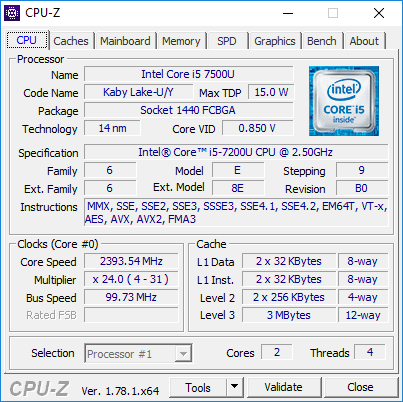
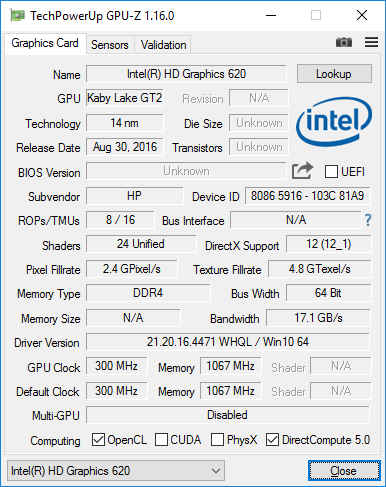
Mas o que você recebe por esse preço é um ótimo desempenho da CPU (de um Core i5 Kaby Lake neste caso) sem afogamento, temperaturas razoáveis da carcaça (além de uma ventoinha com ruído agudo), SSD, e muita RAM para o uso geral — tudo parte de um conversível um pouco prático com peso e tamanho manuseável (especialmente quando comparado com o Envy x360 de 15,6 polegadas que analisamos o mês passado). Por isso, finalmente, aqueles procurando um conversível sem frescuras para o uso geral, mas que ainda são suficientemente economizadores para apreciar a velocidade e confiabilidade oferecida por um SSD, podem ver algo de valor aqui.
HP Pavilion x360 13t-u100
- 01/08/2017 v6 (old)
Steve Schardein
Price comparison
