Breve Análise do Conversível HP Pavilion x360 (Core i3-8130U, SSD de 256 GB)


| SD Card Reader | |
| average JPG Copy Test (av. of 3 runs) | |
| HP Pavilion x360 14-ba011ng (Toshiba Exceria Pro SDXC 64 GB UHS-II) | |
| Lenovo Yoga 520-14IKB 80X80097GE (Toshiba Exceria Pro SDXC 64 GB UHS-II) | |
| HP Pavilion x360 14-cd0002ng (Toshiba Exceria Pro SDXC 64 GB UHS-II) | |
| Média da turma Convertible (28.1 - 197, n=23, últimos 2 anos) | |
| Asus VivoBook Flip 14 TP410UA-EC242T (Toshiba Exceria Pro SDXC 64 GB UHS-II) | |
| Acer Spin 3 SP314-51-548L (Toshiba Exceria Pro SDXC 64 GB UHS-II) | |
| maximum AS SSD Seq Read Test (1GB) | |
| Média da turma Convertible (28.9 - 254, n=22, últimos 2 anos) | |
| Lenovo Yoga 520-14IKB 80X80097GE (Toshiba Exceria Pro SDXC 64 GB UHS-II) | |
| HP Pavilion x360 14-ba011ng (Toshiba Exceria Pro SDXC 64 GB UHS-II) | |
| HP Pavilion x360 14-cd0002ng (Toshiba Exceria Pro SDXC 64 GB UHS-II) | |
| Asus VivoBook Flip 14 TP410UA-EC242T (Toshiba Exceria Pro SDXC 64 GB UHS-II) | |
| Acer Spin 3 SP314-51-548L (Toshiba Exceria Pro SDXC 64 GB UHS-II) | |
| Networking | |
| iperf3 transmit AX12 | |
| Asus VivoBook Flip 14 TP410UA-EC242T | |
| HP Pavilion x360 14-ba011ng | |
| Lenovo Yoga 520-14IKB 80X80097GE | |
| HP Pavilion x360 14-cd0002ng | |
| Acer Spin 3 SP314-51-548L | |
| iperf3 receive AX12 | |
| Acer Spin 3 SP314-51-548L | |
| Asus VivoBook Flip 14 TP410UA-EC242T | |
| HP Pavilion x360 14-ba011ng | |
| Lenovo Yoga 520-14IKB 80X80097GE | |
| HP Pavilion x360 14-cd0002ng | |
| |||||||||||||||||||||||||
iluminação: 72 %
iluminação com acumulador: 218 cd/m²
Contraste: 1607:1 (Preto: 0.14 cd/m²)
ΔE ColorChecker Calman: 5.44 | ∀{0.5-29.43 Ø4.73}
ΔE Greyscale Calman: 3.98 | ∀{0.09-98 Ø4.97}
62% sRGB (Argyll 1.6.3 3D)
39% AdobeRGB 1998 (Argyll 1.6.3 3D)
42.74% AdobeRGB 1998 (Argyll 3D)
61.8% sRGB (Argyll 3D)
41.32% Display P3 (Argyll 3D)
Gamma: 2.32
CCT: 6163 K
| HP Pavilion x360 14-cd0002ng Chi Mei CMN14D9, , 1920x1080, 14" | HP Pavilion x360 14-ba011ng Chi Mei, , 1920x1080, 14" | Lenovo Yoga 520-14IKB 80X80097GE BOE NV140FHM-N49, , 1920x1080, 14" | Asus VivoBook Flip 14 TP410UA-EC242T Chi Mei N140HCE-EN1, , 1920x1080, 14" | Acer Spin 3 SP314-51-548L BOE CQ NV140FHM-N41, , 1920x1080, 14" | |
|---|---|---|---|---|---|
| Display | 1% | -4% | 59% | -4% | |
| Display P3 Coverage (%) | 41.32 | 41.82 1% | 39.76 -4% | 66.7 61% | 39.68 -4% |
| sRGB Coverage (%) | 61.8 | 61.6 0% | 59.3 -4% | 96.6 56% | 58.9 -5% |
| AdobeRGB 1998 Coverage (%) | 42.74 | 43.33 1% | 41.08 -4% | 68.9 61% | 41 -4% |
| Response Times | 17% | -10% | 13% | -8% | |
| Response Time Grey 50% / Grey 80% * (ms) | 44 ? | 41 ? 7% | 47 ? -7% | 34 ? 23% | 43 ? 2% |
| Response Time Black / White * (ms) | 30 ? | 22 ? 27% | 34 ? -13% | 29 ? 3% | 35 ? -17% |
| PWM Frequency (Hz) | 2439 ? | 25000 ? | 347 ? | 24750 ? | 1000 |
| Screen | -12% | 8% | 29% | 10% | |
| Brightness middle (cd/m²) | 225 | 252 12% | 255 13% | 327 45% | 220 -2% |
| Brightness (cd/m²) | 195 | 237 22% | 247 27% | 308 58% | 221 13% |
| Brightness Distribution (%) | 72 | 90 25% | 83 15% | 90 25% | 78 8% |
| Black Level * (cd/m²) | 0.14 | 0.21 -50% | 0.21 -50% | 0.23 -64% | 0.18 -29% |
| Contrast (:1) | 1607 | 1200 -25% | 1214 -24% | 1422 -12% | 1222 -24% |
| Colorchecker dE 2000 * | 5.44 | 7.29 -34% | 4.5 17% | 2.63 52% | 3.98 27% |
| Colorchecker dE 2000 max. * | 20.38 | 17.55 14% | 7.21 65% | 6.58 68% | 7.69 62% |
| Greyscale dE 2000 * | 3.98 | 7.48 -88% | 2.96 26% | 4.11 -3% | 1.68 58% |
| Gamma | 2.32 95% | 2.45 90% | 2.3 96% | 2.45 90% | 2.37 93% |
| CCT | 6163 105% | 6953 93% | 6965 93% | 7352 88% | 6382 102% |
| Color Space (Percent of AdobeRGB 1998) (%) | 39 | 40 3% | 38 -3% | 63 62% | 38 -3% |
| Color Space (Percent of sRGB) (%) | 62 | 61 -2% | 59 -5% | 97 56% | 58 -6% |
| Colorchecker dE 2000 calibrated * | 4 | ||||
| Média Total (Programa/Configurações) | 2% /
-6% | -2% /
3% | 34% /
33% | -1% /
5% |
* ... menor é melhor
Exibir tempos de resposta
| ↔ Tempo de resposta preto para branco | ||
|---|---|---|
| 30 ms ... ascensão ↗ e queda ↘ combinadas | ↗ 17 ms ascensão | 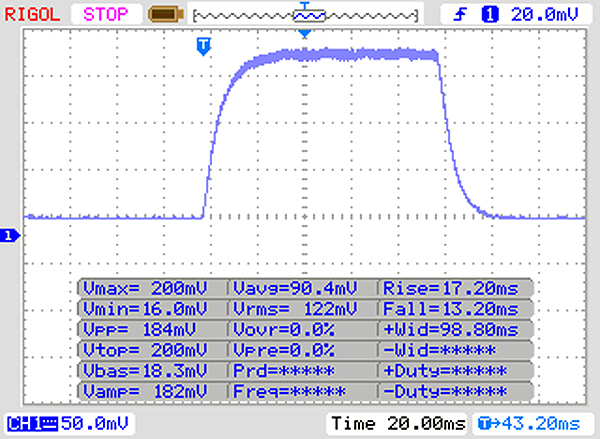 |
| ↘ 13 ms queda | ||
| A tela mostra taxas de resposta lentas em nossos testes e será insatisfatória para os jogadores. Em comparação, todos os dispositivos testados variam de 0.1 (mínimo) a 240 (máximo) ms. » 80 % de todos os dispositivos são melhores. Isso significa que o tempo de resposta medido é pior que a média de todos os dispositivos testados (19.9 ms). | ||
| ↔ Tempo de resposta 50% cinza a 80% cinza | ||
| 44 ms ... ascensão ↗ e queda ↘ combinadas | ↗ 24 ms ascensão | 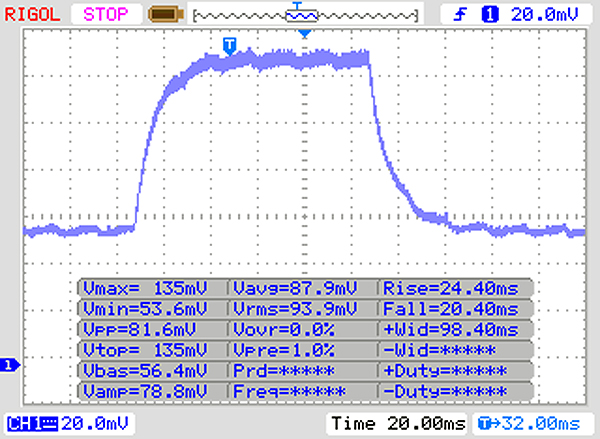 |
| ↘ 20 ms queda | ||
| A tela mostra taxas de resposta lentas em nossos testes e será insatisfatória para os jogadores. Em comparação, todos os dispositivos testados variam de 0.165 (mínimo) a 636 (máximo) ms. » 73 % de todos os dispositivos são melhores. Isso significa que o tempo de resposta medido é pior que a média de todos os dispositivos testados (31.1 ms). | ||
Cintilação da tela / PWM (modulação por largura de pulso)
| Tela tremeluzindo/PWM detectado | 2439 Hz | ≤ 30 % configuração de brilho | 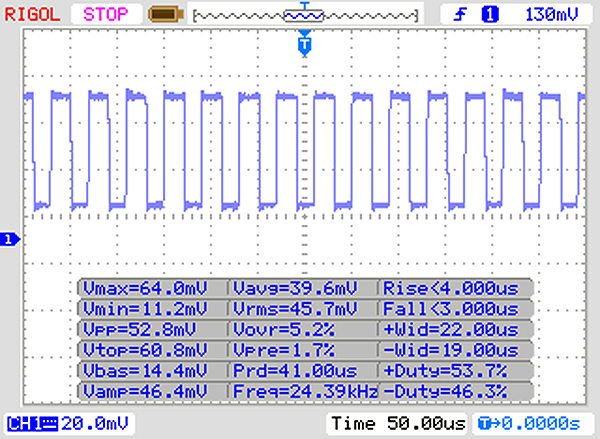 |
A luz de fundo da tela pisca em 2439 Hz (pior caso, por exemplo, utilizando PWM) Cintilação detectada em uma configuração de brilho de 30 % e abaixo. Não deve haver cintilação ou PWM acima desta configuração de brilho. A frequência de 2439 Hz é bastante alta, então a maioria dos usuários sensíveis ao PWM não deve notar nenhuma oscilação. [pwm_comparison] Em comparação: 52 % de todos os dispositivos testados não usam PWM para escurecer a tela. Se PWM foi detectado, uma média de 7798 (mínimo: 5 - máximo: 343500) Hz foi medida. | |||
| Cinebench R15 | |
| CPU Single 64Bit | |
| Média da turma Convertible (149.8 - 317, n=48, últimos 2 anos) | |
| Acer Spin 3 SP314-51-548L | |
| HP Pavilion x360 14-cd0002ng | |
| Média Intel Core i3-8130U (138 - 140, n=3) | |
| HP Pavilion x360 14-ba011ng | |
| Asus VivoBook Flip 14 TP410UA-EC242T | |
| Lenovo Yoga 520-14IKB 80X80097GE | |
| CPU Multi 64Bit | |
| Média da turma Convertible (478 - 4940, n=48, últimos 2 anos) | |
| Acer Spin 3 SP314-51-548L | |
| HP Pavilion x360 14-ba011ng | |
| Média Intel Core i3-8130U (320 - 342, n=3) | |
| Asus VivoBook Flip 14 TP410UA-EC242T | |
| HP Pavilion x360 14-cd0002ng | |
| Lenovo Yoga 520-14IKB 80X80097GE | |
| PCMark 8 | |
| Home Score Accelerated v2 | |
| Média da turma Convertible (n=1últimos 2 anos) | |
| Acer Spin 3 SP314-51-548L | |
| Lenovo Yoga 520-14IKB 80X80097GE | |
| HP Pavilion x360 14-ba011ng | |
| Asus VivoBook Flip 14 TP410UA-EC242T | |
| Média Intel Core i3-8130U, Intel UHD Graphics 620 (3198 - 3483, n=3) | |
| HP Pavilion x360 14-cd0002ng | |
| Work Score Accelerated v2 | |
| Média da turma Convertible (n=1últimos 2 anos) | |
| Acer Spin 3 SP314-51-548L | |
| Lenovo Yoga 520-14IKB 80X80097GE | |
| Média Intel Core i3-8130U, Intel UHD Graphics 620 (4412 - 4597, n=3) | |
| HP Pavilion x360 14-cd0002ng | |
| Asus VivoBook Flip 14 TP410UA-EC242T | |
| PCMark 8 Home Score Accelerated v2 | 3198 pontos | |
| PCMark 8 Work Score Accelerated v2 | 4412 pontos | |
| PCMark 10 Score | 3153 pontos | |
Ajuda | ||
| HP Pavilion x360 14-cd0002ng Toshiba KBG30ZMV256G | Lenovo Yoga 520-14IKB 80X80097GE Intel SSD 600p SSDPEKKW256G7 | Acer Spin 3 SP314-51-548L Micron 1100 MTFDDAV256TBN | Média Toshiba KBG30ZMV256G | |
|---|---|---|---|---|
| AS SSD | 13% | -23% | -7% | |
| Seq Read (MB/s) | 1225 | 1367 12% | 491.1 -60% | 1283 ? 5% |
| Seq Write (MB/s) | 764 | 561 -27% | 406.9 -47% | 676 ? -12% |
| 4K Read (MB/s) | 41.45 | 33.13 -20% | 25.41 -39% | 42.7 ? 3% |
| 4K Write (MB/s) | 90.5 | 110.2 22% | 77.9 -14% | 87.7 ? -3% |
| 4K-64 Read (MB/s) | 584 | 279.3 -52% | 236.1 -60% | 575 ? -2% |
| 4K-64 Write (MB/s) | 224.9 | 495.4 120% | 273.6 22% | 270 ? 20% |
| Access Time Read * (ms) | 0.138 | 0.092 33% | 0.091 34% | 0.2746 ? -99% |
| Access Time Write * (ms) | 0.229 | 0.033 86% | 0.056 76% | 0.3361 ? -47% |
| Score Read (Points) | 748 | 449 -40% | 311 -58% | 746 ? 0% |
| Score Write (Points) | 392 | 662 69% | 392 0% | 426 ? 9% |
| Score Total (Points) | 1511 | 1312 -13% | 867 -43% | 1536 ? 2% |
| Copy ISO MB/s (MB/s) | 574 | 579 1% | 329.8 -43% | 761 ? 33% |
| Copy Program MB/s (MB/s) | 263.4 | 227.4 -14% | 158.8 -40% | 243 ? -8% |
| Copy Game MB/s (MB/s) | 424.9 | 425.7 0% | 231.9 -45% | 457 ? 8% |
* ... menor é melhor

| 3DMark 11 - 1280x720 Performance GPU | |
| Média da turma Convertible (1505 - 40732, n=48, últimos 2 anos) | |
| HP Pavilion x360 14-ba011ng | |
| Média Intel UHD Graphics 620 (1144 - 3432, n=244) | |
| Acer Spin 3 SP314-51-548L | |
| HP Pavilion x360 14-cd0002ng | |
| Asus VivoBook Flip 14 TP410UA-EC242T | |
| Lenovo Yoga 520-14IKB 80X80097GE | |
| Acer Aspire 3 A315-51-30YA | |
| 3DMark | |
| 1280x720 Cloud Gate Standard Graphics | |
| Média da turma Convertible (7885 - 57566, n=32, últimos 2 anos) | |
| Média Intel UHD Graphics 620 (6205 - 16400, n=225) | |
| Acer Spin 3 SP314-51-548L | |
| HP Pavilion x360 14-cd0002ng | |
| Asus VivoBook Flip 14 TP410UA-EC242T | |
| Acer Aspire 3 A315-51-30YA | |
| Lenovo Yoga 520-14IKB 80X80097GE | |
| 1920x1080 Fire Strike Graphics | |
| Média da turma Convertible (1185 - 27447, n=48, últimos 2 anos) | |
| Média Intel UHD Graphics 620 (557 - 2608, n=213) | |
| Acer Spin 3 SP314-51-548L | |
| Acer Aspire 3 A315-51-30YA | |
| Asus VivoBook Flip 14 TP410UA-EC242T | |
| Lenovo Yoga 520-14IKB 80X80097GE | |
| 3DMark 11 Performance | 1568 pontos | |
| 3DMark Cloud Gate Standard Score | 6007 pontos | |
Ajuda | ||
| BioShock Infinite | |
| 1280x720 Very Low Preset | |
| Asus VivoBook 15 X542UF-DM143T | |
| Lenovo Flex 6-14IKB | |
| HP Pavilion x360 14-ba011ng | |
| Acer Spin 3 SP314-51-548L | |
| Média Intel UHD Graphics 620 (18.3 - 90.2, n=187) | |
| HP Pavilion x360 14-cd0002ng | |
| Asus VivoBook Flip 14 TP410UA-EC242T | |
| Lenovo Yoga 520-14IKB 80X80097GE | |
| 1366x768 High Preset | |
| Asus VivoBook 15 X542UF-DM143T | |
| Lenovo Flex 6-14IKB | |
| HP Pavilion x360 14-ba011ng | |
| Média Intel UHD Graphics 620 (8.1 - 35.9, n=187) | |
| Acer Spin 3 SP314-51-548L | |
| HP Pavilion x360 14-cd0002ng | |
| Asus VivoBook Flip 14 TP410UA-EC242T | |
| Lenovo Yoga 520-14IKB 80X80097GE | |
| baixo | média | alto | ultra | |
|---|---|---|---|---|
| BioShock Infinite (2013) | 45.9 | 23.44 | 20.41 | 6.94 |
| The Witcher 3 (2015) | 12.7 | 8 | 4.2 | 2.97 |
| Rise of the Tomb Raider (2016) | 16.9 | 10 | 5.4 | 3.8 |
Barulho
| Ocioso |
| 31 / 31 / 31 dB |
| Carga |
| 36.5 / 36.6 dB |
 | ||
30 dB silencioso 40 dB(A) audível 50 dB(A) ruidosamente alto |
||
min: | ||
(+) A temperatura máxima no lado superior é 33.7 °C / 93 F, em comparação com a média de 35.4 °C / 96 F , variando de 19.6 a 60 °C para a classe Convertible.
(±) A parte inferior aquece até um máximo de 41.6 °C / 107 F, em comparação com a média de 36.9 °C / 98 F
(+) Em uso inativo, a temperatura média para o lado superior é 25.2 °C / 77 F, em comparação com a média do dispositivo de 30.3 °C / ### class_avg_f### F.
(+) Os apoios para as mãos e o touchpad são mais frios que a temperatura da pele, com um máximo de 29.1 °C / 84.4 F e, portanto, são frios ao toque.
(±) A temperatura média da área do apoio para as mãos de dispositivos semelhantes foi 28 °C / 82.4 F (-1.1 °C / -2 F).
HP Pavilion x360 14-cd0002ng análise de áudio
(-) | alto-falantes não muito altos (###valor### dB)
Graves 100 - 315Hz
(±) | graves reduzidos - em média 12.7% menor que a mediana
(±) | a linearidade dos graves é média (7.6% delta para a frequência anterior)
Médios 400 - 2.000 Hz
(+) | médios equilibrados - apenas 3.8% longe da mediana
(+) | médios são lineares (4.2% delta para frequência anterior)
Altos 2 - 16 kHz
(±) | máximos mais altos - em média 6.2% maior que a mediana
(+) | os máximos são lineares (5.7% delta da frequência anterior)
Geral 100 - 16.000 Hz
(±) | a linearidade do som geral é média (18.2% diferença em relação à mediana)
Comparado com a mesma classe
» 39% de todos os dispositivos testados nesta classe foram melhores, 7% semelhantes, 54% piores
» O melhor teve um delta de 6%, a média foi 20%, o pior foi 57%
Comparado com todos os dispositivos testados
» 39% de todos os dispositivos testados foram melhores, 8% semelhantes, 53% piores
» O melhor teve um delta de 4%, a média foi 24%, o pior foi 134%
Apple MacBook 12 (Early 2016) 1.1 GHz análise de áudio
(+) | os alto-falantes podem tocar relativamente alto (###valor### dB)
Graves 100 - 315Hz
(±) | graves reduzidos - em média 11.3% menor que a mediana
(±) | a linearidade dos graves é média (14.2% delta para a frequência anterior)
Médios 400 - 2.000 Hz
(+) | médios equilibrados - apenas 2.4% longe da mediana
(+) | médios são lineares (5.5% delta para frequência anterior)
Altos 2 - 16 kHz
(+) | agudos equilibrados - apenas 2% longe da mediana
(+) | os máximos são lineares (4.5% delta da frequência anterior)
Geral 100 - 16.000 Hz
(+) | o som geral é linear (10.2% diferença em relação à mediana)
Comparado com a mesma classe
» 7% de todos os dispositivos testados nesta classe foram melhores, 2% semelhantes, 91% piores
» O melhor teve um delta de 5%, a média foi 18%, o pior foi 53%
Comparado com todos os dispositivos testados
» 5% de todos os dispositivos testados foram melhores, 1% semelhantes, 94% piores
» O melhor teve um delta de 4%, a média foi 24%, o pior foi 134%
| desligado | |
| Ocioso | |
| Carga |
|
Key:
min: | |
| HP Pavilion x360 14-cd0002ng i3-8130U, UHD Graphics 620, Toshiba KBG30ZMV256G, IPS, 1920x1080, 14" | Asus VivoBook Flip 14 TP410UA-EC242T i5-7200U, HD Graphics 620, SK Hynix HFS256G39TND-N210A, IPS, 1920x1080, 14" | Acer Spin 3 SP314-51-548L i5-8250U, UHD Graphics 620, Micron 1100 MTFDDAV256TBN, IPS, 1920x1080, 14" | Média Intel UHD Graphics 620 | Média da turma Convertible | |
|---|---|---|---|---|---|
| Power Consumption | -11% | 17% | -16% | -35% | |
| Idle Minimum * (Watt) | 3.9 | 3.9 -0% | 2.9 26% | 3.81 ? 2% | 4.29 ? -10% |
| Idle Average * (Watt) | 5.9 | 7 -19% | 5.2 12% | 6.94 ? -18% | 7.08 ? -20% |
| Idle Maximum * (Watt) | 7.1 | 9.3 -31% | 5.4 24% | 8.75 ? -23% | 8.68 ? -22% |
| Load Average * (Watt) | 29.4 | 35 -19% | 29.4 -0% | 35 ? -19% | 44 ? -50% |
| Load Maximum * (Watt) | 39 | 33 15% | 29.6 24% | 47.5 ? -22% | 67.3 ? -73% |
* ... menor é melhor
| HP Pavilion x360 14-cd0002ng i3-8130U, UHD Graphics 620, 41 Wh | HP Pavilion x360 14-ba011ng i5-7200U, GeForce 940MX, 41.5 Wh | Lenovo Yoga 520-14IKB 80X80097GE i5-7200U, HD Graphics 620, 53 Wh | Asus VivoBook Flip 14 TP410UA-EC242T i5-7200U, HD Graphics 620, 42 Wh | Acer Spin 3 SP314-51-548L i5-8250U, UHD Graphics 620, 52.5 Wh | Média da turma Convertible | |
|---|---|---|---|---|---|---|
| Duração da bateria | -16% | 38% | -8% | 12% | 87% | |
| Reader / Idle (h) | 12.7 | 14.8 17% | 27.7 ? 118% | |||
| H.264 (h) | 5.4 | 10 85% | 15.3 ? 183% | |||
| WiFi v1.3 (h) | 7.4 | 6.2 -16% | 8.3 12% | 6.8 -8% | 8.3 12% | 11.9 ? 61% |
| Load (h) | 2.1 | 2.9 38% | 1.779 ? -15% |
Pro
Contra
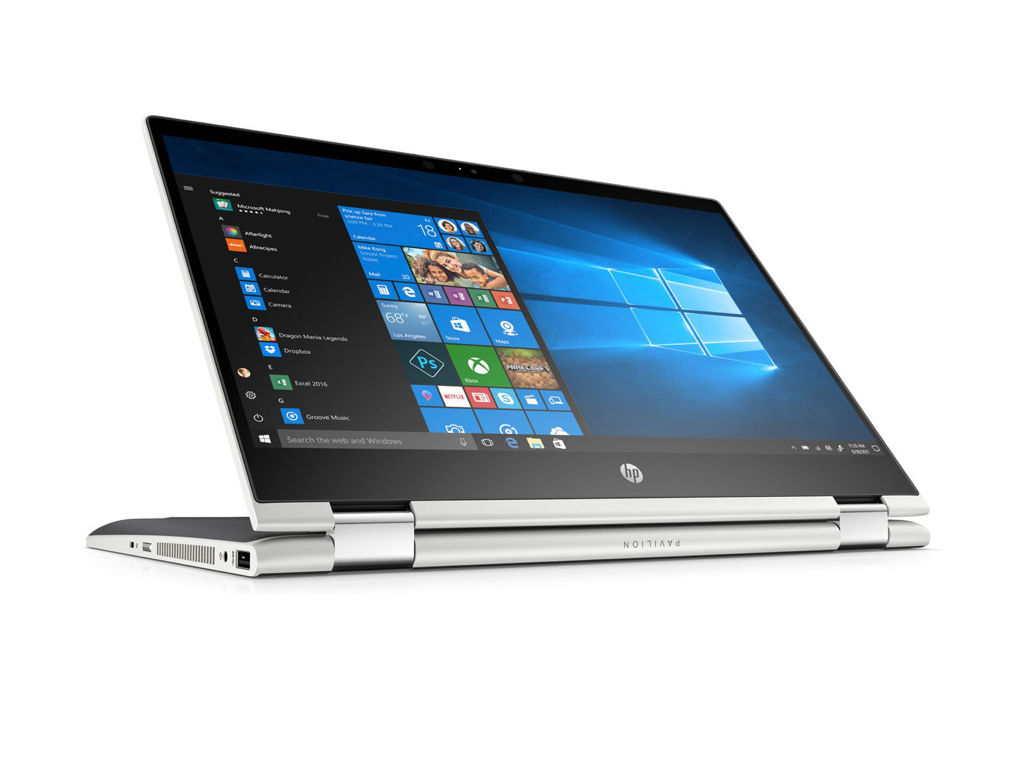
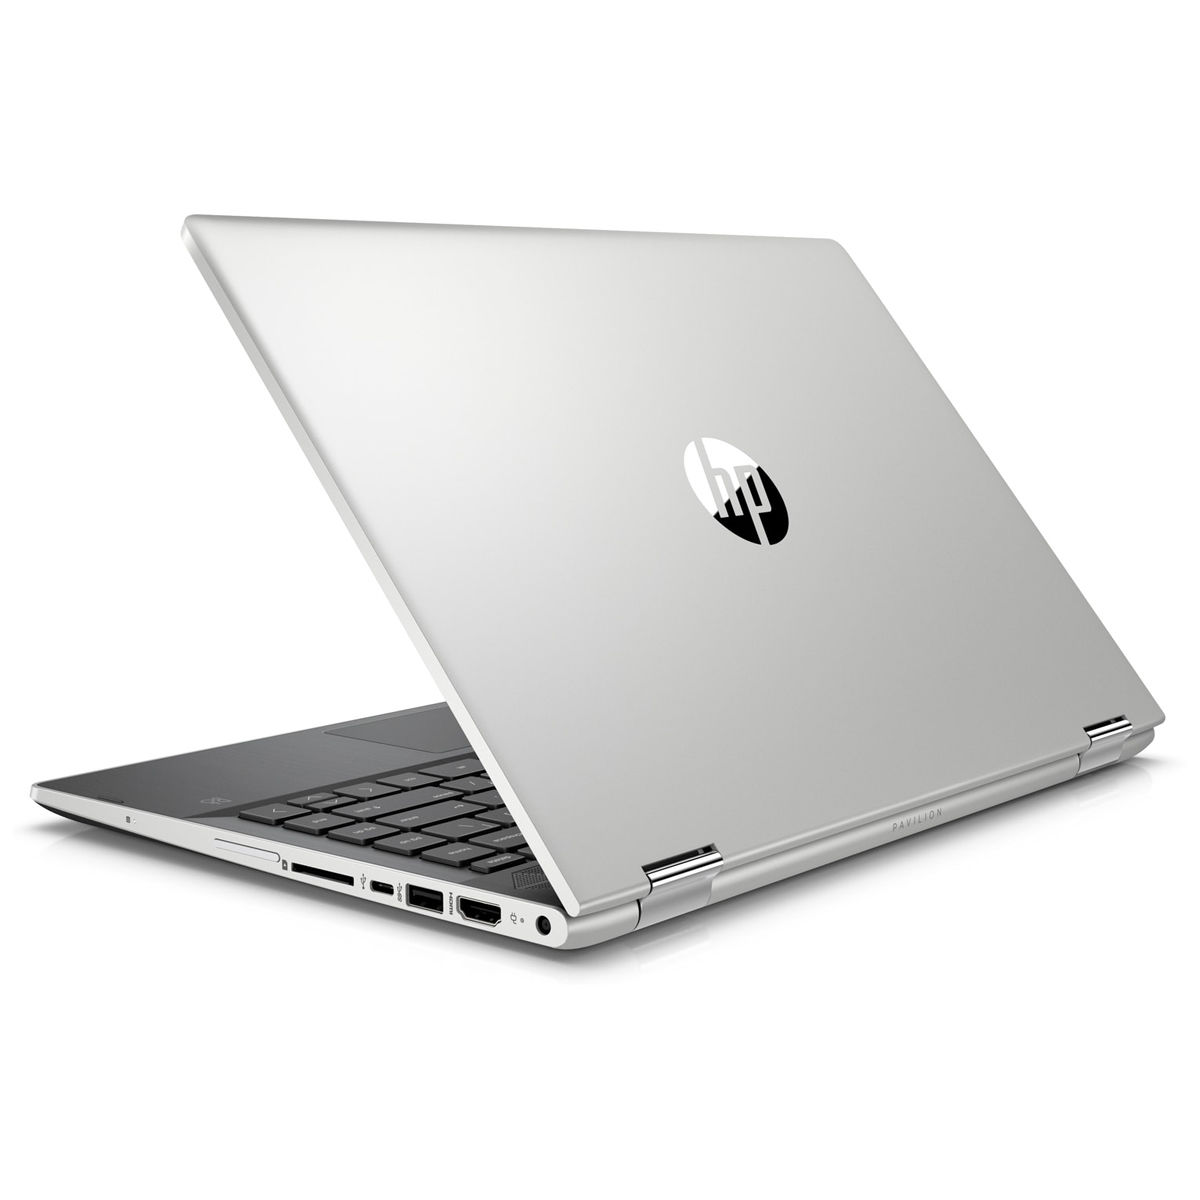
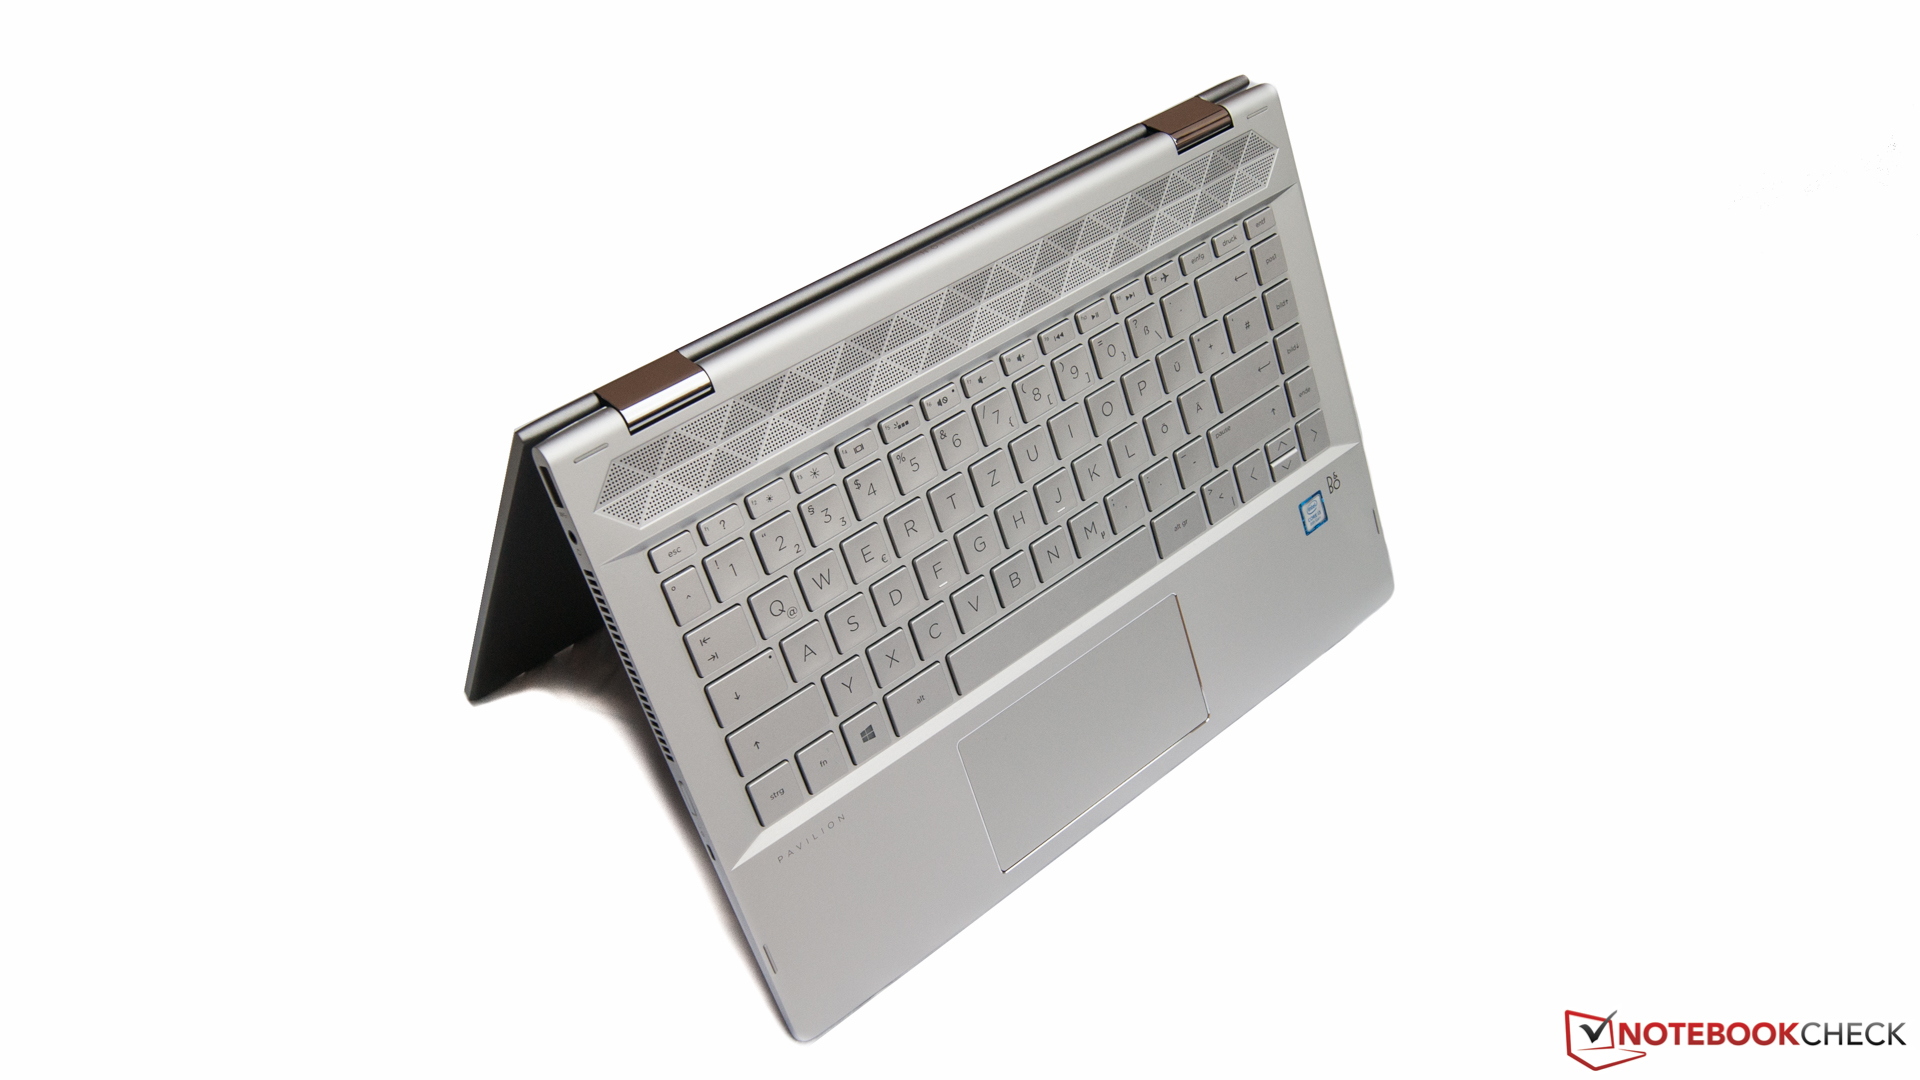
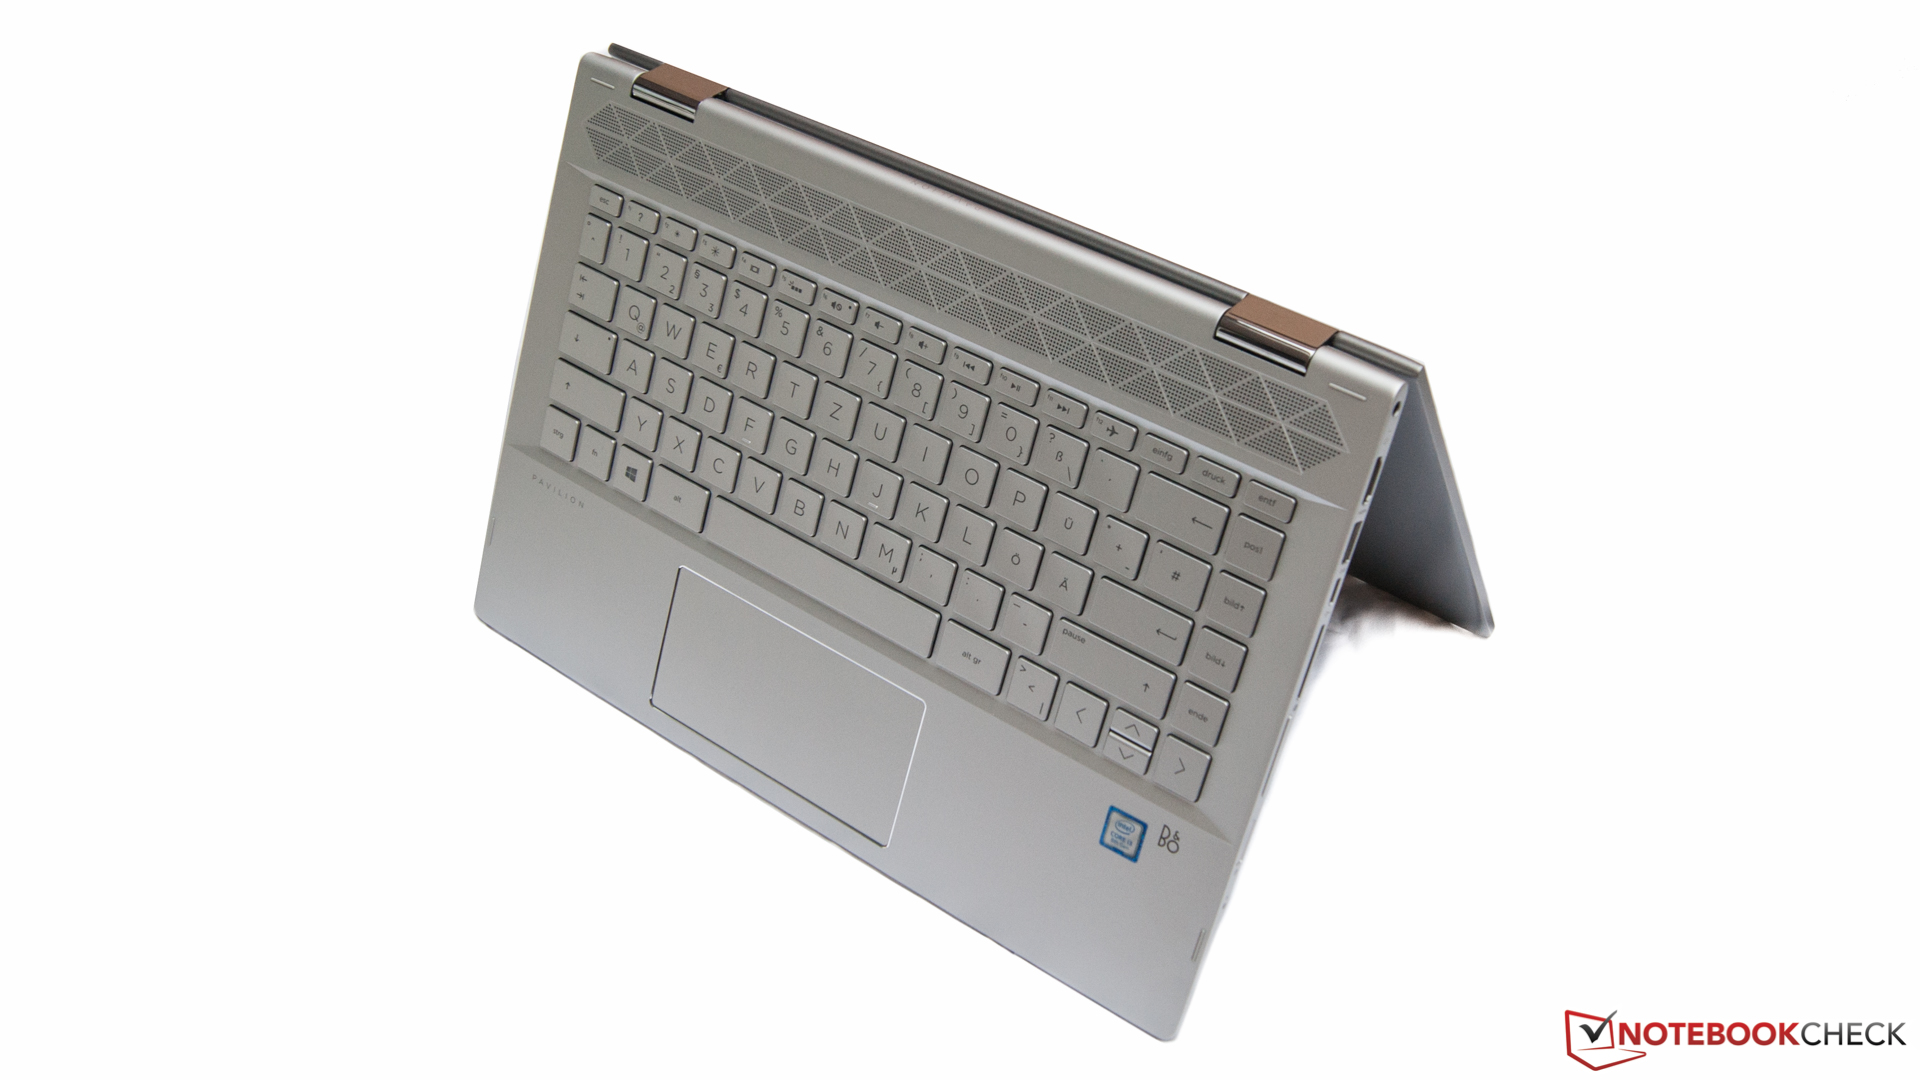
Um portátil ou um tablet? Este é o princípio por trás de um conversível. O novo HP Pavilion x360 quer combinar os dois dispositivos. Nosso modelo de teste por 700 Euros (~$797) é poderoso o suficiente para as tarefas mais comuns, mas o desempenho e um design agradável não são tudo.
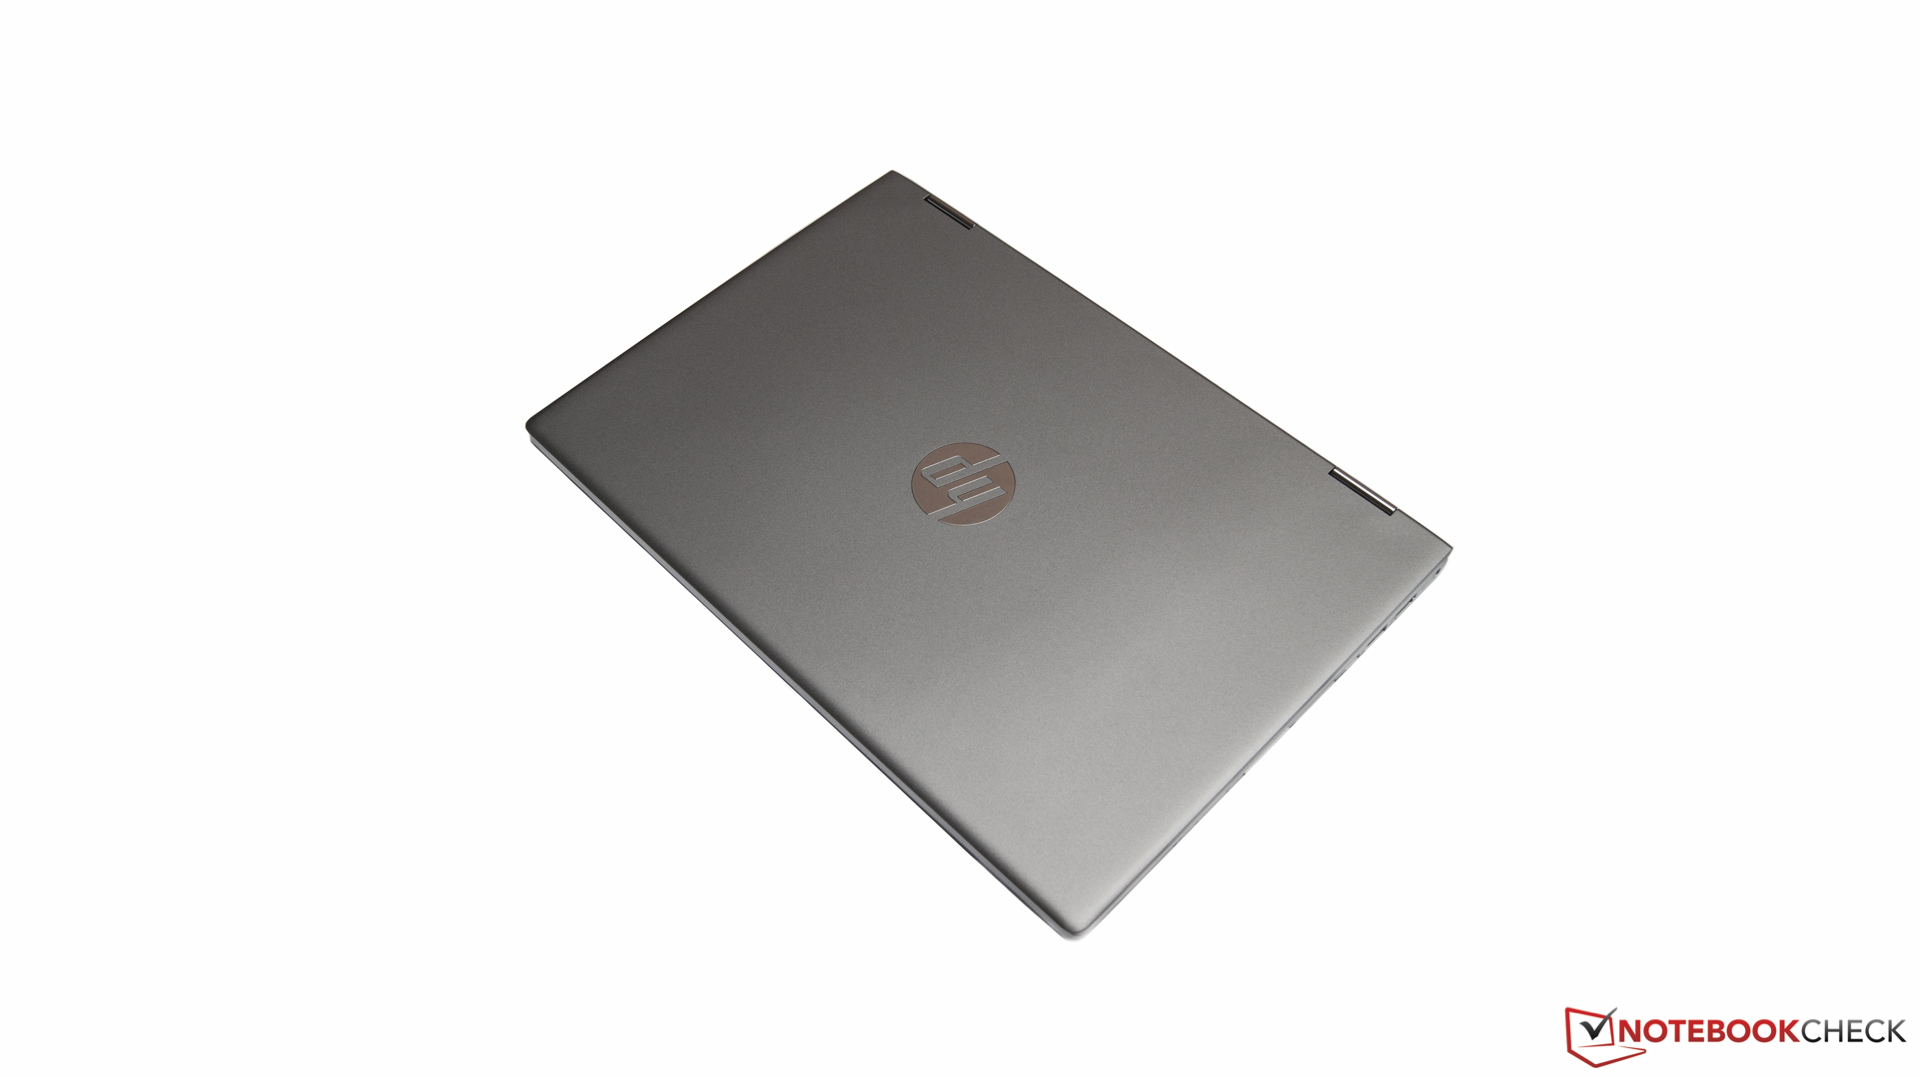
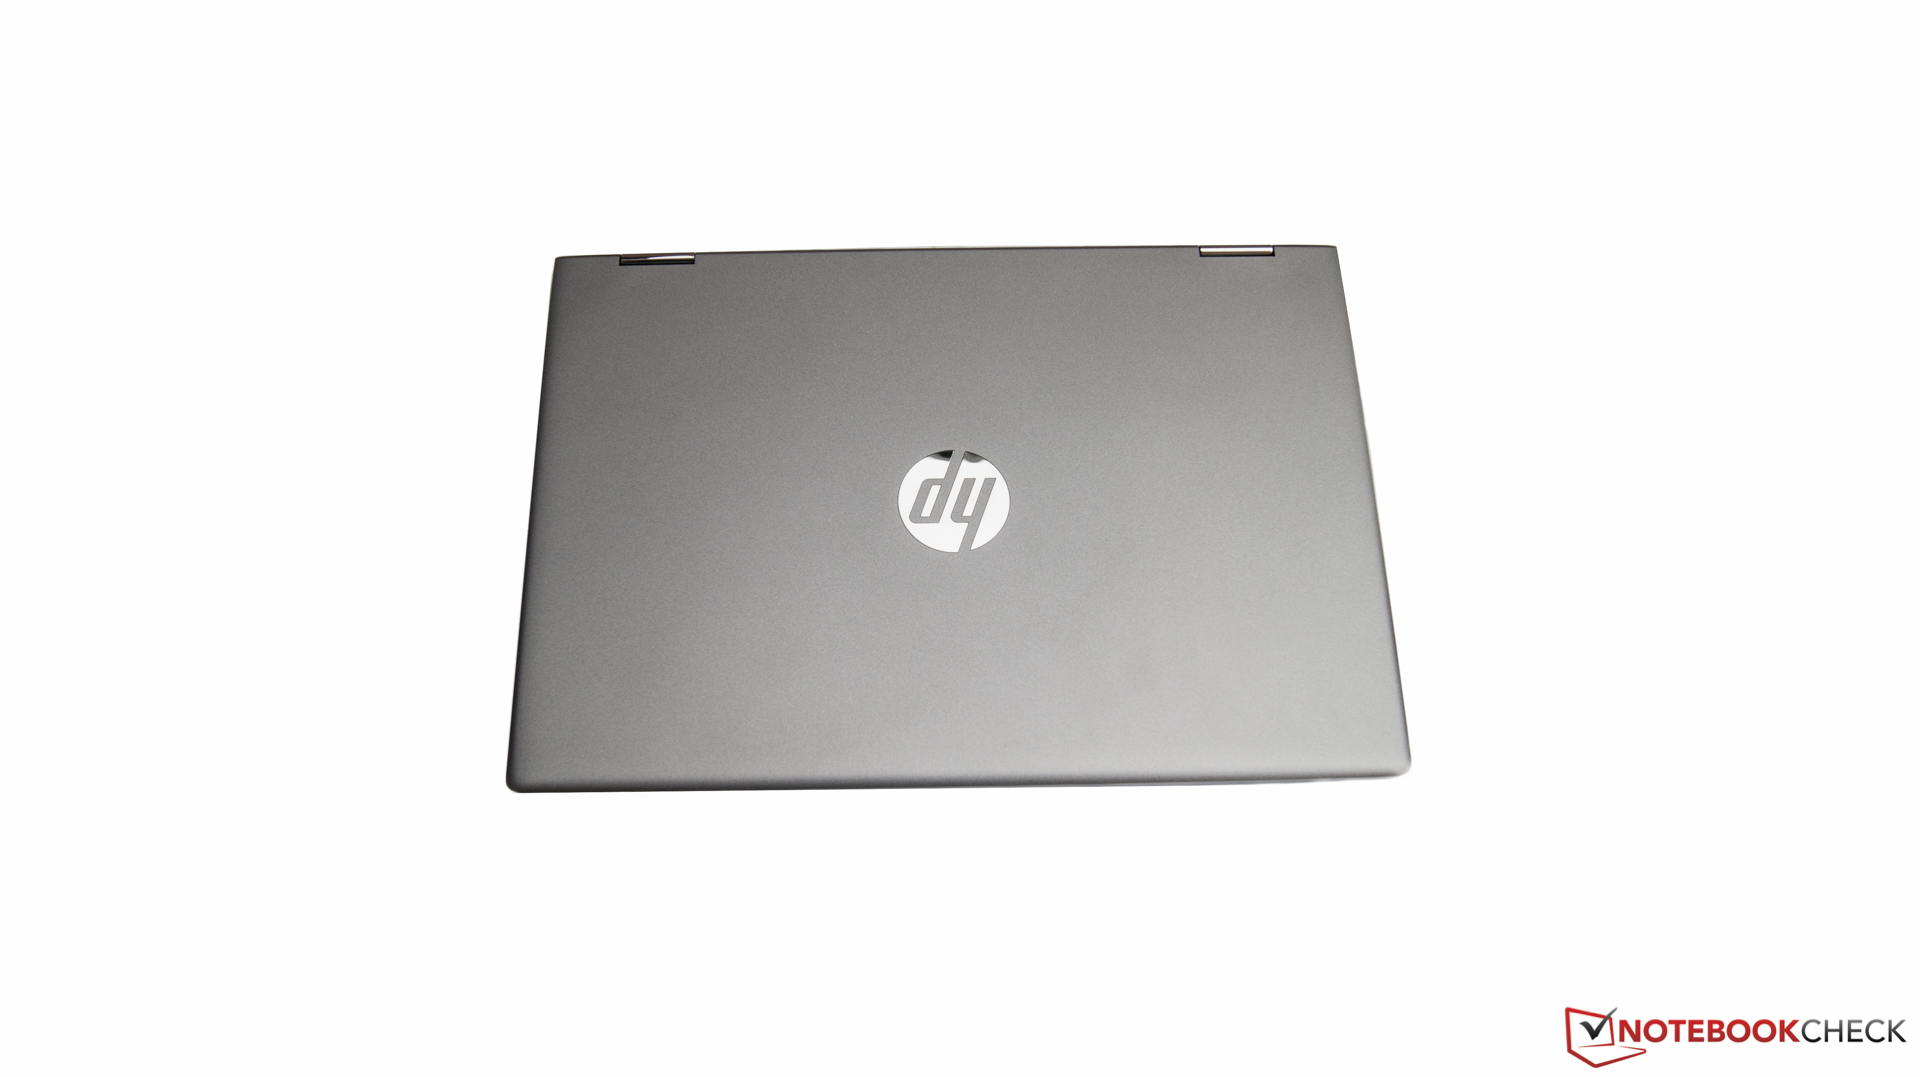
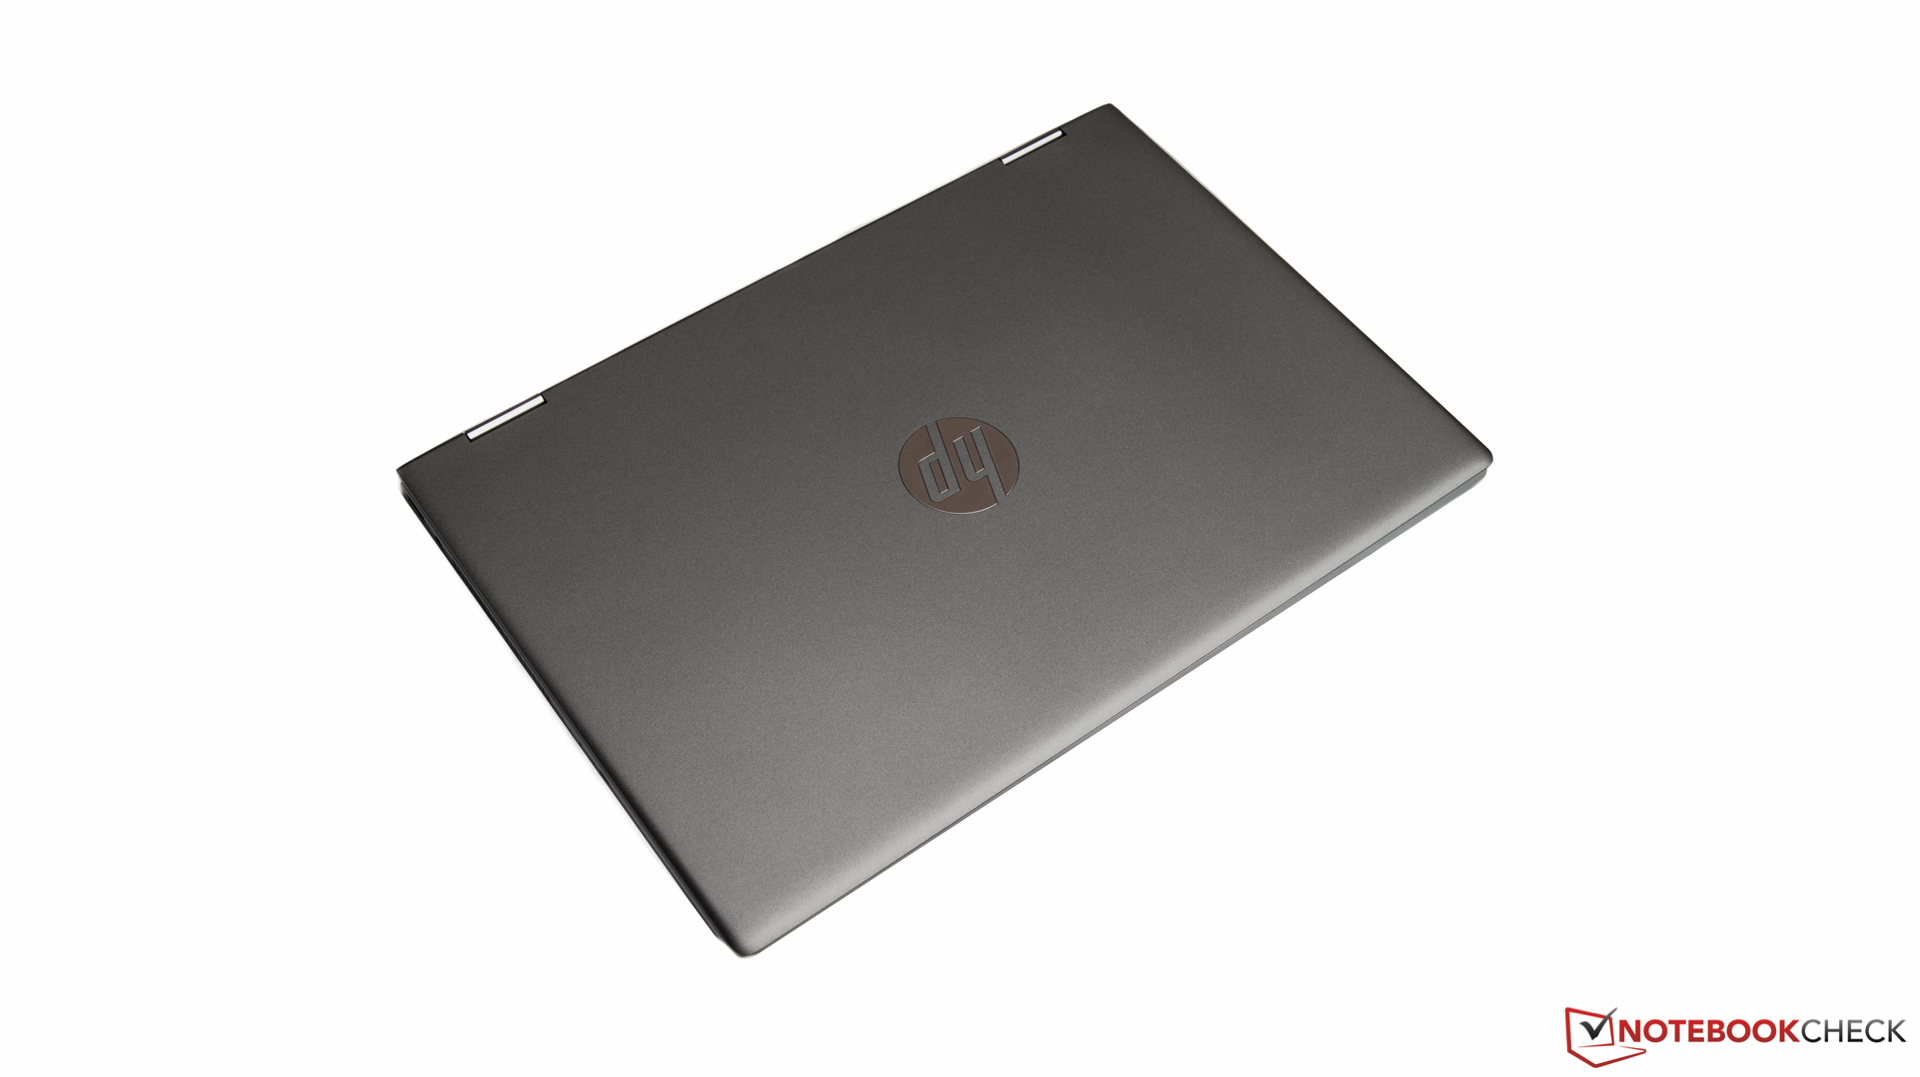
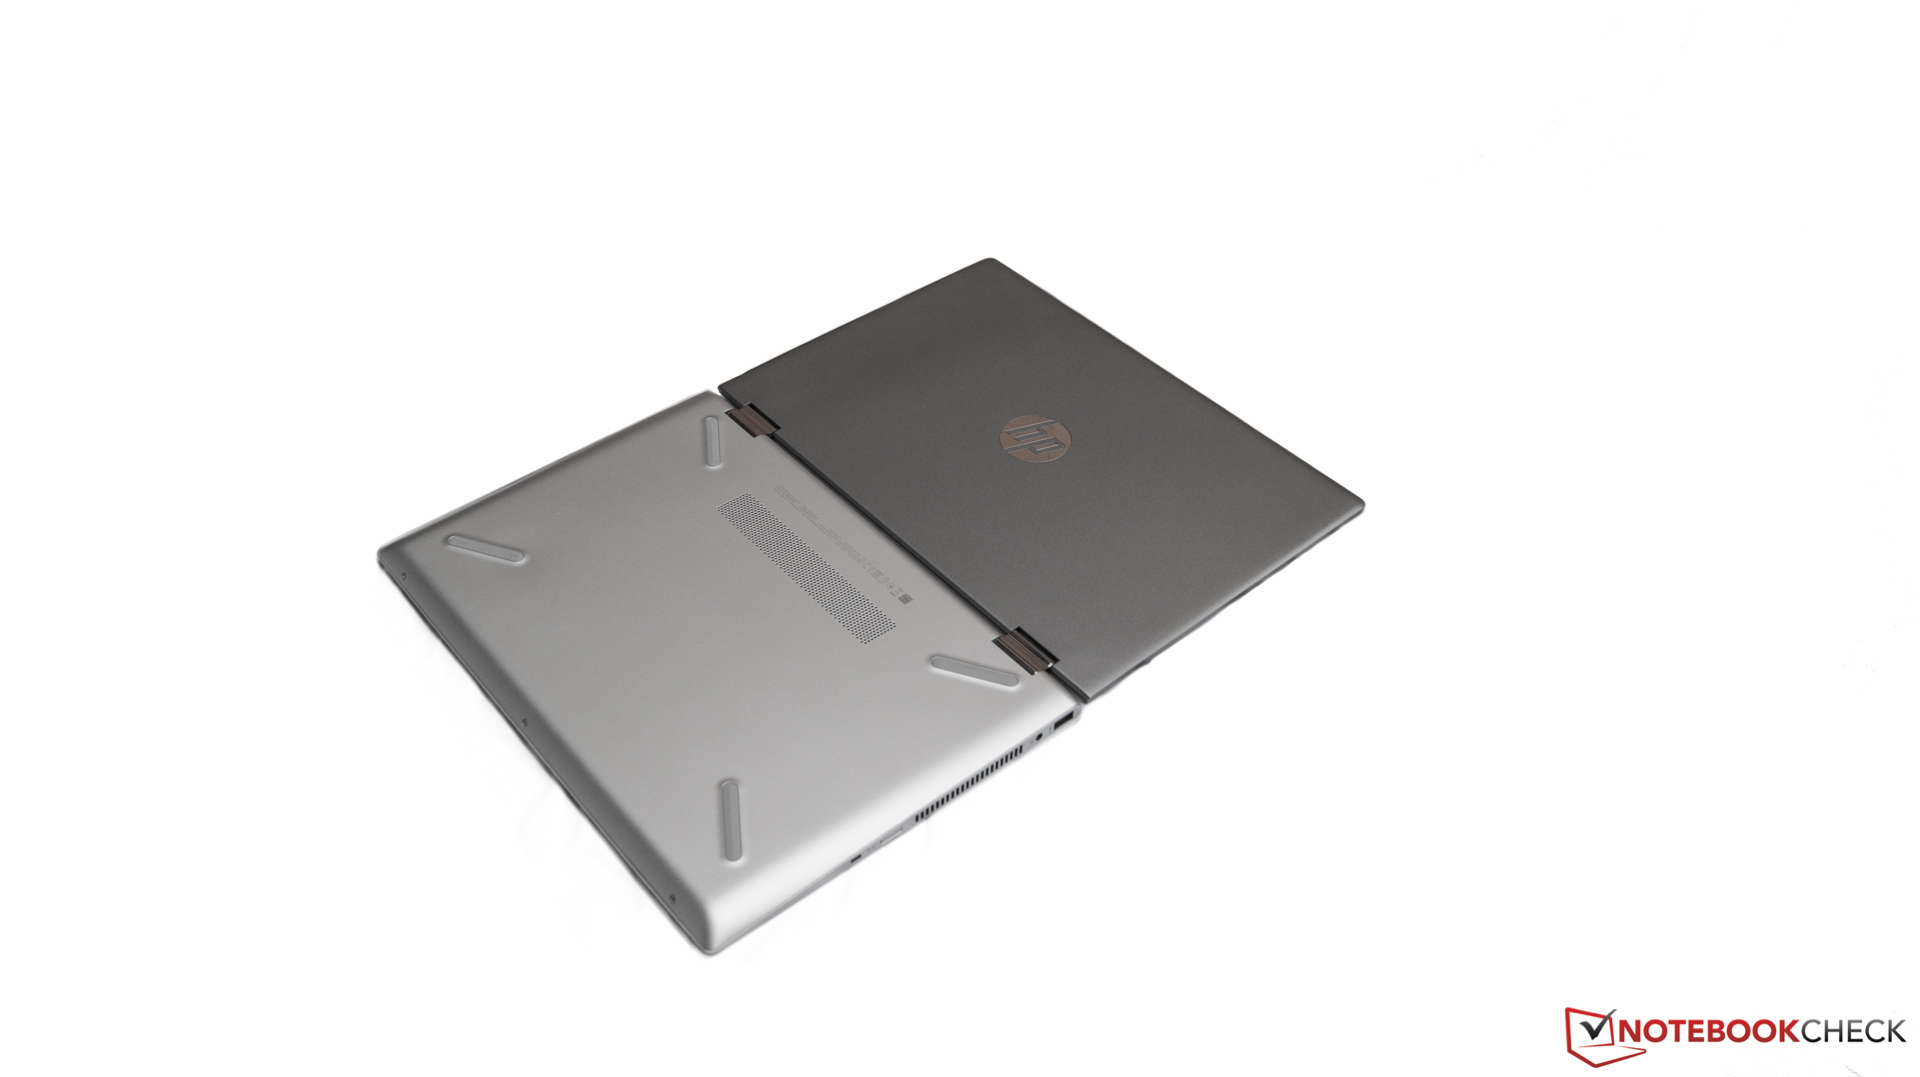
A carcaça consiste em uma combinação de plástico/metal, que parece nobre e tem boa aparência. A impressão decente é infelizmente afetada por rangidos durante o uso.
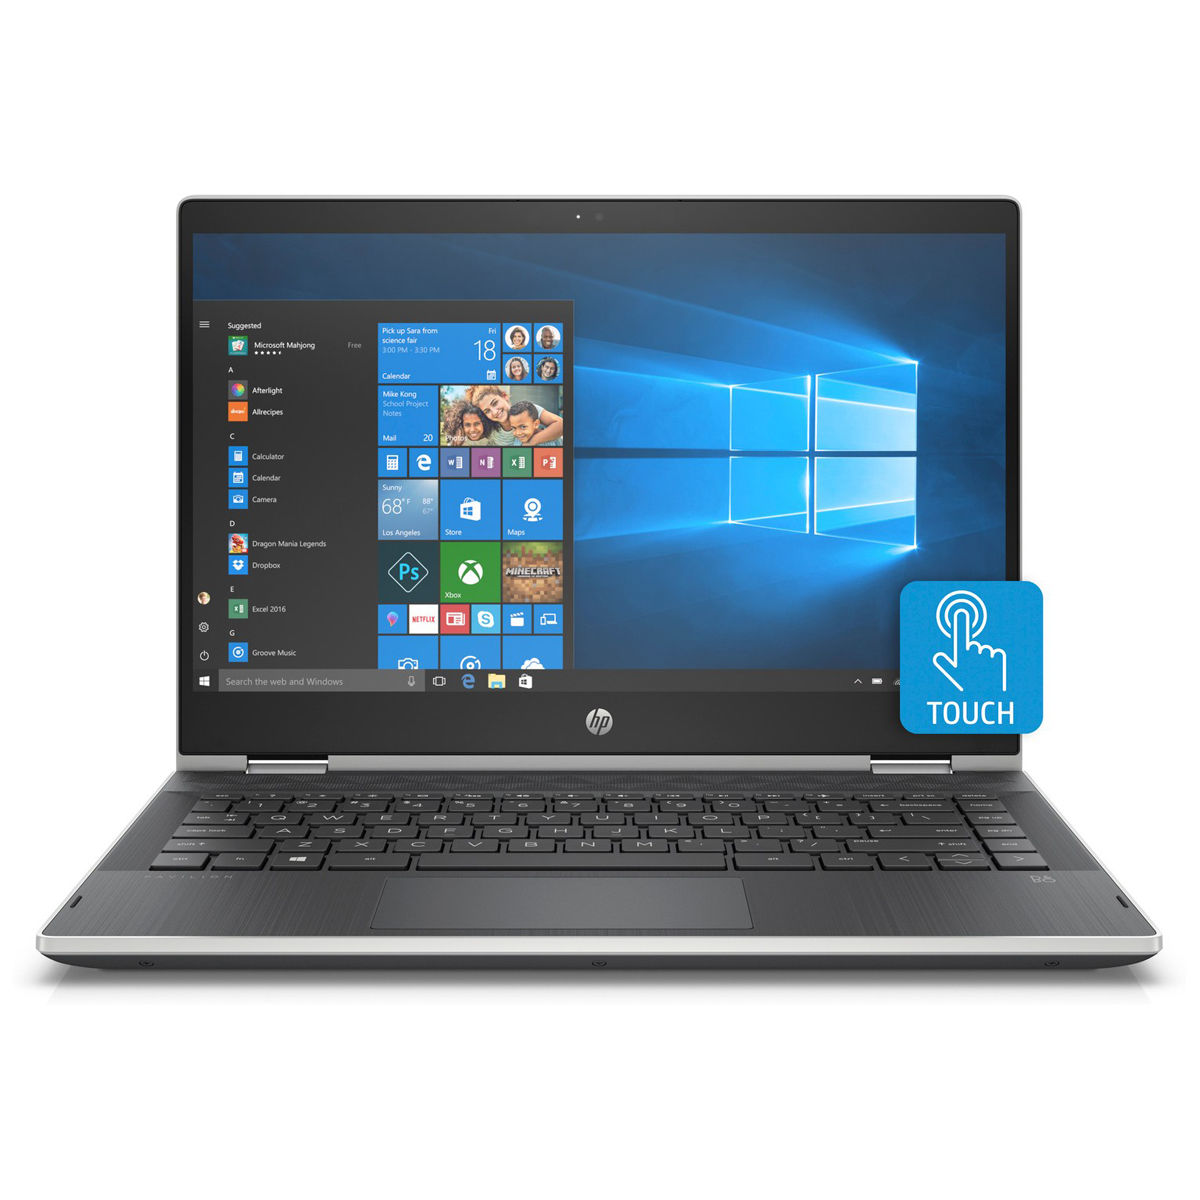
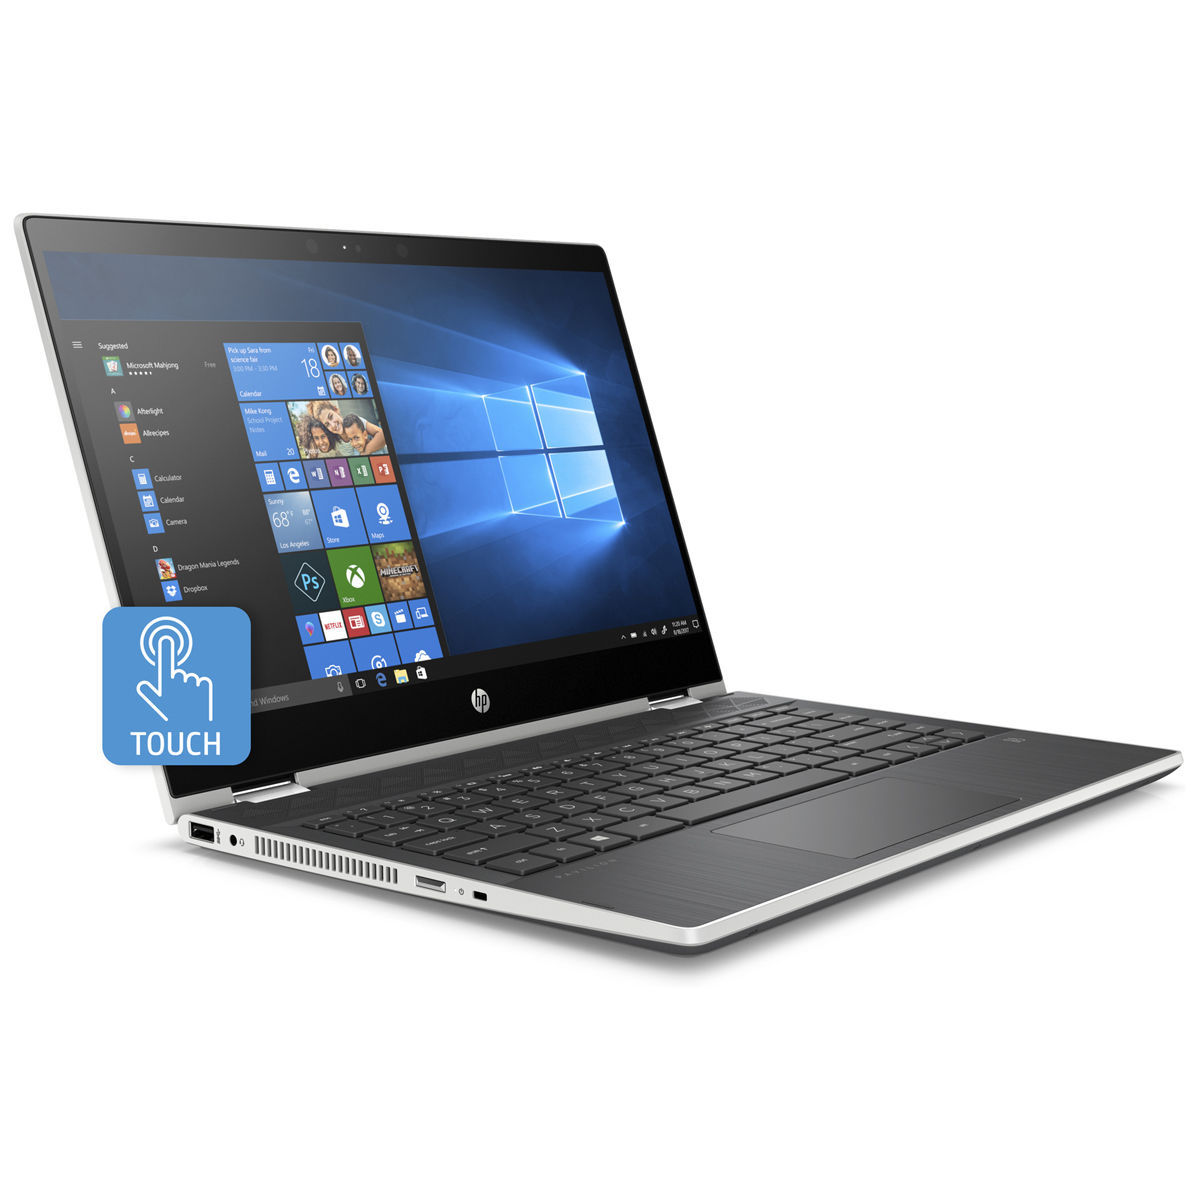
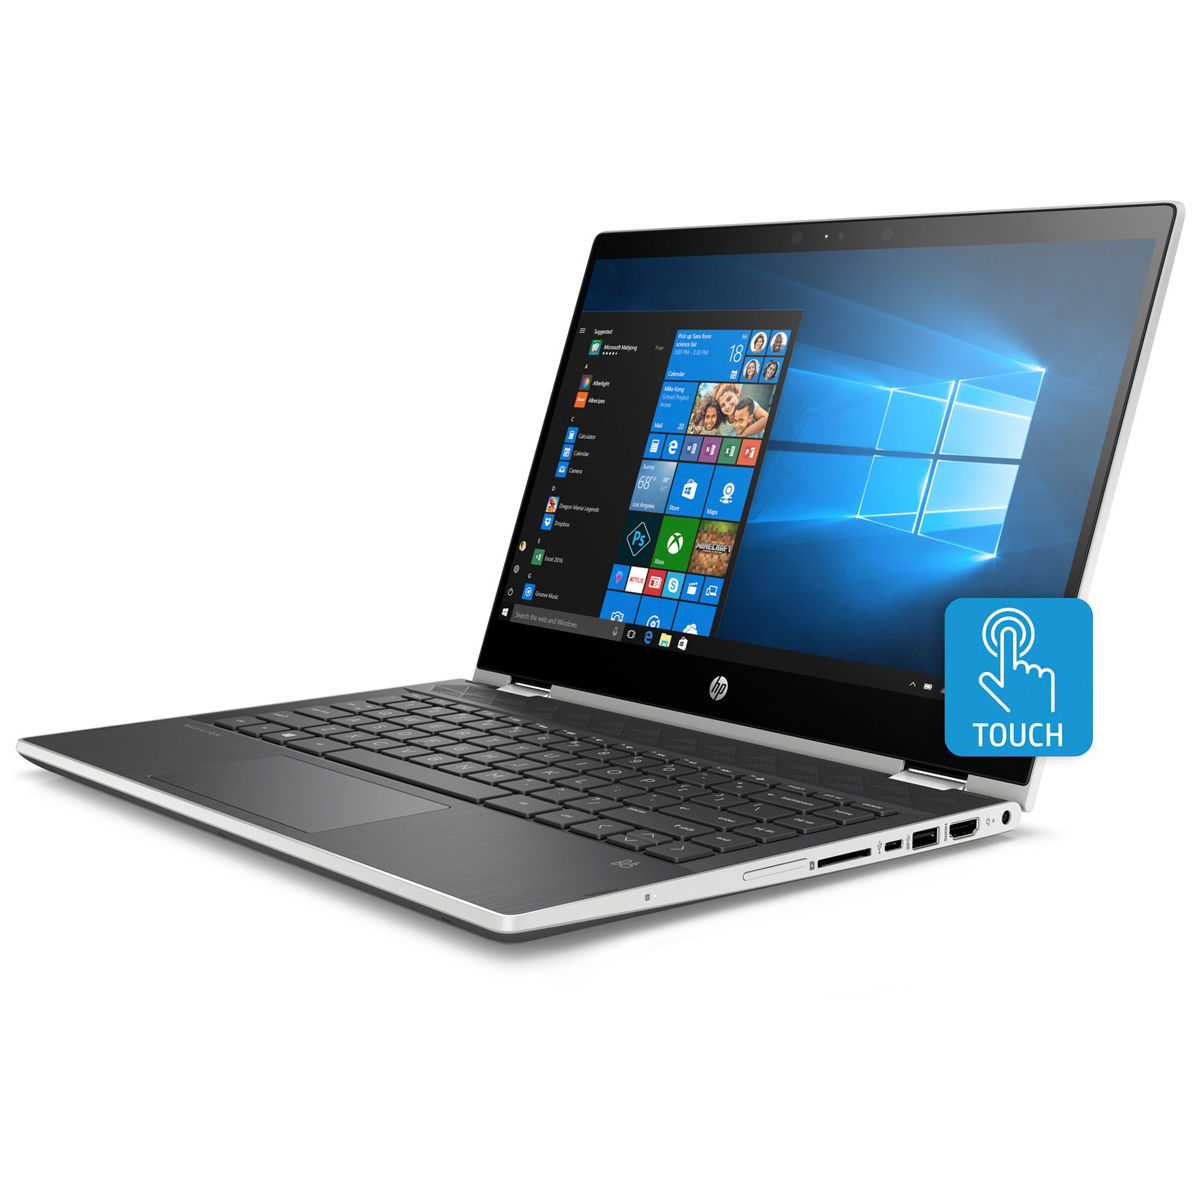
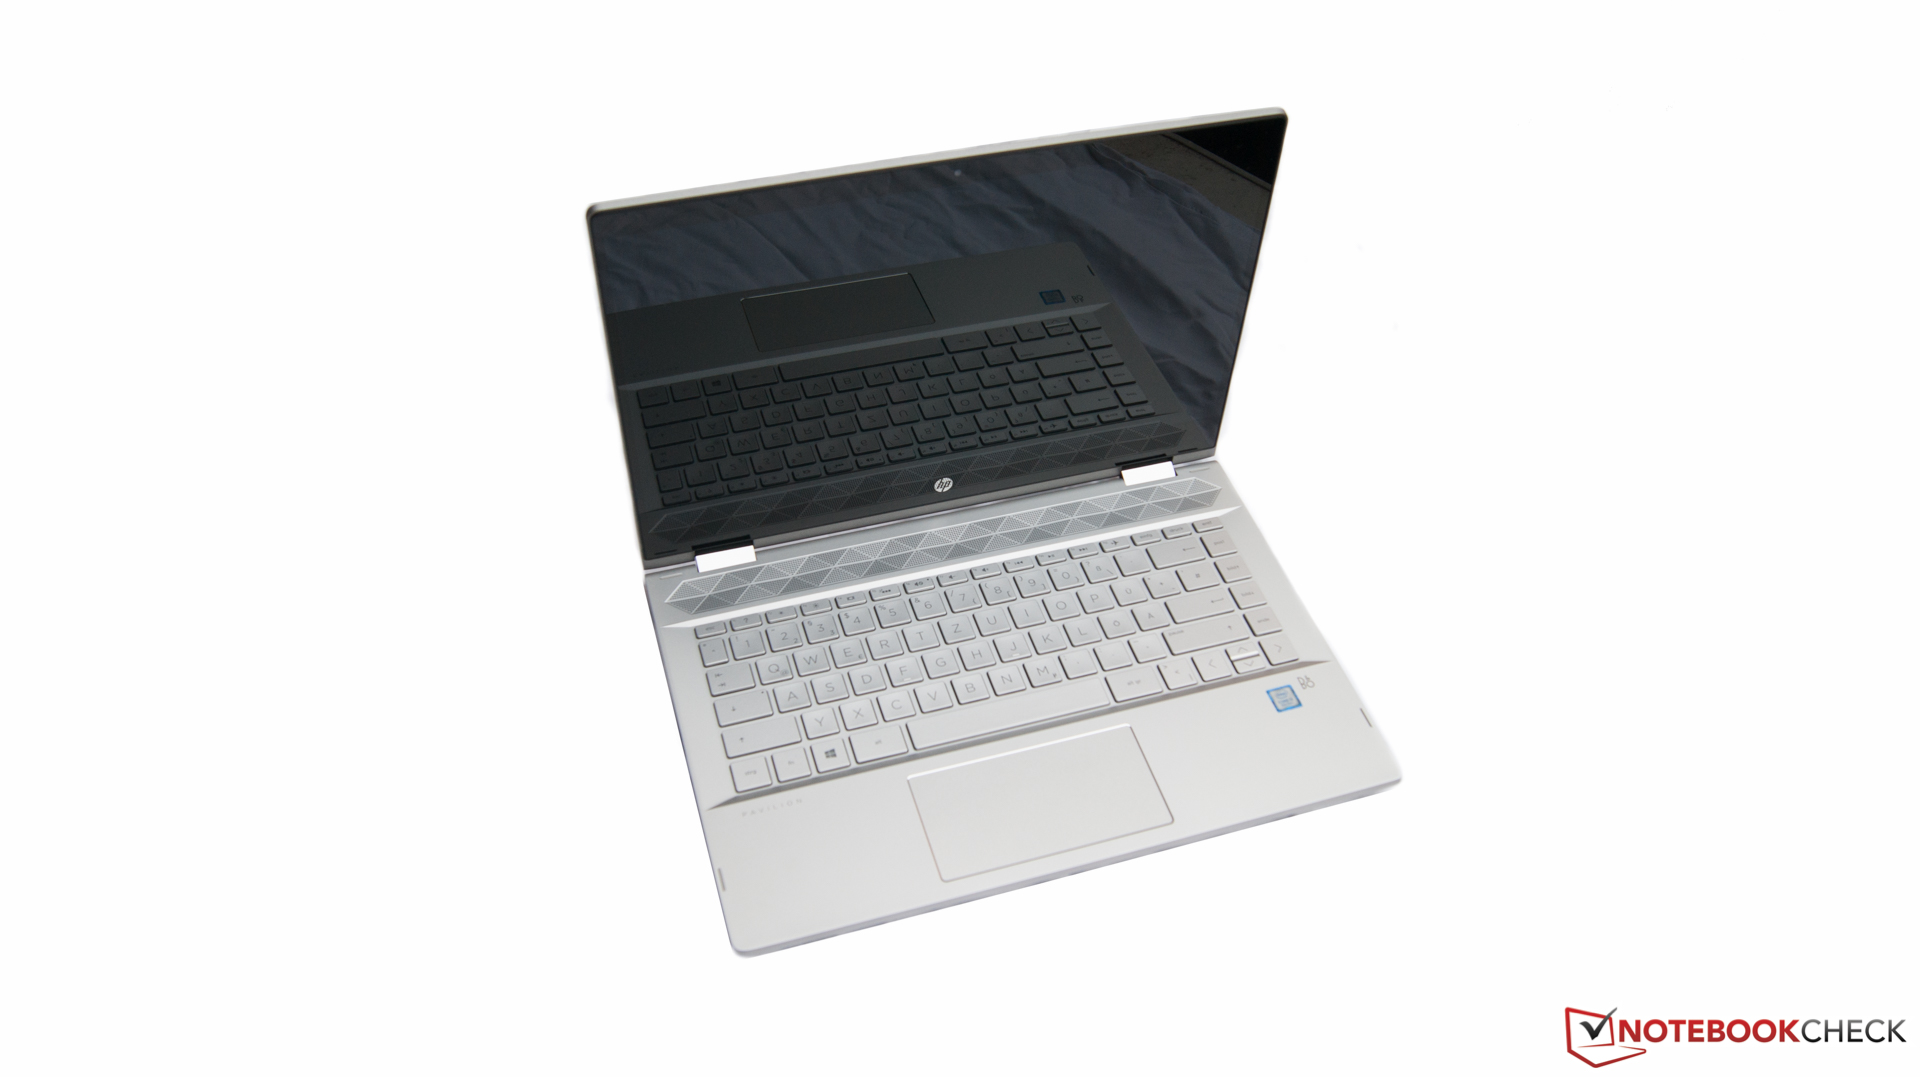
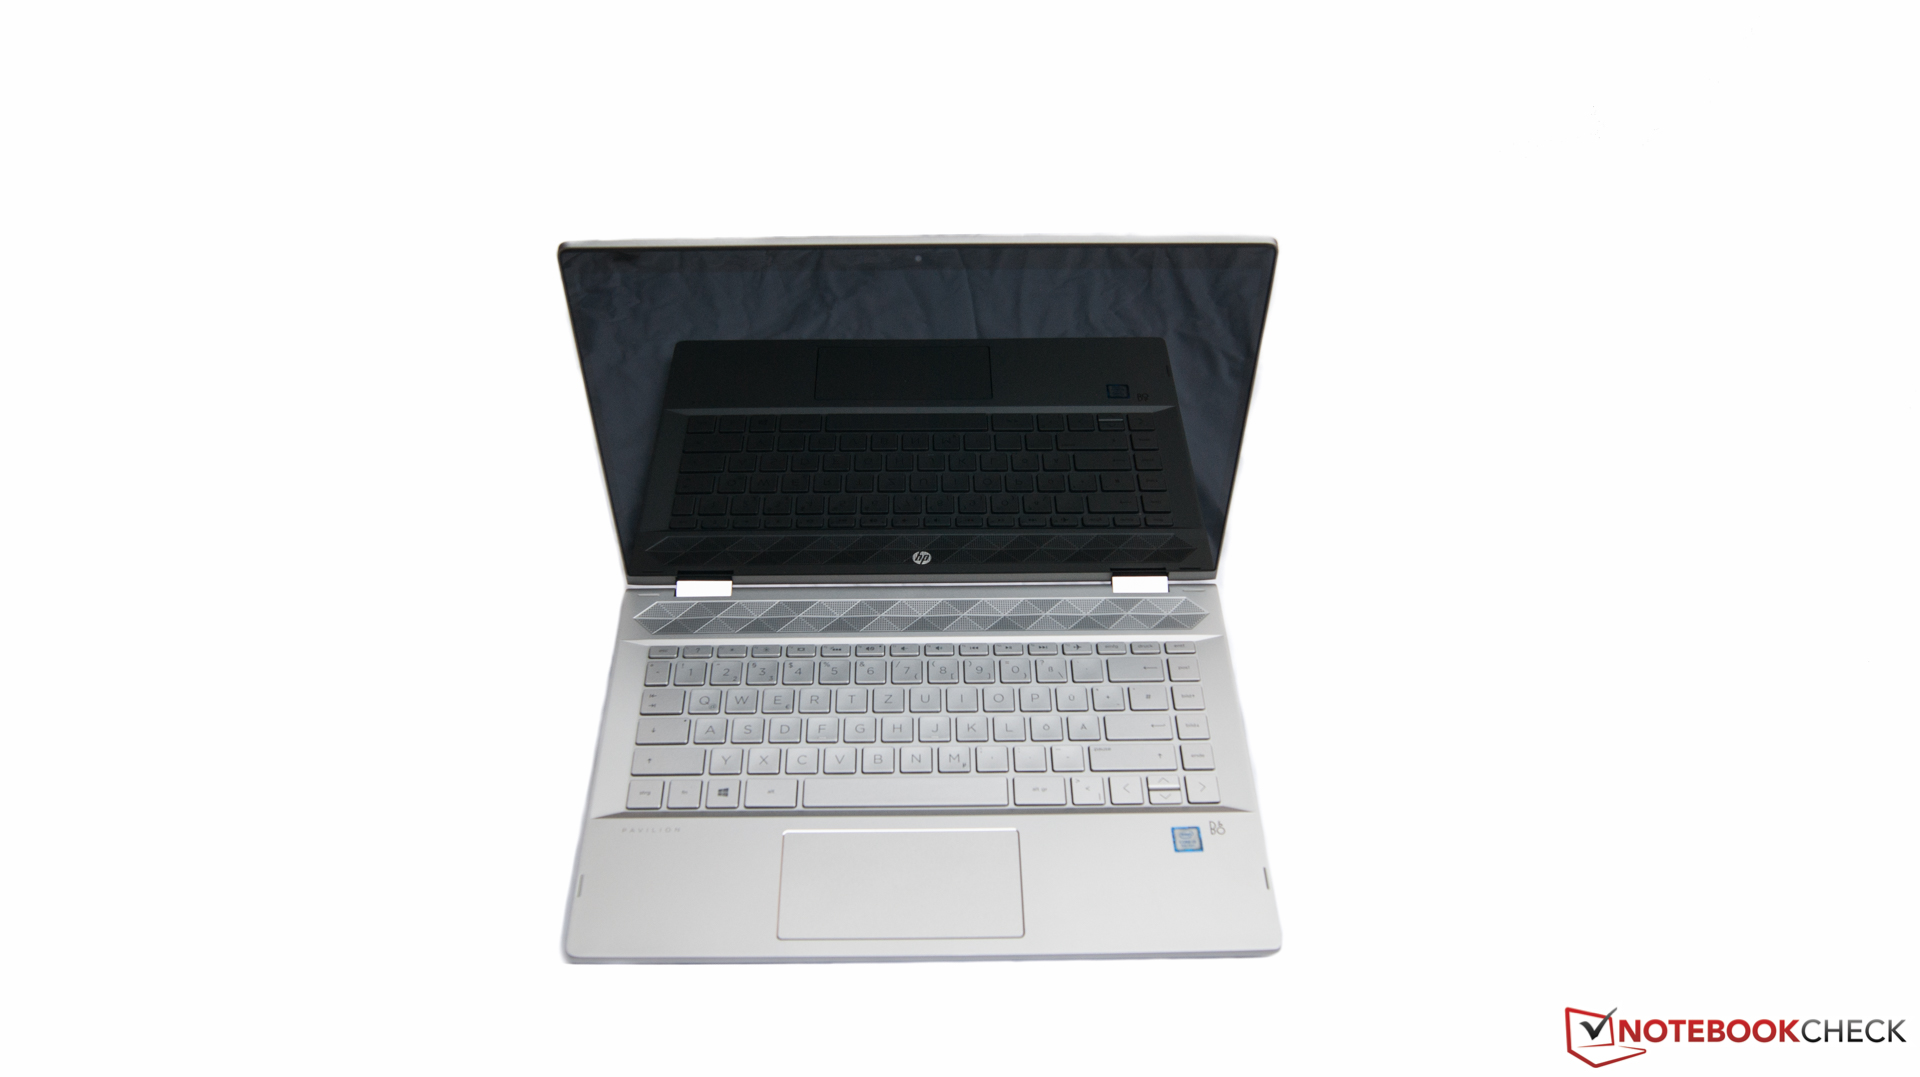
Os dispositivos de entrada também deixam impressões misturadas. O teclado é adequado para tarefas ocasionais de escritório e é iluminado, mas a qualidade não é muito boa. O touchpad é melhor e realizou nossas entradas com rapidez e precisão, mas gostaríamos de ver dimensões maiores para a próxima iteração. Obviamente, você também pode usar a tela táctil de 14 polegadas para entradas, que é um método de entrada confiável. É lamentável que a HP não envie a série Pavilion com uma caneta stylus.
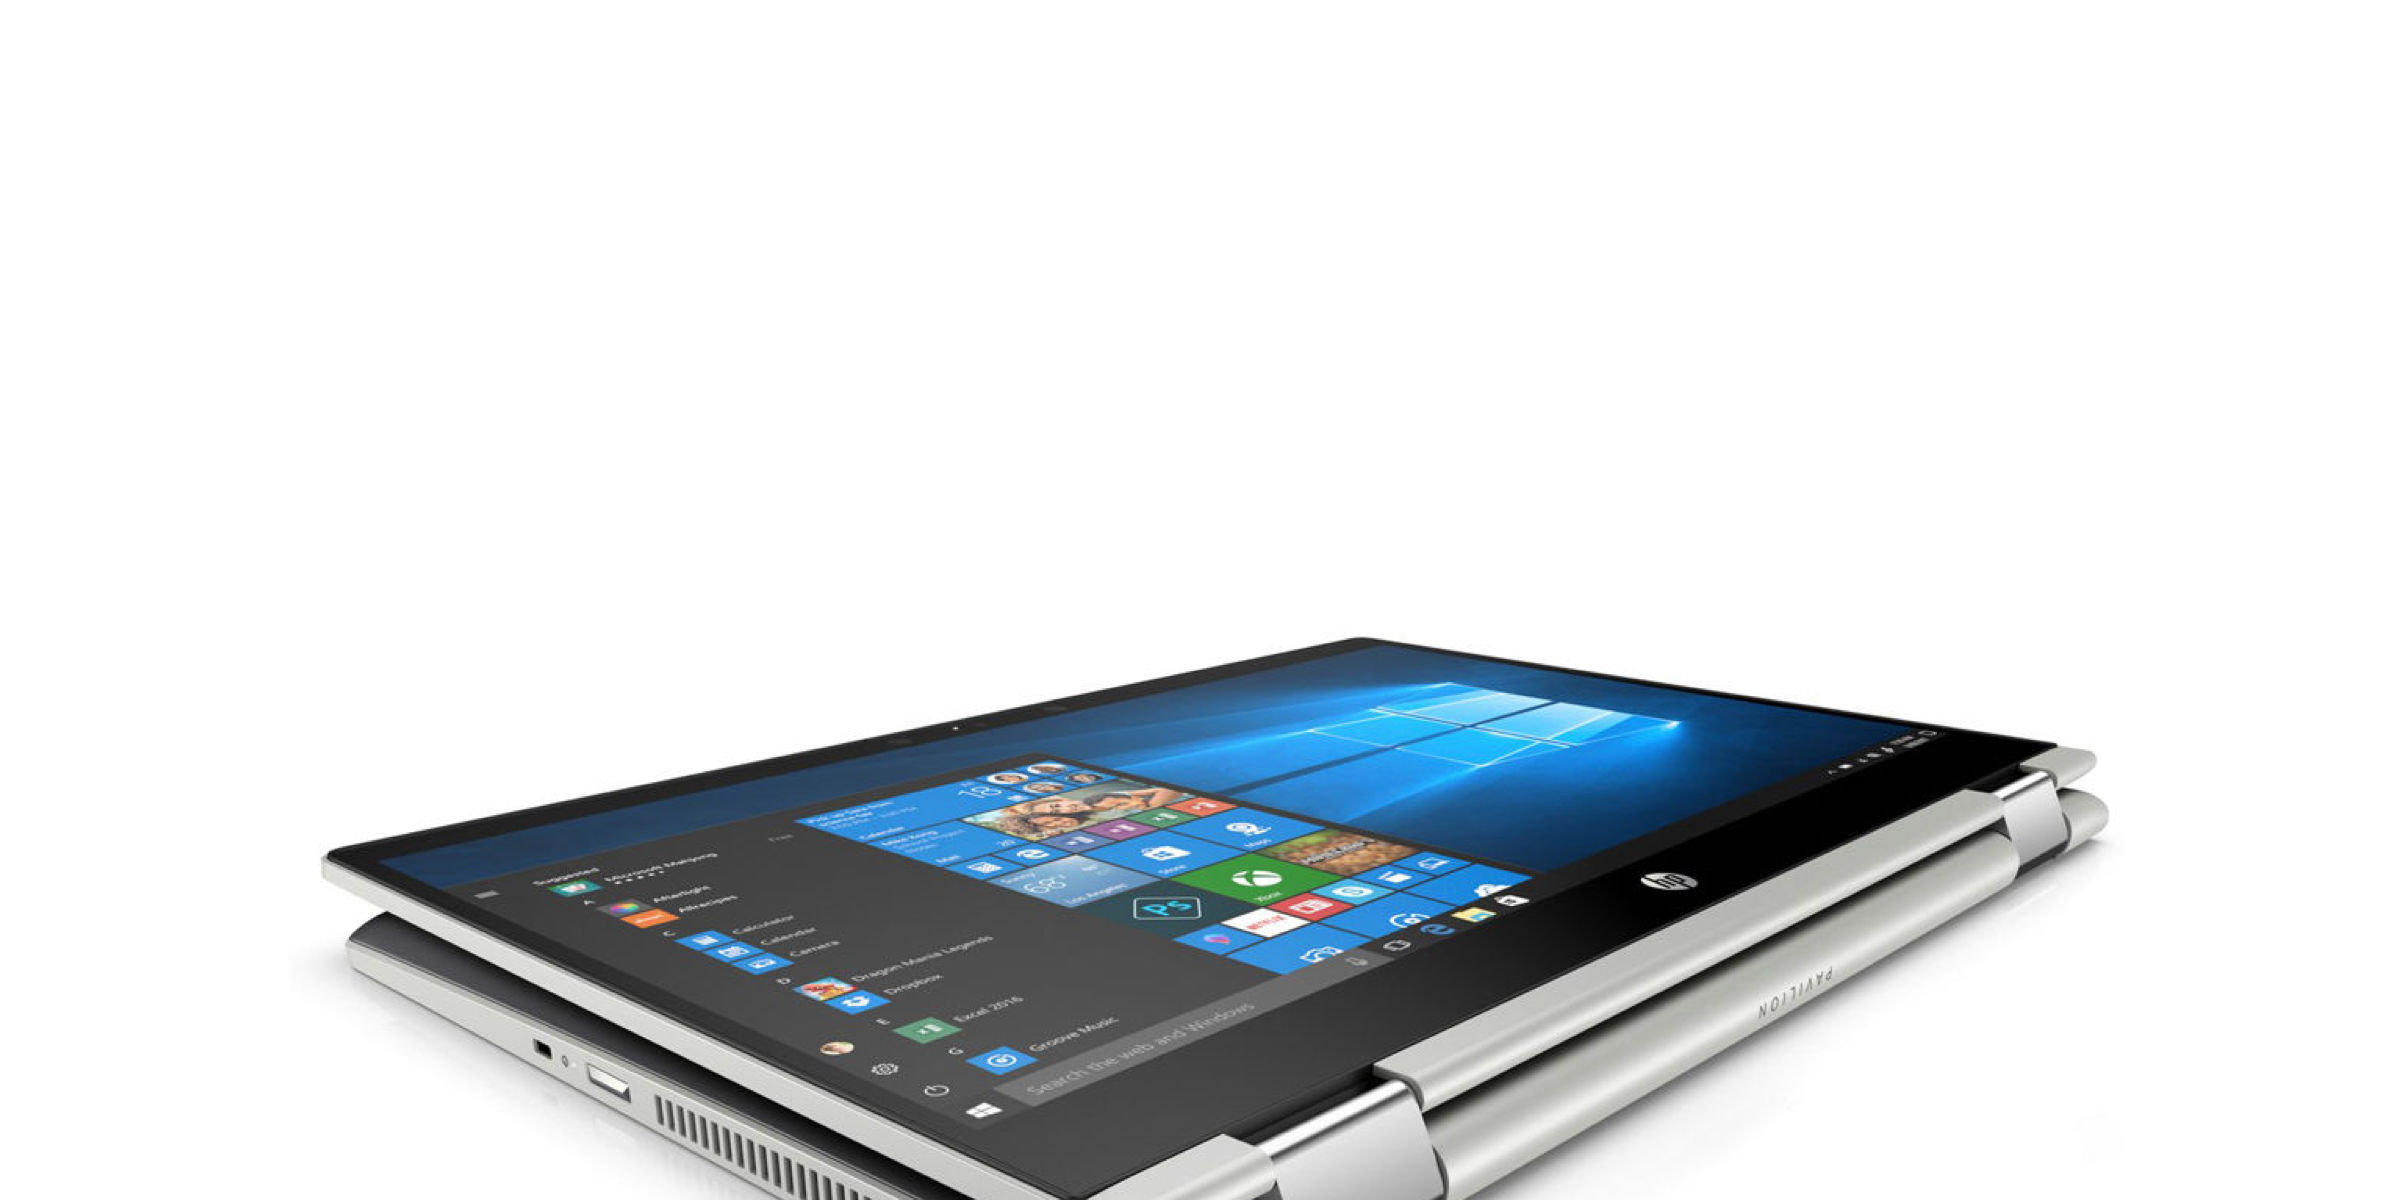
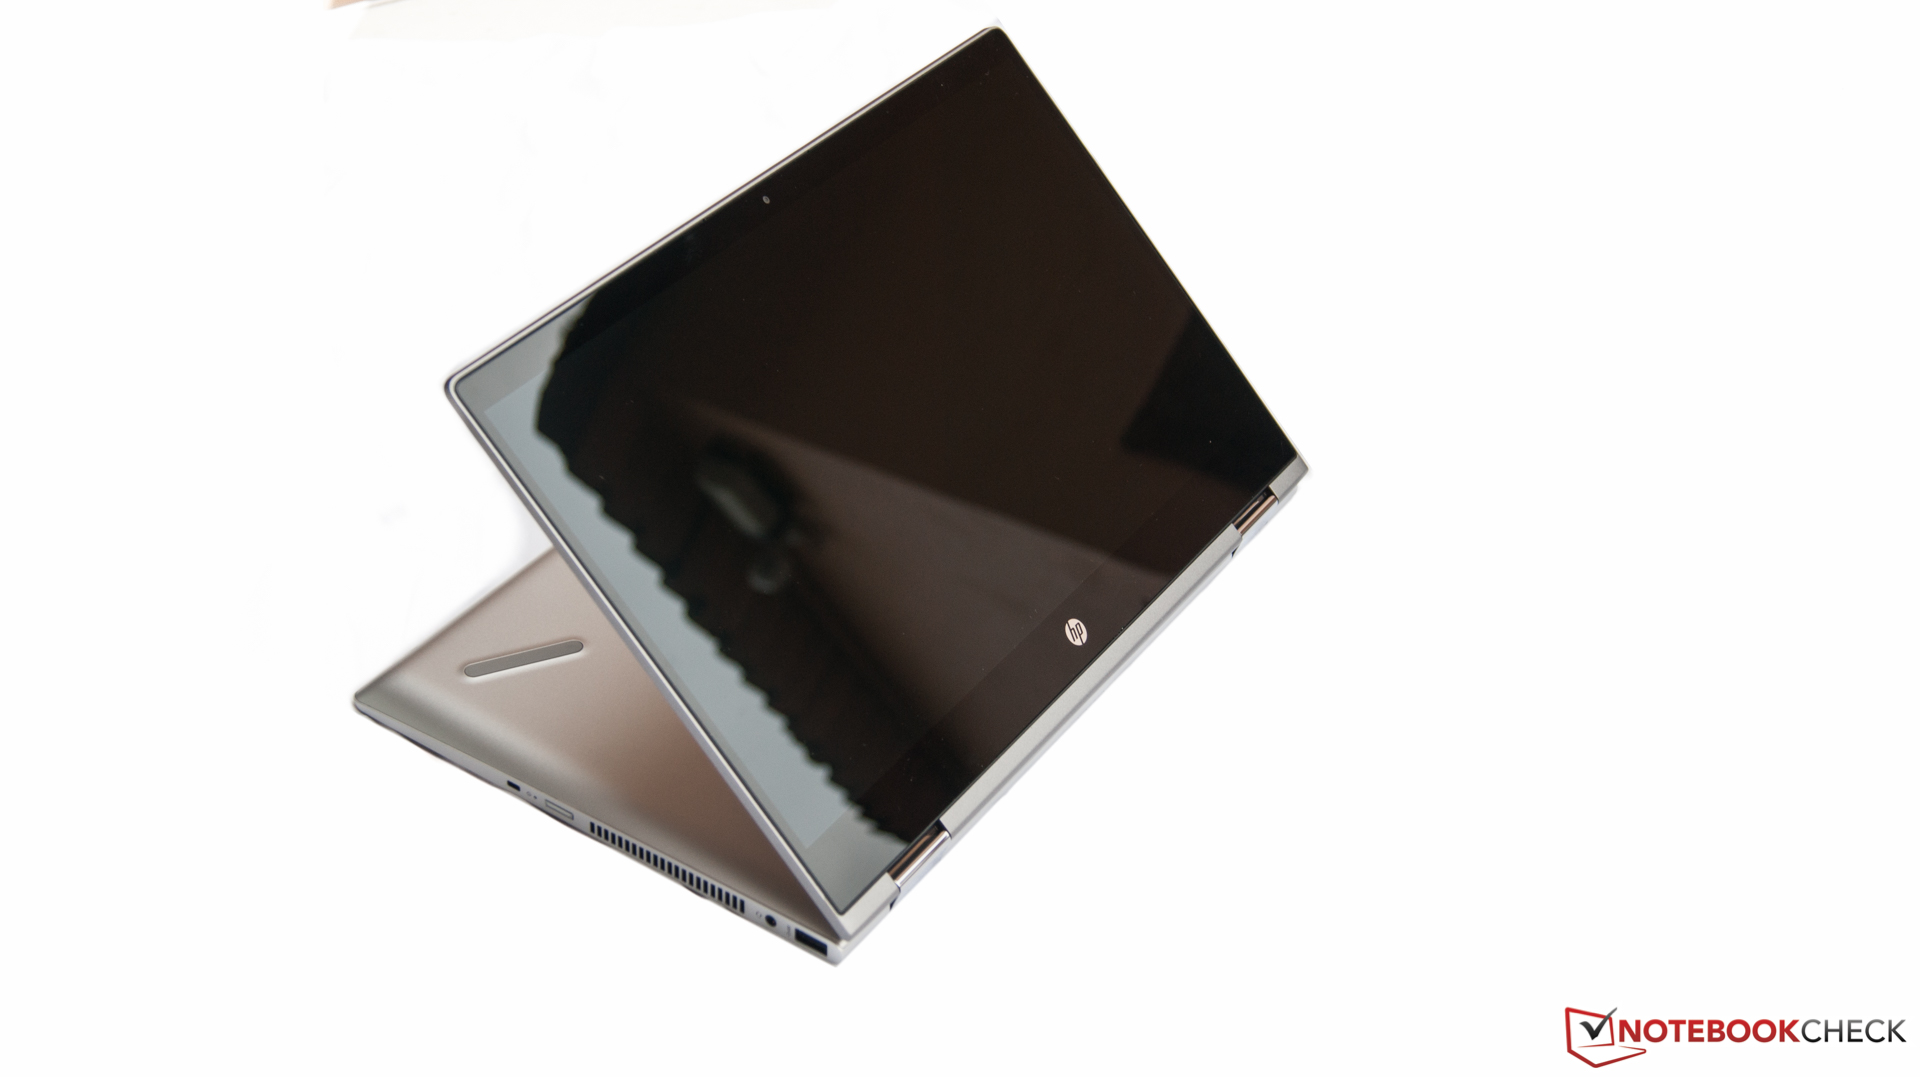
Depois, está a tela, que é brilhante e escura demais para um dispositivo moderno.
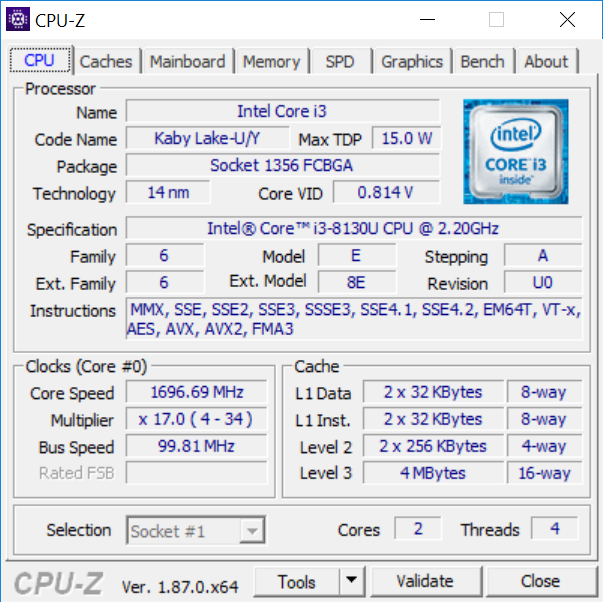
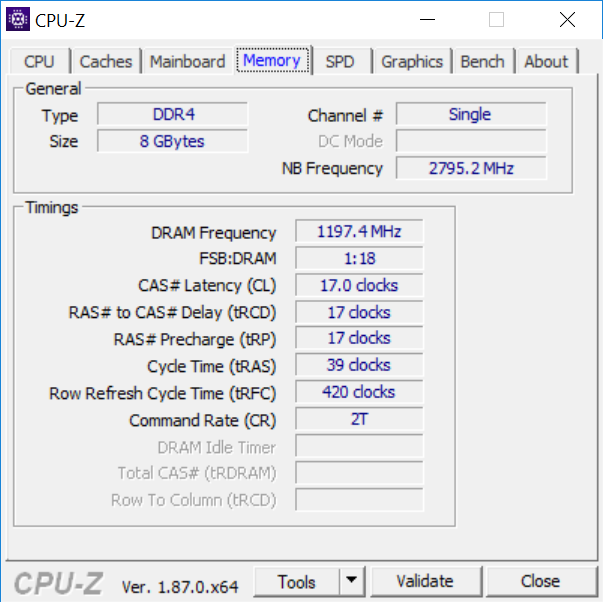
O desempenho, por outro lado, é bastante convincente; a CPU Intel Core i3 e a solução de armazenamento garantem um desempenho de sistema rápido e responsivo. Uma configuração de memória de canal duplo teria melhorado ainda mais o desempenho.
A última grande desvantagem é o ventilador, que é muito sensível às mudanças nas RPM, portanto você pode ouvi-lo praticamente toda vez que faz alguma coisa.
Há um desenvolvimento visível, mas sentimos falta de verdadeiros feitos e melhorias da HP.
O HP Pavilion x360 é um dispositivo de nível de entrada bom e barato, se você quiser um conversível duradouro e principalmente trabalhar em interiores. Ainda recomendamos que você verifique os dispositivos de comparação e nossa lista dos Top 10 Conversíveis se conta um uma reserva financeira.
HP Pavilion x360 14-cd0002ng
- 01/03/2019 v6 (old)
Nino Richizzi
Price comparison
