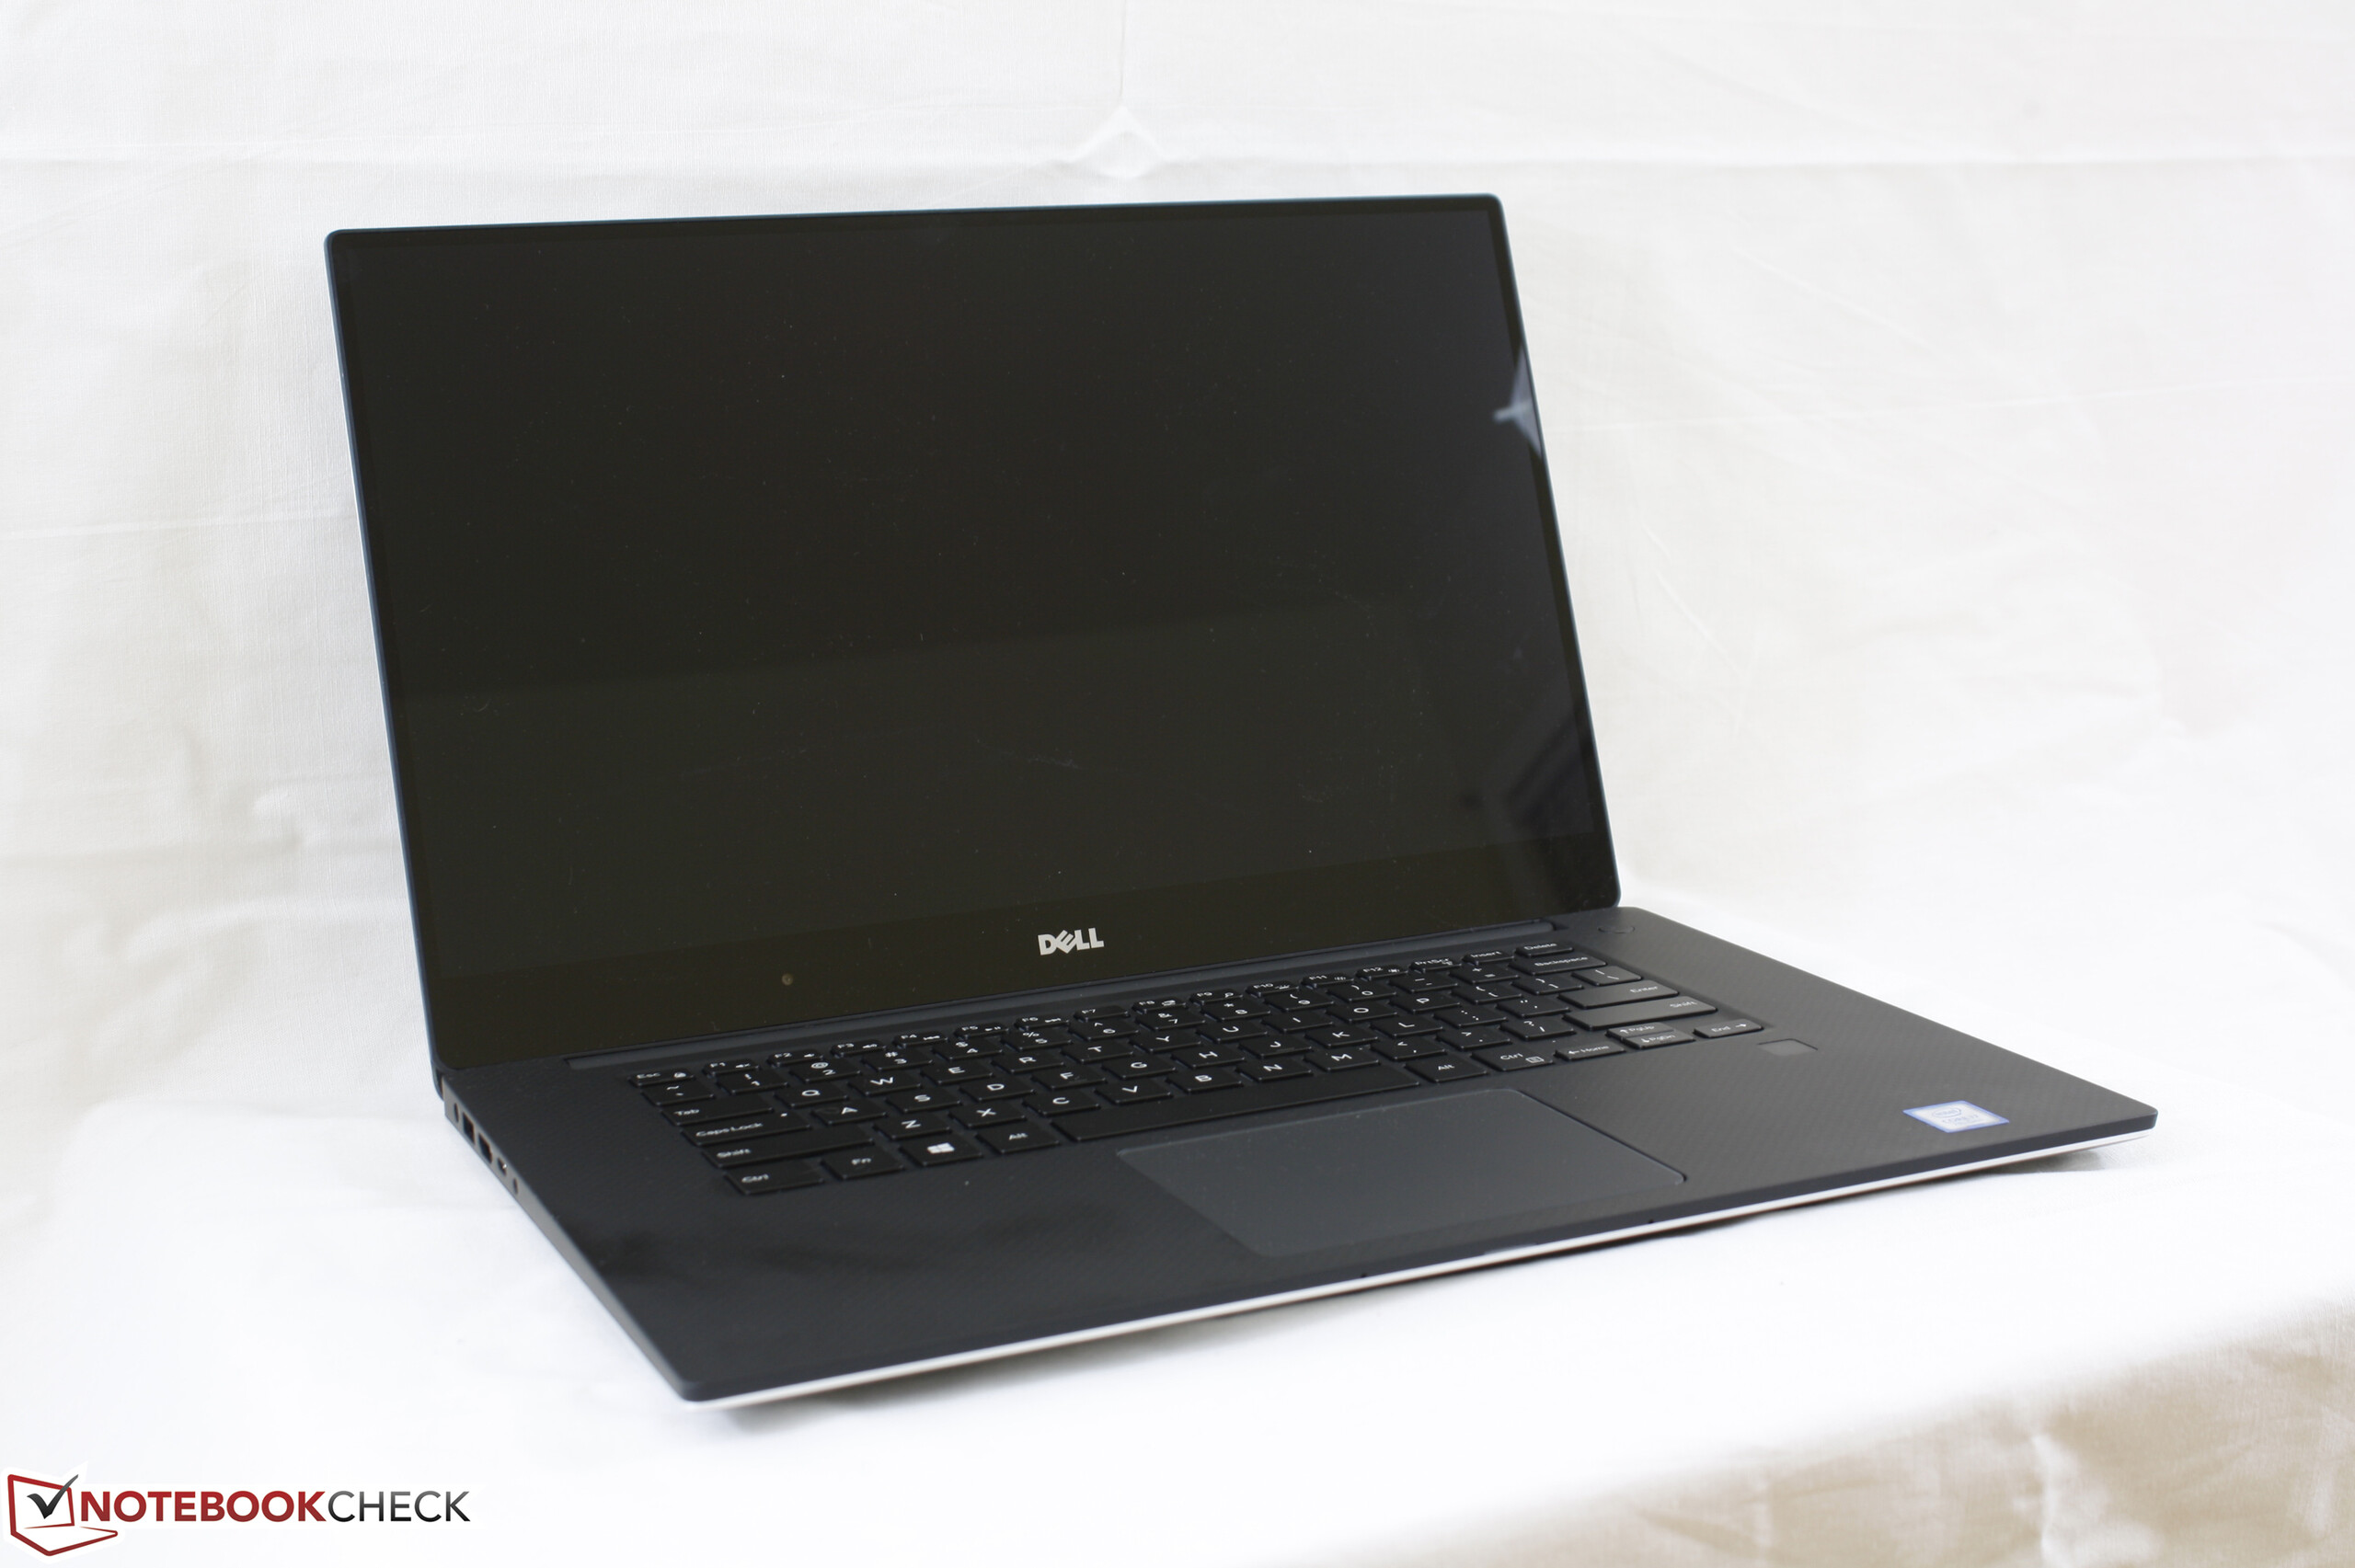
Breve Análise do Portátil Dell XPS 15 9560 (i7-7700HQ, UHD)

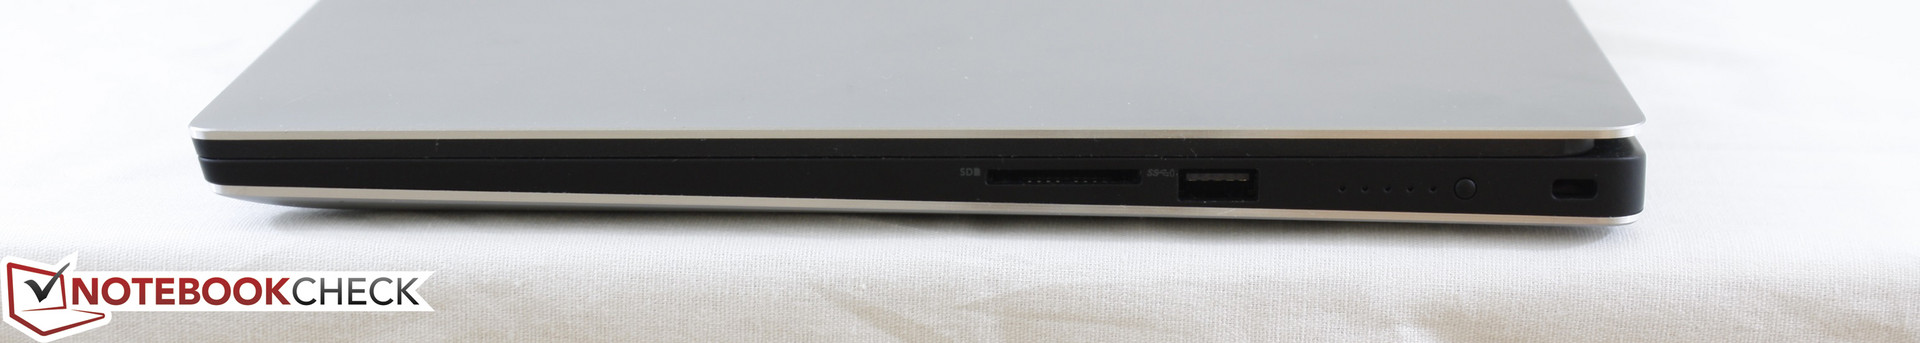
| SD Card Reader | |
| average JPG Copy Test (av. of 3 runs) | |
| HP Spectre x360 15-bl002xx | |
| Dell XPS 15 9560 (i7-7700HQ, UHD) | |
| Asus FX502VM-AS73 | |
| maximum AS SSD Seq Read Test (1GB) | |
| Dell XPS 15 9560 (i7-7700HQ, UHD) | |
| HP Spectre x360 15-bl002xx | |
| Asus FX502VM-AS73 | |
| Networking | |
| iperf3 transmit AX12 | |
| Dell XPS 15 9560 (i7-7700HQ, UHD) | |
| Asus FX502VM-AS73 | |
| HP Spectre x360 15-bl002xx | |
| iperf3 receive AX12 | |
| Dell XPS 15 9560 (i7-7700HQ, UHD) | |
| HP Spectre x360 15-bl002xx | |
| Asus FX502VM-AS73 | |
| |||||||||||||||||||||||||
iluminação: 87 %
iluminação com acumulador: 370.1 cd/m²
Contraste: 1000:1 (Preto: 0.37 cd/m²)
ΔE ColorChecker Calman: 5.3 | ∀{0.5-29.43 Ø4.72}
ΔE Greyscale Calman: 4.6 | ∀{0.09-98 Ø4.97}
100% sRGB (Argyll 1.6.3 3D)
88.3% AdobeRGB 1998 (Argyll 1.6.3 3D)
100% AdobeRGB 1998 (Argyll 3D)
100% sRGB (Argyll 3D)
89.7% Display P3 (Argyll 3D)
Gamma: 2.31
CCT: 6284 K
| Dell XPS 15 9560 (i7-7700HQ, UHD) IGZO IPS, 15.6", 3840x2160 | Asus FX502VM-AS73 TN LED, 15.6", 1920x1080 | Apple MacBook Pro 15 2016 (2.9 GHz, 460) Apple APPA030, IPS, 15.4", 2880x1800 | HP Spectre x360 15-bl002xx UHD UWVA eDP BrightView WLED-backlit , IPS, 15.6", 3840x2160 | Dell XPS 15 2017 9560 (7300HQ, Full-HD) Sharp SHP1453 LQ156M1, LED IGZO IPS InfinityEdge, 15.6", 1920x1080 | |
|---|---|---|---|---|---|
| Display | -54% | -1% | -24% | -18% | |
| Display P3 Coverage (%) | 89.7 | 38.28 -57% | 99 10% | 67.9 -24% | 68.9 -23% |
| sRGB Coverage (%) | 100 | 56.9 -43% | 100 0% | 88.2 -12% | 98.9 -1% |
| AdobeRGB 1998 Coverage (%) | 100 | 39.47 -61% | 87.3 -13% | 64.4 -36% | 70.9 -29% |
| Response Times | 47% | -12% | 12% | -14% | |
| Response Time Grey 50% / Grey 80% * (ms) | 57.2 ? | 28.4 ? 50% | 46 ? 20% | 44 ? 23% | 54 ? 6% |
| Response Time Black / White * (ms) | 39.2 ? | 22.4 ? 43% | 56 ? -43% | 38.8 ? 1% | 52.4 ? -34% |
| PWM Frequency (Hz) | 962 | 119000 ? | 1000 ? | ||
| Screen | -36% | 20% | 15% | 2% | |
| Brightness middle (cd/m²) | 370.1 | 209.5 -43% | 420 13% | 351.5 -5% | 400 8% |
| Brightness (cd/m²) | 356 | 205 -42% | 401 13% | 336 -6% | 392 10% |
| Brightness Distribution (%) | 87 | 92 6% | 90 3% | 83 -5% | 89 2% |
| Black Level * (cd/m²) | 0.37 | 0.69 -86% | 0.3 19% | 0.24 35% | 0.26 30% |
| Contrast (:1) | 1000 | 304 -70% | 1400 40% | 1465 47% | 1538 54% |
| Colorchecker dE 2000 * | 5.3 | 4.7 11% | 3.33 37% | 3.3 38% | 4.9 8% |
| Colorchecker dE 2000 max. * | 9.9 | 19.7 -99% | 5.11 48% | 7.3 26% | 11 -11% |
| Greyscale dE 2000 * | 4.6 | 1.8 61% | 2.73 41% | 1.9 59% | 7.2 -57% |
| Gamma | 2.31 95% | 2.23 99% | 2.48 89% | 2.09 105% | 2.11 104% |
| CCT | 6284 103% | 6975 93% | 6457 101% | 6784 96% | 6911 94% |
| Color Space (Percent of AdobeRGB 1998) (%) | 88.3 | 36.2 -59% | 78.09 -12% | 64.4 -27% | 64.2 -27% |
| Color Space (Percent of sRGB) (%) | 100 | 56.6 -43% | 99.97 0% | 88.2 -12% | 98.9 -1% |
| Média Total (Programa/Configurações) | -14% /
-29% | 2% /
12% | 1% /
7% | -10% /
-4% |
* ... menor é melhor
Exibir tempos de resposta
| ↔ Tempo de resposta preto para branco | ||
|---|---|---|
| 39.2 ms ... ascensão ↗ e queda ↘ combinadas | ↗ 23.6 ms ascensão | 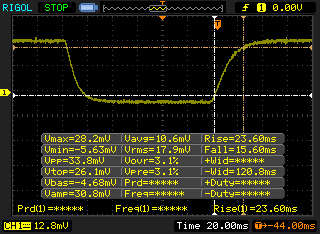 |
| ↘ 15.6 ms queda | ||
| A tela mostra taxas de resposta lentas em nossos testes e será insatisfatória para os jogadores. Em comparação, todos os dispositivos testados variam de 0.1 (mínimo) a 240 (máximo) ms. » 97 % de todos os dispositivos são melhores. Isso significa que o tempo de resposta medido é pior que a média de todos os dispositivos testados (19.8 ms). | ||
| ↔ Tempo de resposta 50% cinza a 80% cinza | ||
| 57.2 ms ... ascensão ↗ e queda ↘ combinadas | ↗ 27.2 ms ascensão | 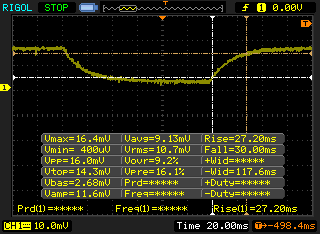 |
| ↘ 30 ms queda | ||
| A tela mostra taxas de resposta lentas em nossos testes e será insatisfatória para os jogadores. Em comparação, todos os dispositivos testados variam de 0.165 (mínimo) a 636 (máximo) ms. » 94 % de todos os dispositivos são melhores. Isso significa que o tempo de resposta medido é pior que a média de todos os dispositivos testados (31 ms). | ||
Cintilação da tela / PWM (modulação por largura de pulso)
| Tela tremeluzindo/PWM detectado | 962 Hz | 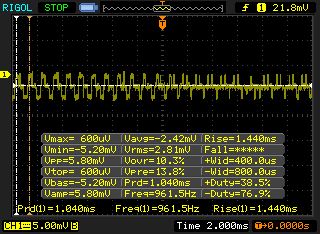 | |
A luz de fundo da tela pisca em 962 Hz (pior caso, por exemplo, utilizando PWM) . A frequência de 962 Hz é bastante alta, então a maioria dos usuários sensíveis ao PWM não deve notar nenhuma oscilação. [pwm_comparison] Em comparação: 52 % de todos os dispositivos testados não usam PWM para escurecer a tela. Se PWM foi detectado, uma média de 7769 (mínimo: 5 - máximo: 343500) Hz foi medida. | |||
| Cinebench R11.5 | |
| CPU Single 64Bit | |
| Apple MacBook Pro 15 2016 (2.9 GHz, 460) | |
| MSI GT62VR 7RE-223 | |
| Dell XPS 15 9560 (i7-7700HQ, UHD) | |
| Eurocom Sky X7E2 | |
| MSI GE62 2QC-468XPL | |
| Asus GL702VM-GC102D | |
| Toshiba Satellite S70-B-106 | |
| CPU Multi 64Bit | |
| Eurocom Sky X7E2 | |
| MSI GT62VR 7RE-223 | |
| Dell XPS 15 9560 (i7-7700HQ, UHD) | |
| MSI GE62 2QC-468XPL | |
| Apple MacBook Pro 15 2016 (2.9 GHz, 460) | |
| Asus GL702VM-GC102D | |
| Toshiba Satellite S70-B-106 | |
| Cinebench R10 | |
| Rendering Multiple CPUs 32Bit | |
| Eurocom Sky X7E2 | |
| Apple MacBook Pro 15 2016 (2.9 GHz, 460) | |
| MSI GT62VR 7RE-223 | |
| MSI GE62 2QC-468XPL | |
| Dell XPS 15 9560 (i7-7700HQ, UHD) | |
| Asus GL702VM-GC102D | |
| Rendering Single 32Bit | |
| Eurocom Sky X7E2 | |
| Apple MacBook Pro 15 2016 (2.9 GHz, 460) | |
| MSI GT62VR 7RE-223 | |
| Dell XPS 15 9560 (i7-7700HQ, UHD) | |
| MSI GE62 2QC-468XPL | |
| Asus GL702VM-GC102D | |
| wPrime 2.10 - 1024m | |
| Apple MacBook Pro 15 2016 (2.9 GHz, 460) | |
| Dell XPS 15 9560 (i7-7700HQ, UHD) | |
| MSI GE62 2QC-468XPL | |
| Eurocom Sky X7E2 | |
* ... menor é melhor
| PCMark 8 Home Score Accelerated v2 | 3588 pontos | |
| PCMark 8 Creative Score Accelerated v2 | 5114 pontos | |
| PCMark 8 Work Score Accelerated v2 | 4422 pontos | |
Ajuda | ||
| Dell XPS 15 9560 (i7-7700HQ, UHD) Lite-On CX2-8B512-Q11 | Asus FX502VM-AS73 SK Hynix HFS256G39TND-N210A | Apple MacBook Pro 15 2016 (2.9 GHz, 460) Apple SSD SM1024L | HP Spectre x360 15-bl002xx Toshiba XG4 NVMe (THNSN5512GPUK) | Dell Latitude 15 E5570 Samsung SSD PM871 MZ7LN128HCHP | |
|---|---|---|---|---|---|
| CrystalDiskMark 3.0 | -62% | -11% | -11% | -58% | |
| Read Seq (MB/s) | 1684 | 503 -70% | 1458 -13% | 1266 -25% | 474.7 -72% |
| Write Seq (MB/s) | 1106 | 138.2 -88% | 1440 30% | 982 -11% | 155 -86% |
| Read 512 (MB/s) | 977 | 343.5 -65% | 914 -6% | 834 -15% | 393.6 -60% |
| Write 512 (MB/s) | 1119 | 137.8 -88% | 1058 -5% | 714 -36% | 119.7 -89% |
| Read 4k (MB/s) | 45.14 | 29.36 -35% | 9.786 -78% | 40.72 -10% | 34 -25% |
| Write 4k (MB/s) | 134.1 | 70.9 -47% | 10.9 -92% | 139.4 4% | 96.6 -28% |
| Read 4k QD32 (MB/s) | 509 | 369.9 -27% | 679 33% | 527 4% | 383.3 -25% |
| Write 4k QD32 (MB/s) | 398.1 | 99.7 -75% | 562 41% | 395.2 -1% | 100.2 -75% |

| 3DMark | |
| 1280x720 Cloud Gate Standard Graphics | |
| Asus FX502VM-AS73 | |
| Gigabyte P57X v7 | |
| Asus Strix GL502VT-DS74 | |
| MSI GE72 7RE-046 | |
| Zotac GeForce GTX 1050 2GB | |
| Dell XPS 15 9560 (i7-7700HQ, UHD) | |
| Apple MacBook Pro 15 2016 (2.9 GHz, 460) | |
| Asus Zenbook UX510UW-CN044T | |
| 1920x1080 Fire Strike Graphics | |
| Gigabyte P57X v7 | |
| Asus FX502VM-AS73 | |
| MSI GE72 7RE-046 | |
| Asus Strix GL502VT-DS74 | |
| Zotac GeForce GTX 1050 2GB | |
| Dell XPS 15 9560 (i7-7700HQ, UHD) | |
| Apple MacBook Pro 15 2016 (2.9 GHz, 460) | |
| Asus Zenbook UX510UW-CN044T | |
| Fire Strike Extreme Graphics | |
| Gigabyte P57X v7 | |
| Asus FX502VM-AS73 | |
| Asus Strix GL502VT-DS74 | |
| Zotac GeForce GTX 1050 2GB | |
| Dell XPS 15 9560 (i7-7700HQ, UHD) | |
| Apple MacBook Pro 15 2016 (2.9 GHz, 460) | |
| Asus Zenbook UX510UW-CN044T | |
| 3840x2160 Fire Strike Ultra Graphics | |
| Gigabyte P57X v7 | |
| Asus FX502VM-AS73 | |
| Dell XPS 15 9560 (i7-7700HQ, UHD) | |
| 3DMark Ice Storm Standard Score | 31054 pontos | |
| 3DMark Cloud Gate Standard Score | 18212 pontos | |
| 3DMark Fire Strike Score | 5524 pontos | |
| 3DMark Fire Strike Extreme Score | 2686 pontos | |
Ajuda | ||
| Rise of the Tomb Raider - 1920x1080 Very High Preset AA:FX AF:16x | |
| Asus FX502VM-AS73 | |
| MSI GE72 7RE-046 | |
| Zotac GeForce GTX 1050 2GB | |
| Dell XPS 15 9560 (i7-7700HQ, UHD) | |
| Dell XPS 15 9550 i7 FHD | |
| Metro: Last Light - 1920x1080 Very High (DX11) AF:16x | |
| Asus FX502VM-AS73 | |
| Aorus X3 Plus v5 | |
| Zotac GeForce GTX 1050 2GB | |
| Dell XPS 15 9560 (i7-7700HQ, UHD) | |
| Dell XPS 15 9550 i7 FHD | |
| BioShock Infinite - 1920x1080 Ultra Preset, DX11 (DDOF) | |
| Asus FX502VM-AS73 | |
| Aorus X3 Plus v5 | |
| Zotac GeForce GTX 1050 2GB | |
| Dell XPS 15 9560 (i7-7700HQ, UHD) | |
| Dell XPS 15 9550 i7 FHD | |
| Thief - 1920x1080 Very High Preset AA:FXAA & High SS AF:8x | |
| Asus FX502VM-AS73 | |
| Aorus X3 Plus v5 | |
| Dell XPS 15 9560 (i7-7700HQ, UHD) | |
| Dell XPS 15 9550 i7 FHD | |
| Batman: Arkham Knight - 1920x1080 High / On AA:SM AF:16x | |
| MSI GE72 7RE-046 | |
| Dell XPS 15 9560 (i7-7700HQ, UHD) | |
| Dell XPS 15 9550 i7 FHD | |
| Fallout 4 - 1920x1080 Ultra Preset AA:T AF:16x | |
| Asus FX502VM-AS73 | |
| MSI GE72 7RE-046 | |
| Aorus X3 Plus v5 | |
| Zotac GeForce GTX 1050 2GB | |
| Dell XPS 15 9560 (i7-7700HQ, UHD) | |
| Dell XPS 15 9550 i7 FHD | |
| Doom - 1920x1080 Ultra Preset AA:SM | |
| Asus FX502VM-AS73 | |
| MSI GE72 7RE-046 | |
| Dell XPS 15 9560 (i7-7700HQ, UHD) | |
| Zotac GeForce GTX 1050 2GB | |
| Overwatch - 1920x1080 Epic (Render Scale 100 %) AA:SM AF:16x | |
| Asus FX502VM-AS73 | |
| MSI GE72 7RE-046 | |
| Zotac GeForce GTX 1050 2GB | |
| Dell XPS 15 9560 (i7-7700HQ, UHD) | |
| Mafia 3 - 1920x1080 High Preset | |
| Asus FX502VM-AS73 | |
| MSI GE72 7RE-046 | |
| Zotac GeForce GTX 1050 2GB | |
| Dell XPS 15 9560 (i7-7700HQ, UHD) | |
| baixo | média | alto | ultra | 4K | |
|---|---|---|---|---|---|
| StarCraft II: Heart of the Swarm (2013) | 71 | ||||
| BioShock Infinite (2013) | 152.5 | 66 | |||
| Metro: Last Light (2013) | 83.9 | 45.1 | |||
| Thief (2014) | 76 | 41.9 | |||
| The Witcher 3 (2015) | 64.9 | 38.2 | 19.8 | ||
| Batman: Arkham Knight (2015) | 83 | 48 | 33 | 15 | |
| Metal Gear Solid V (2015) | 60 | 53.4 | 24.8 | ||
| Dota 2 Reborn (2015) | 34 | ||||
| Fallout 4 (2015) | 41.7 | 34.6 | 14 | ||
| Rise of the Tomb Raider (2016) | 71.9 | 39.8 | 32.9 | 13.1 | |
| Ashes of the Singularity (2016) | 34.9 | 29.8 | |||
| Doom (2016) | 57 | 53.8 | 17.5 | ||
| Overwatch (2016) | 90.7 | 54.5 | 30.2 | ||
| Mafia 3 (2016) | 21 |
Barulho
| Ocioso |
| 29 / 29 / 32.2 dB |
| Carga |
| 47.1 / 47.1 dB |
 | ||
30 dB silencioso 40 dB(A) audível 50 dB(A) ruidosamente alto |
||
min: | ||
| Dell XPS 15 9560 (i7-7700HQ, UHD) | Asus FX502VM-AS73 | Apple MacBook Pro 15 2016 (2.9 GHz, 460) | Dell XPS 15 2017 9560 (7300HQ, Full-HD) | Dell XPS 15 9550 i7 FHD | |
|---|---|---|---|---|---|
| Noise | -3% | 4% | -5% | 6% | |
| desligado / ambiente * (dB) | 28.4 | 28.7 -1% | 29 -2% | 30.3 -7% | |
| Idle Minimum * (dB) | 29 | 30.6 -6% | 30.3 -4% | 31.6 -9% | 29.2 -1% |
| Idle Average * (dB) | 29 | 30.6 -6% | 30.3 -4% | 31.6 -9% | 29.3 -1% |
| Idle Maximum * (dB) | 32.2 | 31 4% | 30.3 6% | 33.4 -4% | 29.5 8% |
| Load Average * (dB) | 47.1 | 46.2 2% | 35.1 25% | 47.8 -1% | 36.5 23% |
| Witcher 3 ultra * (dB) | 52 | ||||
| Load Maximum * (dB) | 47.1 | 52.3 -11% | 46 2% | 47.8 -1% | 47.7 -1% |
* ... menor é melhor
(-) A temperatura máxima no lado superior é 48.8 °C / 120 F, em comparação com a média de 36.8 °C / 98 F , variando de 21 a 71 °C para a classe Multimedia.
(±) A parte inferior aquece até um máximo de 42.6 °C / 109 F, em comparação com a média de 39.1 °C / 102 F
(+) Em uso inativo, a temperatura média para o lado superior é 24.6 °C / 76 F, em comparação com a média do dispositivo de 31.3 °C / ### class_avg_f### F.
(±) Jogando The Witcher 3, a temperatura média para o lado superior é 36.8 °C / 98 F, em comparação com a média do dispositivo de 31.3 °C / ## #class_avg_f### F.
(+) Os apoios para as mãos e o touchpad são mais frios que a temperatura da pele, com um máximo de 30.2 °C / 86.4 F e, portanto, são frios ao toque.
(±) A temperatura média da área do apoio para as mãos de dispositivos semelhantes foi 28.7 °C / 83.7 F (-1.5 °C / -2.7 F).
Dell XPS 15 9560 (i7-7700HQ, UHD) análise de áudio
(-) | alto-falantes não muito altos (###valor### dB)
Graves 100 - 315Hz
(±) | graves reduzidos - em média 12.9% menor que a mediana
(±) | a linearidade dos graves é média (14.3% delta para a frequência anterior)
Médios 400 - 2.000 Hz
(+) | médios equilibrados - apenas 3.5% longe da mediana
(±) | a linearidade dos médios é média (8.9% delta para frequência anterior)
Altos 2 - 16 kHz
(+) | agudos equilibrados - apenas 2.3% longe da mediana
(±) | a linearidade dos máximos é média (7.3% delta para frequência anterior)
Geral 100 - 16.000 Hz
(±) | a linearidade do som geral é média (16.2% diferença em relação à mediana)
Comparado com a mesma classe
» 41% de todos os dispositivos testados nesta classe foram melhores, 7% semelhantes, 51% piores
» O melhor teve um delta de 5%, a média foi 17%, o pior foi 45%
Comparado com todos os dispositivos testados
» 26% de todos os dispositivos testados foram melhores, 6% semelhantes, 68% piores
» O melhor teve um delta de 4%, a média foi 24%, o pior foi 134%
Apple MacBook 12 (Early 2016) 1.1 GHz análise de áudio
(+) | os alto-falantes podem tocar relativamente alto (###valor### dB)
Graves 100 - 315Hz
(±) | graves reduzidos - em média 11.3% menor que a mediana
(±) | a linearidade dos graves é média (14.2% delta para a frequência anterior)
Médios 400 - 2.000 Hz
(+) | médios equilibrados - apenas 2.4% longe da mediana
(+) | médios são lineares (5.5% delta para frequência anterior)
Altos 2 - 16 kHz
(+) | agudos equilibrados - apenas 2% longe da mediana
(+) | os máximos são lineares (4.5% delta da frequência anterior)
Geral 100 - 16.000 Hz
(+) | o som geral é linear (10.2% diferença em relação à mediana)
Comparado com a mesma classe
» 7% de todos os dispositivos testados nesta classe foram melhores, 2% semelhantes, 91% piores
» O melhor teve um delta de 5%, a média foi 18%, o pior foi 53%
Comparado com todos os dispositivos testados
» 5% de todos os dispositivos testados foram melhores, 1% semelhantes, 94% piores
» O melhor teve um delta de 4%, a média foi 24%, o pior foi 134%
| desligado | |
| Ocioso | |
| Carga |
|
Key:
min: | |
| Dell XPS 15 9560 (i7-7700HQ, UHD) i7-7700HQ, GeForce GTX 1050 Mobile, Lite-On CX2-8B512-Q11, IGZO IPS, 3840x2160, 15.6" | Asus FX502VM-AS73 i7-7700HQ, GeForce GTX 1060 Mobile, SK Hynix HFS256G39TND-N210A, TN LED, 1920x1080, 15.6" | Apple MacBook Pro 15 2016 (2.9 GHz, 460) 6920HQ, Radeon Pro 460, Apple SSD SM1024L, IPS, 2880x1800, 15.4" | HP Spectre x360 15-bl002xx i7-7500U, GeForce 940MX, Toshiba XG4 NVMe (THNSN5512GPUK), IPS, 3840x2160, 15.6" | Dell XPS 15 2017 9560 (7300HQ, Full-HD) i5-7300HQ, GeForce GTX 1050 Mobile, WDC WD10SPCX-75KHST0 + SanDisk Z400s M.2 2242 32 GB Cache, LED IGZO IPS InfinityEdge, 1920x1080, 15.6" | |
|---|---|---|---|---|---|
| Power Consumption | -7% | 39% | 38% | 28% | |
| Idle Minimum * (Watt) | 11.9 | 14.9 -25% | 3 75% | 8.14 32% | 6.6 45% |
| Idle Average * (Watt) | 17.1 | 15.1 12% | 9.9 42% | 10.91 36% | 9 47% |
| Idle Maximum * (Watt) | 17.3 | 15.2 12% | 12.5 28% | 12.26 29% | 10.7 38% |
| Load Average * (Watt) | 94.7 | 105.8 -12% | 70.6 25% | 45.67 52% | 77.5 18% |
| Witcher 3 ultra * (Watt) | 104.8 | ||||
| Load Maximum * (Watt) | 122 | 148.8 -22% | 90.8 26% | 74.94 39% | 130 -7% |
* ... menor é melhor
| Dell XPS 15 9560 (i7-7700HQ, UHD) i7-7700HQ, GeForce GTX 1050 Mobile, 97 Wh | Asus FX502VM-AS73 i7-7700HQ, GeForce GTX 1060 Mobile, 64 Wh | Apple MacBook Pro 15 2016 (2.9 GHz, 460) 6920HQ, Radeon Pro 460, 76 Wh | HP Spectre x360 15-bl002xx i7-7500U, GeForce 940MX, 79.2 Wh | Dell XPS 15 2017 9560 (7300HQ, Full-HD) i5-7300HQ, GeForce GTX 1050 Mobile, 56 Wh | |
|---|---|---|---|---|---|
| Duração da bateria | -42% | -2% | 25% | -24% | |
| Reader / Idle (h) | 13.9 | 6.1 -56% | 14.4 4% | 9.4 -32% | |
| WiFi v1.3 (h) | 7.2 | 4.6 -36% | 10.3 43% | 8.9 24% | 5.6 -22% |
| Load (h) | 1.7 | 1.1 -35% | 0.9 -47% | 2.5 47% | 1.4 -18% |
Pro
Contra
Em nossa análise do Kaby Lake XPS 9360, mencionamos que as vantagens do desempenho e a duração da bateria sobre o XPS 9350 Skylake são tão minúsculas que os usuários podem querer considerar economizar algumas centenas de Dólares comprando o modelo antigo. O mesmo se aplica aqui para o XPS 9560 dado que o i7-7700HQ oferece muitos poucos benefícios tangíveis sobre o i7-6700HQ no XPS 9550 quando comparado com as diferenças de preço entre eles.
Um dos principais efeitos a considerar é a GPU GTX 1050 GPU nesta iteração mais recente da XPS 15. O desempenho gráfico tem um aumento considerável sobre a GTX 960M na XPS 15 9550 e inclusive poderia ser considerada excessiva para usuários que simplesmente desejam usar o portátil para o processamento de textos e streaming de mídia. Para esses usuários que se inclinam mais por pela qualidade e design do portátil que pelo desempenho, o SKU de nível de entrada de $999 USD de a dGPU, é, de fato, muito atraente. Os gamers casuais à procura de uma máquina Windows versátil, tanto para escritório como para jogos, encontrarão o XPS 9560 sendo muito mais poderoso que o XPS 15 9550, Radeon MacBook Pro 15, e outros concorrentes, nesta categoria em particular. Alternativas mais baratas existentes, como o Pavilion 15 UHD com opções GTX 1050, mas a qualidade de construção é de mundos bem distintos.
A característica que mais define o XPS 15 9560 em comparação com o XPS 15 9550 é o grande salto no poder da GPU. Se o desempenho gráfico extra não for necessário, então o SKU 9560 de nível de entrada ou inclusive um 9550 mais antigo seria mais conveniente para o bolso.
Dell XPS 15 9560 (i7-7700HQ, UHD)
- 03/15/2017 v6 (old)
Allen Ngo
Price comparison
