Breve Análise do HP Spectre x360 13: conversível elegante frustrado pela sua tela
| SD Card Reader | |
| average JPG Copy Test (av. of 3 runs) | |
| Dell XPS 13 7390 2-in-1 Core i3 (Toshiba Exceria Pro M501 64 GB UHS-II) | |
| HP Spectre x360 13-ap0312ng (Toshiba Exceria Pro M501 64 GB UHS-II) | |
| HP Spectre x360 13-ae048ng (Toshiba Exceria Pro M501 microSDXC 64GB) | |
| Lenovo ThinkPad X390 Yoga-20NQS05R00 (Toshiba Exceria Pro M501) | |
| Média da turma Convertible (29.4 - 186, n=21, últimos 2 anos) | |
| maximum AS SSD Seq Read Test (1GB) | |
| HP Spectre x360 13-ae048ng (Toshiba Exceria Pro M501 microSDXC 64GB) | |
| Dell XPS 13 7390 2-in-1 Core i3 (Toshiba Exceria Pro M501 64 GB UHS-II) | |
| HP Spectre x360 13-ap0312ng (Toshiba Exceria Pro M501 64 GB UHS-II) | |
| Média da turma Convertible (67.5 - 254, n=20, últimos 2 anos) | |
| Lenovo ThinkPad X390 Yoga-20NQS05R00 (Toshiba Exceria Pro M501) | |
| |||||||||||||||||||||||||
iluminação: 84 %
iluminação com acumulador: 271 cd/m²
Contraste: 697:1 (Preto: 0.39 cd/m²)
ΔE ColorChecker Calman: 4.3 | ∀{0.5-29.43 Ø4.71}
calibrated: 2.4
ΔE Greyscale Calman: 4.4 | ∀{0.09-98 Ø4.96}
89.8% sRGB (Argyll 1.6.3 3D)
58.9% AdobeRGB 1998 (Argyll 1.6.3 3D)
64.1% AdobeRGB 1998 (Argyll 3D)
89.8% sRGB (Argyll 3D)
63% Display P3 (Argyll 3D)
Gamma: 1.97
CCT: 5825 K
| HP Spectre x360 13-ap0312ng M133NVF3, , 1920x1080, 13.3" | Dell XPS 13 7390 2-in-1 Core i3 Sharp LQ134N1, , 1920x1200, 13.4" | Lenovo ThinkPad X390 Yoga-20NQS05R00 LP133WF7-SPA1, , 1920x1080, 13.3" | Lenovo Yoga C930-13IKB B139HAN03_0, , 1920x1080, 13.9" | HP Spectre x360 13-ae048ng Chi Mei (CMN1376), , 1920x1080, 13.3" | |
|---|---|---|---|---|---|
| Display | 9% | 5% | 3% | 10% | |
| Display P3 Coverage (%) | 63 | 68.6 9% | 65.2 3% | 64.3 2% | 68.1 8% |
| sRGB Coverage (%) | 89.8 | 98.2 9% | 97 8% | 94.6 5% | 99.5 11% |
| AdobeRGB 1998 Coverage (%) | 64.1 | 70.4 10% | 67.3 5% | 66.2 3% | 70.2 10% |
| Response Times | -63% | -79% | -39% | -29% | |
| Response Time Grey 50% / Grey 80% * (ms) | 29.2 ? | 46 ? -58% | 59.2 ? -103% | 40.8 ? -40% | 36 ? -23% |
| Response Time Black / White * (ms) | 20 ? | 33.6 ? -68% | 30.8 ? -54% | 27.6 ? -38% | 27 ? -35% |
| PWM Frequency (Hz) | 1000 ? | 2525 ? | 25000 ? | ||
| Screen | 53% | 20% | -7% | 18% | |
| Brightness middle (cd/m²) | 272 | 576.3 112% | 319 17% | 316 16% | 311 14% |
| Brightness (cd/m²) | 298 | 555 86% | 306 3% | 291 -2% | 278 -7% |
| Brightness Distribution (%) | 84 | 88 5% | 90 7% | 83 -1% | 82 -2% |
| Black Level * (cd/m²) | 0.39 | 0.33 15% | 0.15 62% | 0.36 8% | 0.2 49% |
| Contrast (:1) | 697 | 1746 151% | 2127 205% | 878 26% | 1555 123% |
| Colorchecker dE 2000 * | 4.3 | 1.45 66% | 6.1 -42% | 5.9 -37% | 3.98 7% |
| Colorchecker dE 2000 max. * | 9 | 4.12 54% | 9.7 -8% | 12.9 -43% | 8.48 6% |
| Colorchecker dE 2000 calibrated * | 2.4 | 1.19 50% | 1 58% | 1.3 46% | |
| Greyscale dE 2000 * | 4.4 | 3.1 30% | 8.6 -95% | 8.6 -95% | 5.57 -27% |
| Gamma | 1.97 112% | 2.27 97% | 2.62 84% | 2.1 105% | 2.51 88% |
| CCT | 5825 112% | 6931 94% | 6613 98% | 6854 95% | 7810 83% |
| Color Space (Percent of AdobeRGB 1998) (%) | 58.9 | 64.2 9% | 61.9 5% | 60.7 3% | 64 9% |
| Color Space (Percent of sRGB) (%) | 89.8 | 98.5 10% | 96.8 8% | 94.5 5% | 99 10% |
| Média Total (Programa/Configurações) | -0% /
31% | -18% /
5% | -14% /
-9% | -0% /
10% |
* ... menor é melhor
Exibir tempos de resposta
| ↔ Tempo de resposta preto para branco | ||
|---|---|---|
| 20 ms ... ascensão ↗ e queda ↘ combinadas | ↗ 10.8 ms ascensão | 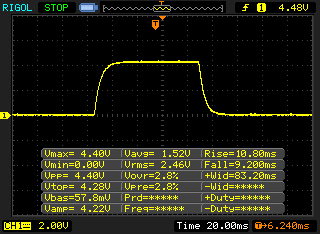 |
| ↘ 9.2 ms queda | ||
| A tela mostra boas taxas de resposta em nossos testes, mas pode ser muito lenta para jogadores competitivos. Em comparação, todos os dispositivos testados variam de 0.1 (mínimo) a 240 (máximo) ms. » 44 % de todos os dispositivos são melhores. Isso significa que o tempo de resposta medido é semelhante à média de todos os dispositivos testados (19.8 ms). | ||
| ↔ Tempo de resposta 50% cinza a 80% cinza | ||
| 29.2 ms ... ascensão ↗ e queda ↘ combinadas | ↗ 14 ms ascensão | 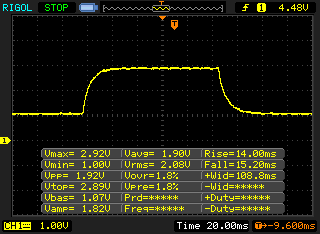 |
| ↘ 15.2 ms queda | ||
| A tela mostra taxas de resposta relativamente lentas em nossos testes e pode ser muito lenta para os jogadores. Em comparação, todos os dispositivos testados variam de 0.165 (mínimo) a 636 (máximo) ms. » 40 % de todos os dispositivos são melhores. Isso significa que o tempo de resposta medido é semelhante à média de todos os dispositivos testados (31 ms). | ||
Cintilação da tela / PWM (modulação por largura de pulso)
| Tela tremeluzindo/PWM detectado | 1000 Hz | ≤ 99 % configuração de brilho | 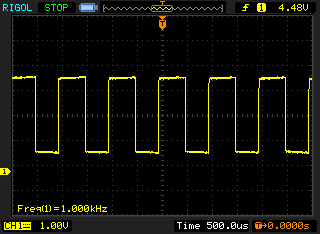 |
A luz de fundo da tela pisca em 1000 Hz (pior caso, por exemplo, utilizando PWM) Cintilação detectada em uma configuração de brilho de 99 % e abaixo. Não deve haver cintilação ou PWM acima desta configuração de brilho. A frequência de 1000 Hz é bastante alta, então a maioria dos usuários sensíveis ao PWM não deve notar nenhuma oscilação. [pwm_comparison] Em comparação: 52 % de todos os dispositivos testados não usam PWM para escurecer a tela. Se PWM foi detectado, uma média de 7754 (mínimo: 5 - máximo: 343500) Hz foi medida. | |||
| PCMark 8 Home Score Accelerated v2 | 4166 pontos | |
| PCMark 8 Creative Score Accelerated v2 | 5338 pontos | |
| PCMark 8 Work Score Accelerated v2 | 5189 pontos | |
| PCMark 10 Score | 4009 pontos | |
Ajuda | ||

| 3DMark 11 Performance | 2166 pontos | |
| 3DMark Cloud Gate Standard Score | 9758 pontos | |
| 3DMark Fire Strike Score | 1272 pontos | |
Ajuda | ||
| baixo | média | alto | ultra | |
|---|---|---|---|---|
| Tomb Raider (2013) | 98.9 | 46.1 | 30.7 | 14.4 |
| BioShock Infinite (2013) | 59.8 | 35.8 | 28.9 | 9.4 |
| The Witcher 3 (2015) | 11.8 | |||
| Dota 2 Reborn (2015) | 68 | 44.8 | 20.6 | 18.3 |
| X-Plane 11.11 (2018) | 25 | 15.8 | 14.6 |
Barulho
| Ocioso |
| 29.2 / 29.2 / 30.4 dB |
| Carga |
| 31 / 32.1 dB |
 | ||
30 dB silencioso 40 dB(A) audível 50 dB(A) ruidosamente alto |
||
min: | ||
| HP Spectre x360 13-ap0312ng UHD Graphics 620, i7-8565U, Toshiba XG5 KXG50ZNV512G | Dell XPS 13 7390 2-in-1 Core i3 UHD Graphics G1 (Ice Lake 32 EU), i3-1005G1, Toshiba BG4 KBG40ZPZ256G | Lenovo ThinkPad X390 Yoga-20NQS05R00 UHD Graphics 620, i7-8565U, Intel SSD Pro 7600p SSDPEKKF512G8L | Lenovo Yoga C930-13IKB UHD Graphics 620, i5-8250U, SK hynix PC401 HFS256GD9TNG | HP Spectre x360 13-ae048ng UHD Graphics 620, i5-8550U, Toshiba NVMe THNSN51T02DUK | |
|---|---|---|---|---|---|
| Noise | -3% | -3% | -1% | -3% | |
| desligado / ambiente * (dB) | 29.2 | 28 4% | 29.2 -0% | 29.3 -0% | 30.13 -3% |
| Idle Minimum * (dB) | 29.2 | 28 4% | 29.2 -0% | 29.3 -0% | 30.13 -3% |
| Idle Average * (dB) | 29.2 | 28 4% | 29.2 -0% | 29.3 -0% | 30 -3% |
| Idle Maximum * (dB) | 30.4 | 28 8% | 29.2 4% | 29.7 2% | 30.13 1% |
| Load Average * (dB) | 31 | 31.7 -2% | 35 -13% | 31.8 -3% | 33.4 -8% |
| Load Maximum * (dB) | 32.1 | 43.5 -36% | 35 -9% | 32.7 -2% | 33 -3% |
* ... menor é melhor
(±) A temperatura máxima no lado superior é 41.5 °C / 107 F, em comparação com a média de 35.4 °C / 96 F , variando de 19.6 a 60 °C para a classe Convertible.
(±) A parte inferior aquece até um máximo de 43.6 °C / 110 F, em comparação com a média de 36.9 °C / 98 F
(+) Em uso inativo, a temperatura média para o lado superior é 22.2 °C / 72 F, em comparação com a média do dispositivo de 30.3 °C / ### class_avg_f### F.
(+) Os apoios para as mãos e o touchpad são mais frios que a temperatura da pele, com um máximo de 27.2 °C / 81 F e, portanto, são frios ao toque.
(±) A temperatura média da área do apoio para as mãos de dispositivos semelhantes foi 28 °C / 82.4 F (+0.8 °C / 1.4 F).
HP Spectre x360 13-ap0312ng análise de áudio
(±) | o volume do alto-falante é médio, mas bom (###valor### dB)
Graves 100 - 315Hz
(-) | quase nenhum baixo - em média 19.6% menor que a mediana
(±) | a linearidade dos graves é média (10.6% delta para a frequência anterior)
Médios 400 - 2.000 Hz
(+) | médios equilibrados - apenas 3.6% longe da mediana
(+) | médios são lineares (6.7% delta para frequência anterior)
Altos 2 - 16 kHz
(+) | agudos equilibrados - apenas 3.6% longe da mediana
(+) | os máximos são lineares (6.2% delta da frequência anterior)
Geral 100 - 16.000 Hz
(±) | a linearidade do som geral é média (18% diferença em relação à mediana)
Comparado com a mesma classe
» 39% de todos os dispositivos testados nesta classe foram melhores, 7% semelhantes, 54% piores
» O melhor teve um delta de 6%, a média foi 20%, o pior foi 57%
Comparado com todos os dispositivos testados
» 38% de todos os dispositivos testados foram melhores, 8% semelhantes, 54% piores
» O melhor teve um delta de 4%, a média foi 23%, o pior foi 134%
Lenovo ThinkPad X390 Yoga-20NQS05R00 análise de áudio
(±) | o volume do alto-falante é médio, mas bom (###valor### dB)
Graves 100 - 315Hz
(-) | quase nenhum baixo - em média 15.8% menor que a mediana
(±) | a linearidade dos graves é média (10.6% delta para a frequência anterior)
Médios 400 - 2.000 Hz
(±) | médios mais altos - em média 6.5% maior que a mediana
(±) | a linearidade dos médios é média (10.3% delta para frequência anterior)
Altos 2 - 16 kHz
(+) | agudos equilibrados - apenas 2.8% longe da mediana
(±) | a linearidade dos máximos é média (11% delta para frequência anterior)
Geral 100 - 16.000 Hz
(±) | a linearidade do som geral é média (24% diferença em relação à mediana)
Comparado com a mesma classe
» 73% de todos os dispositivos testados nesta classe foram melhores, 5% semelhantes, 22% piores
» O melhor teve um delta de 6%, a média foi 20%, o pior foi 57%
Comparado com todos os dispositivos testados
» 72% de todos os dispositivos testados foram melhores, 6% semelhantes, 22% piores
» O melhor teve um delta de 4%, a média foi 23%, o pior foi 134%
| desligado | |
| Ocioso | |
| Carga |
|
Key:
min: | |
| HP Spectre x360 13-ap0312ng i7-8565U, UHD Graphics 620, Toshiba XG5 KXG50ZNV512G, IPS, 1920x1080, 13.3" | Dell XPS 13 7390 2-in-1 Core i3 i3-1005G1, UHD Graphics G1 (Ice Lake 32 EU), Toshiba BG4 KBG40ZPZ256G, IPS, 1920x1200, 13.4" | Lenovo ThinkPad X390 Yoga-20NQS05R00 i7-8565U, UHD Graphics 620, Intel SSD Pro 7600p SSDPEKKF512G8L, IPS LED, 1920x1080, 13.3" | Lenovo Yoga C930-13IKB i5-8250U, UHD Graphics 620, SK hynix PC401 HFS256GD9TNG, IPS, 1920x1080, 13.9" | HP Spectre x360 13-ae048ng i5-8550U, UHD Graphics 620, Toshiba NVMe THNSN51T02DUK, IPS, 1920x1080, 13.3" | Média Intel UHD Graphics 620 | Média da turma Convertible | |
|---|---|---|---|---|---|---|---|
| Power Consumption | 14% | -8% | -4% | 14% | 2% | -14% | |
| Idle Minimum * (Watt) | 4.32 | 3 31% | 3.46 20% | 3.3 24% | 3.2 26% | 3.81 ? 12% | 4.28 ? 1% |
| Idle Average * (Watt) | 6.84 | 5.4 21% | 5.88 14% | 6.8 1% | 6 12% | 6.94 ? -1% | 6.96 ? -2% |
| Idle Maximum * (Watt) | 8.64 | 7.3 16% | 9.12 -6% | 9.5 -10% | 9.2 -6% | 8.75 ? -1% | 8.67 ? -0% |
| Load Average * (Watt) | 31.8 | 33.4 -5% | 45.6 -43% | 40.8 -28% | 29.5 7% | 35 ? -10% | 45.1 ? -42% |
| Load Maximum * (Watt) | 53 | 48.3 9% | 65.9 -24% | 57 -8% | 35.6 33% | 47.5 ? 10% | 67.7 ? -28% |
* ... menor é melhor
| HP Spectre x360 13-ap0312ng i7-8565U, UHD Graphics 620, 61 Wh, 1920x1080 | Dell XPS 13 7390 2-in-1 Core i3 i3-1005G1, UHD Graphics G1 (Ice Lake 32 EU), 51 Wh, 1920x1200 | Lenovo ThinkPad X390 Yoga-20NQS05R00 i7-8565U, UHD Graphics 620, 50 Wh, 1920x1080 | Lenovo Yoga C930-13IKB i5-8250U, UHD Graphics 620, 60 Wh, 1920x1080 | HP Spectre x360 13-ae048ng i5-8550U, UHD Graphics 620, 60 Wh, 1920x1080 | Média da turma Convertible | |
|---|---|---|---|---|---|---|
| Duração da bateria | -2% | -17% | -3% | 29% | 16% | |
| H.264 (h) | 10.7 | 10 -7% | 10.5 -2% | 17.8 66% | 15 ? 40% | |
| WiFi v1.3 (h) | 8.9 | 8.9 0% | 8.2 -8% | 9.2 3% | 8.8 -1% | 12 ? 35% |
| Load (h) | 2.3 | 2.2 -4% | 1.5 -35% | 2.1 -9% | 2.8 22% | 1.713 ? -26% |
Pro
Contra
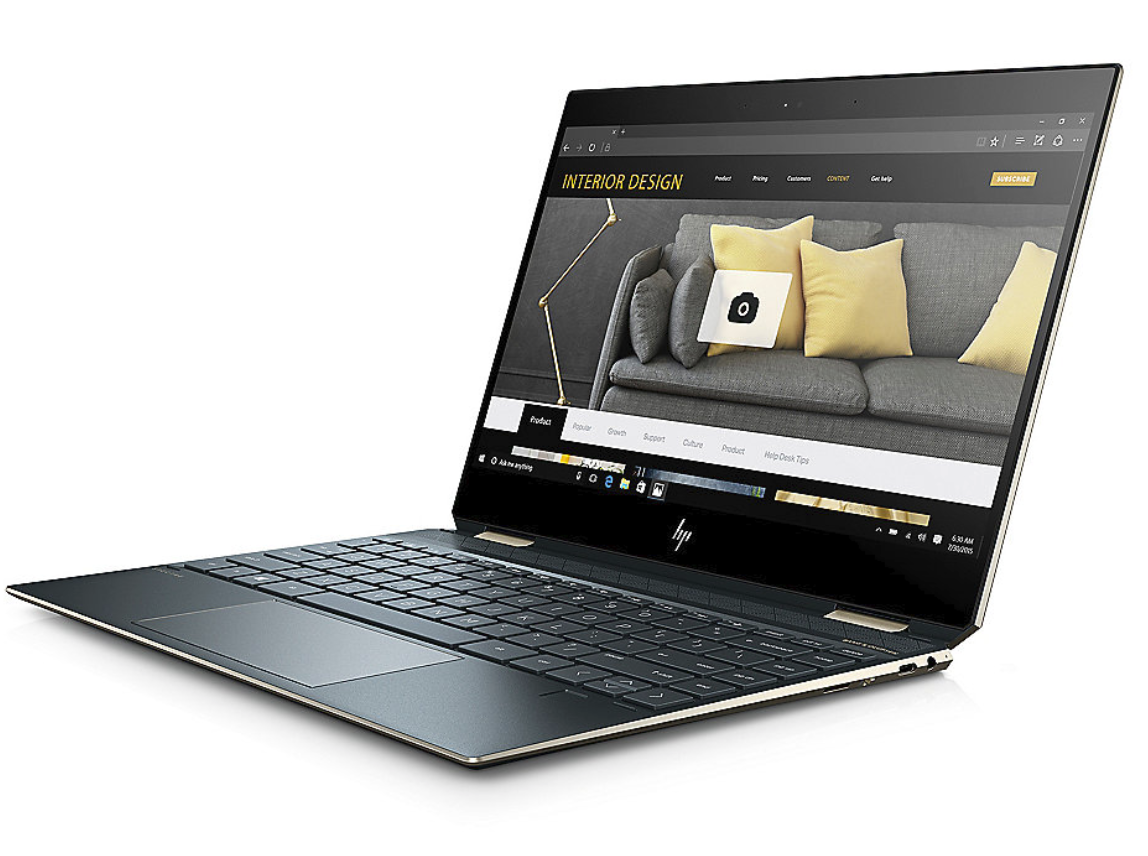
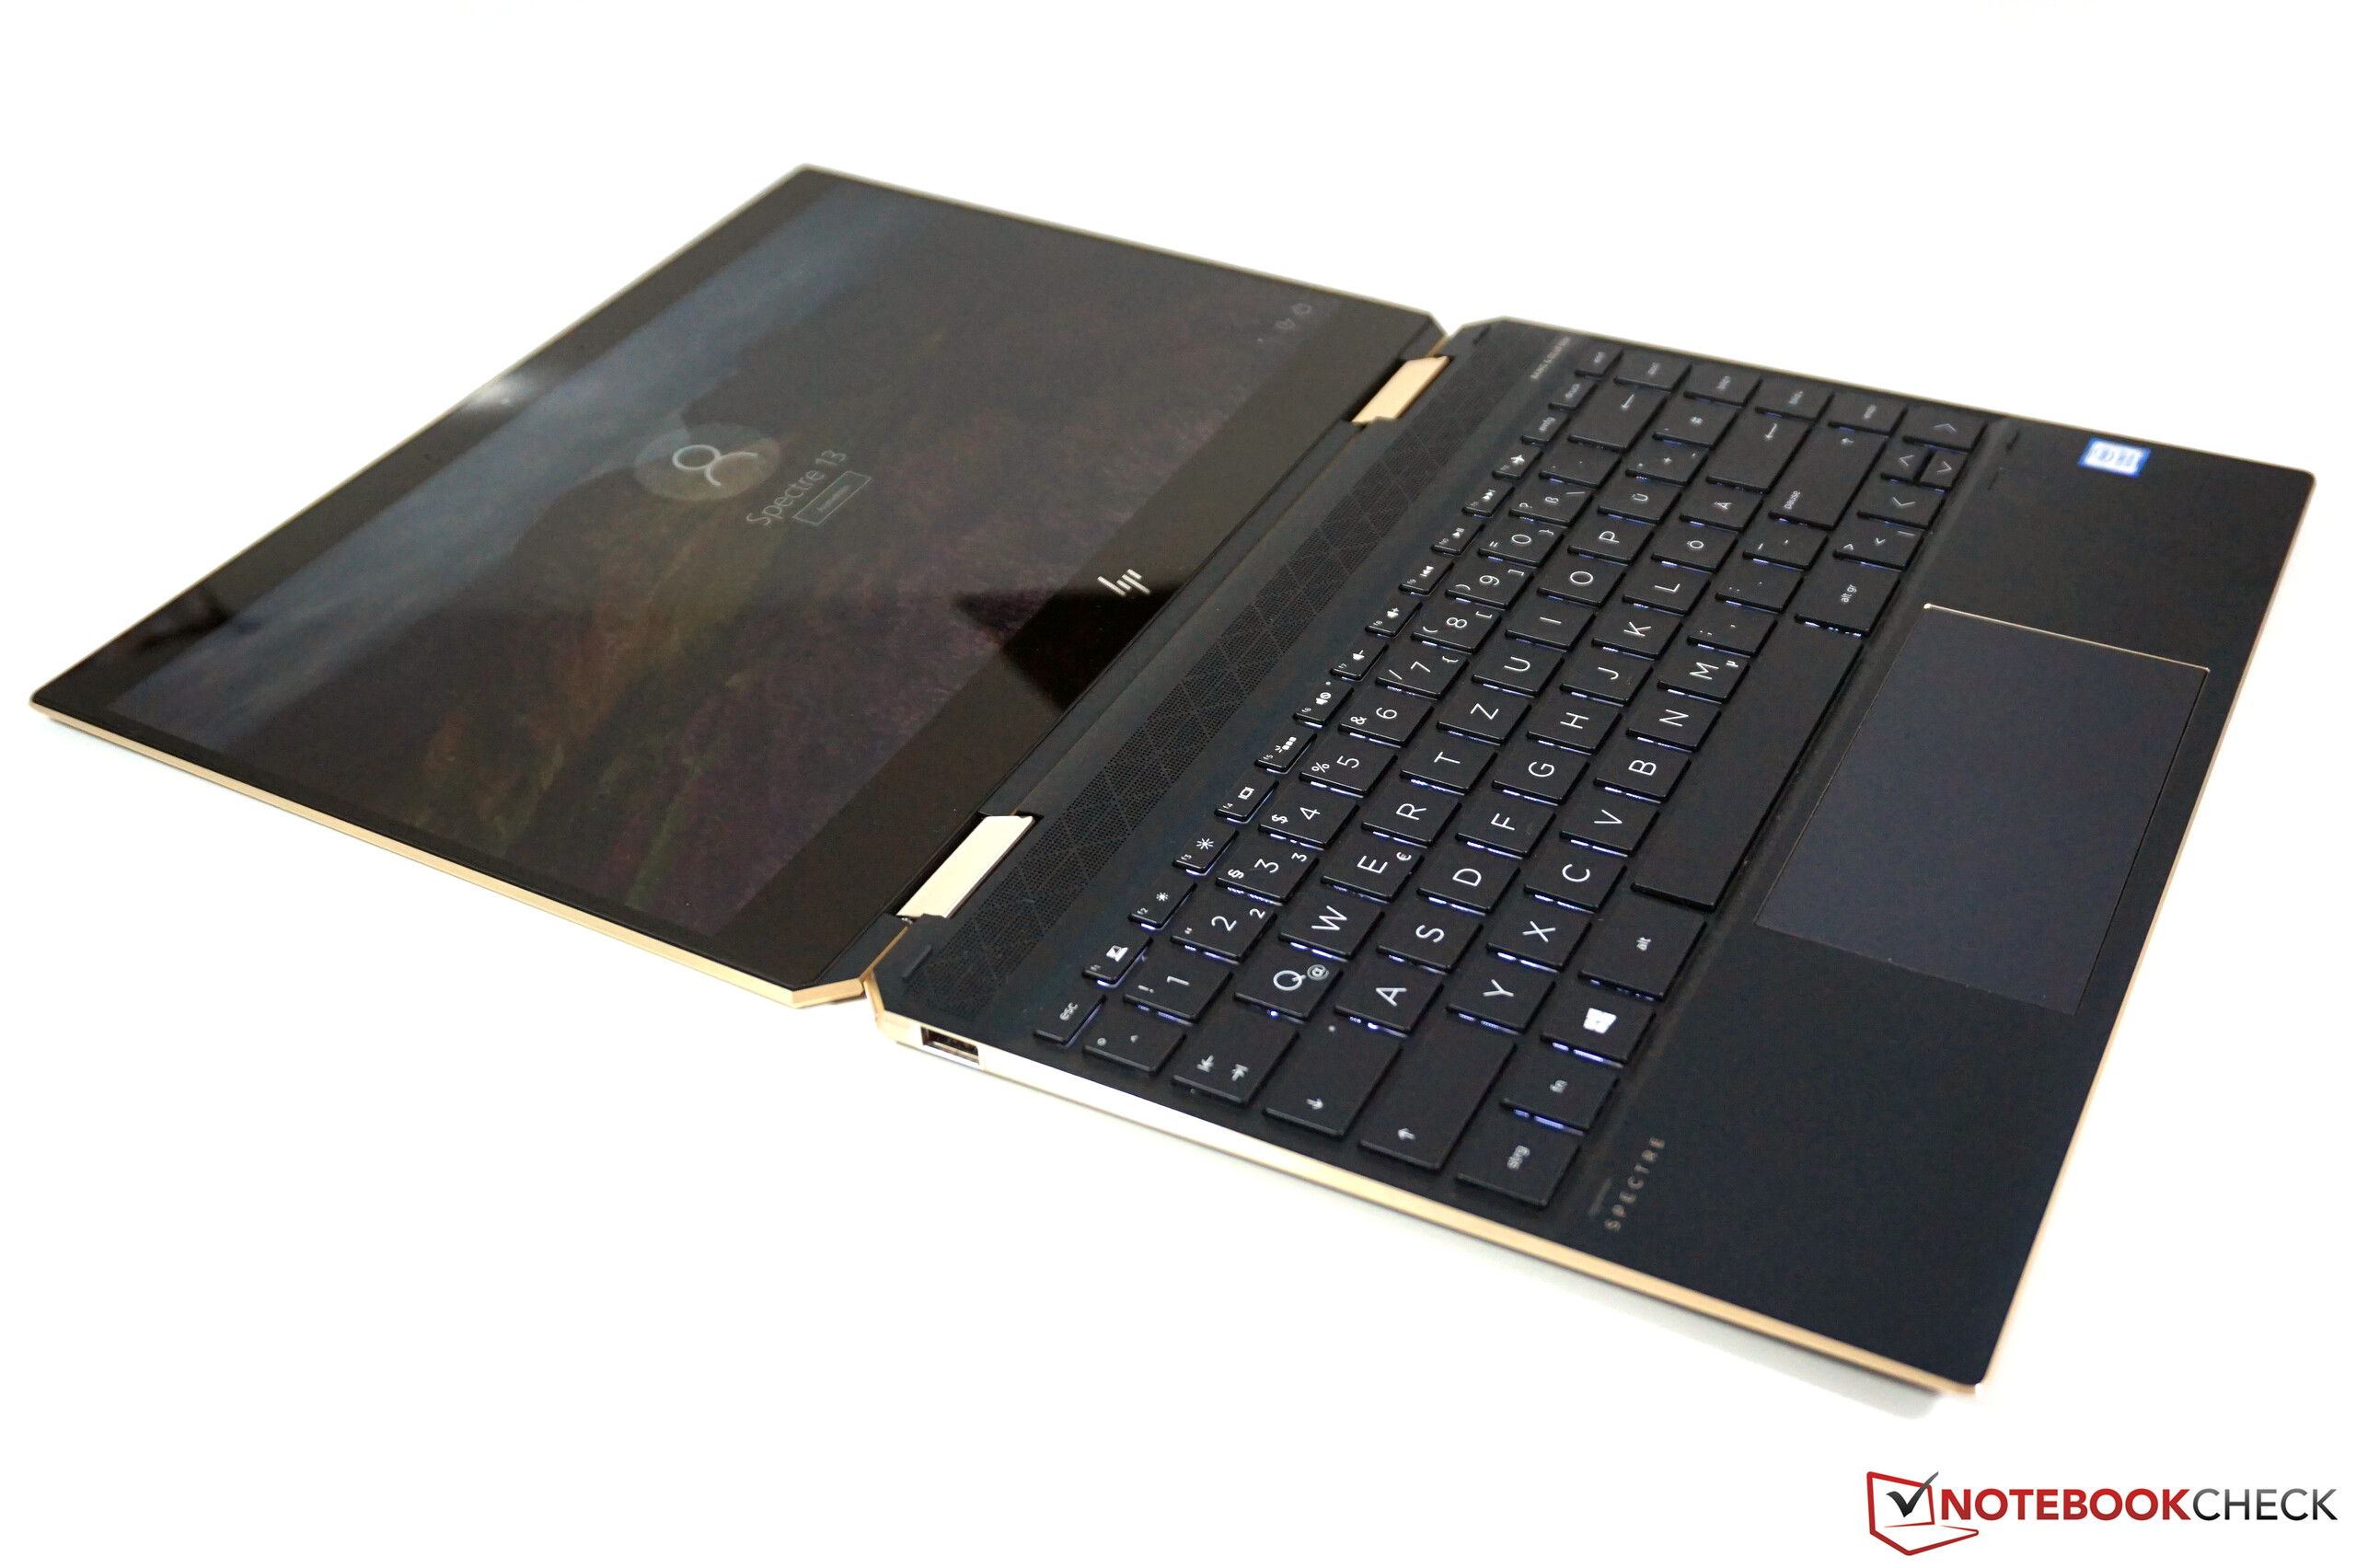
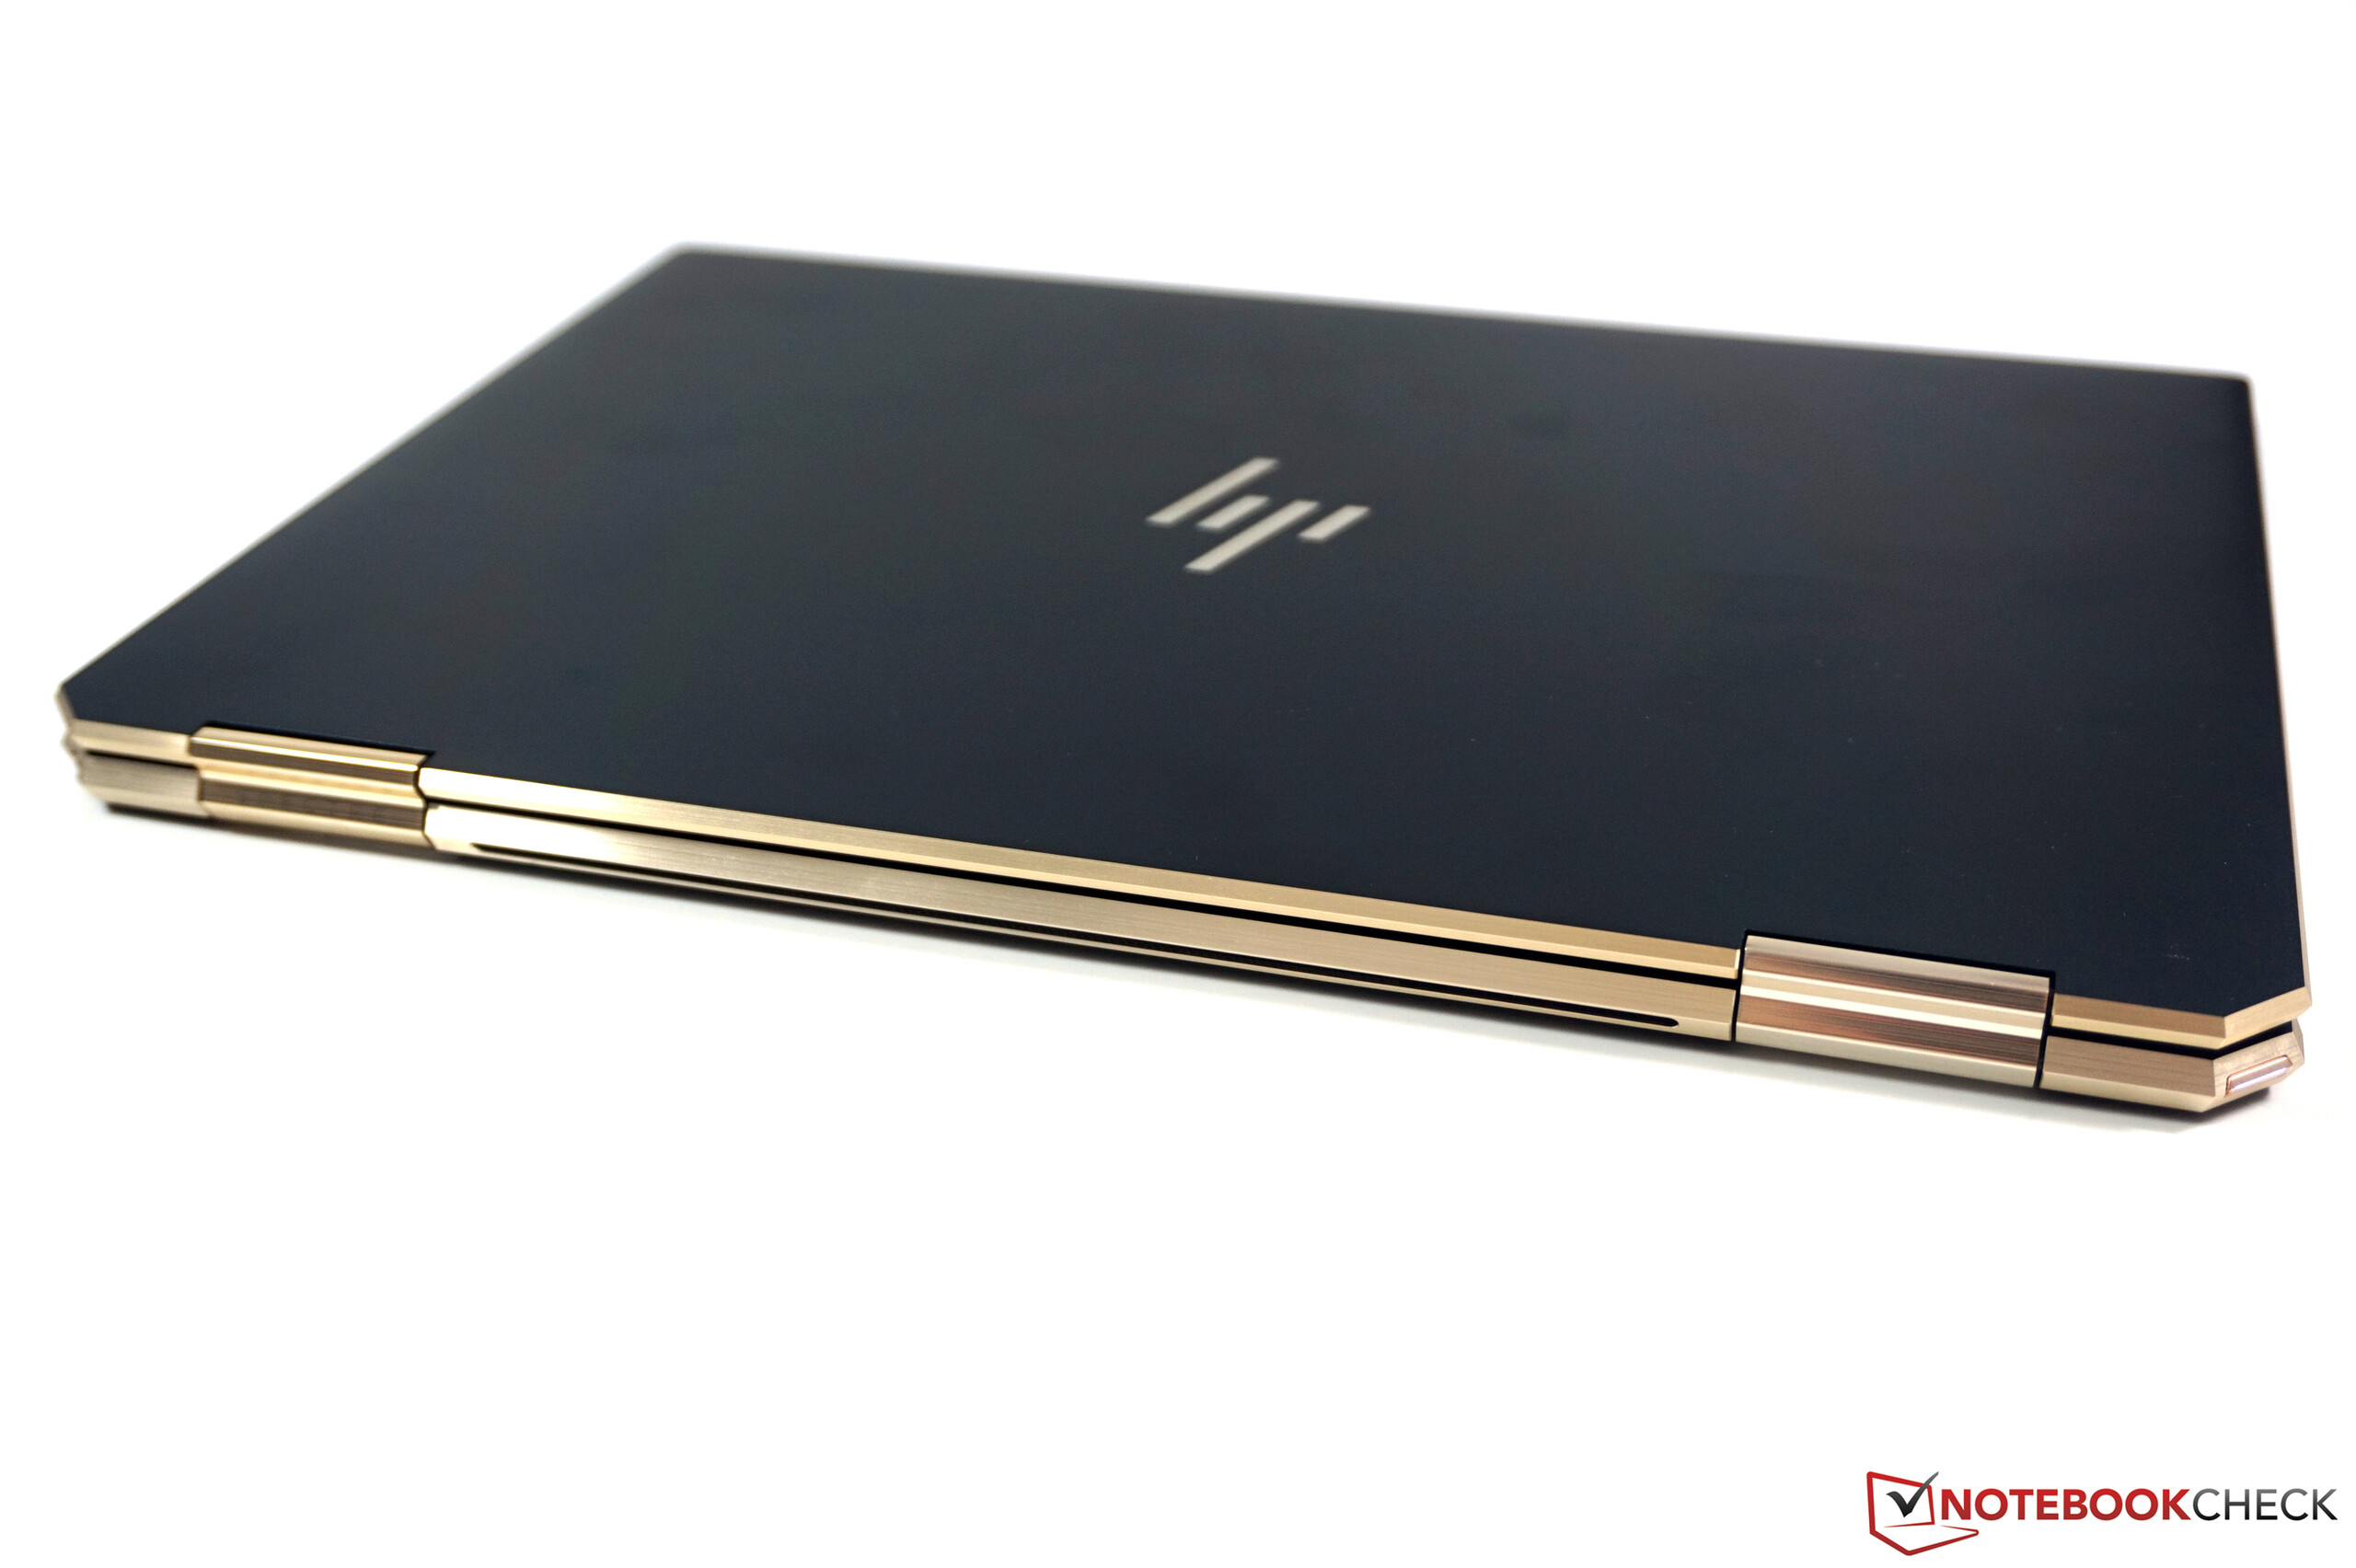
Tudo considerado, o HP Spectre x360 13 é um conversível muito bom que tem muito a oferecer. Ele possui uma carcaça bem feita de alta qualidade, um bom teclado, desempenho decente do sistema e bateria de longa duração. Embora o Spectre não seja capaz de utilizar todo o potencial de seu processador, a configuração conservadora do TDP resulta em baixas emissões, tanto no ruído quanto na temperatura do sistema.
A carcaça de alta qualidade, o bom desempenho, a bateria de longa duração e o desempenho de som decente: O Spectre x360 13 da HP marca todas as caixas de verificação para um ótimo conversível. Infelizmente, a tela destrói a ótima impressão, já que esperávamos muito mais a esse preço. Além disso, a tecnologia SureView de segunda geração da HP reduz substancialmente a qualidade da imagem, tornando o dispositivo inadequado para uso a longo prazo.
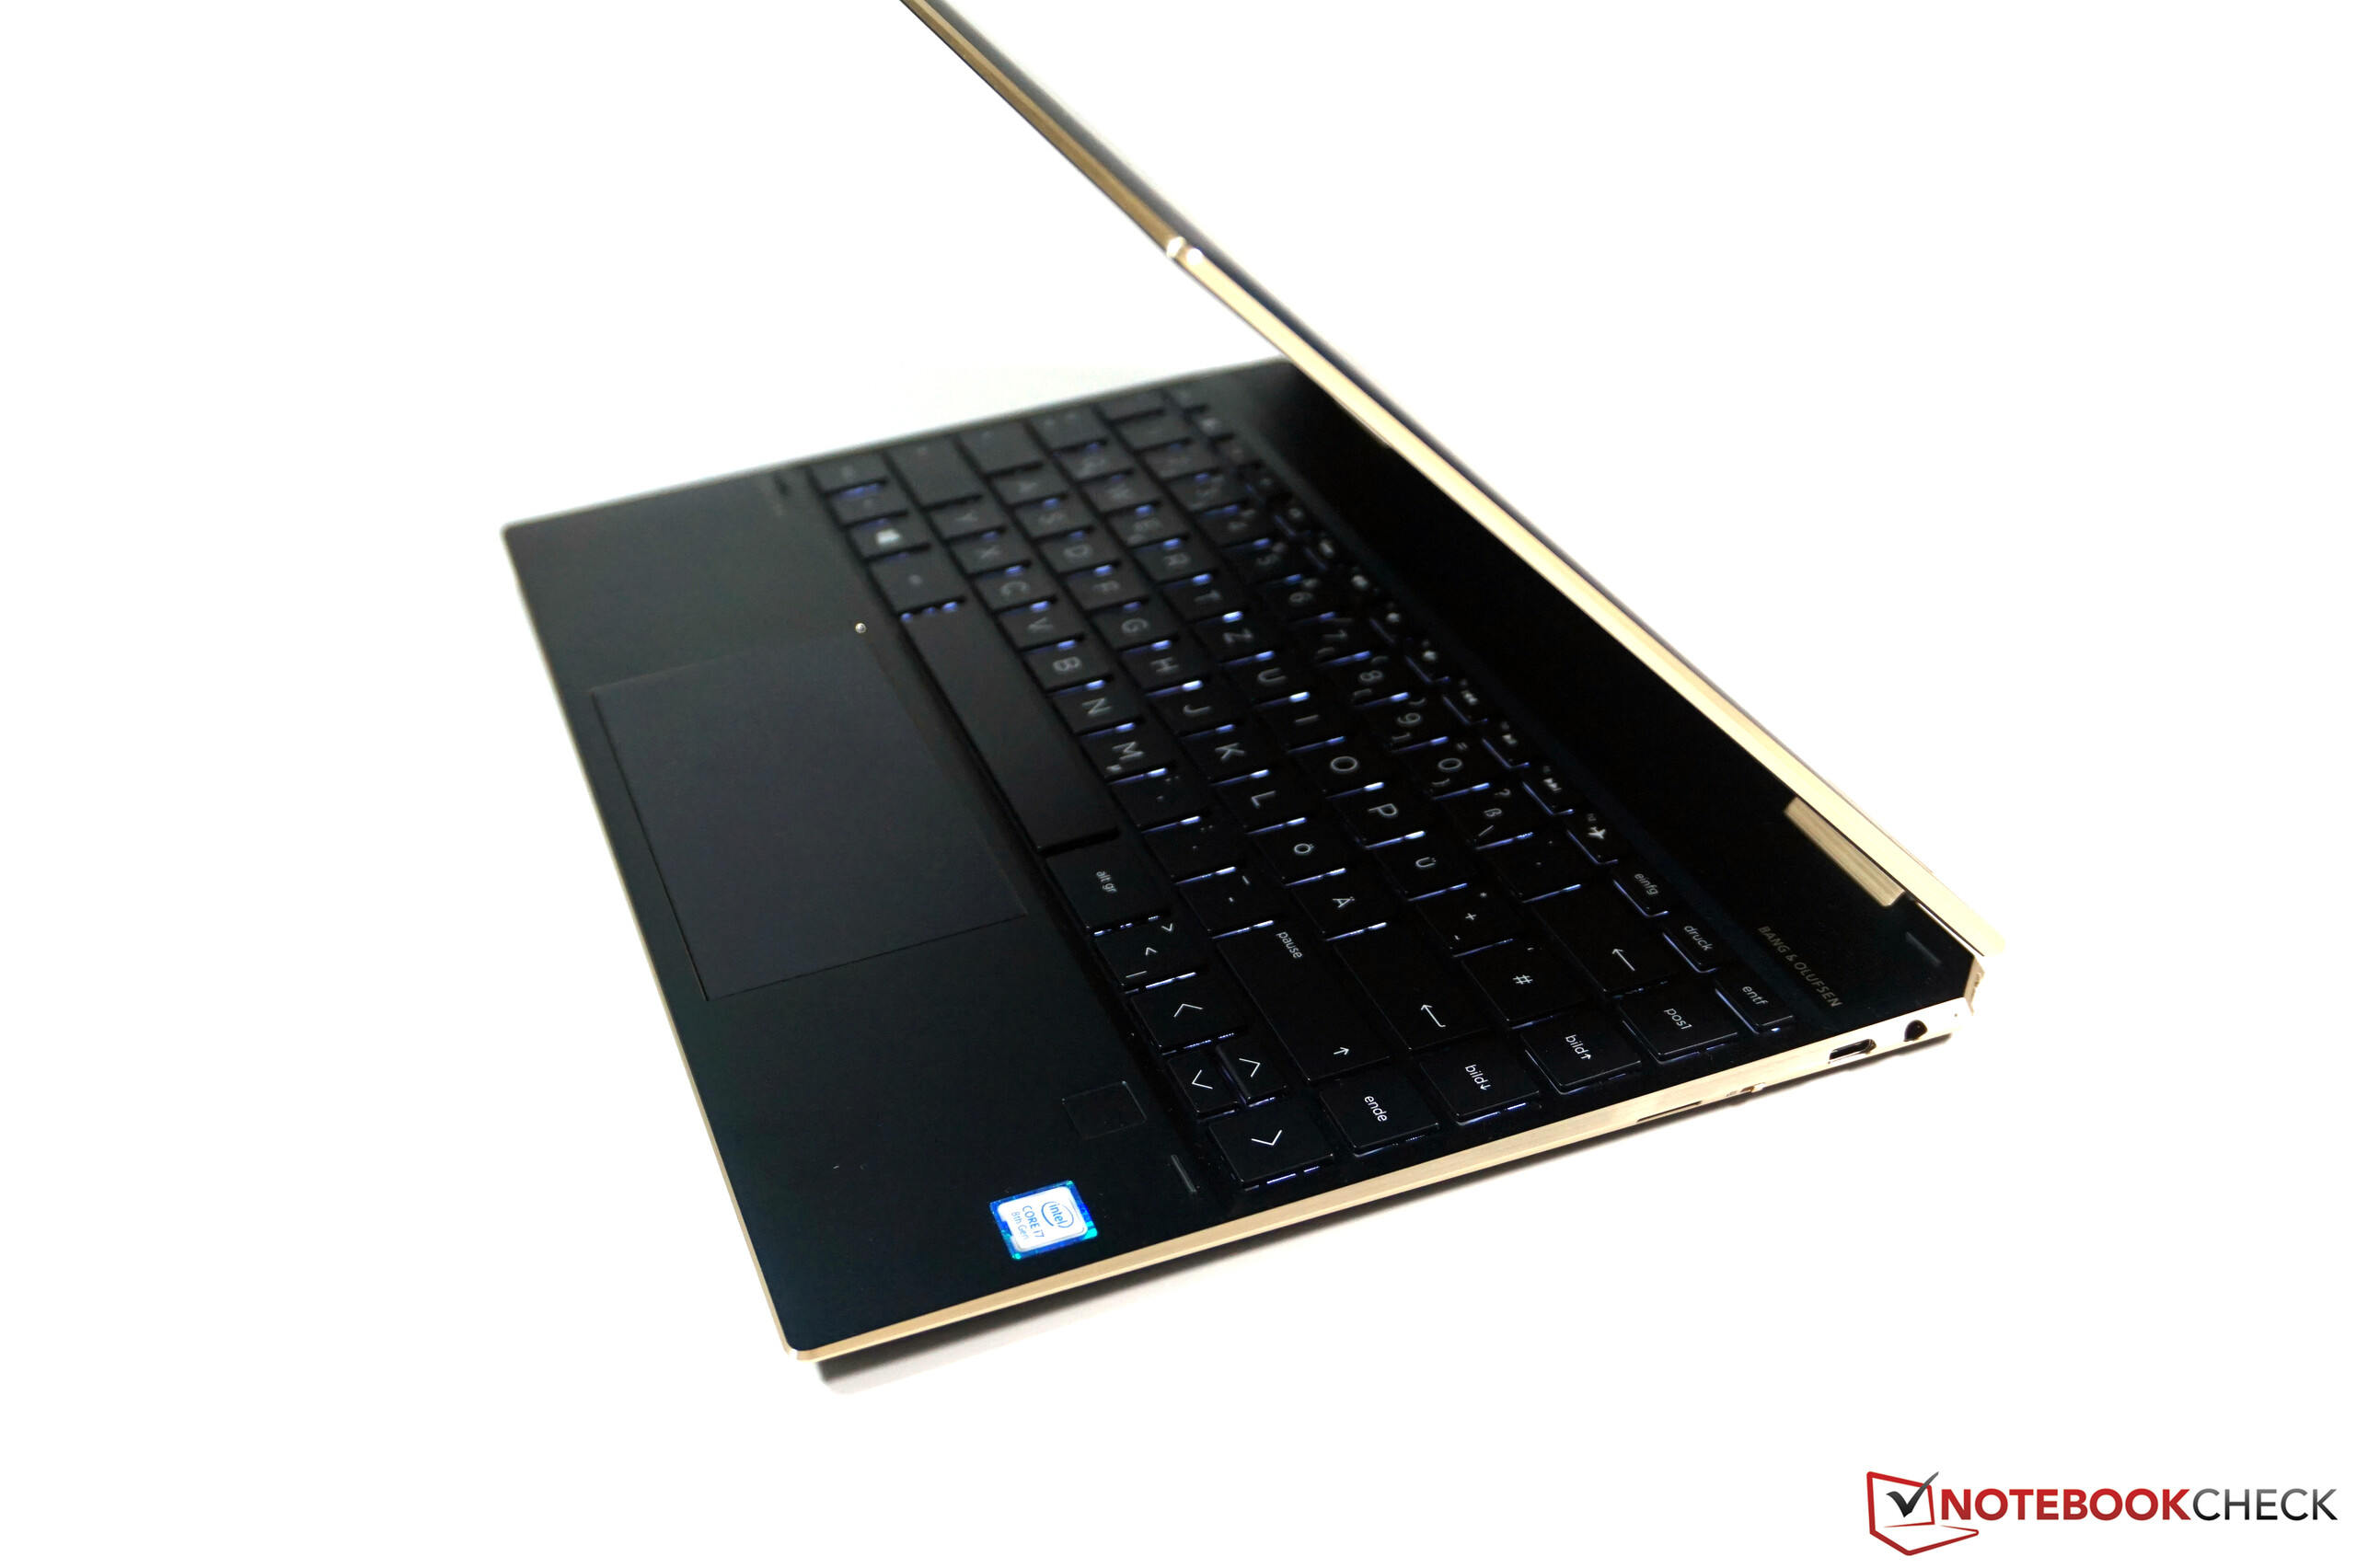
Sua maior falha é sem dúvida sua tela. A tela táctil refletiva deveria ter sido muito mais brilhante. É tão escura e refletiva que é preciso lutar para evitar reflexos, mesmo em interiores. Além disso, possui uma taxa de contraste muito baixa e cores altamente imprecisas. Além disso, possui uma taxa de contraste muito baixa e cores altamente imprecisas. A tecnologia SureView faz exatamente o que deve fazer; no entanto, reduziu ainda mais a qualidade da imagem. Se você estiver interessado em um Spectre x360 13, certifique-se de adquirir um sem a tecnologia SureView.
HP Spectre x360 13-ap0312ng
- 09/19/2019 v7 (old)
Andreas Osthoff
Price comparison
