Breve Análise do Portátil HP Pavilion 17z-ak000 (A9-9420, Radeon 530)

| SD Card Reader | |
| average JPG Copy Test (av. of 3 runs) | |
| HP Pavilion Power 15t-cb2000 | |
| HP Pavilion 17z 1EX13AV | |
| Lenovo Thinkpad 13-20J1001BUS | |
| maximum AS SSD Seq Read Test (1GB) | |
| HP Pavilion Power 15t-cb2000 | |
| HP Pavilion 17z 1EX13AV | |
| Lenovo Thinkpad 13-20J1001BUS | |
| Networking | |
| iperf3 transmit AX12 | |
| Lenovo Thinkpad 13-20J1001BUS | |
| HP Pavilion Power 15t-cb2000 | |
| HP Pavilion 17z 1EX13AV | |
| iperf3 receive AX12 | |
| Lenovo Thinkpad 13-20J1001BUS | |
| HP Pavilion Power 15t-cb2000 | |
| HP Pavilion 17z 1EX13AV | |
| |||||||||||||||||||||||||
iluminação: 90 %
iluminação com acumulador: 363.6 cd/m²
Contraste: 983:1 (Preto: 0.37 cd/m²)
ΔE ColorChecker Calman: 5.8 | ∀{0.5-29.43 Ø4.71}
ΔE Greyscale Calman: 8.8 | ∀{0.09-98 Ø4.96}
87.3% sRGB (Argyll 1.6.3 3D)
57.2% AdobeRGB 1998 (Argyll 1.6.3 3D)
64% AdobeRGB 1998 (Argyll 3D)
87.5% sRGB (Argyll 3D)
64.8% Display P3 (Argyll 3D)
Gamma: 2.16
CCT: 5900 K
| HP Pavilion 17z 1EX13AV ID: AUO109D, Name: AU Optronics B173HW01 V0, IPS, 17.3", 1920x1080 | HP Pavilion 17z 1EX13AV ID: AUO109D, Name: AU Optronics B173HW01 V0, IPS, 17.3", 1920x1080 | HP Pavilion Power 15t-cb2000 AUO41ED , IPS, 15.6", 1920x1080 | Lenovo V510-15IKB 80WQ0002GE LG Philips LP156WF6-SPK3, IPS, 15.6", 1920x1080 | Asus X555DA-BB11 TN LED, 15.6", 1920x1080 | |
|---|---|---|---|---|---|
| Display | 0% | -36% | -37% | -43% | |
| Display P3 Coverage (%) | 64.8 | 64.3 -1% | 39.28 -39% | 38.8 -40% | 35.12 -46% |
| sRGB Coverage (%) | 87.5 | 88.5 1% | 58.9 -33% | 58.1 -34% | 52.7 -40% |
| AdobeRGB 1998 Coverage (%) | 64 | 64.6 1% | 40.59 -37% | 40.12 -37% | 36.29 -43% |
| Response Times | -9% | -30% | -13% | -3% | |
| Response Time Grey 50% / Grey 80% * (ms) | 34 ? | 40.8 ? -20% | 51.6 ? -52% | 39 ? -15% | 42 ? -24% |
| Response Time Black / White * (ms) | 27.2 ? | 26.4 ? 3% | 29.2 ? -7% | 30 ? -10% | 22.4 ? 18% |
| PWM Frequency (Hz) | 20000 ? | ||||
| Screen | 12% | -9% | -7% | -26% | |
| Brightness middle (cd/m²) | 363.6 | 333.5 -8% | 256 -30% | 256 -30% | 242.7 -33% |
| Brightness (cd/m²) | 349 | 323 -7% | 241 -31% | 252 -28% | 232 -34% |
| Brightness Distribution (%) | 90 | 91 1% | 88 -2% | 87 -3% | 88 -2% |
| Black Level * (cd/m²) | 0.37 | 0.32 14% | 0.21 43% | 0.3 19% | 0.52 -41% |
| Contrast (:1) | 983 | 1042 6% | 1219 24% | 853 -13% | 467 -52% |
| Colorchecker dE 2000 * | 5.8 | 4 31% | 5.2 10% | 5.4 7% | 4.9 16% |
| Colorchecker dE 2000 max. * | 10 | 6.9 31% | 19.3 -93% | 9.36 6% | 20.3 -103% |
| Greyscale dE 2000 * | 8.8 | 4.5 49% | 3.5 60% | 5.37 39% | 2.7 69% |
| Gamma | 2.16 102% | 2.19 100% | 2.35 94% | 2.58 85% | 2.34 94% |
| CCT | 5900 110% | 6386 102% | 6576 99% | 6795 96% | 6876 95% |
| Color Space (Percent of AdobeRGB 1998) (%) | 57.2 | 57.5 1% | 37 -35% | 37 -35% | 33.5 -41% |
| Color Space (Percent of sRGB) (%) | 87.3 | 88.1 1% | 59 -32% | 58 -34% | 52.5 -40% |
| Média Total (Programa/Configurações) | 1% /
7% | -25% /
-17% | -19% /
-14% | -24% /
-26% |
* ... menor é melhor
Exibir tempos de resposta
| ↔ Tempo de resposta preto para branco | ||
|---|---|---|
| 27.2 ms ... ascensão ↗ e queda ↘ combinadas | ↗ 16.4 ms ascensão | 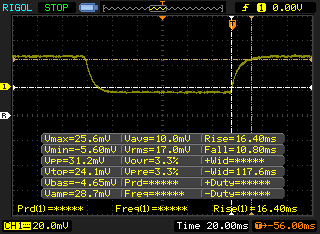 |
| ↘ 10.8 ms queda | ||
| A tela mostra taxas de resposta relativamente lentas em nossos testes e pode ser muito lenta para os jogadores. Em comparação, todos os dispositivos testados variam de 0.1 (mínimo) a 240 (máximo) ms. » 69 % de todos os dispositivos são melhores. Isso significa que o tempo de resposta medido é pior que a média de todos os dispositivos testados (19.8 ms). | ||
| ↔ Tempo de resposta 50% cinza a 80% cinza | ||
| 34 ms ... ascensão ↗ e queda ↘ combinadas | ↗ 15.6 ms ascensão | 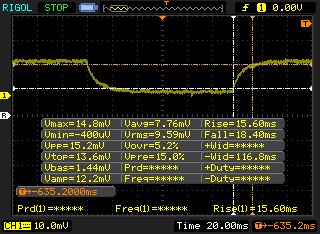 |
| ↘ 18.4 ms queda | ||
| A tela mostra taxas de resposta lentas em nossos testes e será insatisfatória para os jogadores. Em comparação, todos os dispositivos testados variam de 0.165 (mínimo) a 636 (máximo) ms. » 47 % de todos os dispositivos são melhores. Isso significa que o tempo de resposta medido é semelhante à média de todos os dispositivos testados (31 ms). | ||
Cintilação da tela / PWM (modulação por largura de pulso)
| Tela tremeluzindo / PWM não detectado | 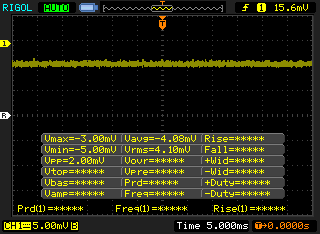 | ||
[pwm_comparison] Em comparação: 52 % de todos os dispositivos testados não usam PWM para escurecer a tela. Se PWM foi detectado, uma média de 7757 (mínimo: 5 - máximo: 343500) Hz foi medida. | |||
| Cinebench R11.5 | |
| CPU Single 64Bit | |
| Lenovo Thinkpad 13-20J1001BUS | |
| HP Pavilion 17z 1EX13AV | |
| HP 15-bw077ax | |
| HP Pavilion 17z 1EX13AV | |
| HP Pavilion 14t-ab000 K9E07AV | |
| HP EliteBook 725 G4 | |
| HP Pavilion 15z-bw000 | |
| Asus X555LD-XX283H | |
| CPU Multi 64Bit | |
| Lenovo Thinkpad 13-20J1001BUS | |
| HP Pavilion 17z 1EX13AV | |
| HP Pavilion 15z-bw000 | |
| HP EliteBook 725 G4 | |
| HP Pavilion 14t-ab000 K9E07AV | |
| Asus X555LD-XX283H | |
| HP Pavilion 17z 1EX13AV | |
| HP 15-bw077ax | |
| Cinebench R10 | |
| Rendering Multiple CPUs 32Bit | |
| Lenovo Thinkpad 13-20J1001BUS | |
| HP Pavilion 15z-bw000 | |
| HP Pavilion 17z 1EX13AV | |
| HP EliteBook 725 G4 | |
| Asus X555LD-XX283H | |
| HP Pavilion 17z 1EX13AV | |
| HP 15-bw077ax | |
| Rendering Single 32Bit | |
| Lenovo Thinkpad 13-20J1001BUS | |
| HP Pavilion 17z 1EX13AV | |
| HP 15-bw077ax | |
| HP Pavilion 17z 1EX13AV | |
| HP EliteBook 725 G4 | |
| Asus X555LD-XX283H | |
| HP Pavilion 15z-bw000 | |
| wPrime 2.10 - 1024m | |
| HP 15-bw077ax | |
| HP Pavilion 14t-ab000 K9E07AV | |
| HP Pavilion 17z 1EX13AV | |
| Lenovo Thinkpad 13-20J1001BUS | |
| HP EliteBook 725 G4 | |
| HP Pavilion 15z-bw000 | |
| HP Pavilion 17z 1EX13AV | |
* ... menor é melhor
| PCMark 8 | |
| Home Score Accelerated v2 | |
| HP Pavilion Power 15t-cb2000 | |
| Toshiba Satellite Pro R50-C-16V | |
| HP Pavilion 17z 1EX13AV | |
| Asus X555DA-BB11 | |
| Work Score Accelerated v2 | |
| HP Pavilion Power 15t-cb2000 | |
| HP Pavilion 17z 1EX13AV | |
| Toshiba Satellite Pro R50-C-16V | |
| Asus X555DA-BB11 | |
| Creative Score Accelerated v2 | |
| HP Pavilion Power 15t-cb2000 | |
| Toshiba Satellite Pro R50-C-16V | |
| HP Pavilion 17z 1EX13AV | |
| Asus X555DA-BB11 | |
| PCMark 8 Home Score Accelerated v2 | 2897 pontos | |
| PCMark 8 Creative Score Accelerated v2 | 3174 pontos | |
| PCMark 8 Work Score Accelerated v2 | 3976 pontos | |
| PCMark 10 Score | 2046 pontos | |
Ajuda | ||
| HP Pavilion 17z 1EX13AV Avolusion MD1TBLSSHD | Asus X555DA-BB11 Seagate Momentus SpinPoint M8 ST1000LM024 HN-M101MBB | Toshiba Satellite Pro R50-C-16V TOSHIBA MQ01ABD075 | Lenovo V510-15IKB 80WQ0002GE Samsung CM871a MZNTY256HDHP | HP Pavilion 17z 1EX13AV WDC Scorpio Blue WD10JPVX-60JC3T1 | |
|---|---|---|---|---|---|
| CrystalDiskMark 3.0 | -2% | -15% | 13527% | 2% | |
| Read Seq (MB/s) | 90 | 106.9 19% | 96.5 7% | 532 491% | 90 0% |
| Write Seq (MB/s) | 93.4 | 97.5 4% | 77.9 -17% | 511 447% | 90.3 -3% |
| Read 512 (MB/s) | 28.71 | 32.28 12% | 20.82 -27% | 414.8 1345% | 28.47 -1% |
| Write 512 (MB/s) | 44.35 | 35.39 -20% | 19.83 -55% | 307.7 594% | 47.07 6% |
| Read 4k (MB/s) | 0.316 | 0.373 18% | 0.342 8% | 39.51 12403% | 0.31 -2% |
| Write 4k (MB/s) | 0.813 | 0.636 -22% | 0.836 3% | 108.1 13196% | 0.3997 -51% |
| Read 4k QD32 (MB/s) | 0.711 | 0.694 -2% | 0.595 -16% | 361.6 50758% | 1.021 44% |
| Write 4k QD32 (MB/s) | 0.87 | 0.682 -22% | 0.706 -19% | 253 28980% | 1.076 24% |

| 3DMark 11 Performance | 2121 pontos | |
| 3DMark Ice Storm Standard Score | 40215 pontos | |
| 3DMark Cloud Gate Standard Score | 3749 pontos | |
| 3DMark Fire Strike Score | 1062 pontos | |
Ajuda | ||
| Rise of the Tomb Raider - 1024x768 Lowest Preset | |
| Acer Aspire E5-575G-549D | |
| Samsung Notebook 9 NP900X5N-X01US | |
| HP Pavilion 17z 1EX13AV | |
| HP Pavilion 17z 1EX13AV | |
| Apple MacBook Pro 13 2016 | |
| Microsoft Surface Pro (2017) i7 | |
| Asus X302UV-FN016T | |
| HP Pavilion 15z-bw000 | |
| HP 15-bw075ax | |
| Lenovo Yoga 510-14AST | |
| Microsoft Surface Pro (2017) i5 | |
| Doom - 1280x720 Low Preset | |
| Apple MacBook Pro 13 2016 | |
| HP Pavilion 17z 1EX13AV | |
| HP Pavilion 17z 1EX13AV | |
| Overwatch - 1280x720 Low (Render Scale 100 %) AA:FX AF:1x | |
| Acer Aspire E5-575G-549D | |
| Apple MacBook Pro 13 2016 | |
| Samsung Notebook 9 NP900X5N-X01US | |
| Microsoft Surface Pro (2017) i7 | |
| HP Pavilion 17z 1EX13AV | |
| HP Pavilion 17z 1EX13AV | |
| baixo | média | alto | ultra | |
|---|---|---|---|---|
| StarCraft II: Heart of the Swarm (2013) | 71.5 | 43.4 | 35.2 | 21.9 |
| BioShock Infinite (2013) | 61.7 | 41.7 | 33.8 | 11.9 |
| The Witcher 3 (2015) | 24 | |||
| Batman: Arkham Knight (2015) | 13 | |||
| Rise of the Tomb Raider (2016) | 26.1 | 14.7 | ||
| Doom (2016) | 16.8 | |||
| Overwatch (2016) | 35.8 | 30.4 |
Barulho
| Ocioso |
| 30.5 / 30.6 / 30.6 dB |
| Carga |
| 41.6 / 48 dB |
 | ||
30 dB silencioso 40 dB(A) audível 50 dB(A) ruidosamente alto |
||
min: | ||
| HP Pavilion 17z 1EX13AV Radeon 530, A9-9420, Avolusion MD1TBLSSHD | HP Pavilion 17z 1EX13AV Radeon R7 M340, A12-9720P, WDC Scorpio Blue WD10JPVX-60JC3T1 | Asus X555DA-BB11 Radeon R6 (Carrizo), A10-8700P, Seagate Momentus SpinPoint M8 ST1000LM024 HN-M101MBB | Toshiba Satellite Pro R50-C-16V HD Graphics 520, 6006U, TOSHIBA MQ01ABD075 | Lenovo V510-15IKB 80WQ0002GE HD Graphics 620, i5-7200U, Samsung CM871a MZNTY256HDHP | Acer Aspire E5-574-53YZ Iris Graphics 550, 6267U, Toshiba MQ02ABD100H | |
|---|---|---|---|---|---|---|
| Noise | 2% | 5% | 6% | 6% | 2% | |
| desligado / ambiente * (dB) | 28 | 28 -0% | 28.9 -3% | 30.4 -9% | 30.2 -8% | 28.8 -3% |
| Idle Minimum * (dB) | 30.5 | 30.4 -0% | 31.6 -4% | 31.8 -4% | 30.2 1% | 31 -2% |
| Idle Average * (dB) | 30.6 | 30.5 -0% | 32 -5% | 31.8 -4% | 30.2 1% | 31 -1% |
| Idle Maximum * (dB) | 30.6 | 30.5 -0% | 32.4 -6% | 31.8 -4% | 32 -5% | 31 -1% |
| Load Average * (dB) | 41.6 | 41.5 -0% | 33.3 20% | 31.9 23% | 34.7 17% | 39.1 6% |
| Witcher 3 ultra * (dB) | 48 | 41.8 13% | ||||
| Load Maximum * (dB) | 48 | 48.2 -0% | 35.5 26% | 31.8 34% | 33.9 29% | 41 15% |
* ... menor é melhor
(±) A temperatura máxima no lado superior é 40.4 °C / 105 F, em comparação com a média de 36.8 °C / 98 F , variando de 21 a 71 °C para a classe Multimedia.
(±) A parte inferior aquece até um máximo de 45 °C / 113 F, em comparação com a média de 39.1 °C / 102 F
(+) Em uso inativo, a temperatura média para o lado superior é 25.3 °C / 78 F, em comparação com a média do dispositivo de 31.3 °C / ### class_avg_f### F.
(+) Os apoios para as mãos e o touchpad são mais frios que a temperatura da pele, com um máximo de 30.8 °C / 87.4 F e, portanto, são frios ao toque.
(-) A temperatura média da área do apoio para as mãos de dispositivos semelhantes foi 28.7 °C / 83.7 F (-2.1 °C / -3.7 F).
HP Pavilion 17z 1EX13AV análise de áudio
(-) | alto-falantes não muito altos (###valor### dB)
Graves 100 - 315Hz
(±) | graves reduzidos - em média 14.7% menor que a mediana
(-) | graves não são lineares (15.8% delta para frequência anterior)
Médios 400 - 2.000 Hz
(+) | médios equilibrados - apenas 2.5% longe da mediana
(±) | a linearidade dos médios é média (10.6% delta para frequência anterior)
Altos 2 - 16 kHz
(+) | agudos equilibrados - apenas 4.5% longe da mediana
(-) | os máximos não são lineares (15.2% delta da frequência anterior)
Geral 100 - 16.000 Hz
(±) | a linearidade do som geral é média (24.7% diferença em relação à mediana)
Comparado com a mesma classe
» 87% de todos os dispositivos testados nesta classe foram melhores, 5% semelhantes, 8% piores
» O melhor teve um delta de 5%, a média foi 17%, o pior foi 45%
Comparado com todos os dispositivos testados
» 75% de todos os dispositivos testados foram melhores, 5% semelhantes, 19% piores
» O melhor teve um delta de 4%, a média foi 23%, o pior foi 134%
Apple MacBook 12 (Early 2016) 1.1 GHz análise de áudio
(+) | os alto-falantes podem tocar relativamente alto (###valor### dB)
Graves 100 - 315Hz
(±) | graves reduzidos - em média 11.3% menor que a mediana
(±) | a linearidade dos graves é média (14.2% delta para a frequência anterior)
Médios 400 - 2.000 Hz
(+) | médios equilibrados - apenas 2.4% longe da mediana
(+) | médios são lineares (5.5% delta para frequência anterior)
Altos 2 - 16 kHz
(+) | agudos equilibrados - apenas 2% longe da mediana
(+) | os máximos são lineares (4.5% delta da frequência anterior)
Geral 100 - 16.000 Hz
(+) | o som geral é linear (10.2% diferença em relação à mediana)
Comparado com a mesma classe
» 7% de todos os dispositivos testados nesta classe foram melhores, 2% semelhantes, 90% piores
» O melhor teve um delta de 5%, a média foi 18%, o pior foi 53%
Comparado com todos os dispositivos testados
» 5% de todos os dispositivos testados foram melhores, 1% semelhantes, 94% piores
» O melhor teve um delta de 4%, a média foi 23%, o pior foi 134%
| desligado | |
| Ocioso | |
| Carga |
|
Key:
min: | |
| HP Pavilion 17z 1EX13AV A9-9420, Radeon 530, Avolusion MD1TBLSSHD, IPS, 1920x1080, 17.3" | HP 17-x066ng 6006U, HD Graphics 520, WDC WD10JPVX-08JC3T5, IPS, 1920x1080, 17.3" | Asus X555DA-BB11 A10-8700P, Radeon R6 (Carrizo), Seagate Momentus SpinPoint M8 ST1000LM024 HN-M101MBB, TN LED, 1920x1080, 15.6" | Lenovo V510-15IKB 80WQ0002GE i5-7200U, HD Graphics 620, Samsung CM871a MZNTY256HDHP, IPS, 1920x1080, 15.6" | Acer Aspire F5-771G-50RD i5-7200U, GeForce GTX 950M, Toshiba MQ01ABD100, TN, 1920x1080, 17.3" | |
|---|---|---|---|---|---|
| Power Consumption | 39% | 28% | 43% | 14% | |
| Idle Minimum * (Watt) | 8.4 | 5.5 35% | 8.3 1% | 4 52% | 6.9 18% |
| Idle Average * (Watt) | 11.7 | 9.9 15% | 8.6 26% | 9.6 18% | 13.6 -16% |
| Idle Maximum * (Watt) | 24.1 | 14.6 39% | 13.1 46% | 9.7 60% | 14.8 39% |
| Load Average * (Watt) | 50.4 | 28 44% | 31.2 38% | 27.7 45% | 41 19% |
| Witcher 3 ultra * (Watt) | 58 | 33 43% | |||
| Load Maximum * (Watt) | 62.8 | 24.6 61% | 43.9 30% | 38.4 39% | 75 -19% |
* ... menor é melhor
| HP Pavilion 17z 1EX13AV A9-9420, Radeon 530, 41.6 Wh | HP Pavilion Power 15t-cb2000 i7-7700HQ, Radeon RX 550 (Laptop), 70 Wh | Asus X555DA-BB11 A10-8700P, Radeon R6 (Carrizo), 37 Wh | Toshiba Satellite Pro R50-C-16V 6006U, HD Graphics 520, 44 Wh | Lenovo V510-15IKB 80WQ0002GE i5-7200U, HD Graphics 620, 32 Wh | HP Omen 15-ax213ng i7-7700HQ, GeForce GTX 1050 Ti Mobile, 63.3 Wh | |
|---|---|---|---|---|---|---|
| Duração da bateria | 29% | -21% | 28% | -17% | 42% | |
| Reader / Idle (h) | 7.8 | 10.5 35% | 7.3 -6% | 12.8 64% | ||
| WiFi v1.3 (h) | 4.6 | 5.7 24% | 2.9 -37% | 5.9 28% | 3.8 -17% | 7.1 54% |
| Load (h) | 1.5 | 1.9 27% | 1.2 -20% | 1.6 7% |
Pro
Contra

Os portáteis Pavilion impulsionados por AMD foram todos um teste para a paciência. Não só o desempenho é lento, mas os aplicativos levam muito tempo para serem lançados. Ninguém quer aguardar 6+ segundos para abrir um documento de Word apenas para aguardar outros 6 + segundos para abrir o File Explorer e ainda mais tempo para o Microsoft Edge e o iTunes. Este aspecto, por si só, é suficiente para que não recomendemos qualquer Pavilion AMD equipado com discos rígidos padrão, independentemente da qualidade do chassi ou características da tela.
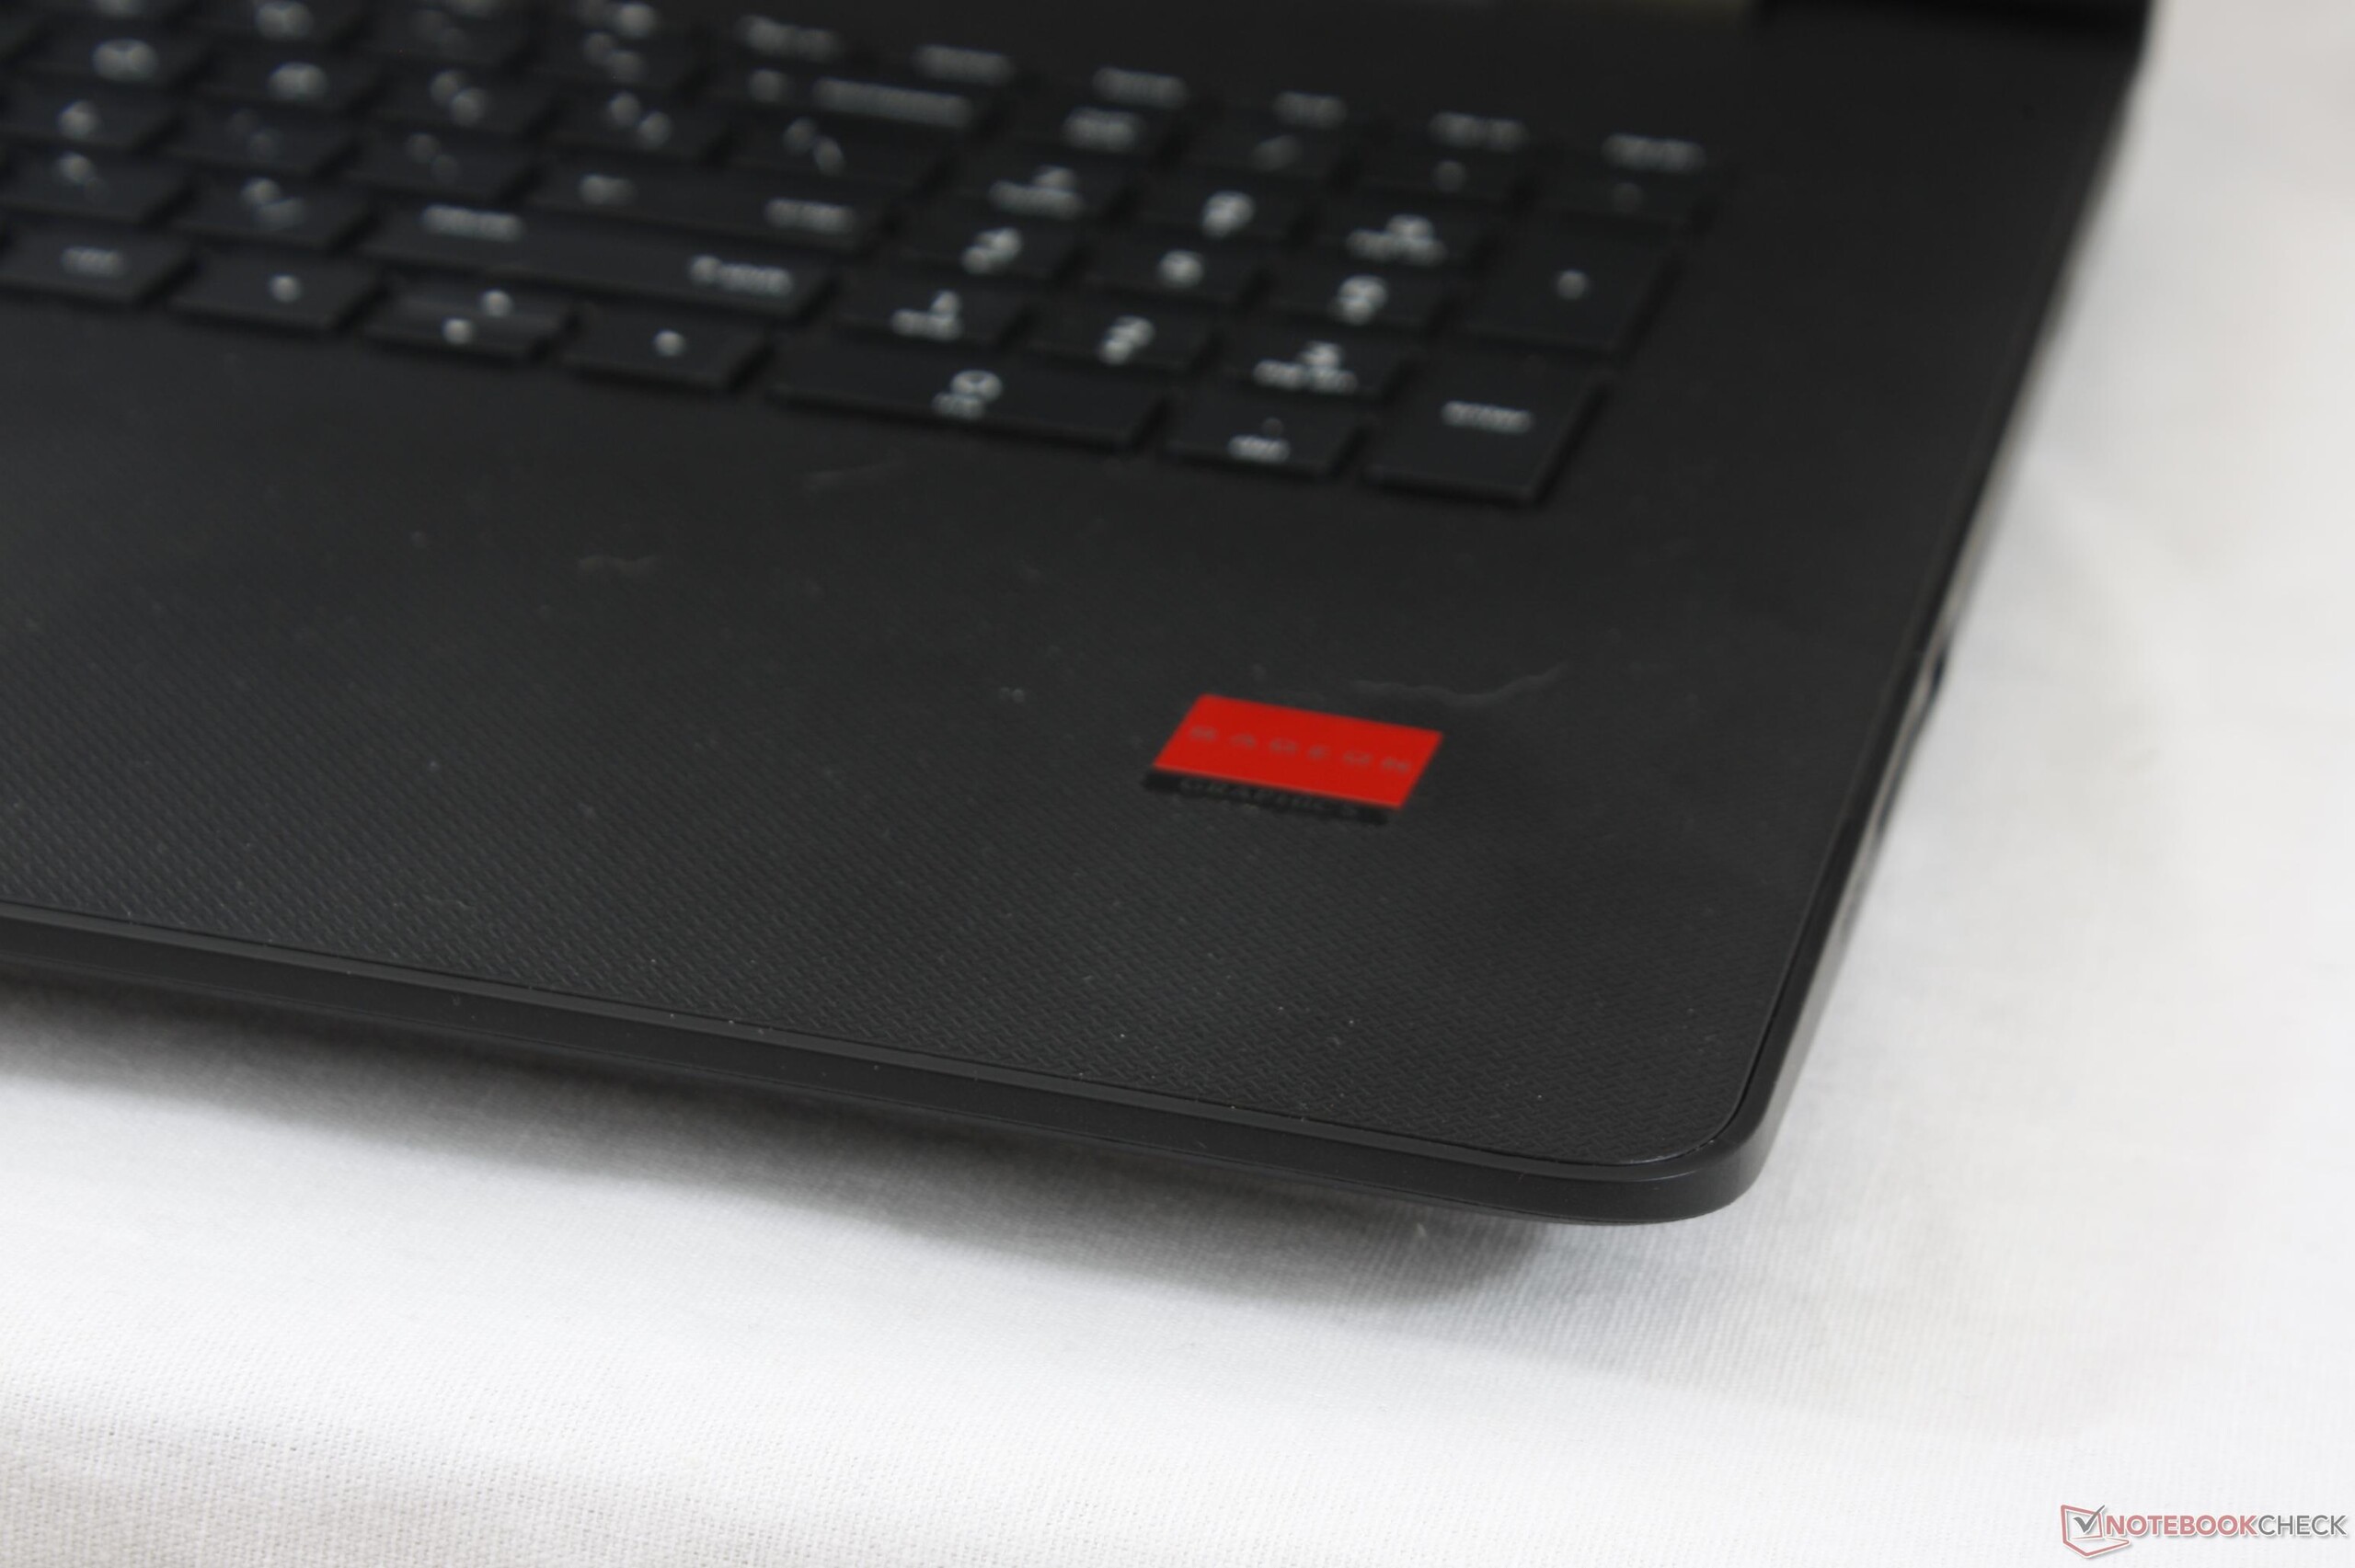
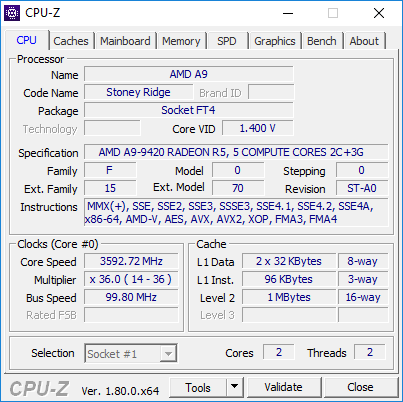
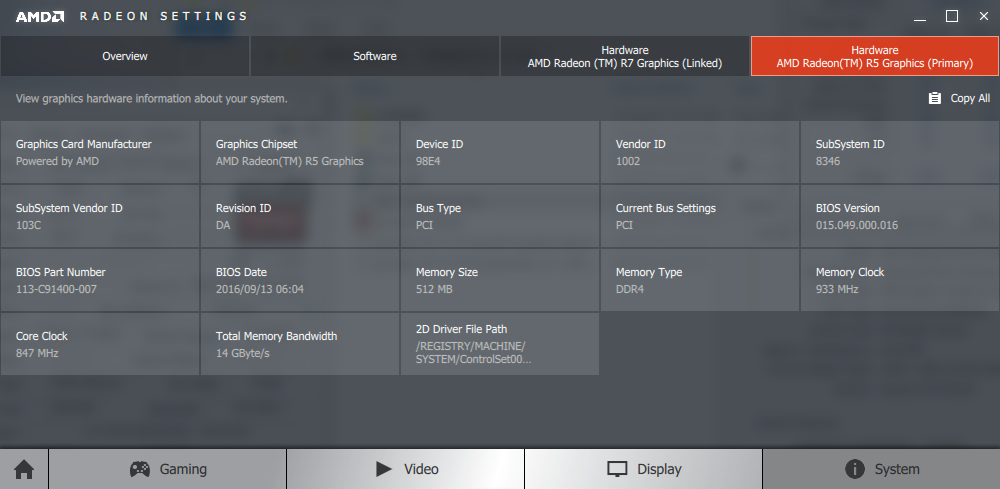
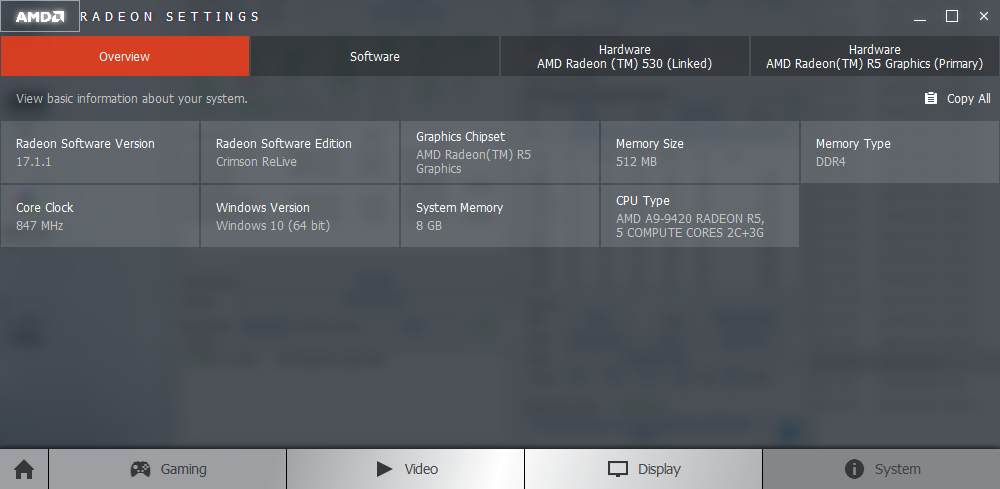
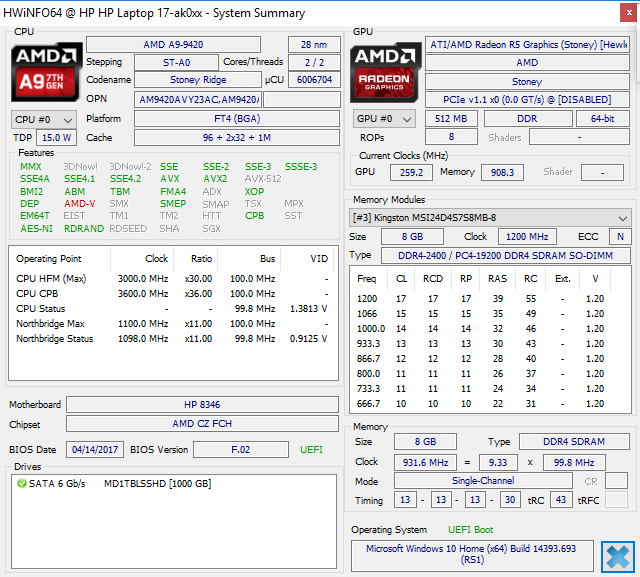
Com isso fora do caminho, a APU Stoney Ridge A9 e a GPU Radeon 530são um par desequilibrado. Como o nosso anterior A12-9720P Pavilion 17z SKU, as capacidades gráficas da nossa configuração A9 são retidas pelo lento poder de processamento do SoC. As taxas de quadros podem atingir 80% em relação ao HD Graphics 620 ou até 20% dependendo do jogo com os graves custos de maior consumo de energia, menor duração da bateria e ruído da ventoinha significativamente mais alto sob carga. Uma GPU que pode ser tão voraz quanto uma GeForce GTX 950M, mas com o nível de desempenho de uma série Intel Iris ou HD Graphics mais antiga é uma preocupação por conta própria.
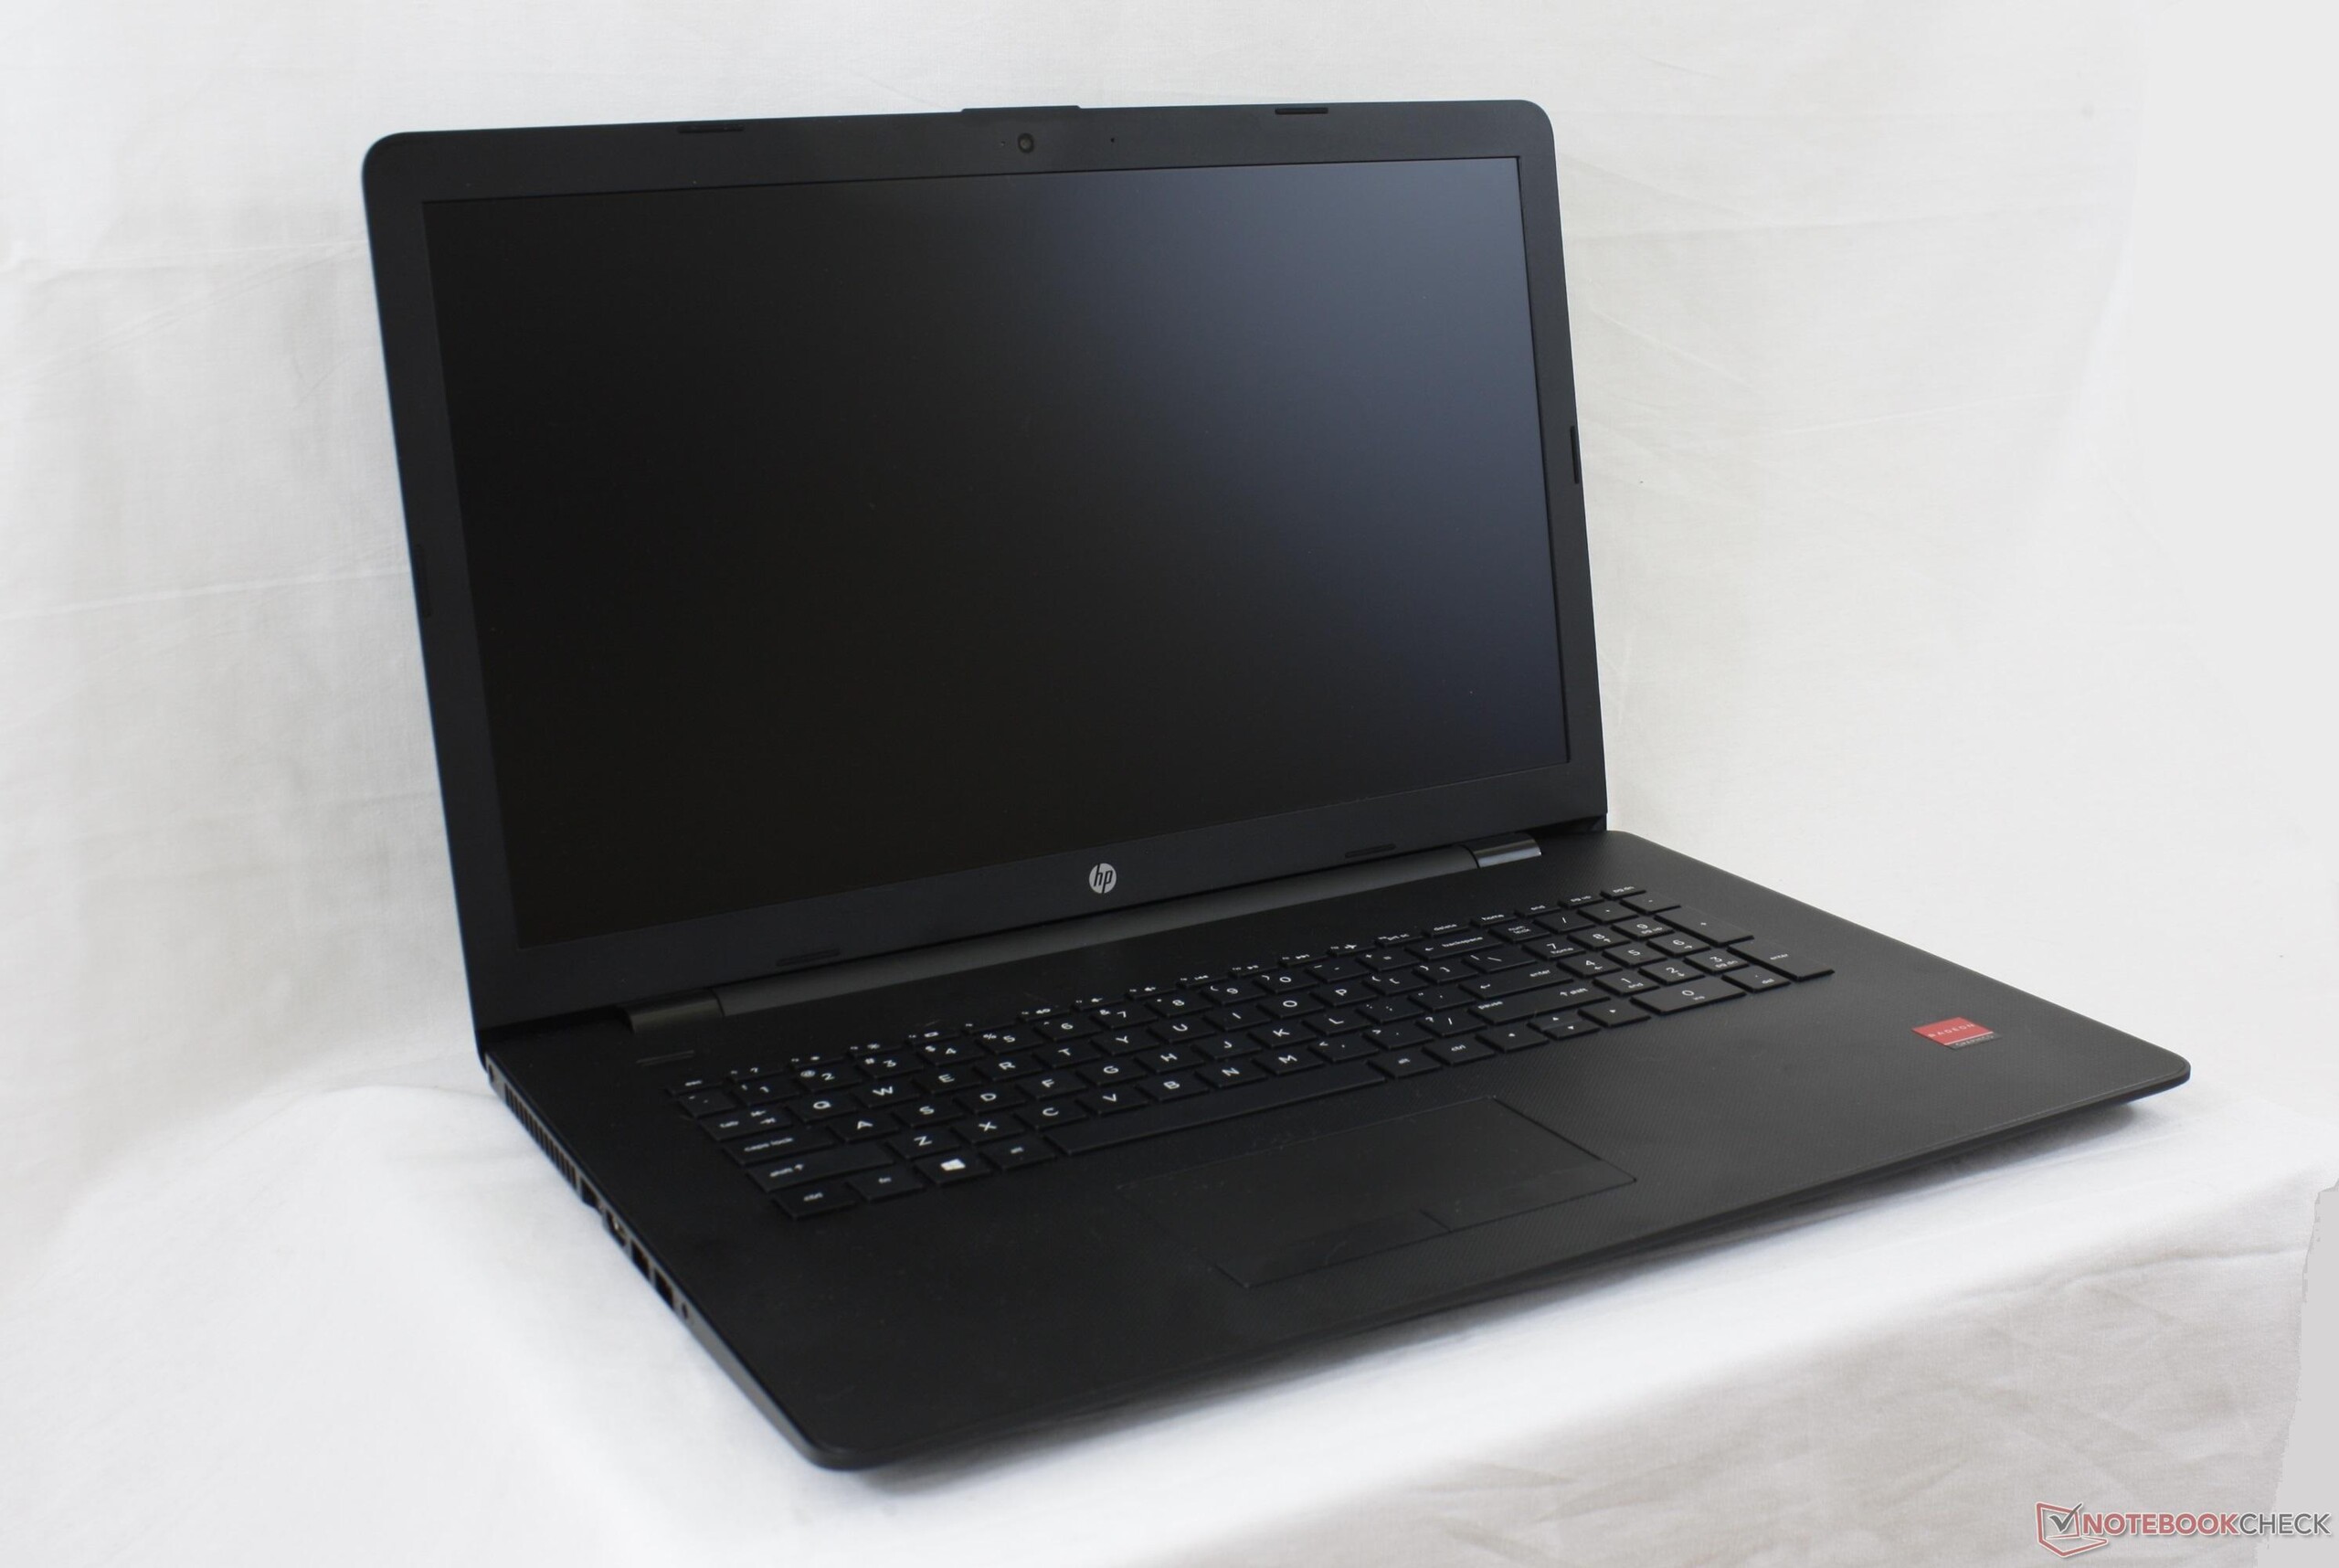
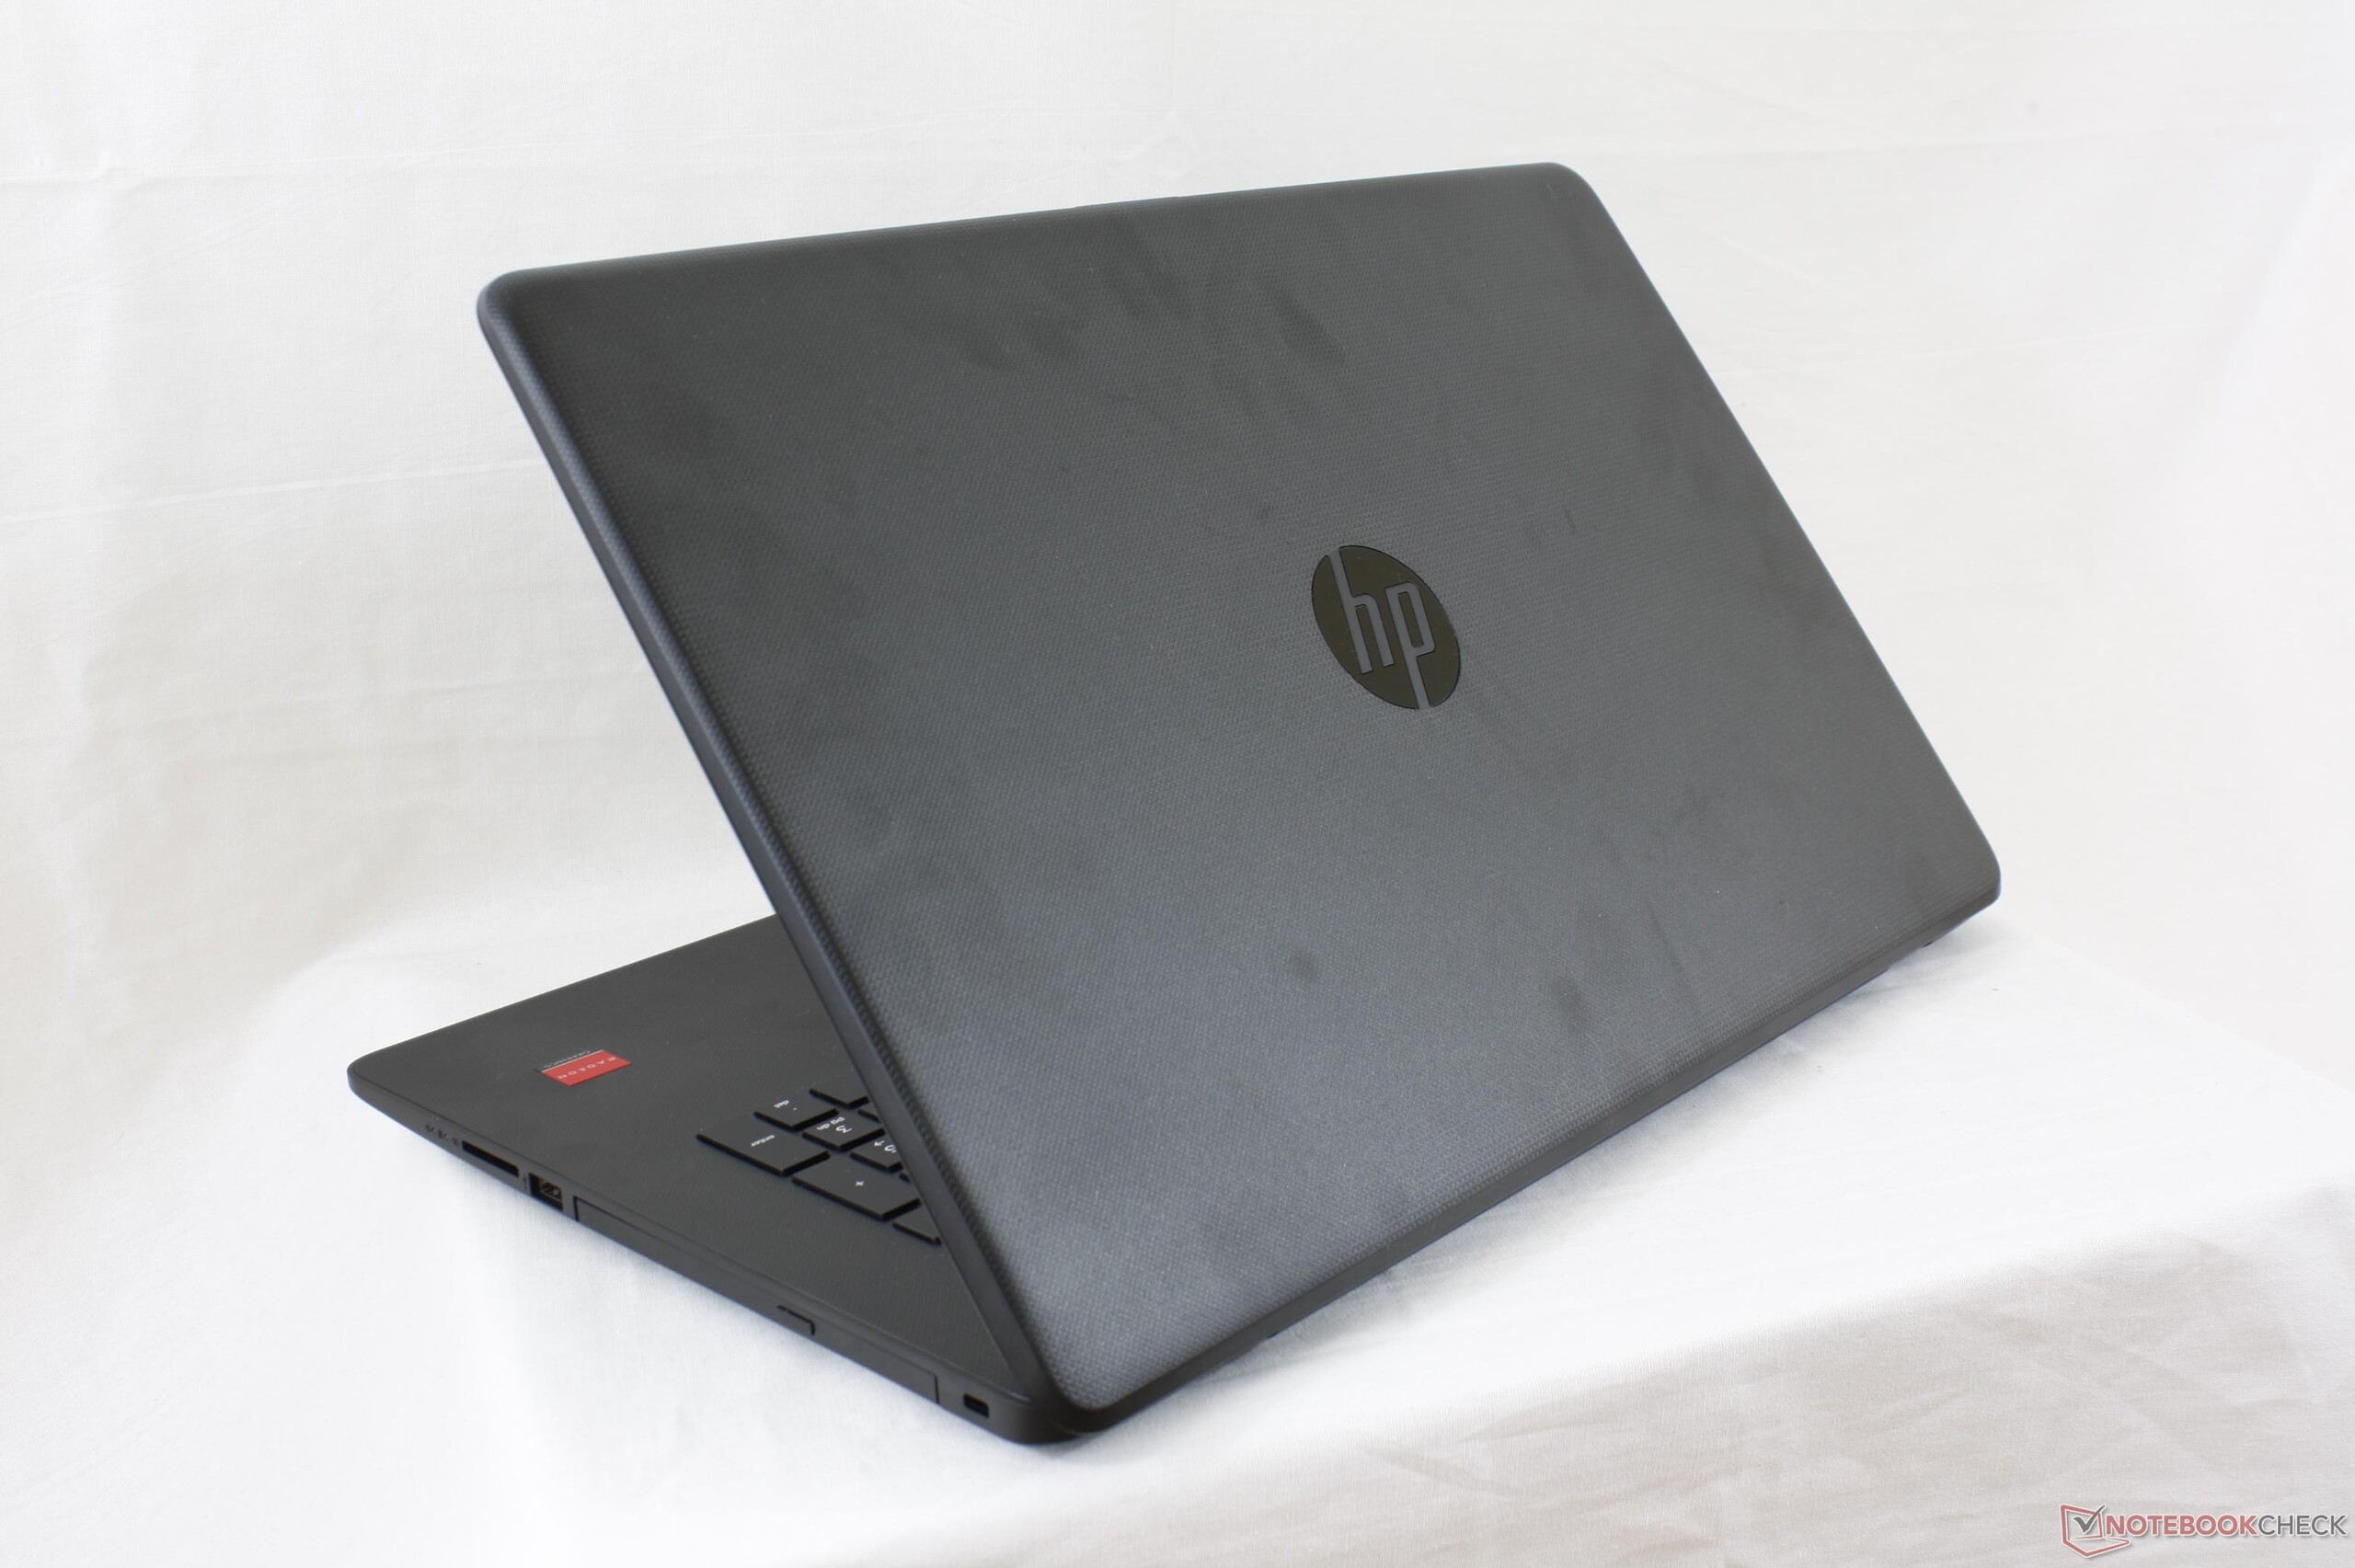
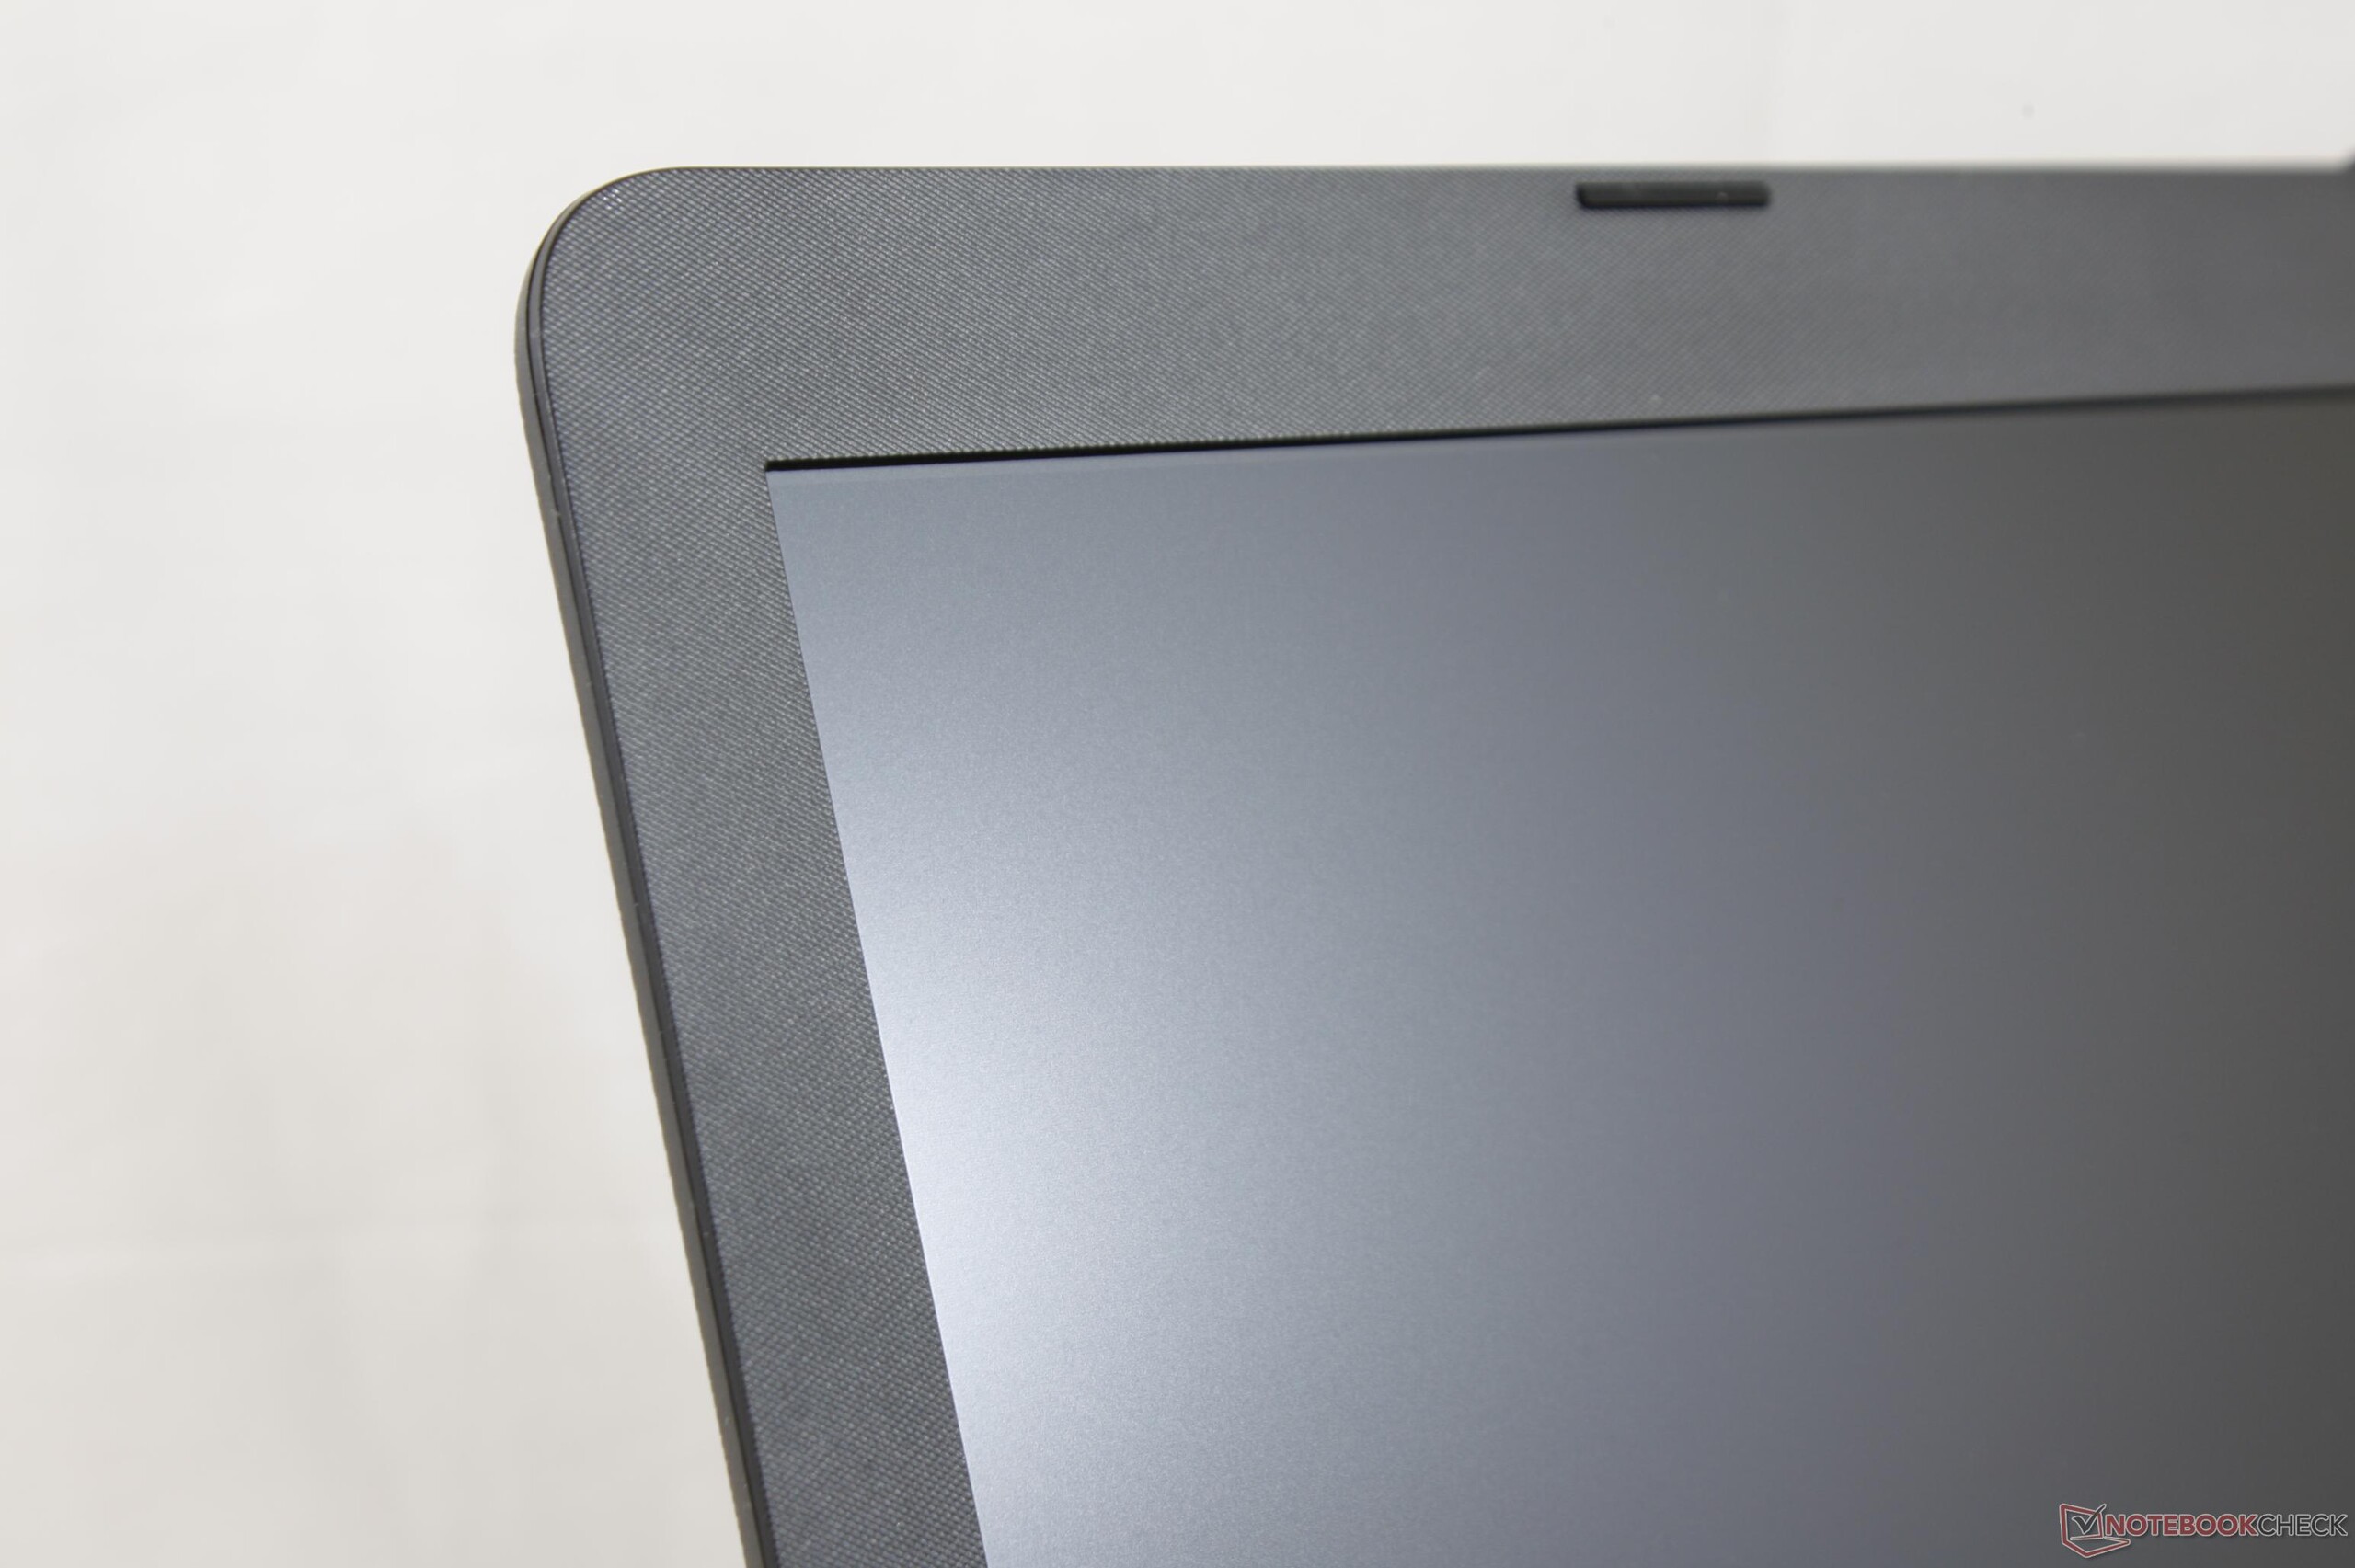
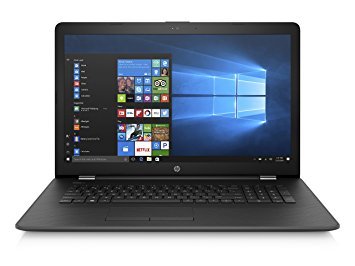
O chassi do Pavilion 17z é o do padrão com algumas surpresas. Os alto-falantes internos são decentes e a iluminação de fundo da tela é brilhante para sua classe com uma gama de cores mais ampla do que o esperado. Além desses poucos pontos positivos, esperamos que as futuras revisões de hardware abordem a tela mate granulada, o moderado bleeding da luz de fundo e a manutenção difícil, especialmente para aqueles que querem investir em SSDs.
O Pavilion impulsionado por AMD não consegue decidir se deseja ser um portátil barato de gama baixa ou um cavalo de trabalho de escritório muito acessível. Em ambos os casos, ele cai no chão em ambas as frentes.
HP Pavilion 17z 1EX13AV
- 07/18/2017 v6 (old)
Allen Ngo
Price comparison
