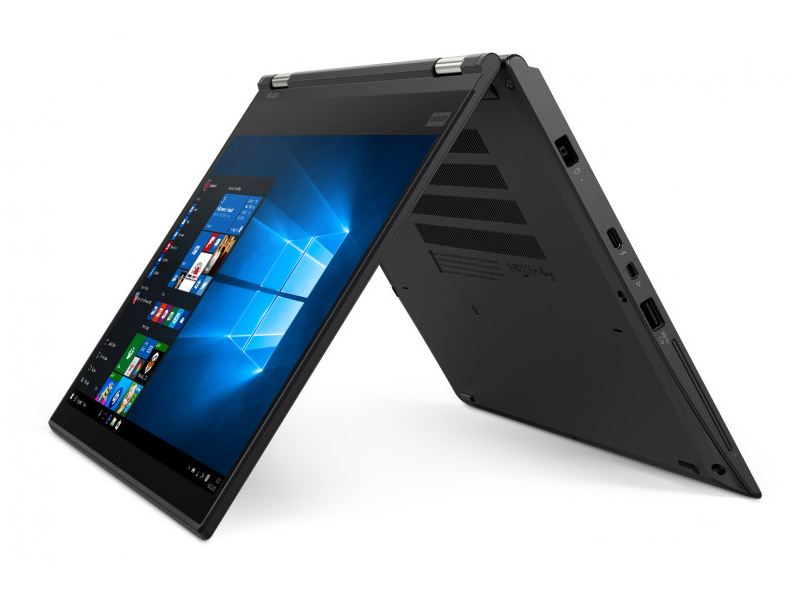
Breve Análise do Conversível Lenovo ThinkPad X380 Yoga (i7-8550U, FHD)
| SD Card Reader | |
| average JPG Copy Test (av. of 3 runs) | |
| Média da turma Convertible (29.4 - 186, n=21, últimos 2 anos) | |
| Lenovo ThinkPad Yoga 370-20JJS00100 (Toshiba Exceria Pro M401) | |
| Lenovo ThinkPad X380 Yoga 20LJS02W00 (Toshiba Exceria Pro SDXC 64 GB UHS-II) | |
| maximum AS SSD Seq Read Test (1GB) | |
| Média da turma Convertible (67.5 - 254, n=20, últimos 2 anos) | |
| Lenovo ThinkPad X380 Yoga 20LJS02W00 (Toshiba Exceria Pro SDXC 64 GB UHS-II) | |
| Lenovo ThinkPad Yoga 370-20JJS00100 (Toshiba Exceria Pro M401) | |
| |||||||||||||||||||||||||
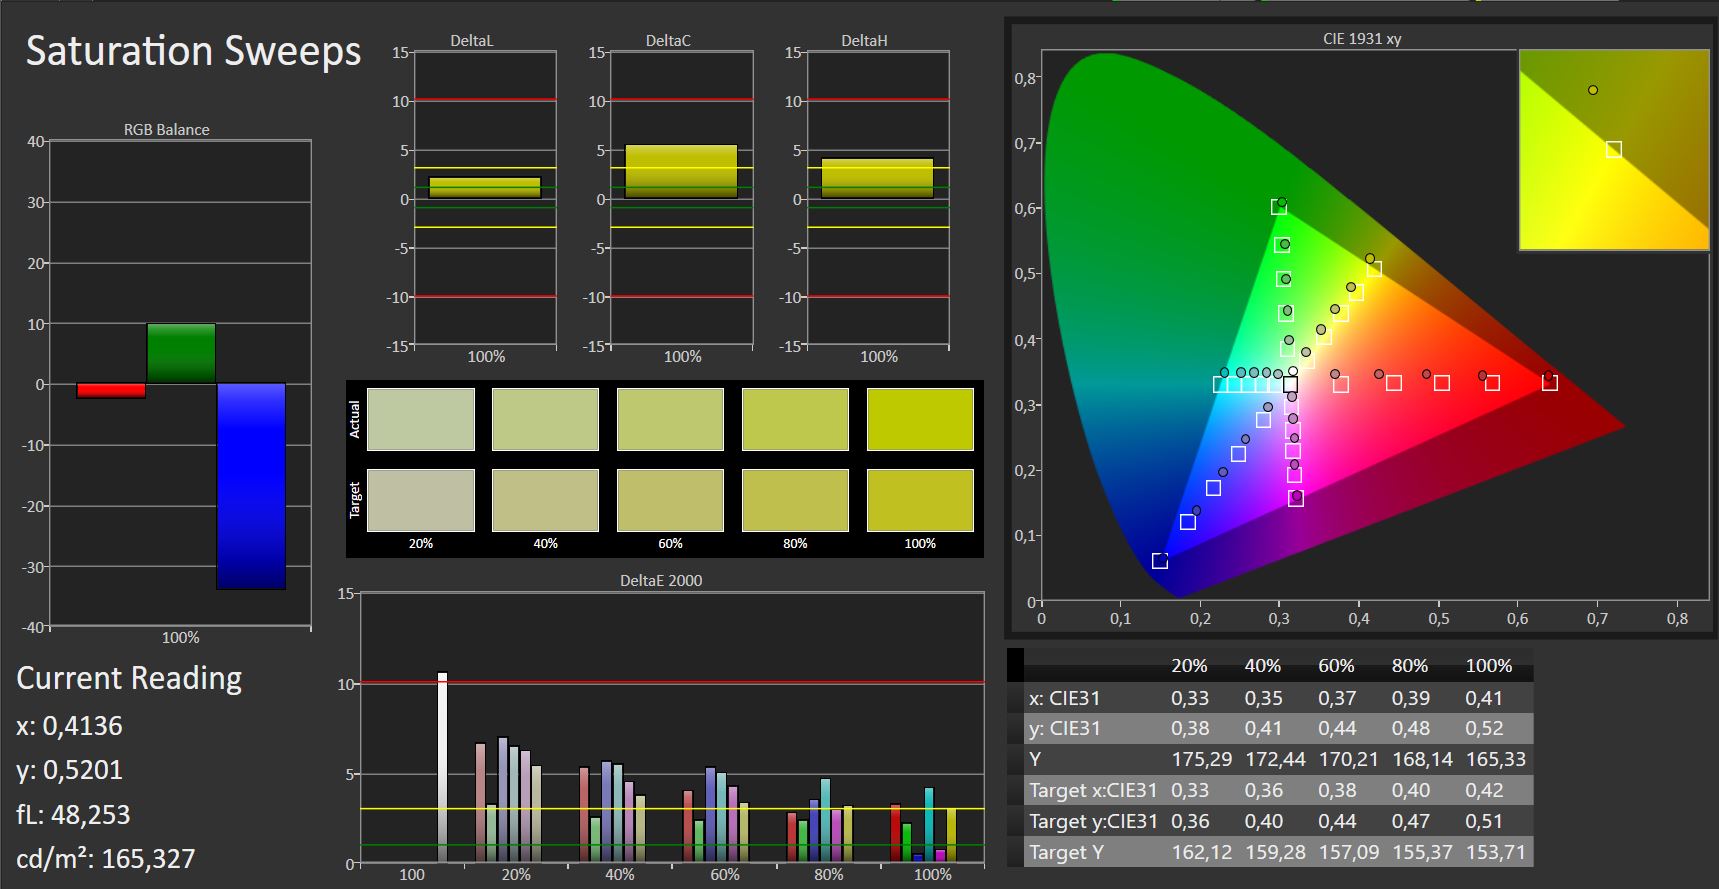
iluminação: 84 %
iluminação com acumulador: 314 cd/m²
Contraste: 1963:1 (Preto: 0.16 cd/m²)
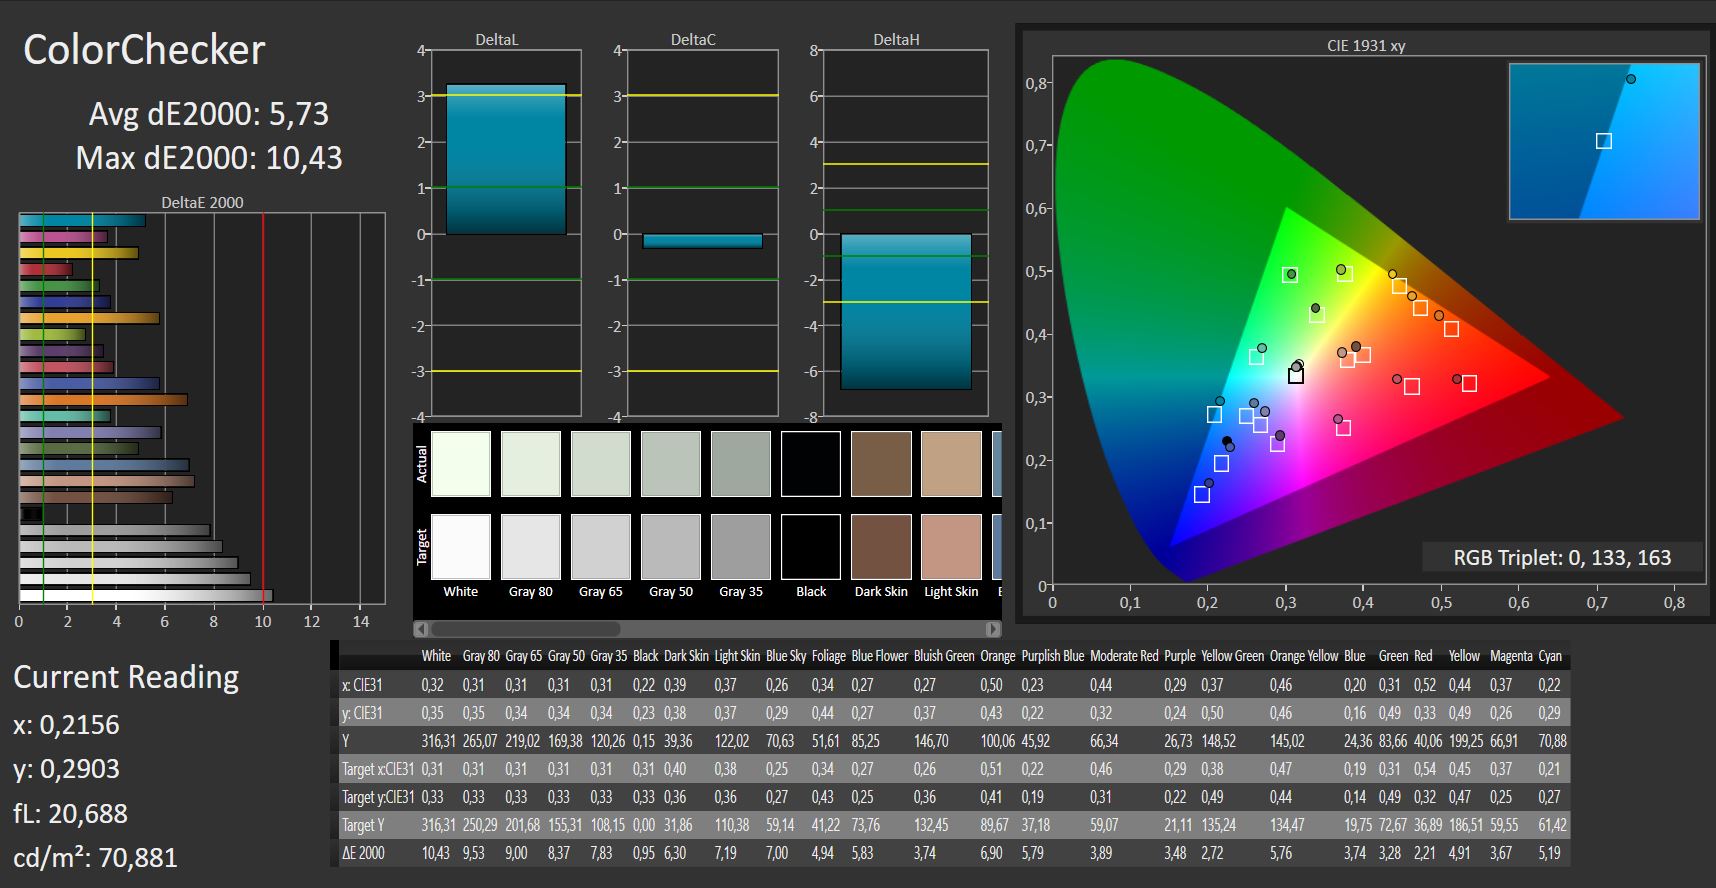
ΔE ColorChecker Calman: 5.73 | ∀{0.5-29.43 Ø4.71}
ΔE Greyscale Calman: 7.39 | ∀{0.09-98 Ø4.96}
96% sRGB (Argyll 1.6.3 3D)
61% AdobeRGB 1998 (Argyll 1.6.3 3D)
67.8% AdobeRGB 1998 (Argyll 3D)
95.8% sRGB (Argyll 3D)
65.9% Display P3 (Argyll 3D)
Gamma: 2.14
CCT: 6351 K
| Lenovo ThinkPad X380 Yoga 20LJS02W00 IPS, 1920x1080, 13.3" | Lenovo ThinkPad Yoga 370-20JJS00100 IPS LED, 1920x1080, 13.3" | Dell XPS 13 9365-4537 2-in-1 IPS, 3200x1800, 13.3" | HP EliteBook x360 1030 G2 IPS, 1920x1080, 13.3" | |
|---|---|---|---|---|
| Display | 3% | -3% | -4% | |
| Display P3 Coverage (%) | 65.9 | 67.9 3% | 64.4 -2% | 65.5 -1% |
| sRGB Coverage (%) | 95.8 | 97.3 2% | 92.9 -3% | 88.8 -7% |
| AdobeRGB 1998 Coverage (%) | 67.8 | 69.9 3% | 66.1 -3% | 64.9 -4% |
| Response Times | 2% | 4% | -2% | |
| Response Time Grey 50% / Grey 80% * (ms) | 50 ? | 42 ? 16% | 48 ? 4% | 55.2 ? -10% |
| Response Time Black / White * (ms) | 29 ? | 32.8 ? -13% | 28 ? 3% | 27.2 ? 6% |
| PWM Frequency (Hz) | 1000 ? | 217.4 ? | ||
| Screen | -6% | 12% | -11% | |
| Brightness middle (cd/m²) | 314 | 374 19% | 348 11% | 262 -17% |
| Brightness (cd/m²) | 302 | 356 18% | 306 1% | 256 -15% |
| Brightness Distribution (%) | 84 | 87 4% | 78 -7% | 83 -1% |
| Black Level * (cd/m²) | 0.16 | 0.33 -106% | 0.2 -25% | 0.25 -56% |
| Contrast (:1) | 1963 | 1133 -42% | 1740 -11% | 1048 -47% |
| Colorchecker dE 2000 * | 5.73 | 4.7 18% | 2.79 51% | 5.13 10% |
| Colorchecker dE 2000 max. * | 10.43 | 9.5 9% | 5.53 47% | 9.46 9% |
| Greyscale dE 2000 * | 7.39 | 6.5 12% | 3.47 53% | 6.23 16% |
| Gamma | 2.14 103% | 2.19 100% | 2.54 87% | 2.45 90% |
| CCT | 6351 102% | 7086 92% | 6564 99% | 6413 101% |
| Color Space (Percent of AdobeRGB 1998) (%) | 61 | 63.1 3% | 60 -2% | 57.84 -5% |
| Color Space (Percent of sRGB) (%) | 96 | 97.2 1% | 93 -3% | 88.57 -8% |
| Média Total (Programa/Configurações) | -0% /
-4% | 4% /
8% | -6% /
-9% |
* ... menor é melhor
Cintilação da tela / PWM (modulação por largura de pulso)
| Tela tremeluzindo/PWM detectado | 1000 Hz | ≤ 90 % configuração de brilho | 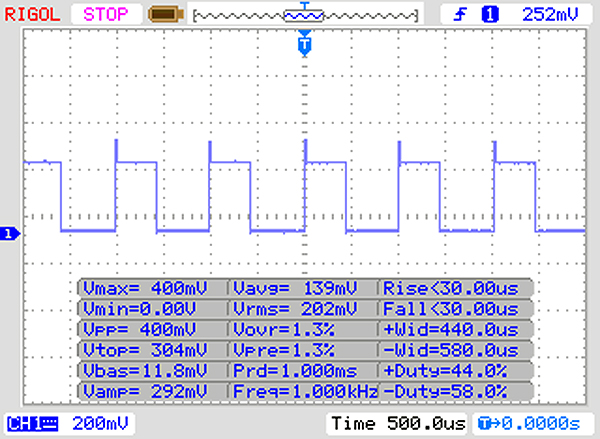 |
A luz de fundo da tela pisca em 1000 Hz (pior caso, por exemplo, utilizando PWM) Cintilação detectada em uma configuração de brilho de 90 % e abaixo. Não deve haver cintilação ou PWM acima desta configuração de brilho. A frequência de 1000 Hz é bastante alta, então a maioria dos usuários sensíveis ao PWM não deve notar nenhuma oscilação. [pwm_comparison] Em comparação: 52 % de todos os dispositivos testados não usam PWM para escurecer a tela. Se PWM foi detectado, uma média de 7751 (mínimo: 5 - máximo: 343500) Hz foi medida. | |||

Exibir tempos de resposta
| ↔ Tempo de resposta preto para branco | ||
|---|---|---|
| 29 ms ... ascensão ↗ e queda ↘ combinadas | ↗ 15 ms ascensão | 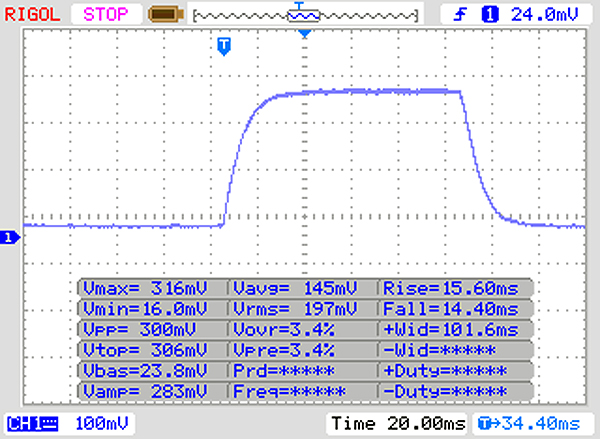 |
| ↘ 14 ms queda | ||
| A tela mostra taxas de resposta relativamente lentas em nossos testes e pode ser muito lenta para os jogadores. Em comparação, todos os dispositivos testados variam de 0.1 (mínimo) a 240 (máximo) ms. » 77 % de todos os dispositivos são melhores. Isso significa que o tempo de resposta medido é pior que a média de todos os dispositivos testados (19.8 ms). | ||
| ↔ Tempo de resposta 50% cinza a 80% cinza | ||
| 50 ms ... ascensão ↗ e queda ↘ combinadas | ↗ 24 ms ascensão | 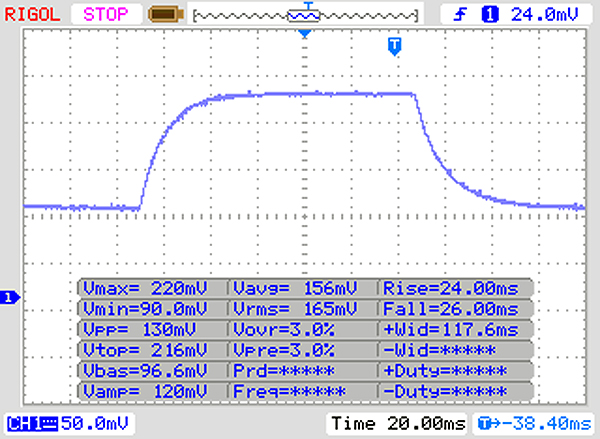 |
| ↘ 26 ms queda | ||
| A tela mostra taxas de resposta lentas em nossos testes e será insatisfatória para os jogadores. Em comparação, todos os dispositivos testados variam de 0.165 (mínimo) a 636 (máximo) ms. » 86 % de todos os dispositivos são melhores. Isso significa que o tempo de resposta medido é pior que a média de todos os dispositivos testados (31 ms). | ||
| Geekbench 3 | |
| 32 Bit Multi-Core Score | |
| Média Intel Core i7-8550U (8918 - 14144, n=12) | |
| Lenovo ThinkPad X380 Yoga 20LJS02W00 | |
| Dell XPS 13 9365-4537 2-in-1 | |
| 32 Bit Single-Core Score | |
| Lenovo ThinkPad X380 Yoga 20LJS02W00 | |
| Média Intel Core i7-8550U (2471 - 4020, n=12) | |
| Dell XPS 13 9365-4537 2-in-1 | |
| JetStream 1.1 - 1.1 Total | |
| Acer Spin 5 SP515-51GN-80A3 (Edge 41.16299.15.0) | |
| Lenovo ThinkPad X380 Yoga 20LJS02W00 (Ede 41) | |
| Média Intel Core i7-8550U (141.9 - 288, n=61) | |
| HP EliteBook x360 1030 G2 (Edge 38.14393.0.0) | |
| HP Spectre x360 13t-ae000 | |
| Lenovo ThinkPad Yoga 370-20JJS00100 (Edge) | |
| Dell XPS 13 9365-4537 2-in-1 (Edge 40) | |
| PCMark 7 Score | 5898 pontos | |
| PCMark 8 Home Score Accelerated v2 | 3687 pontos | |
| PCMark 8 Creative Score Accelerated v2 | 4788 pontos | |
| PCMark 8 Work Score Accelerated v2 | 4656 pontos | |
| PCMark 10 Score | 3632 pontos | |
Ajuda | ||

| Lenovo ThinkPad X380 Yoga 20LJS02W00 Samsung SSD PM981 MZVLB512HAJQ | Lenovo ThinkPad Yoga 370-20JJS00100 Toshiba NVMe THNSF5512GPUK | Dell XPS 13 9365-4537 2-in-1 Toshiba NVMe THNSN5256GPUK | HP EliteBook x360 1030 G2 Sandisk SD8TN8U-256G-1006 | Média Samsung SSD PM981 MZVLB512HAJQ | |
|---|---|---|---|---|---|
| CrystalDiskMark 3.0 | -41% | -53% | -63% | -9% | |
| Read Seq (MB/s) | 2486 | 1070 -57% | 1159 -53% | 467.1 -81% | 2002 ? -19% |
| Write Seq (MB/s) | 1341 | 484.5 -64% | 324.1 -76% | 443.6 -67% | 1656 ? 23% |
| Read 512 (MB/s) | 1788 | 680 -62% | 528 -70% | 312.3 -83% | 1213 ? -32% |
| Write 512 (MB/s) | 1885 | 483.1 -74% | 373.7 -80% | 372.5 -80% | 1641 ? -13% |
| Read 4k (MB/s) | 62.3 | 30.55 -51% | 29.26 -53% | 29.43 -53% | 61.4 ? -1% |
| Write 4k (MB/s) | 145.6 | 127.3 -13% | 108.3 -26% | 56.5 -61% | 131.3 ? -10% |
| Read 4k QD32 (MB/s) | 385.5 | 460.8 20% | 335.9 -13% | 311.3 -19% | 407 ? 6% |
| Write 4k QD32 (MB/s) | 535 | 414.5 -23% | 234.1 -56% | 225.2 -58% | 402 ? -25% |
| 3DMark 06 Standard Score | 8282 pontos | |
| 3DMark 11 Performance | 1801 pontos | |
| 3DMark Cloud Gate Standard Score | 5821 pontos | |
| 3DMark Fire Strike Score | 786 pontos | |
Ajuda | ||
| baixo | média | alto | ultra | |
|---|---|---|---|---|
| Tomb Raider (2013) | 85.8 | 43.3 | 28.2 | 12.5 |
| BioShock Infinite (2013) | 62.9 | 32.4 | 26.7 | 9.3 |
| Rise of the Tomb Raider (2016) | 15.5 | 9.5 | 4.9 | 3.1 |
Barulho
| Ocioso |
| 30.4 / 30.4 / 30.4 dB |
| Carga |
| 34.2 / 35.2 dB |
 | ||
30 dB silencioso 40 dB(A) audível 50 dB(A) ruidosamente alto |
||
min: | ||
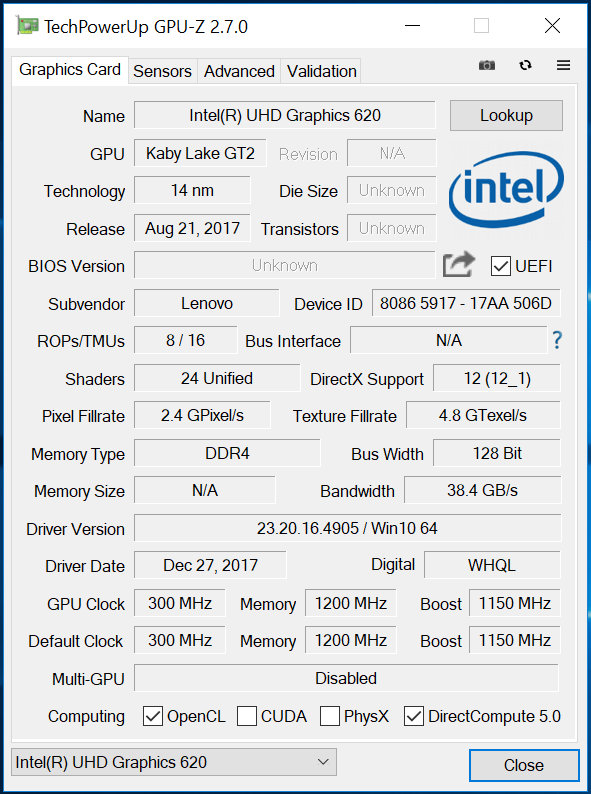
| Lenovo ThinkPad X380 Yoga 20LJS02W00 i5-8550U, UHD Graphics 620 | Lenovo ThinkPad Yoga 370-20JJS00100 i5-7200U, HD Graphics 620 | HP EliteBook x360 1030 G2 i5-7300U, HD Graphics 620 | |
|---|---|---|---|
| Noise | 2% | 3% | |
| desligado / ambiente * (dB) | 30.4 | 28.6 6% | 29 5% |
| Idle Minimum * (dB) | 30.4 | 28.6 6% | 29 5% |
| Idle Average * (dB) | 30.4 | 28.6 6% | 29 5% |
| Idle Maximum * (dB) | 30.4 | 31.2 -3% | 29 5% |
| Load Average * (dB) | 34.2 | 33.7 1% | 33.6 2% |
| Load Maximum * (dB) | 35.2 | 36.7 -4% | 35.8 -2% |
* ... menor é melhor
(±) A temperatura máxima no lado superior é 40.2 °C / 104 F, em comparação com a média de 35.4 °C / 96 F , variando de 19.6 a 60 °C para a classe Convertible.
(-) A parte inferior aquece até um máximo de 46 °C / 115 F, em comparação com a média de 36.9 °C / 98 F
(+) Em uso inativo, a temperatura média para o lado superior é 24.3 °C / 76 F, em comparação com a média do dispositivo de 30.3 °C / ### class_avg_f### F.
(+) Os apoios para as mãos e o touchpad são mais frios que a temperatura da pele, com um máximo de 29.7 °C / 85.5 F e, portanto, são frios ao toque.
(±) A temperatura média da área do apoio para as mãos de dispositivos semelhantes foi 28 °C / 82.4 F (-1.7 °C / -3.1 F).
| Lenovo ThinkPad X380 Yoga 20LJS02W00 i5-8550U, UHD Graphics 620 | Lenovo ThinkPad Yoga 370-20JJS00100 i5-7200U, HD Graphics 620 | Dell XPS 13 9365-4537 2-in-1 i5-7Y54, HD Graphics 615 | HP EliteBook x360 1030 G2 i5-7300U, HD Graphics 620 | |
|---|---|---|---|---|
| Heat | -9% | 4% | 5% | |
| Maximum Upper Side * (°C) | 40.2 | 42 -4% | 43.1 -7% | 36.1 10% |
| Maximum Bottom * (°C) | 46 | 48 -4% | 41.7 9% | 36.7 20% |
| Idle Upper Side * (°C) | 25.2 | 28 -11% | 23.8 6% | 26.8 -6% |
| Idle Bottom * (°C) | 25.8 | 29.7 -15% | 23.7 8% | 26.5 -3% |
* ... menor é melhor
Lenovo ThinkPad X380 Yoga 20LJS02W00 análise de áudio
(-) | alto-falantes não muito altos (###valor### dB)
Graves 100 - 315Hz
(-) | quase nenhum baixo - em média 29.7% menor que a mediana
(±) | a linearidade dos graves é média (8.9% delta para a frequência anterior)
Médios 400 - 2.000 Hz
(+) | médios equilibrados - apenas 3.5% longe da mediana
(±) | a linearidade dos médios é média (10.2% delta para frequência anterior)
Altos 2 - 16 kHz
(±) | máximos mais altos - em média 5.1% maior que a mediana
(±) | a linearidade dos máximos é média (7.3% delta para frequência anterior)
Geral 100 - 16.000 Hz
(-) | o som geral não é linear (30.7% diferença em relação à mediana)
Comparado com a mesma classe
» 90% de todos os dispositivos testados nesta classe foram melhores, 2% semelhantes, 8% piores
» O melhor teve um delta de 6%, a média foi 20%, o pior foi 57%
Comparado com todos os dispositivos testados
» 89% de todos os dispositivos testados foram melhores, 3% semelhantes, 8% piores
» O melhor teve um delta de 4%, a média foi 23%, o pior foi 134%
Apple MacBook 12 (Early 2016) 1.1 GHz análise de áudio
(+) | os alto-falantes podem tocar relativamente alto (###valor### dB)
Graves 100 - 315Hz
(±) | graves reduzidos - em média 11.3% menor que a mediana
(±) | a linearidade dos graves é média (14.2% delta para a frequência anterior)
Médios 400 - 2.000 Hz
(+) | médios equilibrados - apenas 2.4% longe da mediana
(+) | médios são lineares (5.5% delta para frequência anterior)
Altos 2 - 16 kHz
(+) | agudos equilibrados - apenas 2% longe da mediana
(+) | os máximos são lineares (4.5% delta da frequência anterior)
Geral 100 - 16.000 Hz
(+) | o som geral é linear (10.2% diferença em relação à mediana)
Comparado com a mesma classe
» 7% de todos os dispositivos testados nesta classe foram melhores, 2% semelhantes, 90% piores
» O melhor teve um delta de 5%, a média foi 18%, o pior foi 53%
Comparado com todos os dispositivos testados
» 5% de todos os dispositivos testados foram melhores, 1% semelhantes, 94% piores
» O melhor teve um delta de 4%, a média foi 23%, o pior foi 134%
| desligado | |
| Ocioso | |
| Carga |
|
Key:
min: | |
| Lenovo ThinkPad X380 Yoga 20LJS02W00 i5-8550U, UHD Graphics 620 | Lenovo ThinkPad Yoga 370-20JJS00100 i5-7200U, HD Graphics 620 | Dell XPS 13 9365-4537 2-in-1 i5-7Y54, HD Graphics 615 | HP EliteBook x360 1030 G2 i5-7300U, HD Graphics 620 | |
|---|---|---|---|---|
| Power Consumption | -7% | -49% | 2% | |
| Idle Minimum * (Watt) | 4 | 3.6 10% | 8.2 -105% | 3.2 20% |
| Idle Average * (Watt) | 4.9 | 7.2 -47% | 10.8 -120% | 5.5 -12% |
| Idle Maximum * (Watt) | 6.9 | 8.4 -22% | 12.7 -84% | 6.5 6% |
| Load Average * (Watt) | 36 | 29.9 17% | 22.6 37% | 29.7 17% |
| Load Maximum * (Watt) | 34.4 | 32.2 6% | 24.6 28% | 41.3 -20% |
* ... menor é melhor
| Lenovo ThinkPad X380 Yoga 20LJS02W00 i5-8550U, UHD Graphics 620, 51 Wh | Lenovo ThinkPad Yoga 370-20JJS00100 i5-7200U, HD Graphics 620, 51 Wh | Dell XPS 13 9365-4537 2-in-1 i5-7Y54, HD Graphics 615, 46 Wh | HP EliteBook x360 1030 G2 i5-7300U, HD Graphics 620, 57 Wh | |
|---|---|---|---|---|
| Duração da bateria | -4% | -20% | 33% | |
| Reader / Idle (h) | 20.8 | 19.4 -7% | 23.1 11% | |
| H.264 (h) | 9.2 | 9.6 4% | 11 20% | |
| WiFi v1.3 (h) | 8.5 | 8.1 -5% | 6.8 -20% | 10.5 24% |
| Load (h) | 2.3 | 2.1 -9% | 4.1 78% |
Pro
Contra
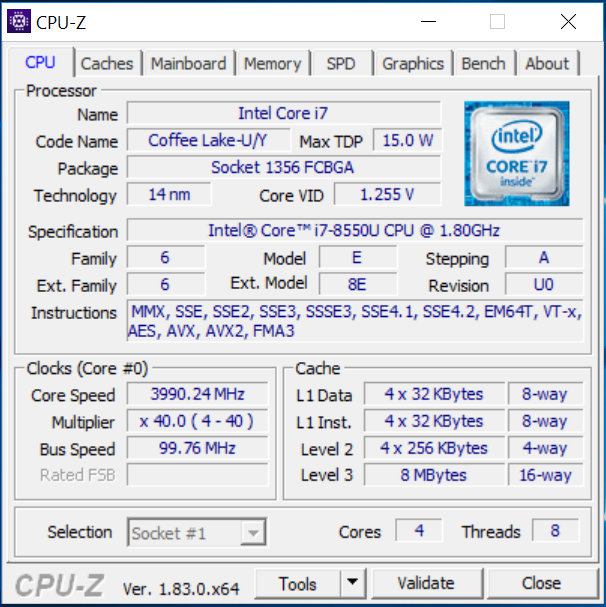
Nenhuma mudança fundamental foi feita no ThinkPad X380 Yoga, quando comparado ao seu antecessor (Thinkpad Yoga 370). Além de um novo nome, a Lenovo também apresenta um novo processador ULV quad-core da Intel.
O processador Core i7-8550U incorporado oferece desempenho mais que suficiente para trabalho de escritório e navegação na Internet. O processador pode utilizar seu Turbo boost apenas de forma limitada e por um curto período de tempo.
Tudo somado, o Lenovo ThinkPad X380 Yoga pode ser descrito como um sucesso. É por isso que as falhas (cintilação PWM, garantia de um ano, sem antenas WWAN) parecem ainda mais irritantes. De fato, nessa faixa de preços, essas falhas não devem surgir em primeiro lugar.
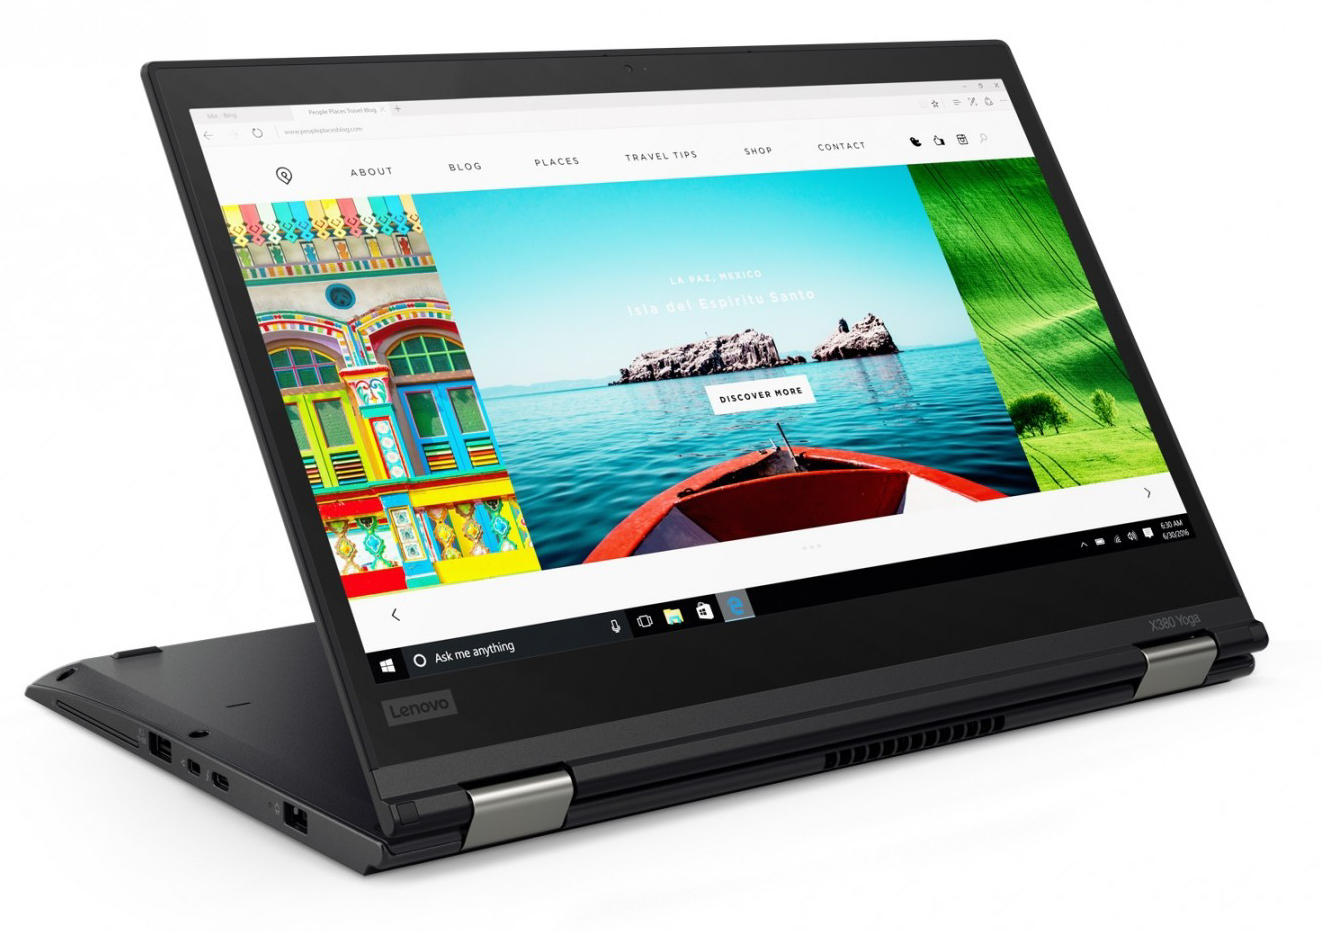
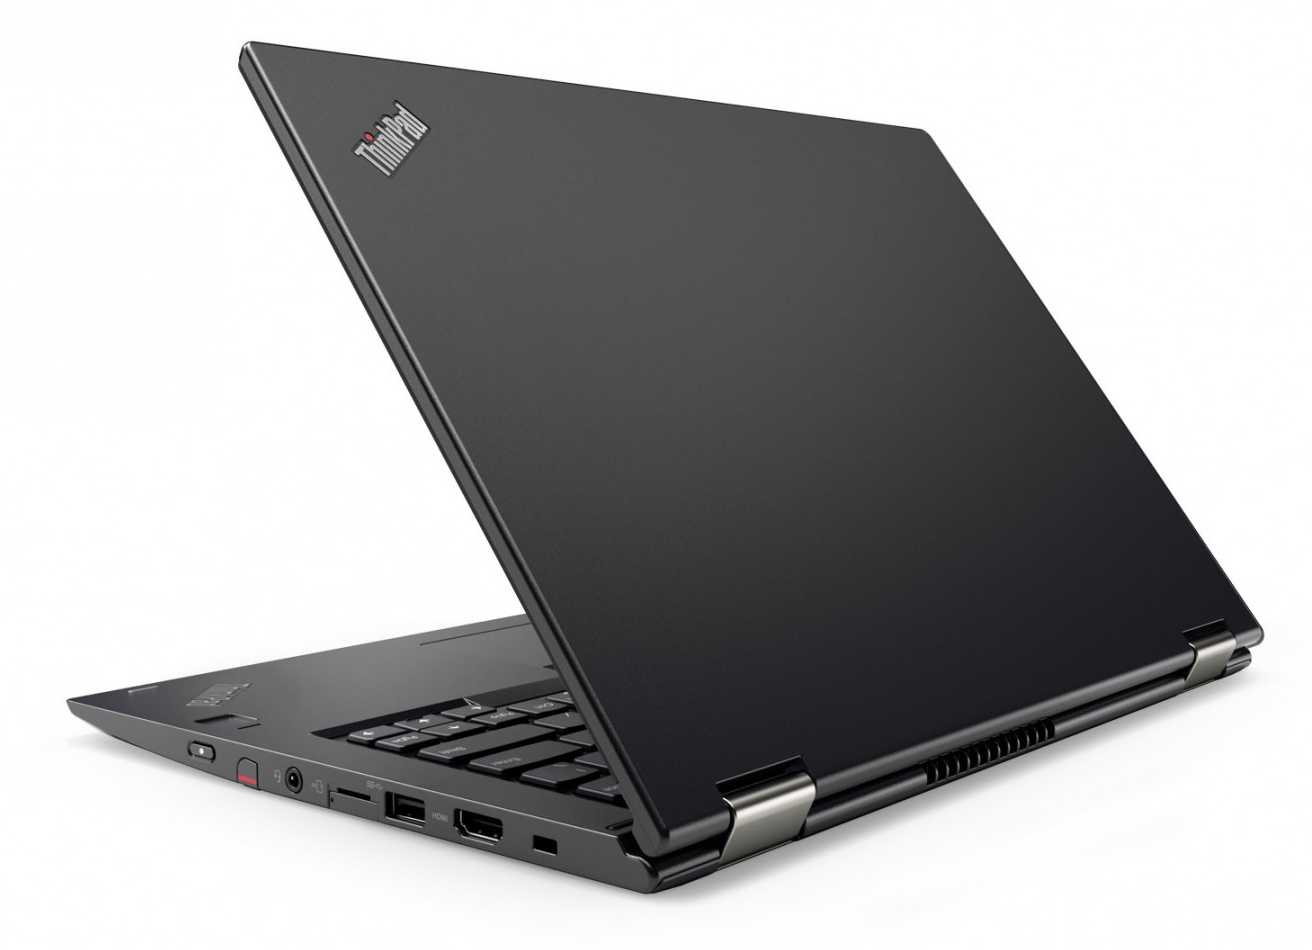
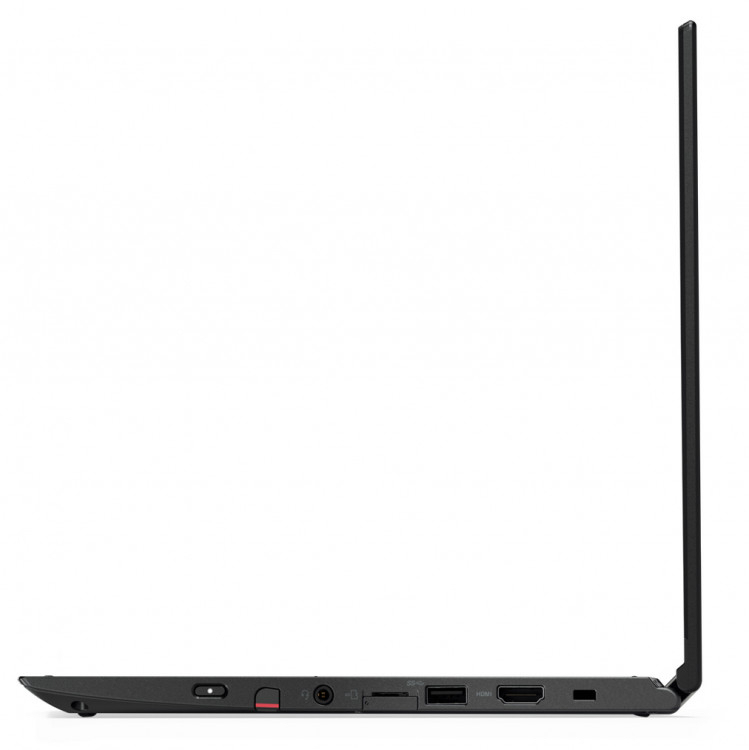
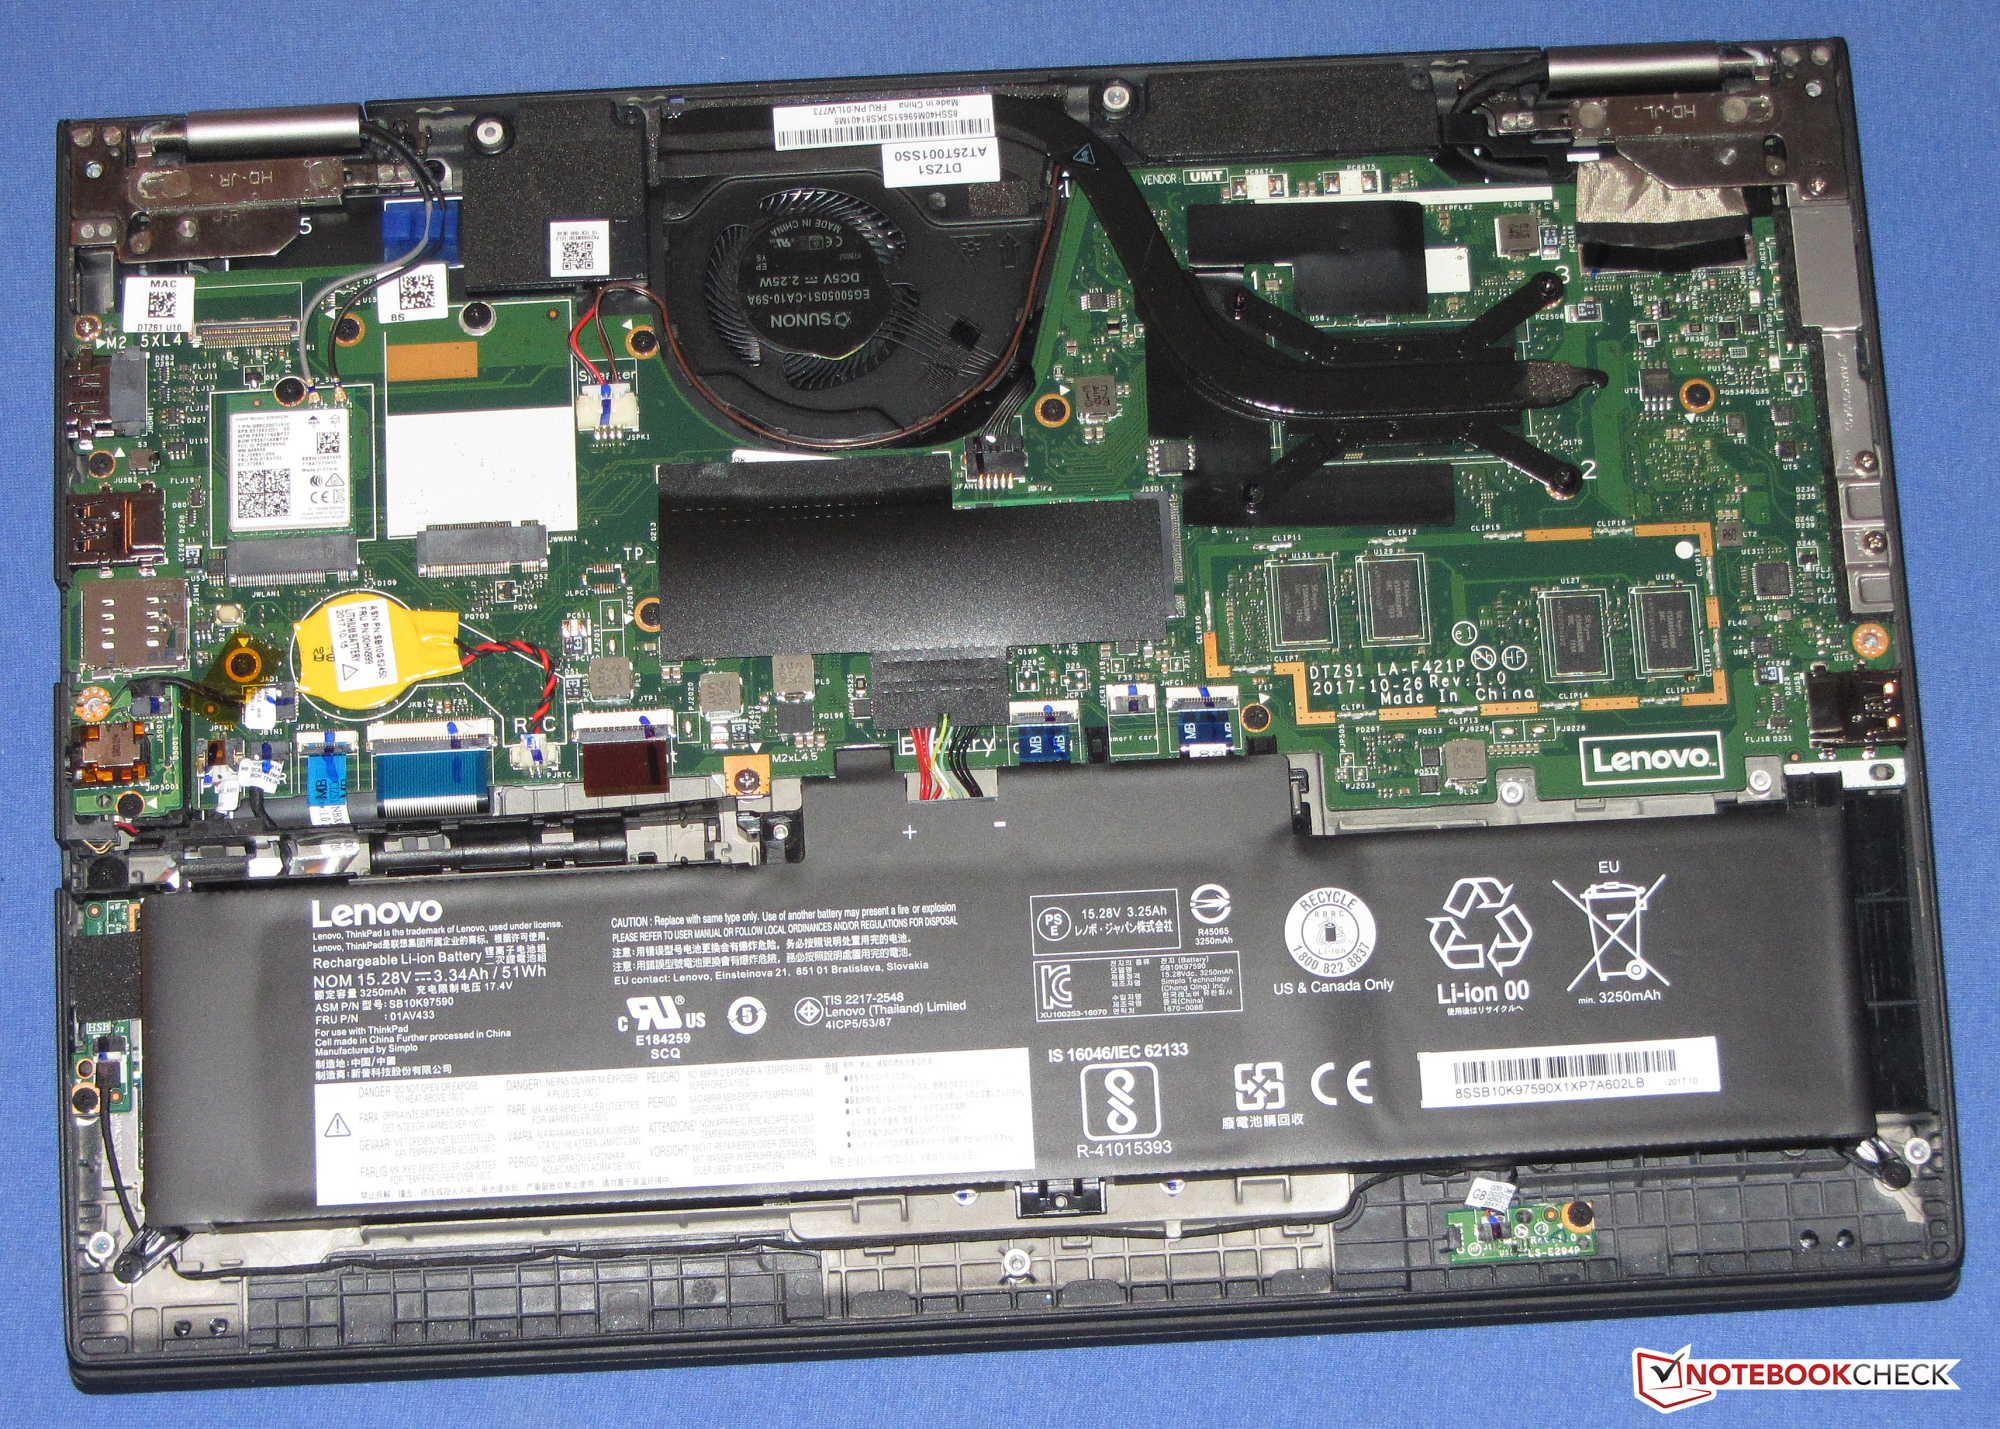
Um SSD NVMe muito veloz, possibilita um sistema muito responsivo. O SSD pode ser substituído. Para isso, você terá que abrir a carcaça, o qual não deve apresentar nenhum problema. Quando a carcaça estiver aberta, você terá acesso ao slot do modem LTE. O slot do cartão SIM também é fornecido. No entanto, a instalação de um modem LTE está fora de questão, porque nosso dispositivo de teste não possui antenas WWAN.
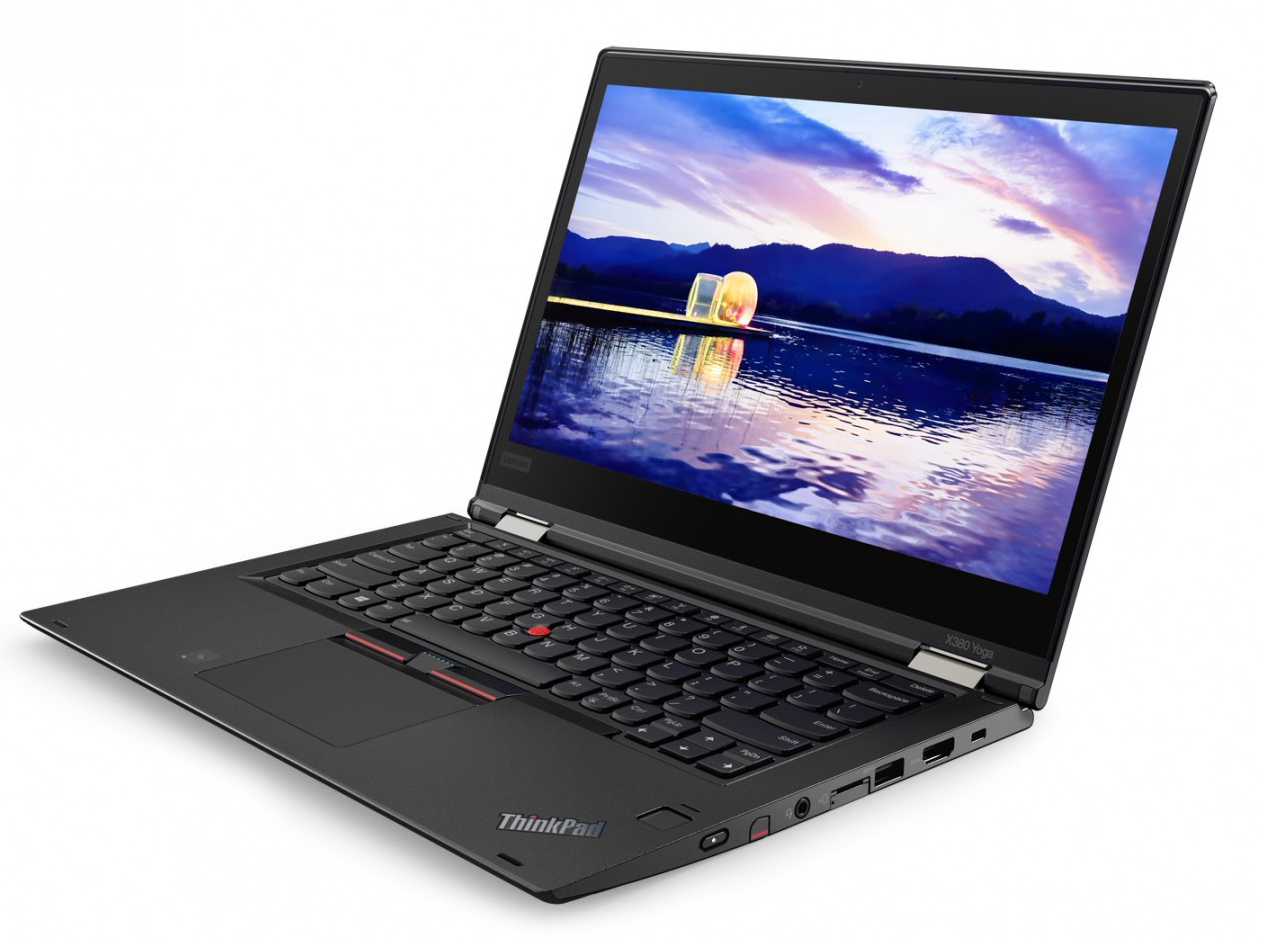
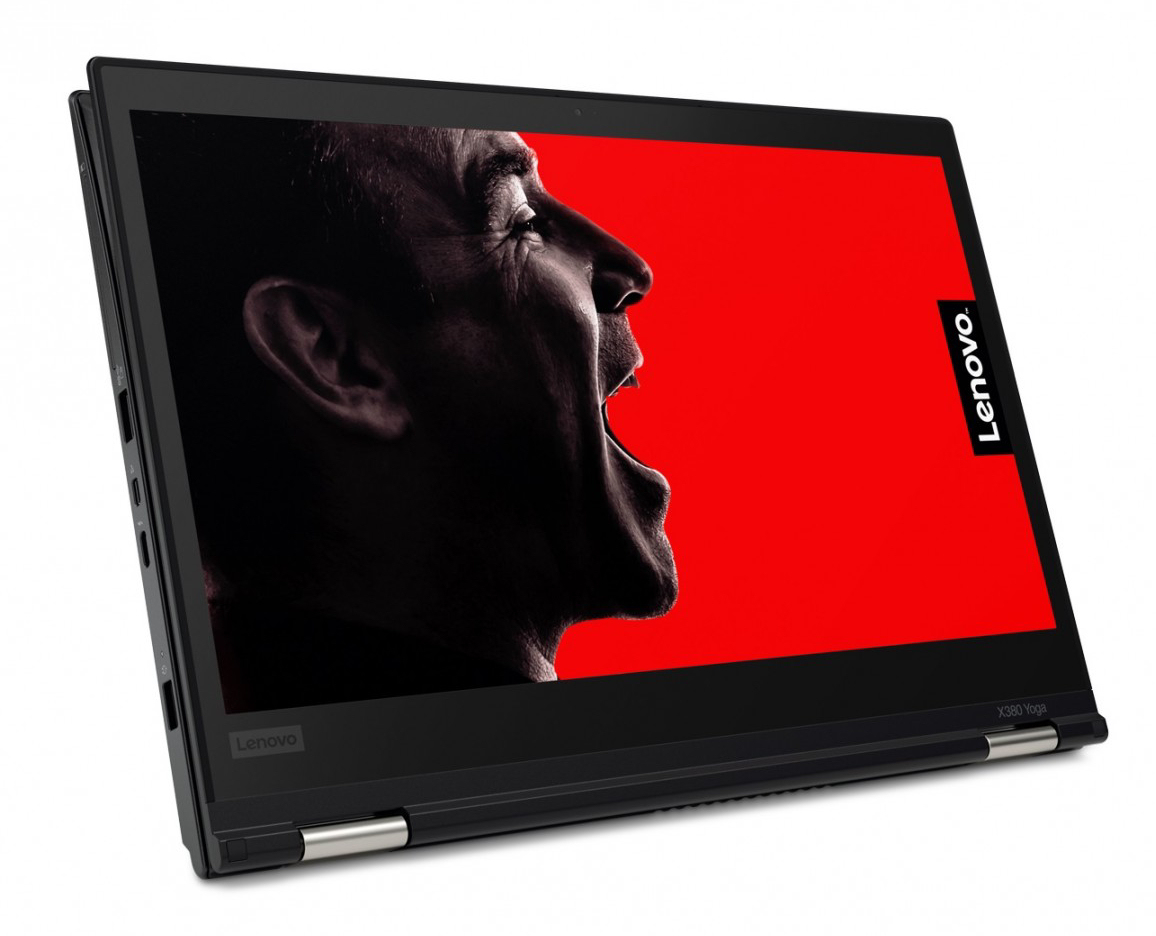
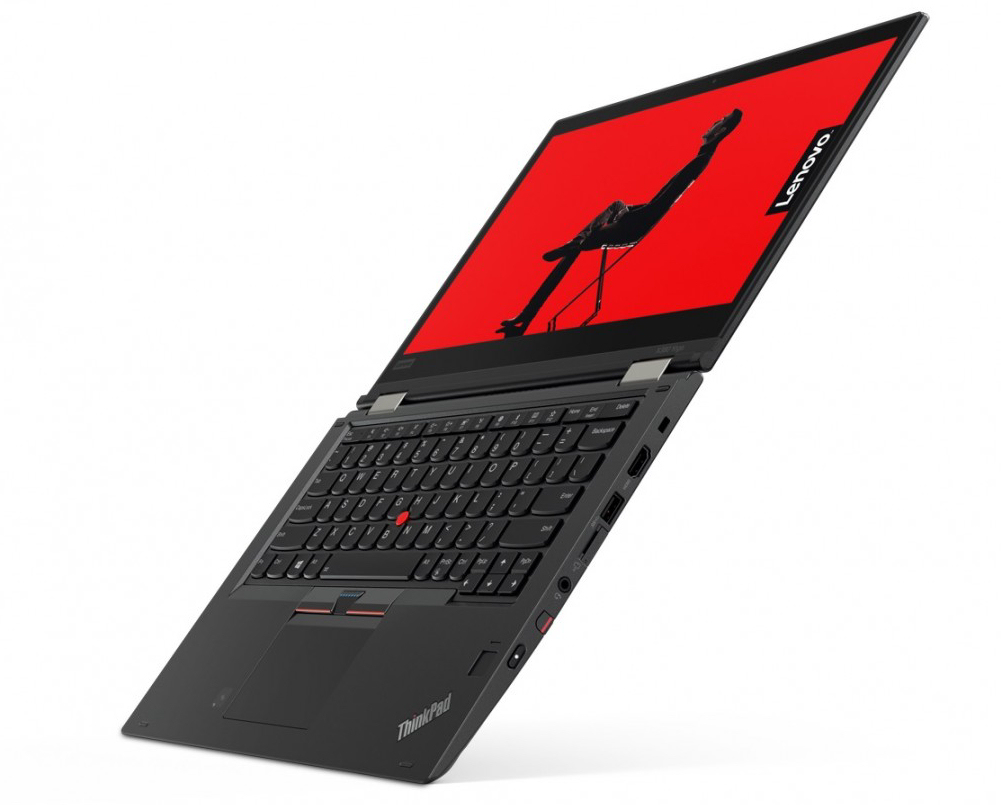
O teclado iluminado deixou uma boa impressão. Não admira: Já conhecemos este teclado do ThinkPad Yoga 370. Além disso, precisamos mencionar a boa duração da bateria. A tela táctil baseada em IPS oferece ótimos ângulos de visão, bom contraste e alto brilho. No entanto, não esperamos ver a cintilação PWM em um dispositivo com esse preço.
A Lenovo deve realmente repensar sua política de garantia de um ano. É óbvio que os compradores atacadistas negociam seus próprios termos de suporte. Mas este fato não serve para os compradores varejistas. Os modelos do ThinkPad X380 Yoga vendidos em lojas de varejo ou online deveriam ter, no mínimo, uma garantia de três anos. O preço do conversível e os propósitos que a Lenovo alega que o dispositivo deve atender demandam tal garantia.
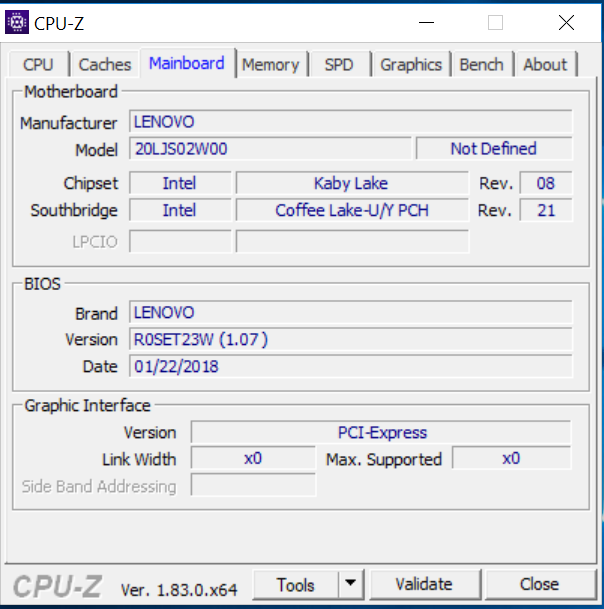
Lenovo ThinkPad X380 Yoga 20LJS02W00
- 03/09/2018 v6 (old)
Sascha Mölck