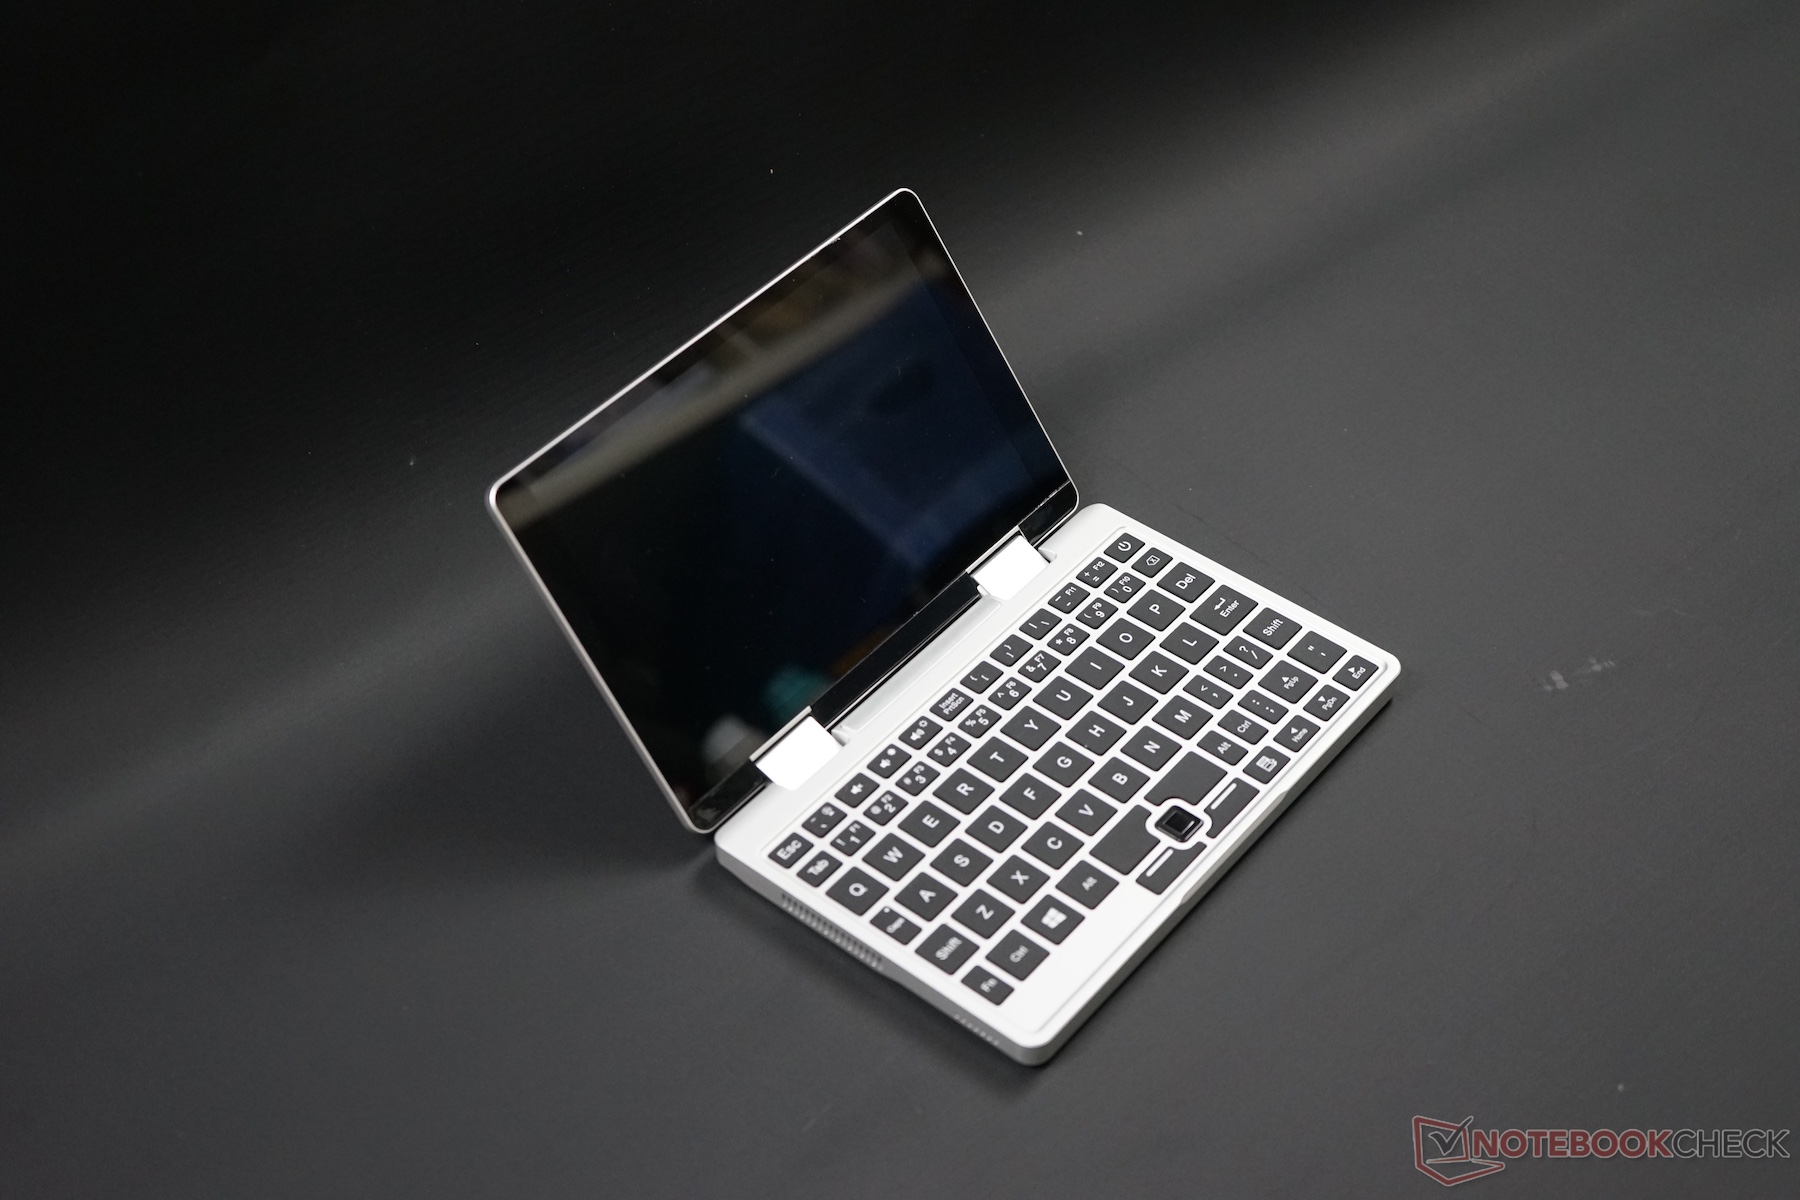
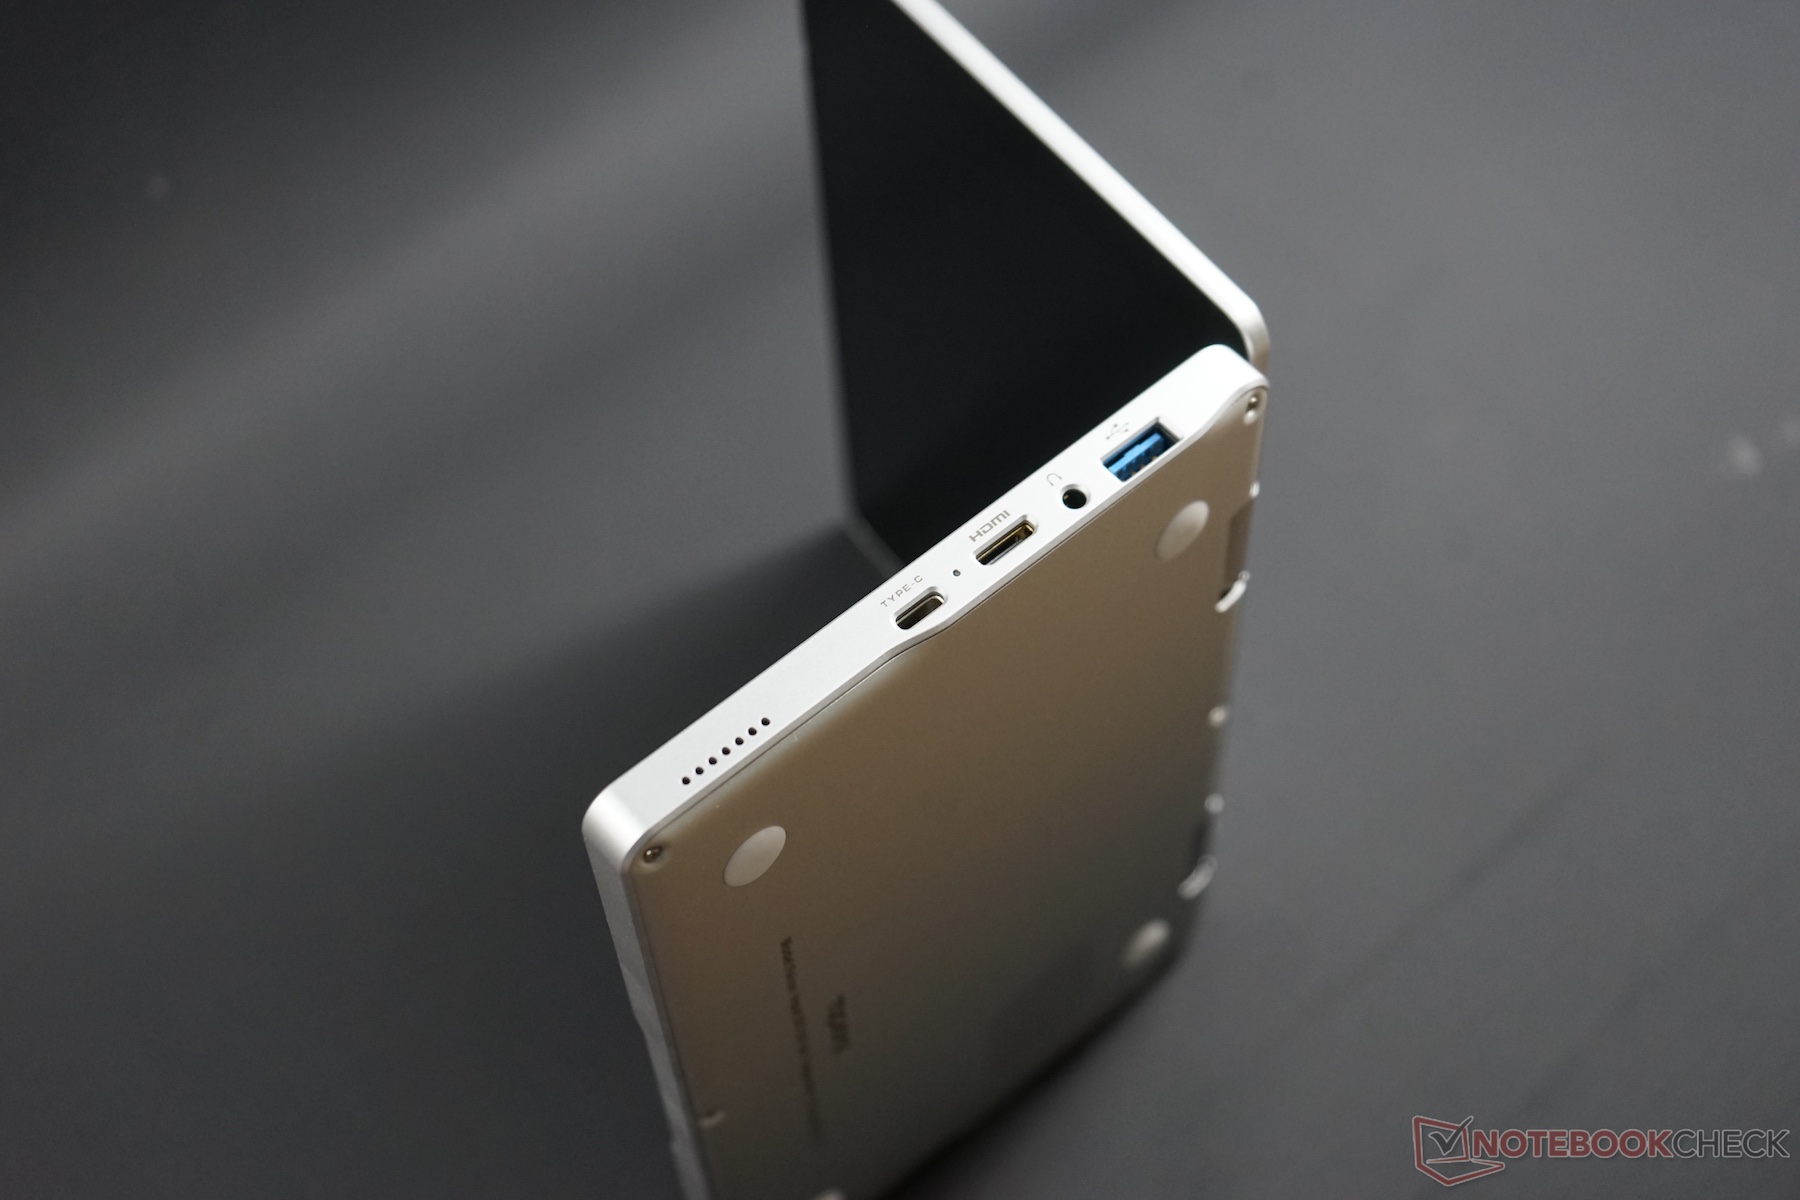
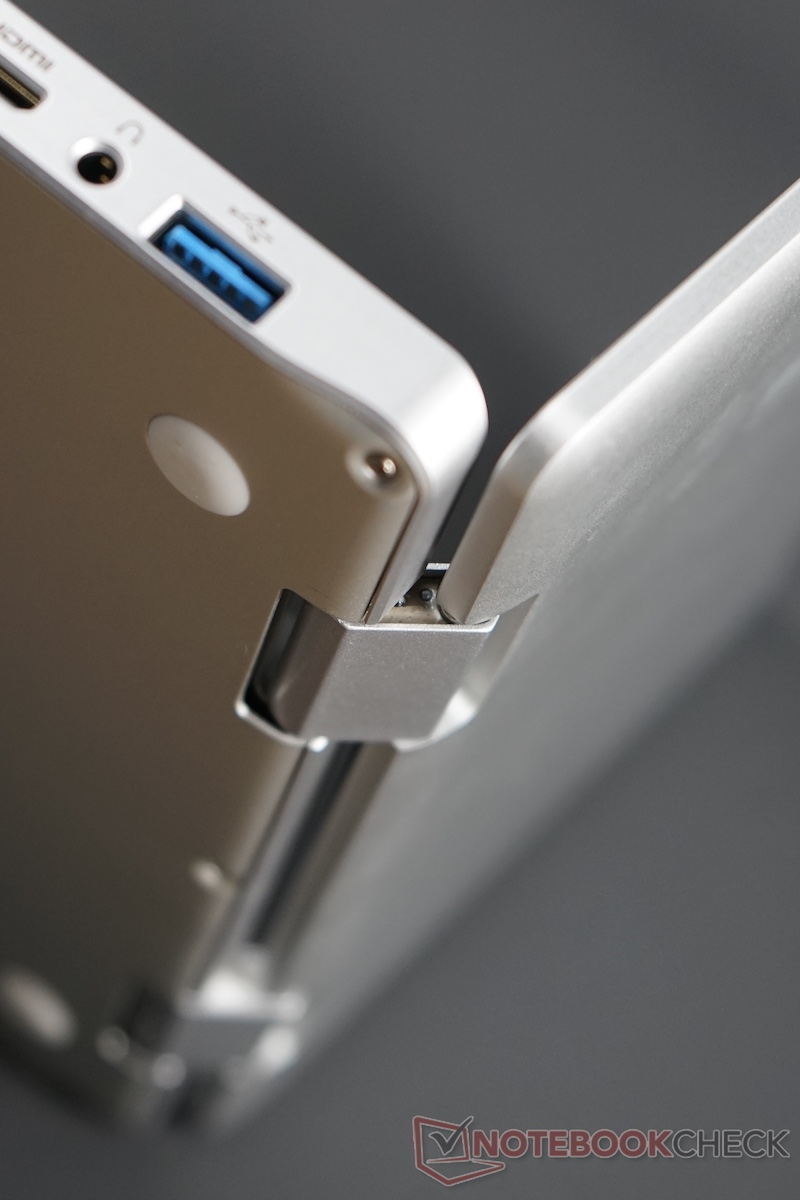
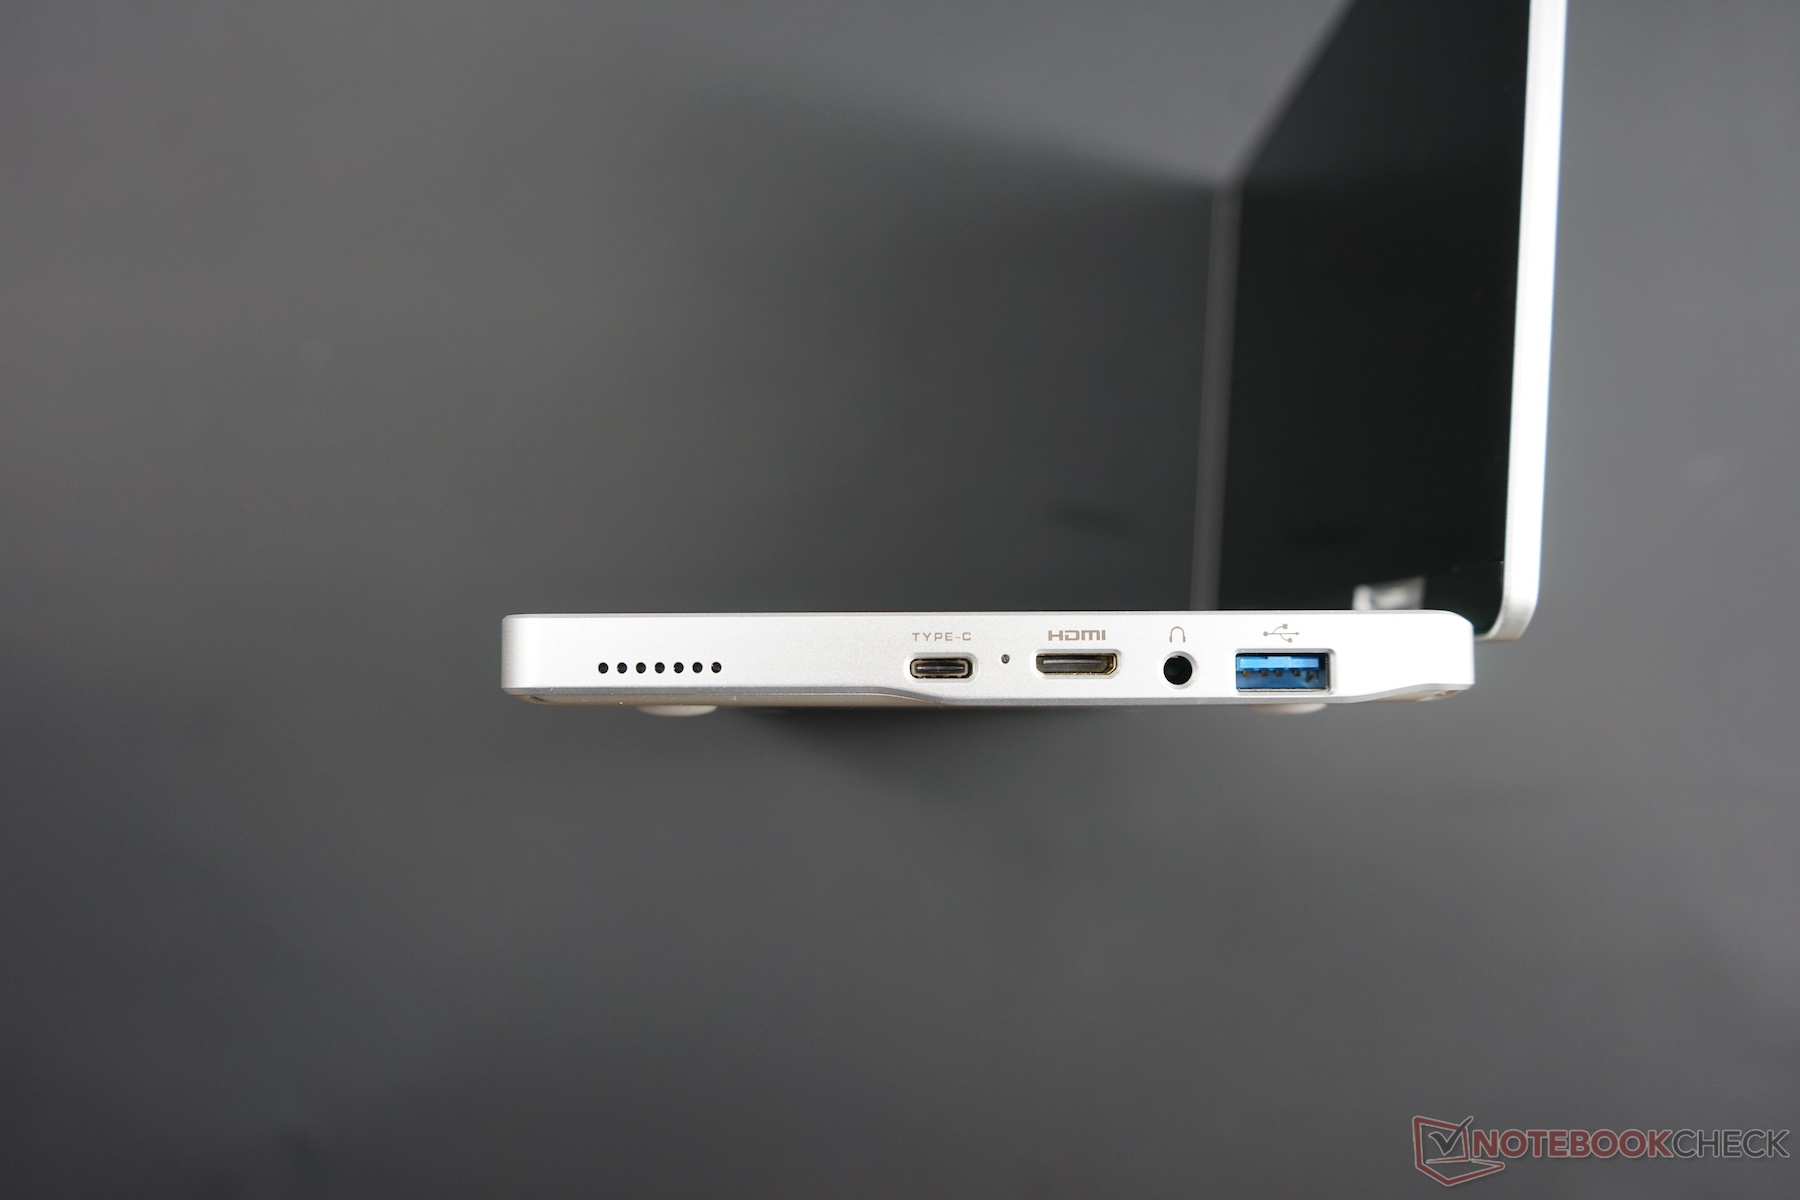
Breve Análise do Conversível Topjoy Falcon (Modelo de Pré Produção)
| |||||||||||||||||||||||||
iluminação: 88 %
iluminação com acumulador: 266 cd/m²
Contraste: 782:1 (Preto: 0.34 cd/m²)
ΔE ColorChecker Calman: 3.6 | ∀{0.5-29.43 Ø4.71}
calibrated: 2.7
ΔE Greyscale Calman: 3.6 | ∀{0.09-98 Ø4.96}
Gamma: 2.19
CCT: 6442 K
| Topjoy Falcon AUO17D8, , 1920x1200, 8" | Toshiba Satellite Click Mini L9W-B-102 PVO, , 1920x1200, 8.9" | Microsoft Surface Go MHN-00003 Sharp SHP14A6, , 1800x1200, 10" | Chuwi LapBook SE 1920x1080, 13.3" | |
|---|---|---|---|---|
| Display | ||||
| Display P3 Coverage (%) | 42.94 | 66.5 | 65 | |
| sRGB Coverage (%) | 64.4 | 97.5 | 94.8 | |
| AdobeRGB 1998 Coverage (%) | 44.4 | 67.5 | 66.5 | |
| Response Times | 3% | 6% | ||
| Response Time Grey 50% / Grey 80% * (ms) | 37 ? | 44 ? -19% | 39.2 ? -6% | |
| Response Time Black / White * (ms) | 33.6 ? | 25.6 ? 24% | 27.7 ? 18% | |
| PWM Frequency (Hz) | 200 ? | 1020 ? | 200 ? | |
| Screen | -22% | 53% | -36% | |
| Brightness middle (cd/m²) | 266 | 207 -22% | 456 71% | 227 -15% |
| Brightness (cd/m²) | 269 | 205 -24% | 426 58% | 210 -22% |
| Brightness Distribution (%) | 88 | 89 1% | 88 0% | 89 1% |
| Black Level * (cd/m²) | 0.34 | 0.14 59% | 0.31 9% | 0.44 -29% |
| Contrast (:1) | 782 | 1479 89% | 1471 88% | 516 -34% |
| Colorchecker dE 2000 * | 3.6 | 7.98 -122% | 1.3 64% | 6.6 -83% |
| Colorchecker dE 2000 max. * | 8.2 | 3 63% | 12.2 -49% | |
| Colorchecker dE 2000 calibrated * | 2.7 | 1.1 59% | 1.9 30% | |
| Greyscale dE 2000 * | 3.6 | 8.36 -132% | 1.4 61% | 7.9 -119% |
| Gamma | 2.19 100% | 2.21 100% | 2.24 98% | 2.16 102% |
| CCT | 6442 101% | 7768 84% | 6687 97% | 8879 73% |
| Color Space (Percent of AdobeRGB 1998) (%) | 41 | 62.3 | ||
| Color Space (Percent of sRGB) (%) | 64 | 96.8 | ||
| Média Total (Programa/Configurações) | -22% /
-22% | 28% /
43% | -15% /
-28% |
* ... menor é melhor
Exibir tempos de resposta
| ↔ Tempo de resposta preto para branco | ||
|---|---|---|
| 33.6 ms ... ascensão ↗ e queda ↘ combinadas | ↗ 20 ms ascensão | 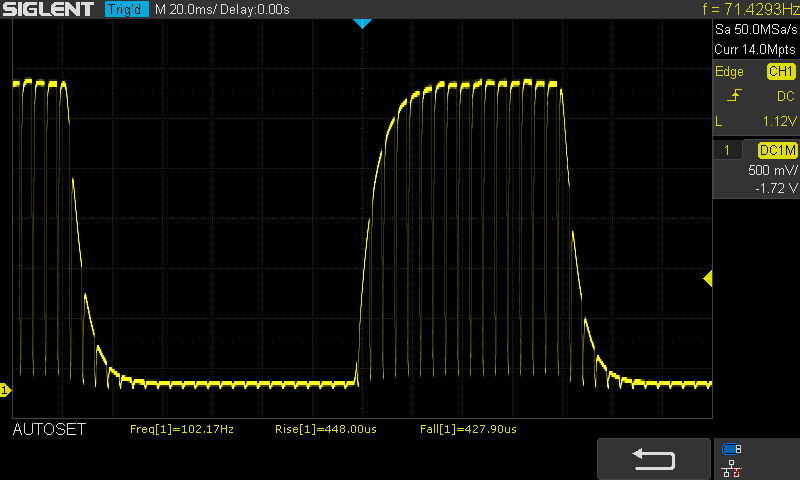 |
| ↘ 13.6 ms queda | ||
| A tela mostra taxas de resposta lentas em nossos testes e será insatisfatória para os jogadores. Em comparação, todos os dispositivos testados variam de 0.1 (mínimo) a 240 (máximo) ms. » 90 % de todos os dispositivos são melhores. Isso significa que o tempo de resposta medido é pior que a média de todos os dispositivos testados (19.8 ms). | ||
| ↔ Tempo de resposta 50% cinza a 80% cinza | ||
| 37 ms ... ascensão ↗ e queda ↘ combinadas | ↗ 17 ms ascensão | 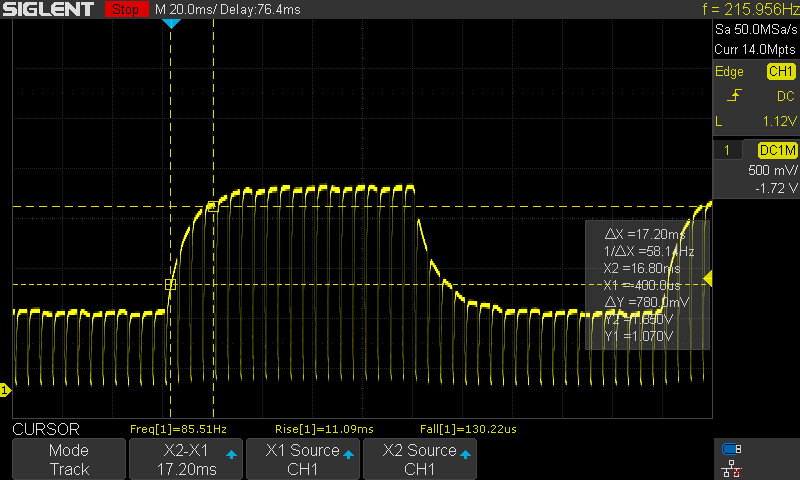 |
| ↘ 20 ms queda | ||
| A tela mostra taxas de resposta lentas em nossos testes e será insatisfatória para os jogadores. Em comparação, todos os dispositivos testados variam de 0.165 (mínimo) a 636 (máximo) ms. » 53 % de todos os dispositivos são melhores. Isso significa que o tempo de resposta medido é pior que a média de todos os dispositivos testados (30.9 ms). | ||
Cintilação da tela / PWM (modulação por largura de pulso)
| Tela tremeluzindo/PWM detectado | 200 Hz | ≤ 100 % configuração de brilho | 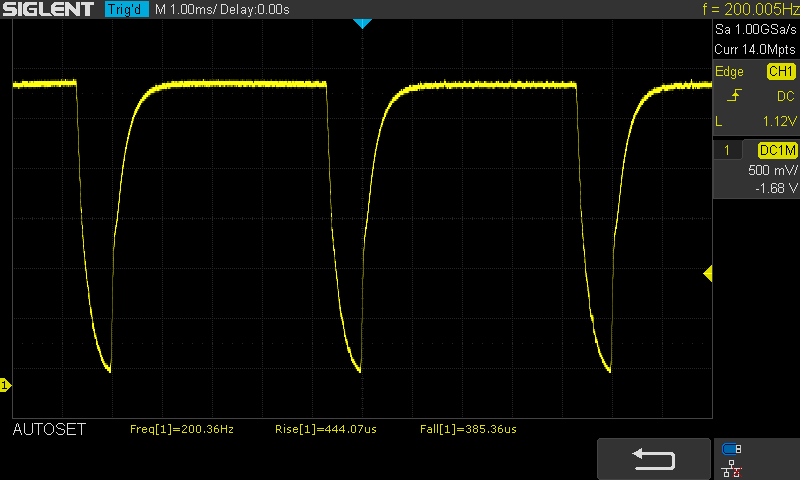 |
| ≤ 266 brilho cd/m² | |||
A luz de fundo da tela pisca em 200 Hz (pior caso, por exemplo, utilizando PWM) Cintilação detectada em uma configuração de brilho de 100 % (266 cd/m²) e abaixo. Não deve haver cintilação ou PWM acima desta configuração de brilho. A frequência de 200 Hz é relativamente baixa, portanto, usuários sensíveis provavelmente notarão cintilação e sentirão fadiga ocular na configuração de brilho indicada e abaixo. A cintilação ocorre mesmo com configurações de brilho alto e pode afetar o usuário durante o uso diário. [pwm_comparison] Em comparação: 52 % de todos os dispositivos testados não usam PWM para escurecer a tela. Se PWM foi detectado, uma média de 7741 (mínimo: 5 - máximo: 343500) Hz foi medida. | |||
| Cinebench R15 | |
| CPU Single 64Bit | |
| Média da turma Convertible (149.8 - 317, n=48, últimos 2 anos) | |
| Eve-Tech Eve V m3 | |
| Apple MacBook 12 (Early 2016) 1.1 GHz | |
| Apple MacBook 12 (Early 2016) 1.1 GHz | |
| Topjoy Falcon | |
| Média Intel Pentium Silver N5000 (73 - 80, n=12) | |
| Lenovo Ideapad D330-10IGM | |
| Acer Swift 1 SF114-32-P8GG | |
| Chuwi LapBook SE | |
| Microsoft Surface Go MHN-00003 | |
| Fujitsu Stylistic V535 | |
| CPU Multi 64Bit | |
| Média da turma Convertible (478 - 4940, n=48, últimos 2 anos) | |
| Eve-Tech Eve V m3 | |
| Média Intel Pentium Silver N5000 (210 - 284, n=12) | |
| Lenovo Ideapad D330-10IGM | |
| Acer Swift 1 SF114-32-P8GG | |
| Topjoy Falcon | |
| Apple MacBook 12 (Early 2016) 1.1 GHz | |
| Microsoft Surface Go MHN-00003 | |
| Chuwi LapBook SE | |
| Fujitsu Stylistic V535 | |
| PCMark 8 Home Score Accelerated v2 | 2216 pontos | |
| PCMark 8 Creative Score Accelerated v2 | 2672 pontos | |
| PCMark 8 Work Score Accelerated v2 | 3122 pontos | |
| PCMark 10 Score | 1990 pontos | |
Ajuda | ||
| Topjoy Falcon FORESEE 256GB | Média FORESEE 256GB | |
|---|---|---|
| CrystalDiskMark 3.0 | ||
| Sequential Read (MB/s) | ||
| Sequential Write (MB/s) | ||
| 512K Read (MB/s) | ||
| 512K Write (MB/s) | ||
| 4K Read (MB/s) | ||
| 4K Write (MB/s) | ||
| 4K QD32 Read (MB/s) | ||
| 4K QD32 Write (MB/s) |

| 3DMark 11 - 1280x720 Performance GPU | |
| Média da turma Convertible (1505 - 40732, n=48, últimos 2 anos) | |
| Eve-Tech Eve V m3 | |
| Microsoft Surface Go MHN-00003 | |
| Lenovo Ideapad D330-10IGM | |
| Topjoy Falcon | |
| Média Intel UHD Graphics 605 (588 - 902, n=14) | |
| Lenovo Yoga 330-11IGM | |
| Acer Swift 1 SF114-32-P8GG | |
| Chuwi LapBook SE | |
| 3DMark - 1280x720 Cloud Gate Standard Graphics | |
| Média da turma Convertible (7885 - 57566, n=32, últimos 2 anos) | |
| Eve-Tech Eve V m3 | |
| Microsoft Surface Go MHN-00003 | |
| Topjoy Falcon | |
| Lenovo Ideapad D330-10IGM | |
| Média Intel UHD Graphics 605 (2874 - 4485, n=10) | |
| Lenovo Yoga 330-11IGM | |
| Acer Swift 1 SF114-32-P8GG | |
| Chuwi LapBook SE | |
| 3DMark 06 Standard Score | 4171 pontos | |
| 3DMark 11 Performance | 824 pontos | |
| 3DMark Cloud Gate Standard Score | 3723 pontos | |
Ajuda | ||
| World of Warships - 1366x768 Low Preset AF:Trilinear | |
| HP 15-da0405ng | |
| Acer Aspire 3 A315-41-R7BM | |
| Acer Spin 5 SP513-52N-566U | |
| Lenovo IdeaPad V110-15IKB 80TH001SGE | |
| Acer Aspire 3 A315-21-651Y | |
| Lenovo Ideapad 320-17AST-80XW0013GE | |
| Topjoy Falcon | |
| Média Intel UHD Graphics 605 (22.7 - 24.7, n=2) | |
| Acer Swift 1 SF114-32-P8GG | |
| Lenovo Tablet 10-20L3000KGE | |
| baixo | média | alto | ultra | QHD | 4K | |
|---|---|---|---|---|---|---|
| GTA V (2015) | 11.7 | 9.29 | ||||
| World of Warships (2015) | 24.7 | |||||
| Final Fantasy XV Benchmark (2018) | 5.15 | |||||
| X-Plane 11.11 (2018) | 9.1 | 6 | 5.5 | |||
| World of Tanks enCore (2018) | 53 | 8.9 | ||||
| Dirt Rally 2.0 (2019) | 11 (too slow) | |||||
| Total War: Three Kingdoms (2019) | 6.5 | |||||
| League of Legends (2019) | 49.8 | 39 | 26.6 | 24.9 | 23.6 | 15 |
| F1 2019 (2019) | 8.2 | |||||
| Hearthstone (2020) | 31.1 |
(+) A temperatura máxima no lado superior é 31 °C / 88 F, em comparação com a média de 35.4 °C / 96 F , variando de 19.6 a 60 °C para a classe Convertible.
(+) A parte inferior aquece até um máximo de 33 °C / 91 F, em comparação com a média de 36.9 °C / 98 F
(+) Os apoios para as mãos e o touchpad são mais frios que a temperatura da pele, com um máximo de 30 °C / 86 F e, portanto, são frios ao toque.
(±) A temperatura média da área do apoio para as mãos de dispositivos semelhantes foi 28 °C / 82.4 F (-2 °C / -3.6 F).
Apple MacBook 12 (Early 2016) 1.1 GHz análise de áudio
(+) | os alto-falantes podem tocar relativamente alto (###valor### dB)
Graves 100 - 315Hz
(±) | graves reduzidos - em média 11.3% menor que a mediana
(±) | a linearidade dos graves é média (14.2% delta para a frequência anterior)
Médios 400 - 2.000 Hz
(+) | médios equilibrados - apenas 2.4% longe da mediana
(+) | médios são lineares (5.5% delta para frequência anterior)
Altos 2 - 16 kHz
(+) | agudos equilibrados - apenas 2% longe da mediana
(+) | os máximos são lineares (4.5% delta da frequência anterior)
Geral 100 - 16.000 Hz
(+) | o som geral é linear (10.2% diferença em relação à mediana)
Comparado com a mesma classe
» 7% de todos os dispositivos testados nesta classe foram melhores, 2% semelhantes, 90% piores
» O melhor teve um delta de 5%, a média foi 18%, o pior foi 53%
Comparado com todos os dispositivos testados
» 5% de todos os dispositivos testados foram melhores, 1% semelhantes, 94% piores
» O melhor teve um delta de 4%, a média foi 23%, o pior foi 134%
| desligado | |
| Ocioso | |
| Carga |
|
Key:
min: | |
| Topjoy Falcon Pentium N5000, UHD Graphics 605, FORESEE 256GB, IPS, 1920x1200, 8" | Toshiba Satellite Click Mini L9W-B-102 Z3735F, HD Graphics (Bay Trail), 32 GB eMMC Flash, IPS, 1920x1200, 8.9" | Microsoft Surface Go MHN-00003 Pentium 4415Y, UHD Graphics 615, 64 GB eMMC Flash, IPS, 1800x1200, 10" | Fujitsu Stylistic V535 Z3795, HD Graphics (Bay Trail), 128 GB eMMC Flash, IPS, 1920x1080, 8.3" | Chuwi LapBook SE Celeron N4100, UHD Graphics 600, SanDisk DF4032, , 1920x1080, 13.3" | Média Intel UHD Graphics 605 | Média da turma Convertible | |
|---|---|---|---|---|---|---|---|
| Power Consumption | 11% | -50% | -51% | -47% | -26% | -192% | |
| Idle Minimum * (Watt) | 2.5 | 1.8 28% | 2.88 -15% | 4.9 -96% | 2.7 -8% | 2.8 ? -12% | 4.28 ? -71% |
| Idle Average * (Watt) | 4 | 3.2 20% | 4.8 -20% | 7.4 -85% | 6.3 -58% | 5.01 ? -25% | 6.96 ? -74% |
| Idle Maximum * (Watt) | 4.1 | 4.4 -7% | 7.5 -83% | 7.5 -83% | 7.6 -85% | 5.65 ? -38% | 8.67 ? -111% |
| Load Average * (Watt) | 8.1 | 10.8 -33% | 16.9 -109% | 11.8 -46% | 12.6 -56% | 13.3 ? -64% | 45.1 ? -457% |
| Load Maximum * (Watt) | 19.6 | 10.6 46% | 23.8 -21% | 8.9 55% | 24.6 -26% | 17.5 ? 11% | 67.7 ? -245% |
* ... menor é melhor
| Topjoy Falcon Pentium N5000, UHD Graphics 605, 22 Wh | Toshiba Satellite Click Mini L9W-B-102 Z3735F, HD Graphics (Bay Trail), 39 Wh | Apple MacBook 12 2017 m3-7Y32, HD Graphics 615, 41.4 Wh | Microsoft Surface Go MHN-00003 Pentium 4415Y, UHD Graphics 615, 28 Wh | Fujitsu Stylistic V535 Z3795, HD Graphics (Bay Trail), 17.7 Wh | Chuwi LapBook SE Celeron N4100, UHD Graphics 600, 37 Wh | Lenovo Ideapad D330-10IGM Pentium N5000, UHD Graphics 605, 39 Wh | Acer Swift 1 SF114-32-P8GG Pentium N5000, UHD Graphics 605, 53.9 Wh | Eve-Tech Eve V m3 m3-7Y30, HD Graphics 615, 48 Wh | Média da turma Convertible | |
|---|---|---|---|---|---|---|---|---|---|---|
| Duração da bateria | 79% | 61% | 34% | -25% | 32% | 104% | 120% | 114% | ||
| WiFi v1.3 (h) | 5.6 | 10 79% | 9 61% | 7.5 34% | 4.2 -25% | 7.4 32% | 11.4 104% | 12.3 120% | 12 ? 114% | |
| Reader / Idle (h) | 17.8 | 12.9 | 26.7 ? | |||||||
| Load (h) | 4.2 | 3 | 5.8 | 1.713 ? | ||||||
| H.264 (h) | 6.4 | 9.4 | 10.1 | 15 ? |
Pro
Contra
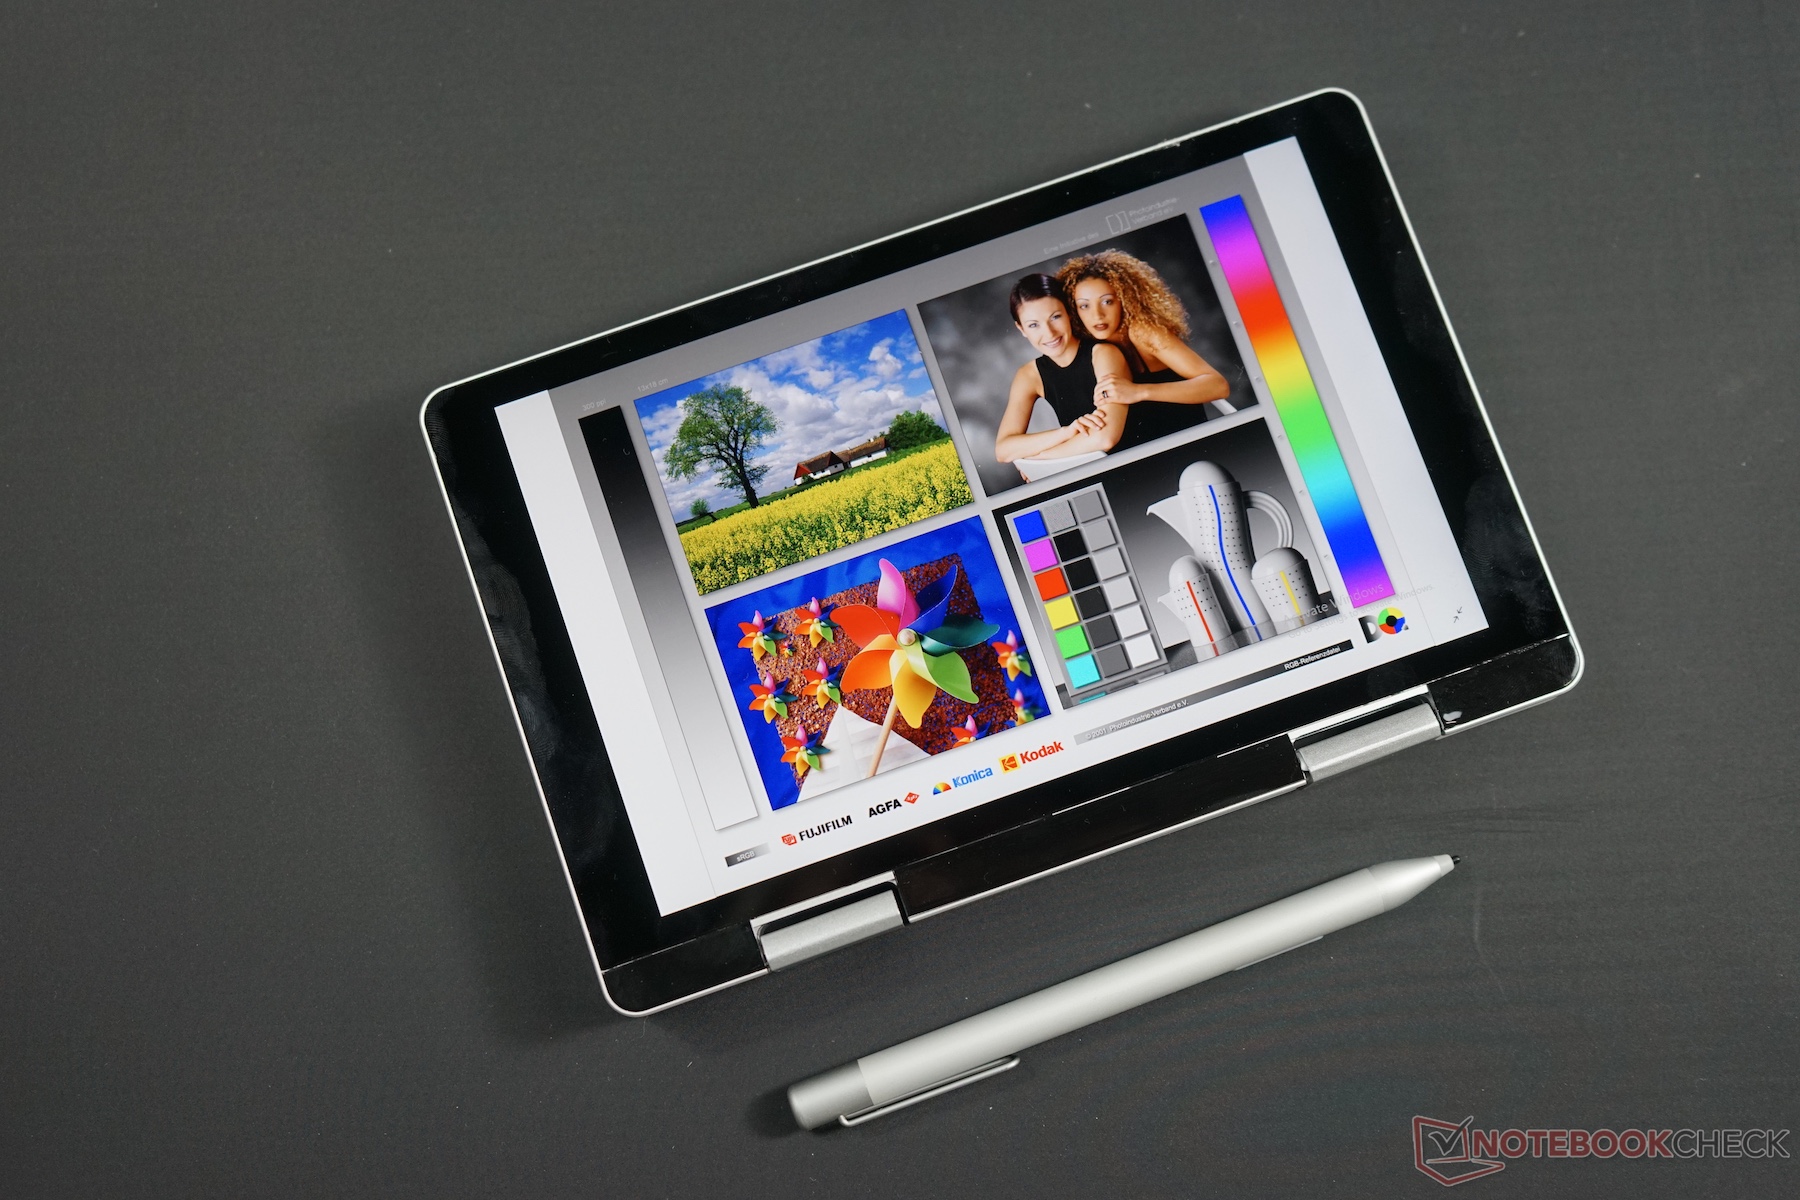
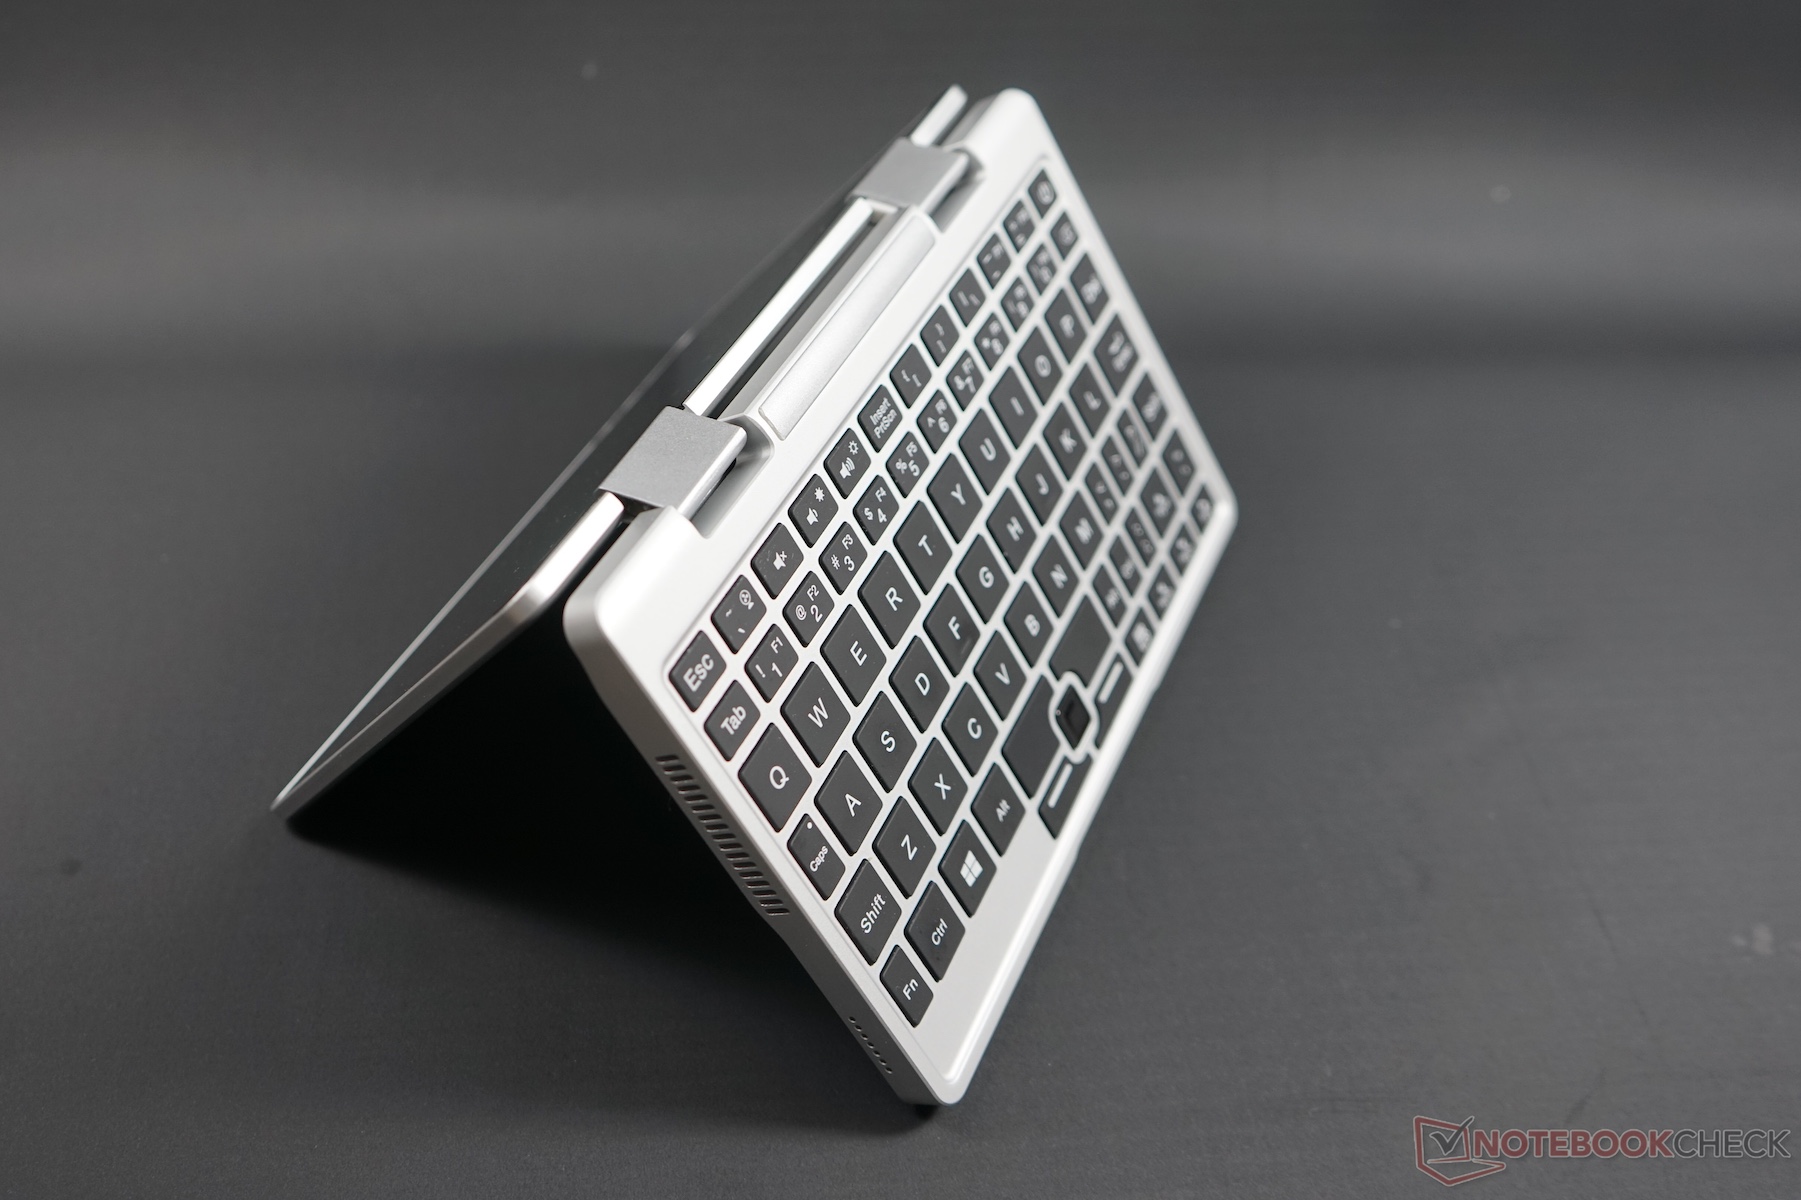
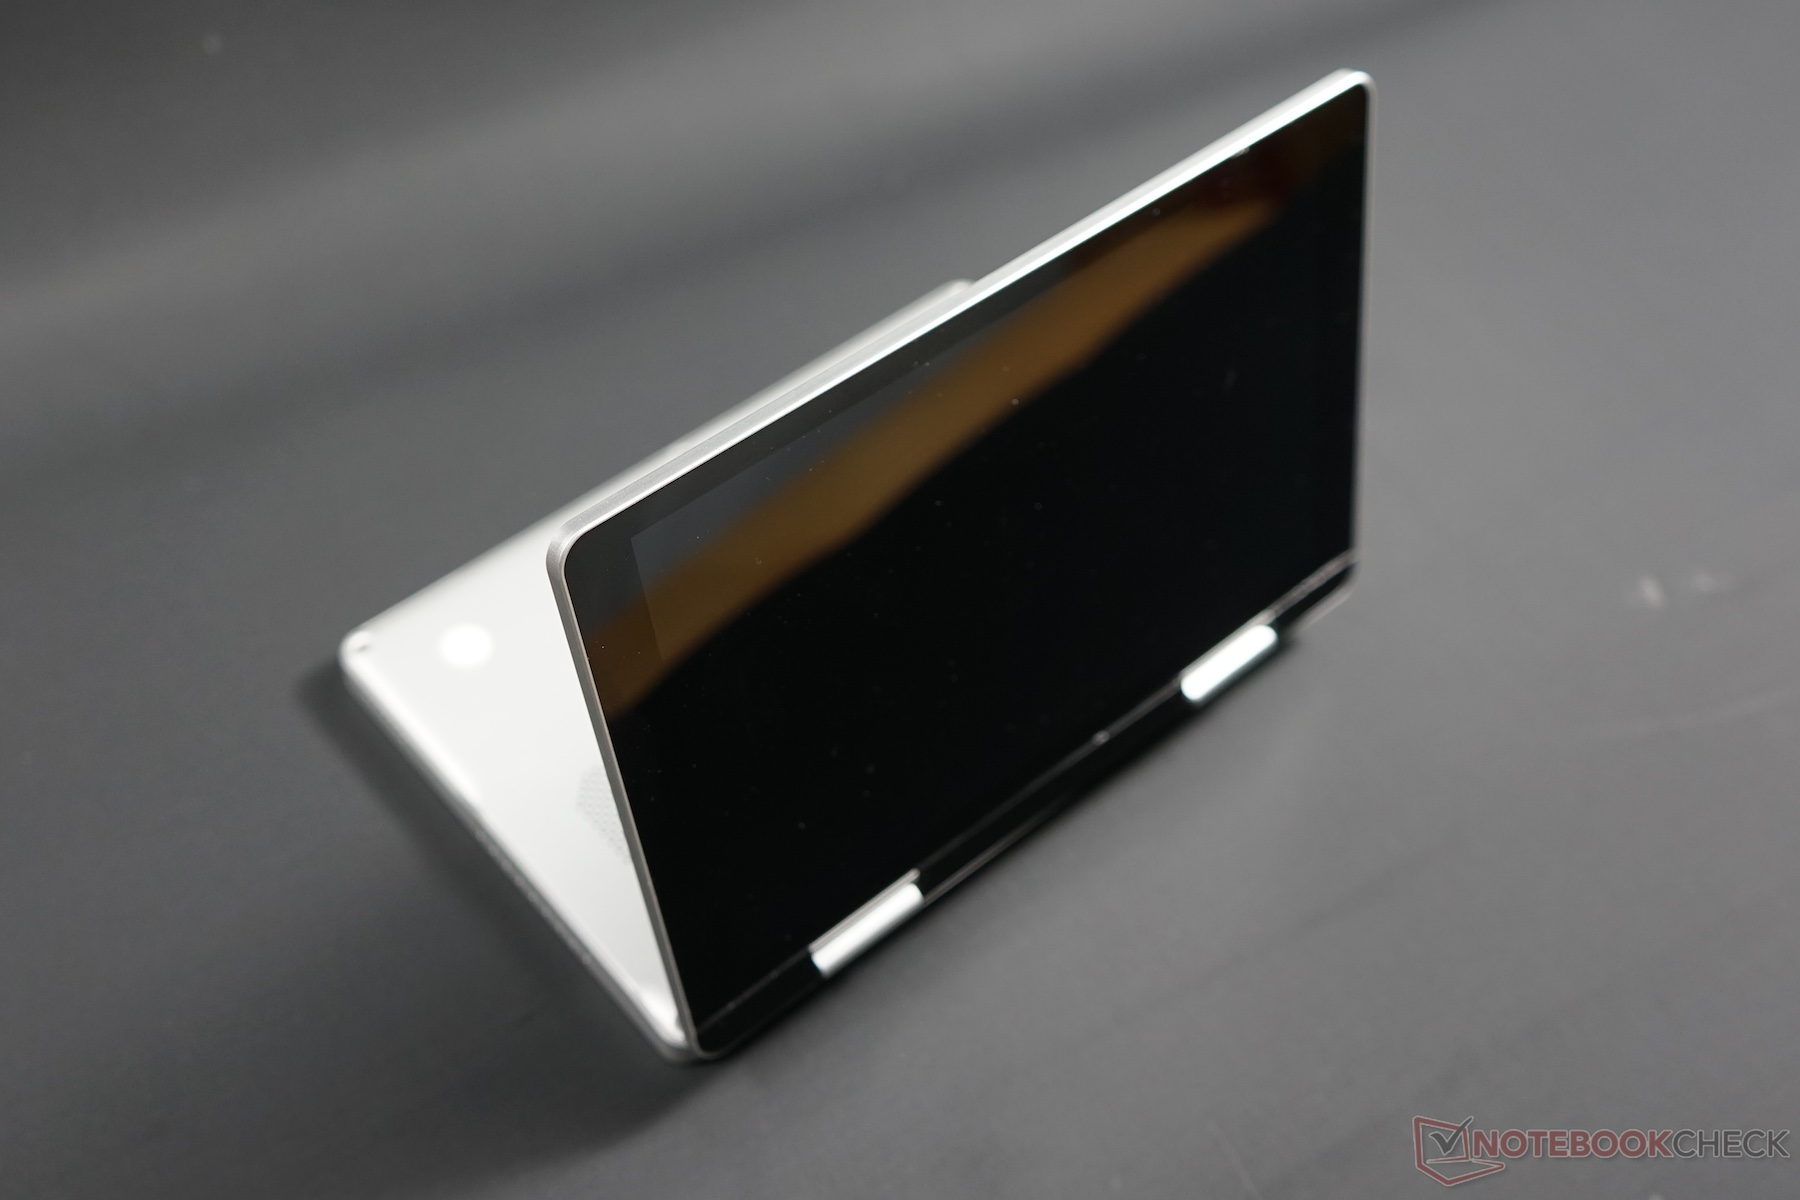
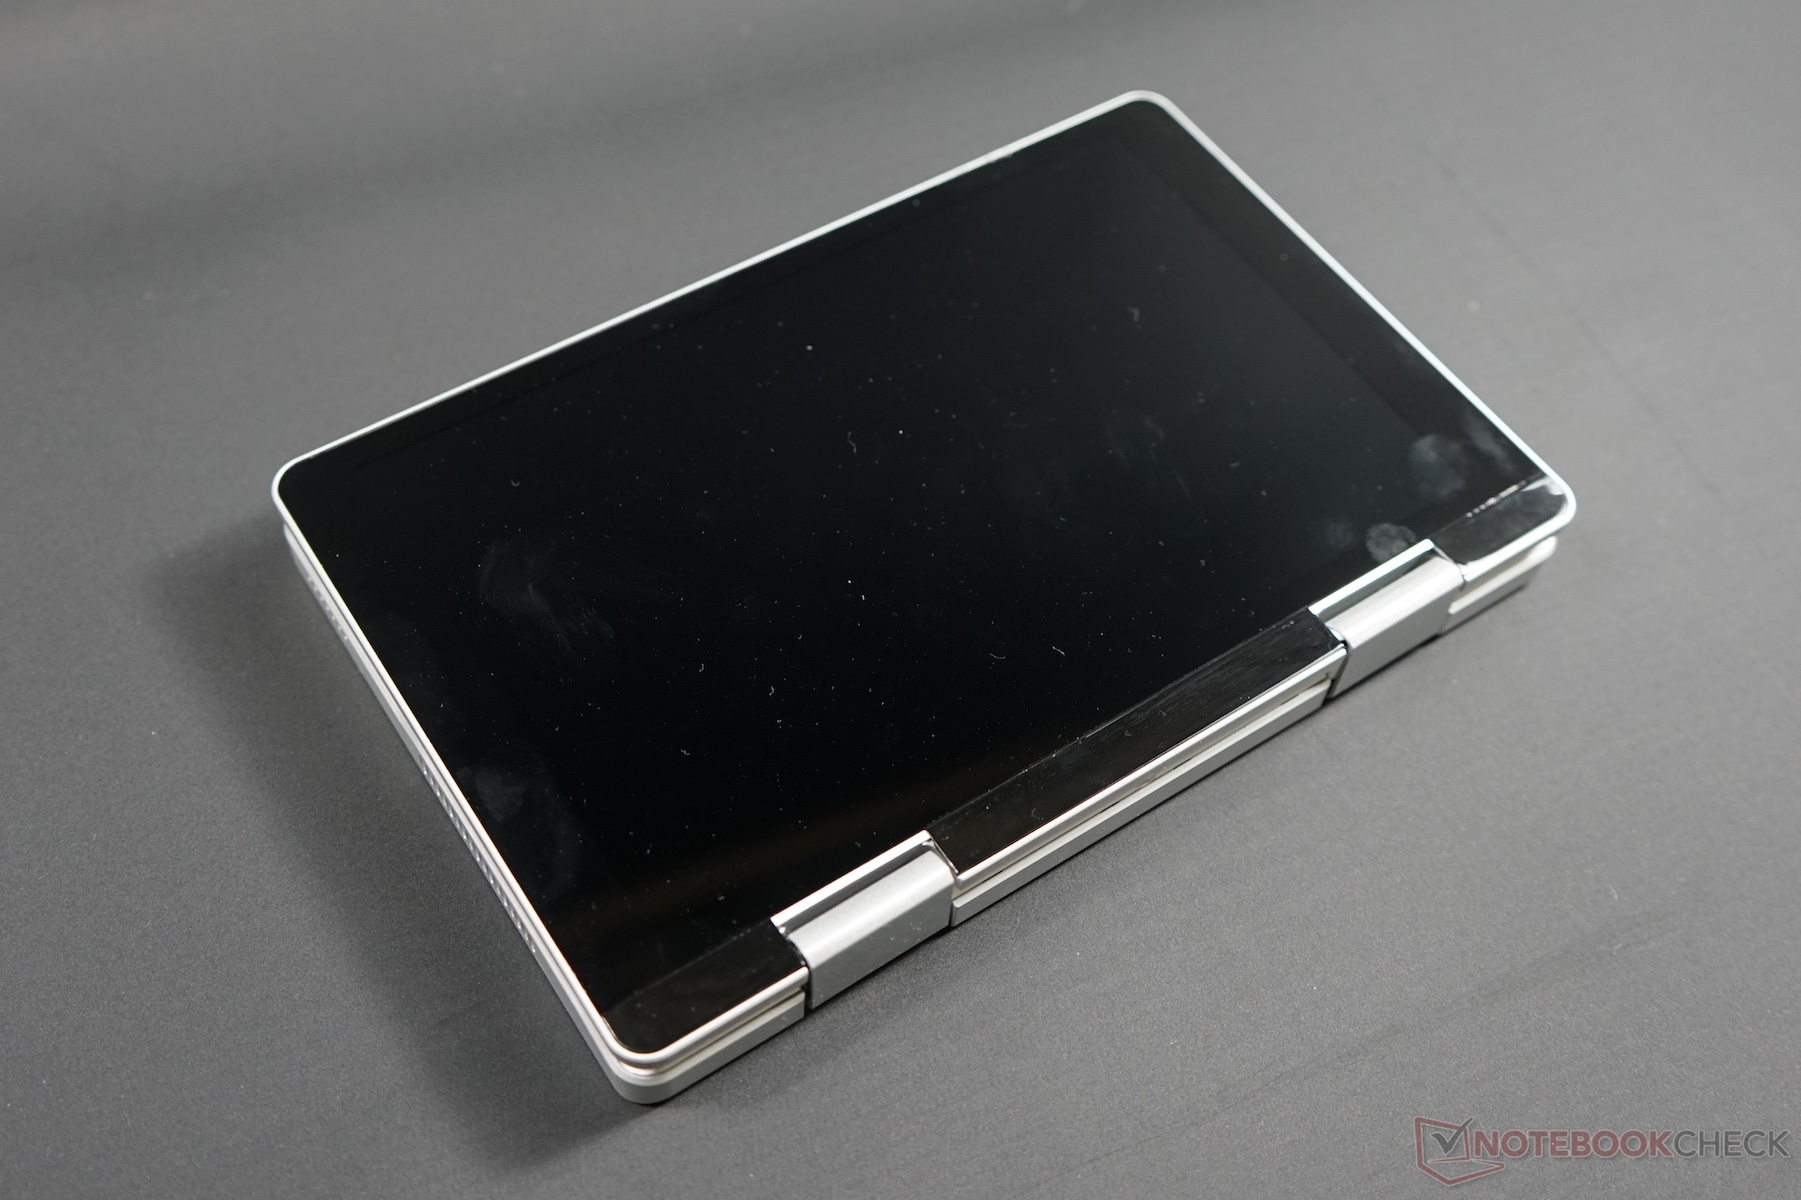
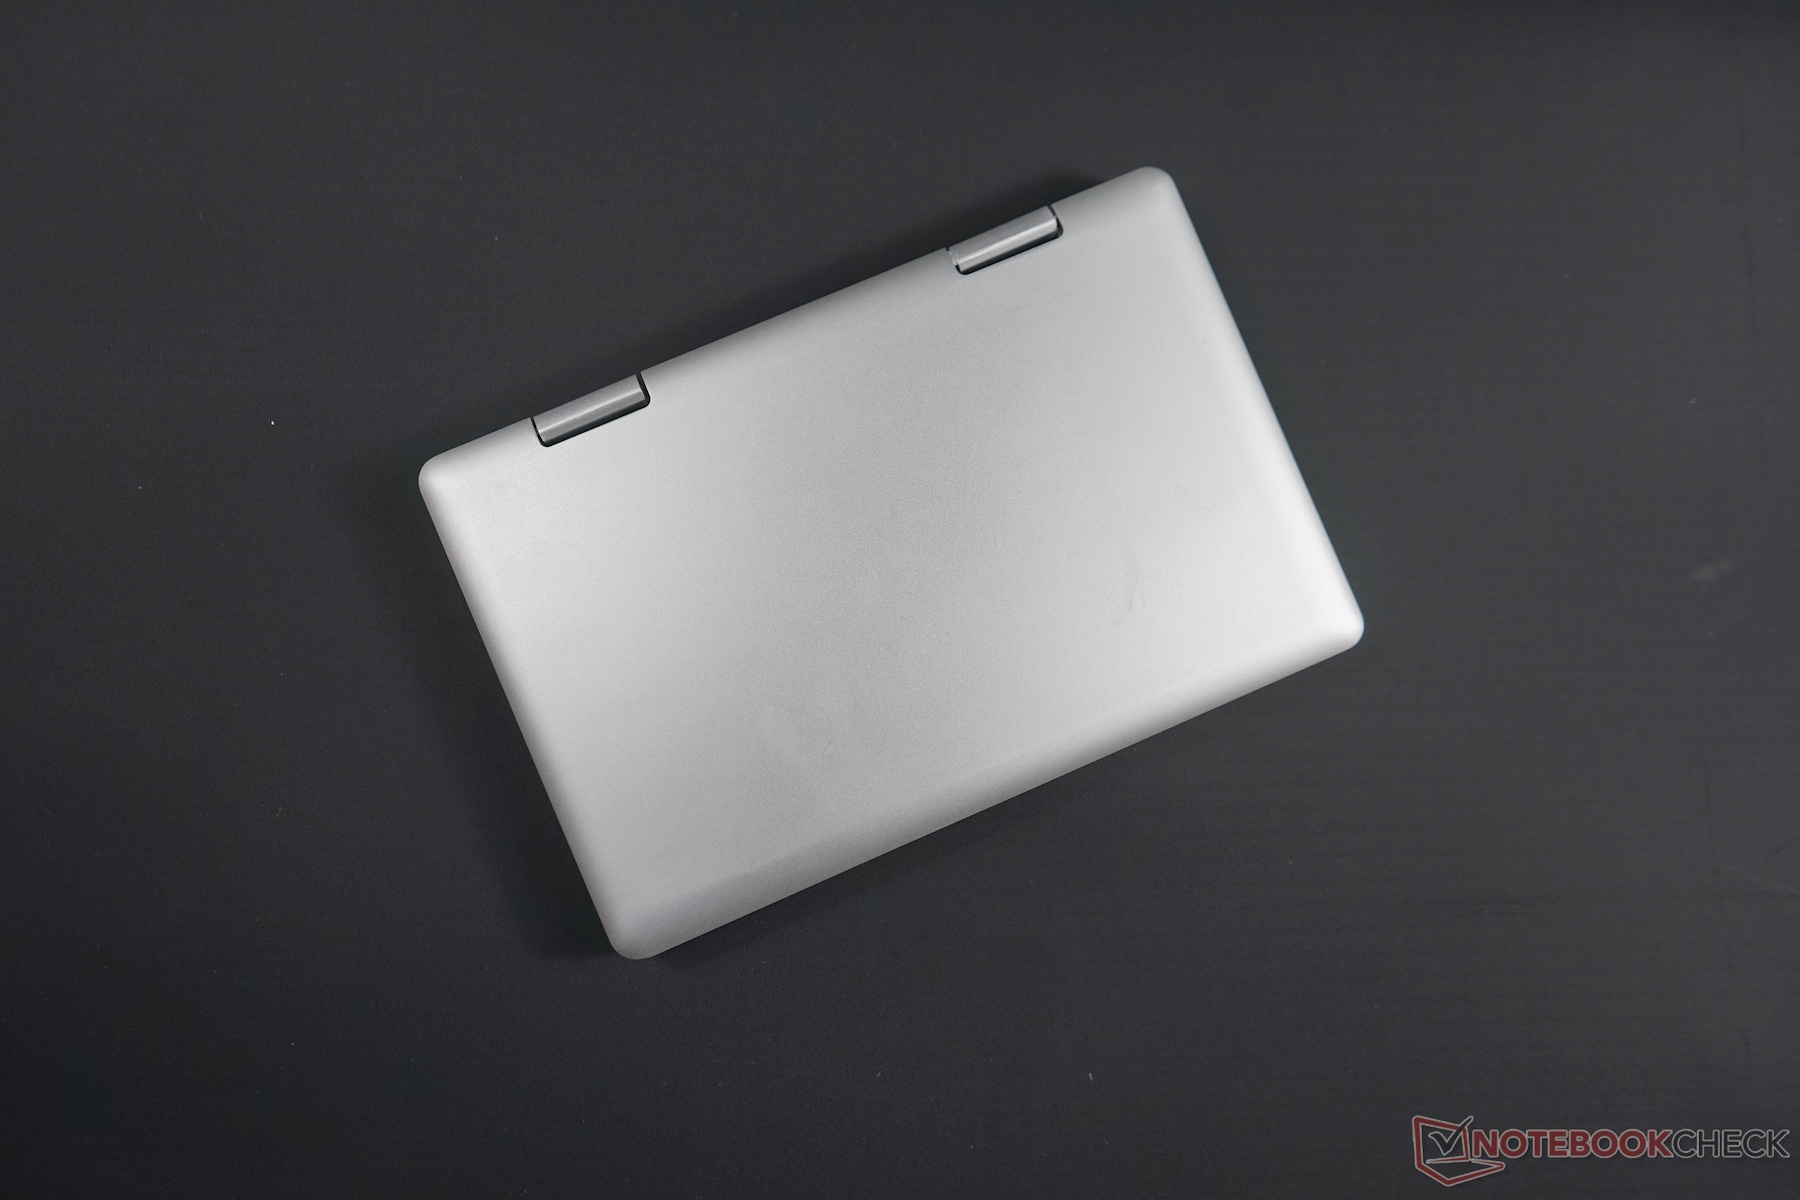
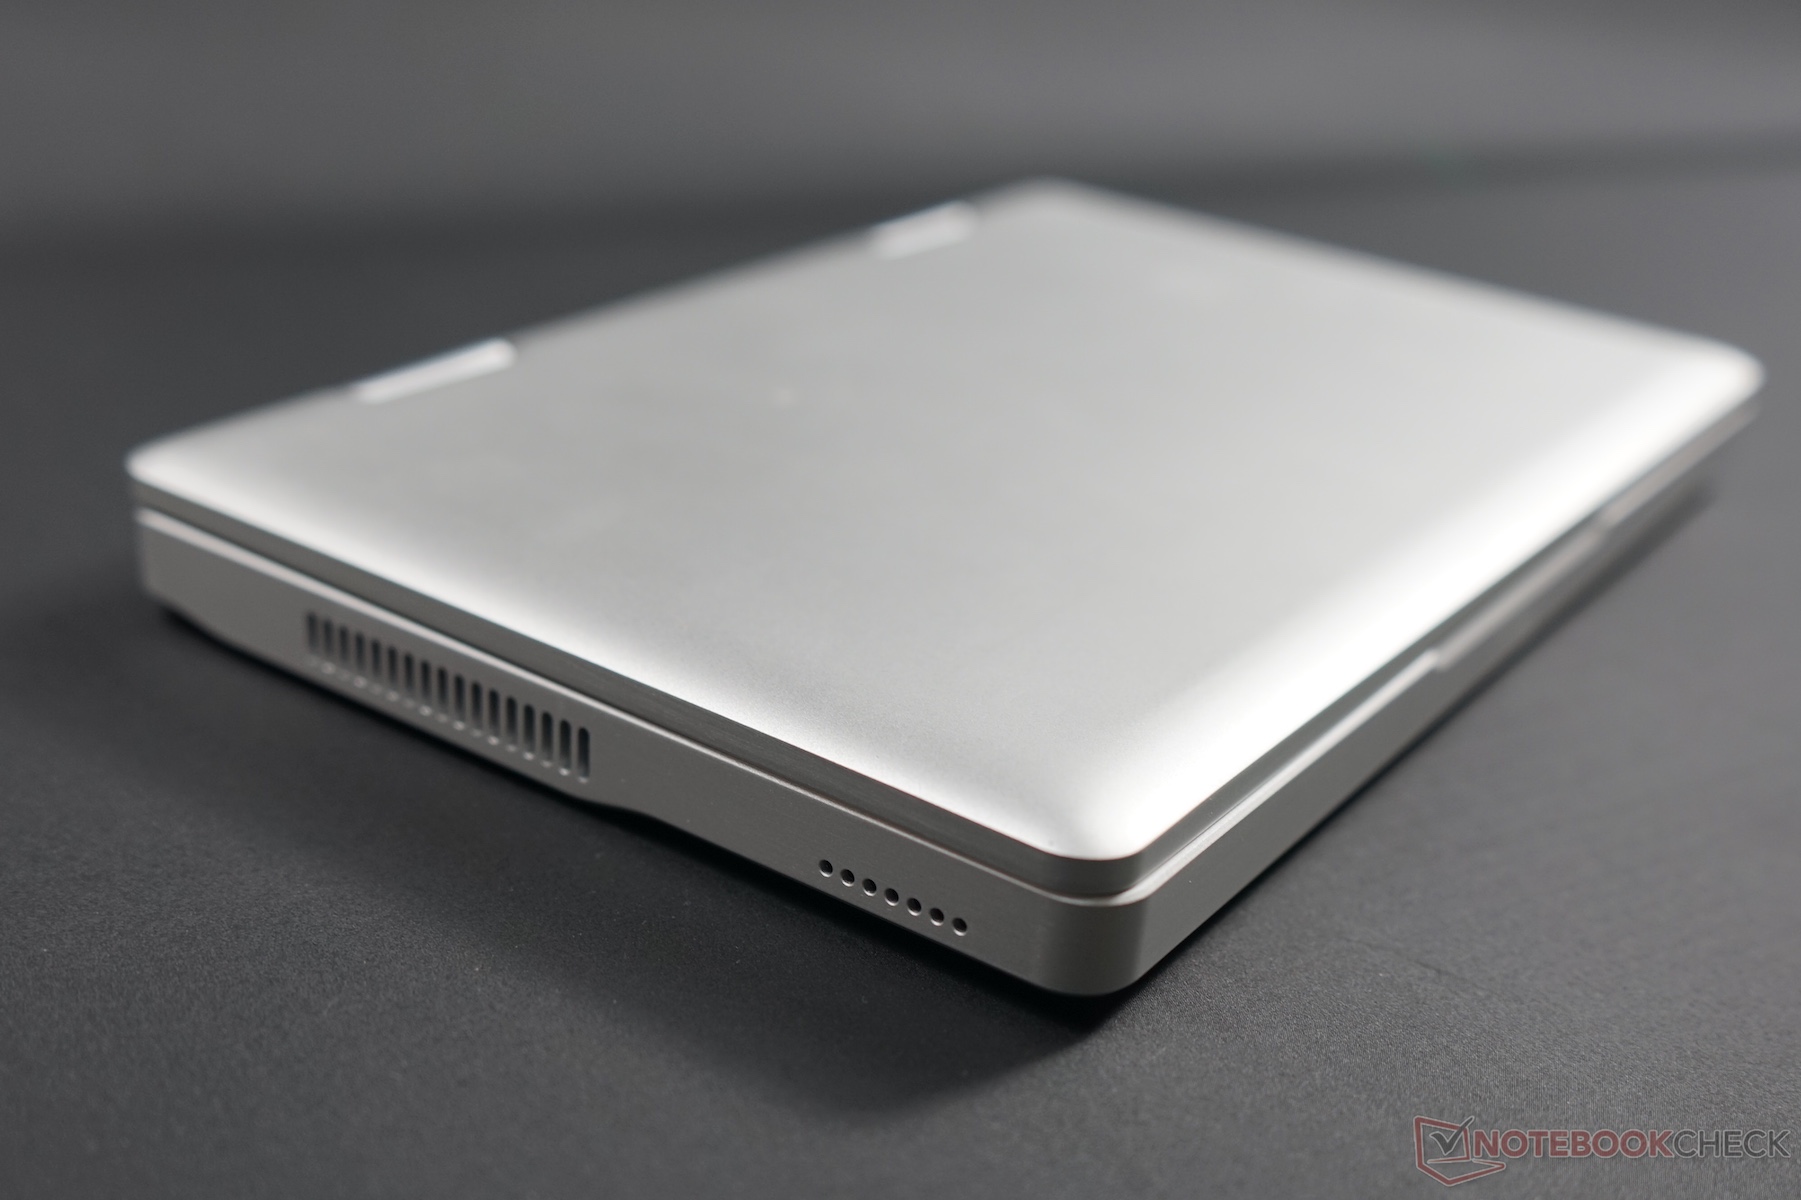
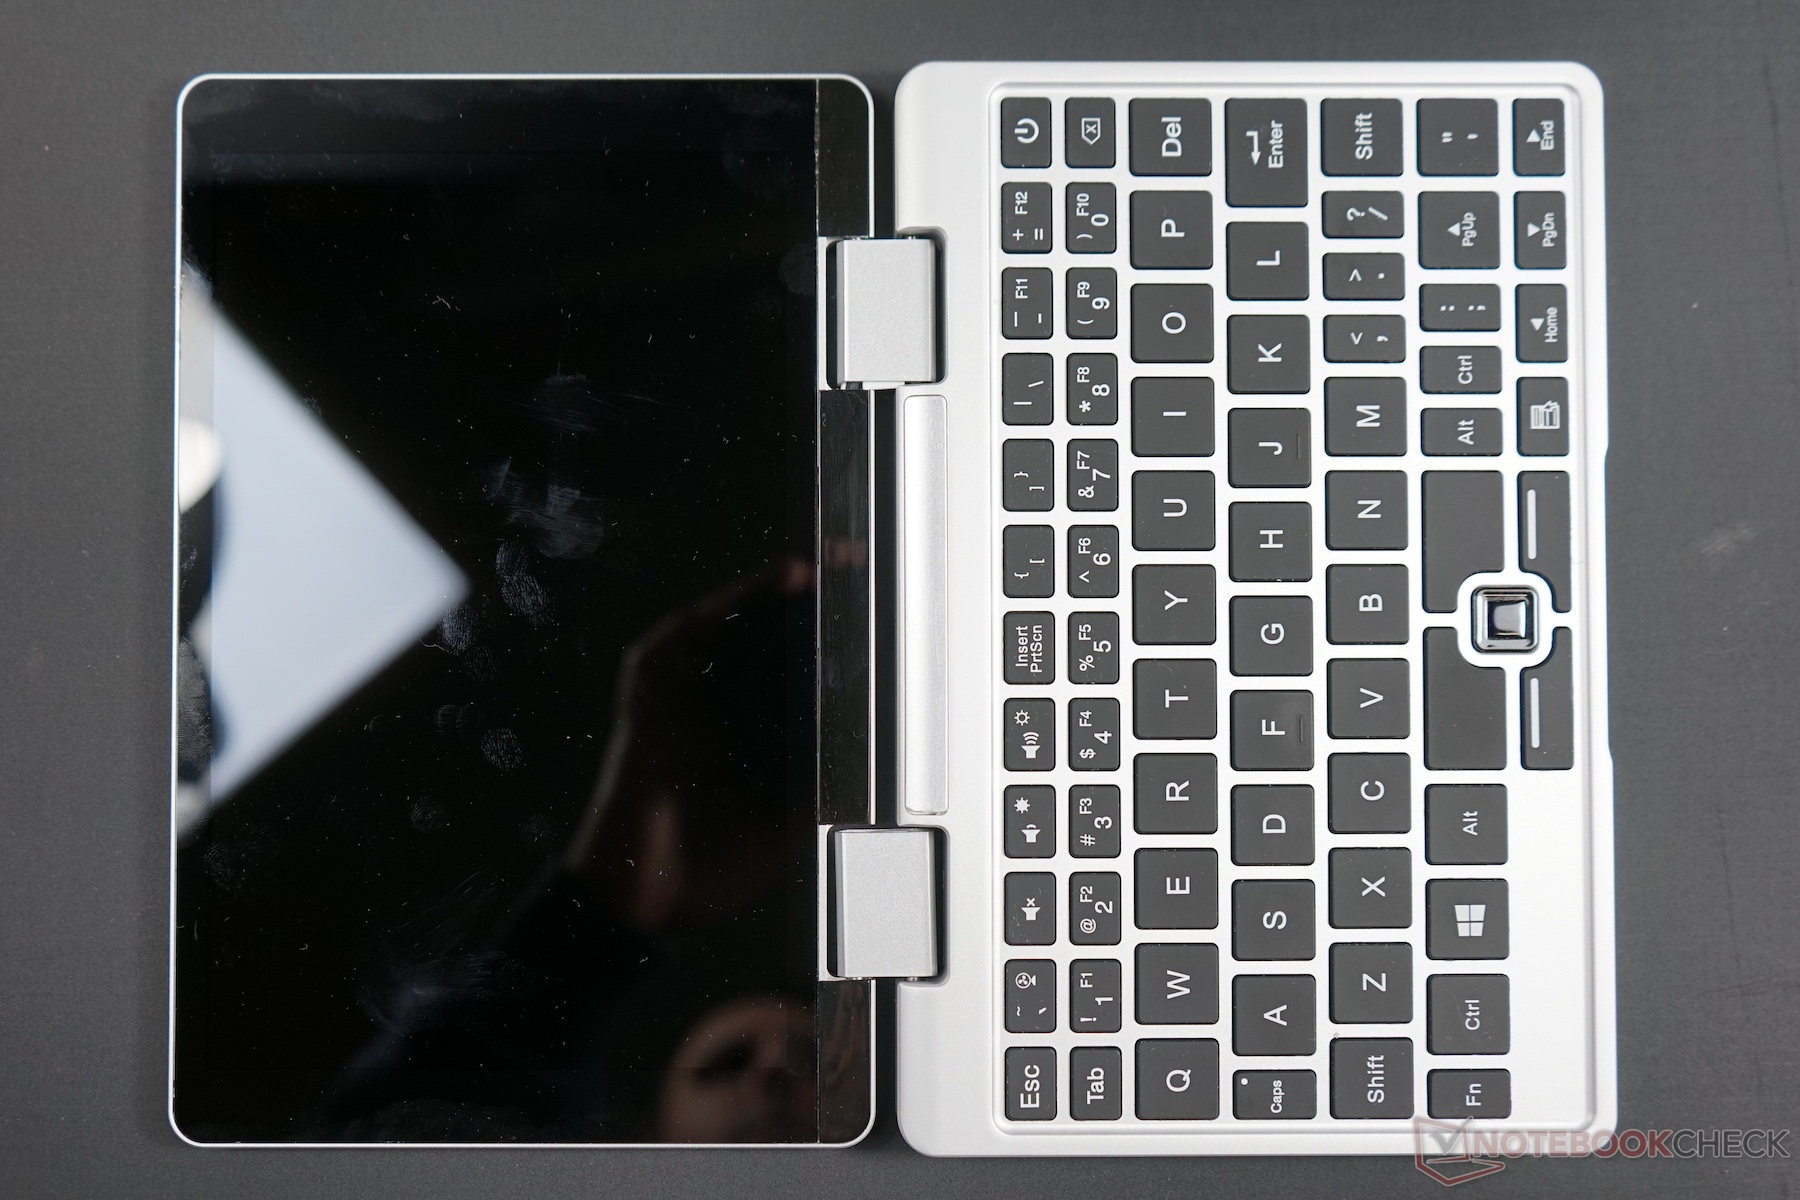
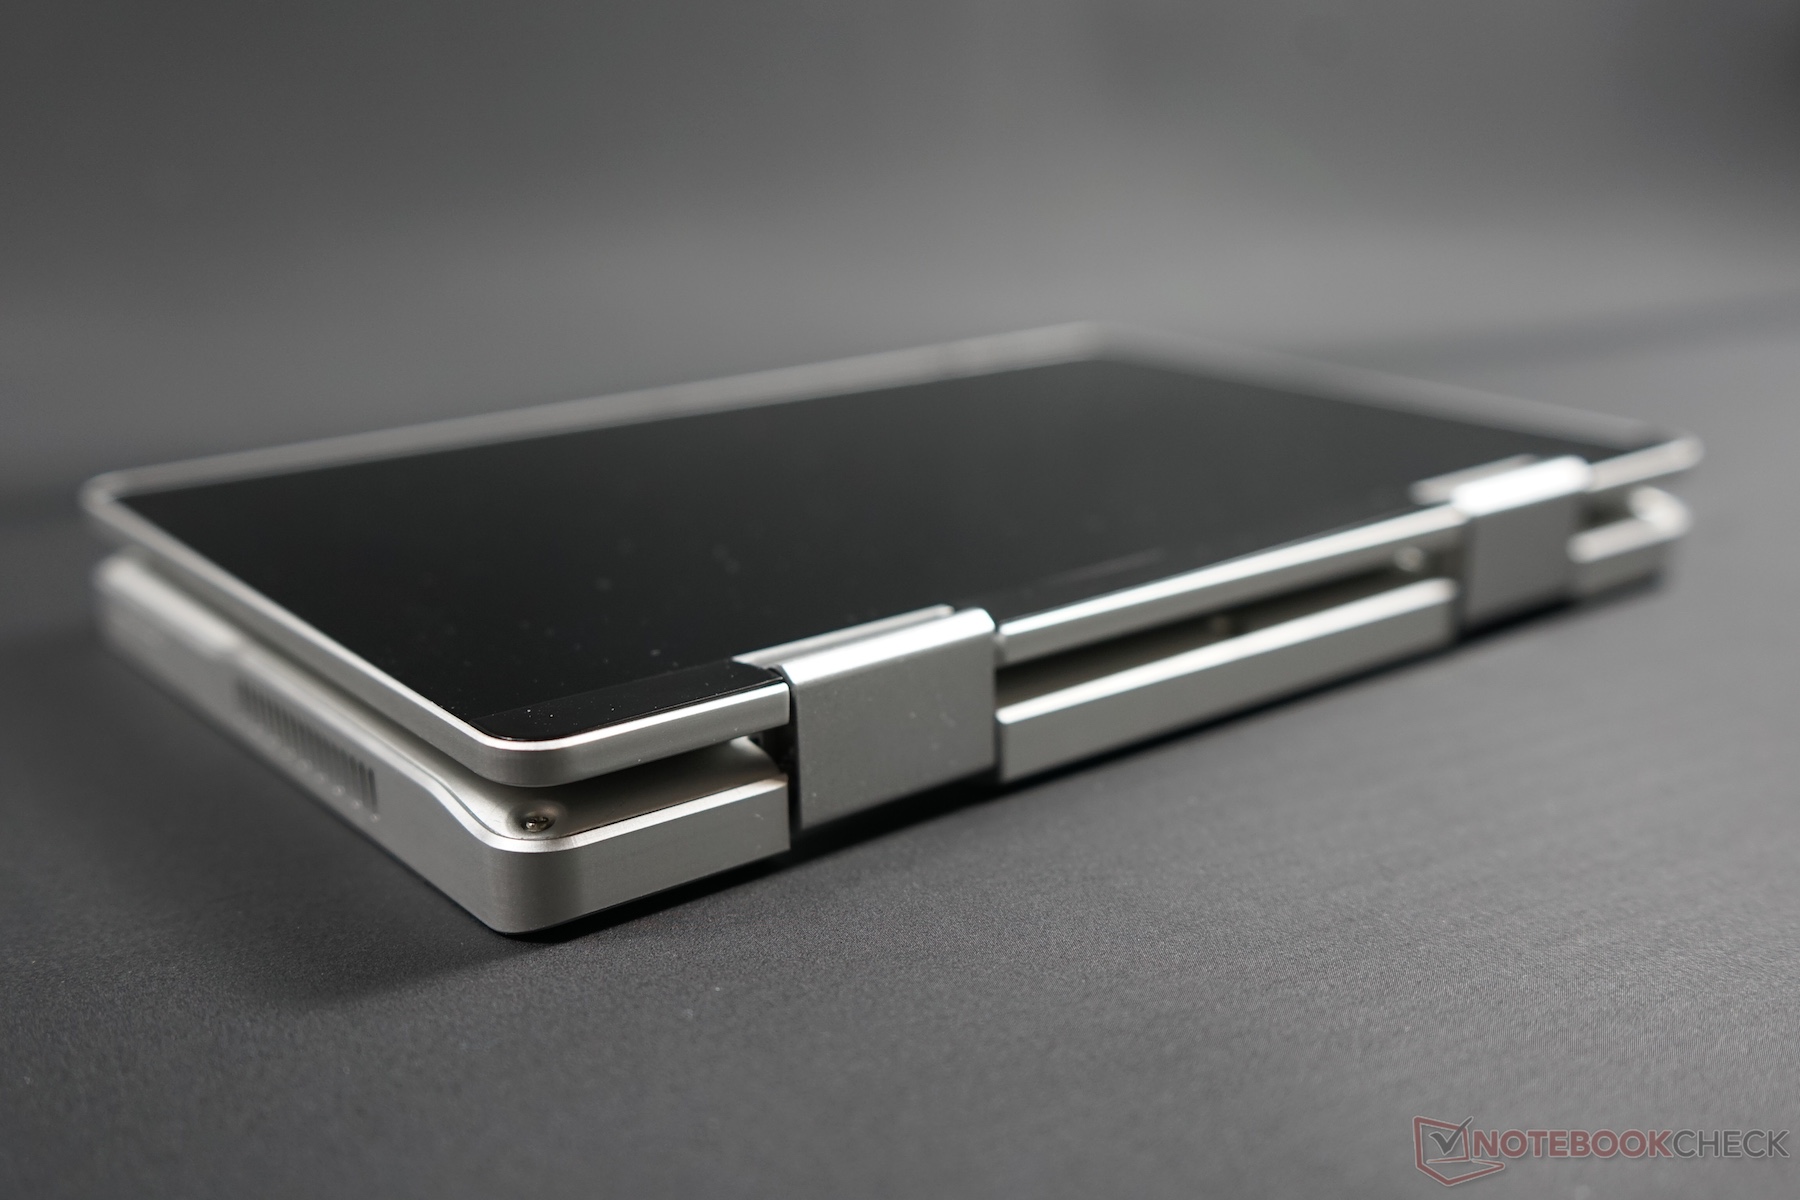
O Topjoy Falcon é um pequeno conversível com uma carcaça de alta qualidade. Enquanto em termos de dispositivos de entrada, você precisa fazer algumas concessões significativas em partes, o desempenho do quad-core Gemini-Lake permanece sem culpa, graças também ao ventilador integrado. Em termos de tela, a Topjoy ainda pretende fazer algumas melhorias e usar um modelo com maior brilho. Essa seria nossa principal reclamação sobre o painel AUO embutido (além do uso de PWM até 100% de brilho). Nós realmente recomendamos a caneta ativa opcional, uma vez que ajuda consideravelmente na operação da tela pequena.
No geral, o Falcon é um conceito muito interessante, mas ainda precisa de algum ajuste em seu estado atual. Para o reduzido Preço Kickstarter a partir de $399 (~350 Euros), você poderia obter um segundo portátil prático para a estrada a um preço acessível. No entanto, você precisaria confiar em que a Topjoy ainda fará sua lição de casa.
Price comparison
