Breve Análise do Portátil Apple MacBook 12 (2017)
| |||||||||||||||||||||||||
iluminação: 88 %
iluminação com acumulador: 387 cd/m²
Contraste: 823:1 (Preto: 0.47 cd/m²)
ΔE ColorChecker Calman: 1.6 | ∀{0.5-29.43 Ø4.73}
ΔE Greyscale Calman: 1 | ∀{0.09-98 Ø4.97}
97.8% sRGB (Calman 2D)
82.2% sRGB (Argyll 1.6.3 3D)
61.6% AdobeRGB 1998 (Argyll 1.6.3 3D)
68% AdobeRGB 1998 (Argyll 3D)
95.4% sRGB (Argyll 3D)
66.8% Display P3 (Argyll 3D)
Gamma: 2.26
CCT: 6680 K
| Apple MacBook 12 2017 APPA027, , 2304x1440, 12" | Apple MacBook 12 (Early 2016) 1.1 GHz APPA027, , 2304x1440, 12" | Apple MacBook Air 13.3" 1.8 GHz (2017) 1440x900, 13.3" | Apple MacBook Pro 13 2017 Touchbar i5 APPA034, , 2560x1600, 13.3" | Apple MacBook Pro 15 2017 (2.8 GHz, 555) APPA031, , 2880x1800, 15.4" | Apple iPad Pro 12.9 2017 2732x2048, 12.9" | Apple iPad Pro 10.5 2017 2224x1668, 10.5" | |
|---|---|---|---|---|---|---|---|
| Display | |||||||
| Display P3 Coverage (%) | 66.8 | 98.6 | 97.9 | ||||
| sRGB Coverage (%) | 95.4 | 100 | 99.9 | ||||
| AdobeRGB 1998 Coverage (%) | 68 | 86.5 | 85.9 | ||||
| Response Times | -3% | -13% | -17% | -17% | 18% | 22% | |
| Response Time Grey 50% / Grey 80% * (ms) | 40.8 ? | 41.2 ? -1% | 52.4 ? -28% | 48 ? -18% | 48 ? -18% | 41.6 ? -2% | 39.6 ? 3% |
| Response Time Black / White * (ms) | 29.2 ? | 30.4 ? -4% | 28.4 ? 3% | 33.6 ? -15% | 33.8 ? -16% | 18.4 ? 37% | 17.6 ? 40% |
| PWM Frequency (Hz) | 116000 | 58000 | 119000 ? | 119000 ? | |||
| Screen | |||||||
| Brightness middle (cd/m²) | 387 | 551 | 545 | 650 | 634 | ||
| Black Level * (cd/m²) | 0.47 | 0.48 | 0.44 | 0.42 | 0.39 | ||
| Brightness (cd/m²) | 358 | 514 | 523 | 614 | 625 | ||
| Brightness Distribution (%) | 88 | 88 | 86 | 90 | 87 | ||
| Contrast (:1) | 823 | 1148 | 1239 | 1548 | 1626 | ||
| Colorchecker dE 2000 * | 1.6 | 0.8 | 1.6 | 1 | 1.9 | ||
| Colorchecker dE 2000 max. * | 4 | 1.4 | 3.8 | 1.9 | 3.9 | ||
| Greyscale dE 2000 * | 1 | 1 | 1.9 | 1.5 | 2.8 | ||
| Gamma | 2.26 97% | 2.16 102% | 2.26 97% | 2.25 98% | 2.26 97% | ||
| CCT | 6680 97% | 6672 97% | 6834 95% | 6734 97% | 7027 93% | ||
| Color Space (Percent of AdobeRGB 1998) (%) | 61.6 | ||||||
| Color Space (Percent of sRGB) (%) | 82.2 | ||||||
| Média Total (Programa/Configurações) | -3% /
-3% | -13% /
-13% | -17% /
-17% | -17% /
-17% | 18% /
18% | 22% /
22% |
* ... menor é melhor
Exibir tempos de resposta
| ↔ Tempo de resposta preto para branco | ||
|---|---|---|
| 29.2 ms ... ascensão ↗ e queda ↘ combinadas | ↗ 15.8 ms ascensão | 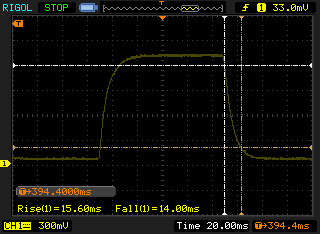 |
| ↘ 13.4 ms queda | ||
| A tela mostra taxas de resposta relativamente lentas em nossos testes e pode ser muito lenta para os jogadores. Em comparação, todos os dispositivos testados variam de 0.1 (mínimo) a 240 (máximo) ms. » 78 % de todos os dispositivos são melhores. Isso significa que o tempo de resposta medido é pior que a média de todos os dispositivos testados (19.9 ms). | ||
| ↔ Tempo de resposta 50% cinza a 80% cinza | ||
| 40.8 ms ... ascensão ↗ e queda ↘ combinadas | ↗ 19.6 ms ascensão | 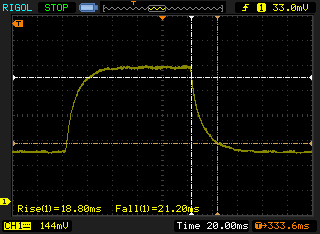 |
| ↘ 21.2 ms queda | ||
| A tela mostra taxas de resposta lentas em nossos testes e será insatisfatória para os jogadores. Em comparação, todos os dispositivos testados variam de 0.165 (mínimo) a 636 (máximo) ms. » 64 % de todos os dispositivos são melhores. Isso significa que o tempo de resposta medido é pior que a média de todos os dispositivos testados (31.1 ms). | ||
Cintilação da tela / PWM (modulação por largura de pulso)
| Tela tremeluzindo/PWM detectado | 116000 Hz | 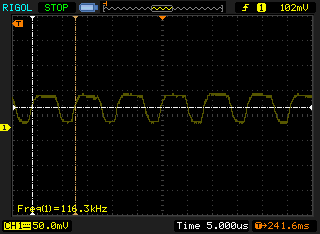 | |
A luz de fundo da tela pisca em 116000 Hz (pior caso, por exemplo, utilizando PWM) . A frequência de 116000 Hz é bastante alta, então a maioria dos usuários sensíveis ao PWM não deve notar nenhuma oscilação. [pwm_comparison] Em comparação: 52 % de todos os dispositivos testados não usam PWM para escurecer a tela. Se PWM foi detectado, uma média de 7798 (mínimo: 5 - máximo: 343500) Hz foi medida. | |||
| Cinebench R15 | |
| CPU Single 64Bit | |
| Apple MacBook Pro 13 2017 Touchbar i5 | |
| Apple MacBook 12 2017 | |
| Apple MacBook Air 13.3" 1.8 GHz (2017) | |
| Apple MacBook 12 (Early 2015) 1.1 GHz | |
| Apple MacBook 12 (Early 2015) 1.1 GHz | |
| Apple MacBook 12 (Early 2015) 1.1 GHz | |
| Apple MacBook 12 (Early 2016) 1.1 GHz | |
| Apple MacBook 12 (Early 2016) 1.1 GHz | |
| CPU Multi 64Bit | |
| Apple MacBook Pro 13 2017 Touchbar i5 | |
| Apple MacBook Air 13.3" 1.8 GHz (2017) | |
| Apple MacBook 12 2017 | |
| Apple MacBook 12 (Early 2016) 1.1 GHz | |
| Apple MacBook 12 (Early 2015) 1.1 GHz | |
| Apple MacBook 12 (Early 2015) 1.1 GHz | |
| Apple MacBook 12 (Early 2015) 1.1 GHz | |
| PCMark 8 Home Score Accelerated v2 | 3078 pontos | |
| PCMark 8 Creative Score Accelerated v2 | 3904 pontos | |
| PCMark 8 Work Score Accelerated v2 | 3946 pontos | |
| PCMark 10 Score | 2568 pontos | |
Ajuda | ||
| Apple MacBook 12 2017 Apple SSD AP0256 | Apple MacBook 12 (Early 2016) 1.1 GHz Apple SSD AP0256 | Apple MacBook Pro 13 2017 Touchbar i5 Apple SSD AP0256 | Apple MacBook Pro 15 2017 (2.8 GHz, 555) Apple SSD SM0256L | Apple MacBook Air 13.3" 1.8 GHz (2017) Apple SSD SM0128G | Asus Zenbook UX310UA-FC347T iGP Micron SSD 1100 (MTFDDAV256TBN) | Dell XPS 13 9360 FHD i5 Toshiba NVMe THNSN5256GPUK | |
|---|---|---|---|---|---|---|---|
| CrystalDiskMark 3.0 | 15% | 25% | 36% | 52% | 167% | 257% | |
| Read Seq (MB/s) | 955 | 754 -21% | 1540 61% | 1557 63% | 1390 46% | 489.4 -49% | 1233 29% |
| Write Seq (MB/s) | 899 | 638 -29% | 1353 51% | 1505 67% | 731 -19% | 431.6 -52% | 733 -18% |
| Read 4k (MB/s) | 9.721 | 14.6 50% | 9.92 2% | 10.76 11% | 16.29 68% | 26.68 174% | 29.31 202% |
| Write 4k (MB/s) | 12.78 | 20.5 60% | 10.74 -16% | 12.87 1% | 27.17 113% | 88.7 594% | 116.9 815% |
| CrystalDiskMark 5.2 / 6 | 14% | 33% | 12% | ||||
| Read Seq (MB/s) | 940 | 1509 61% | 1572 67% | 1491 59% | |||
| Write Seq (MB/s) | 867 | 1345 55% | 1473 70% | 741 -15% | |||
| Read 4K (MB/s) | 22.8 | 23.77 4% | 23.33 2% | 21.26 -7% | |||
| Write 4K (MB/s) | 95.7 | 32.94 -66% | 86.7 -9% | 105.9 11% | |||
| Média Total (Programa/Configurações) | 15% /
15% | 20% /
19% | 35% /
34% | 32% /
32% | 167% /
167% | 257% /
257% |

| 3DMark 11 Performance | 1324 pontos | |
| 3DMark Cloud Gate Standard Score | 5035 pontos | |
Ajuda | ||
(+) A temperatura máxima no lado superior é 38.9 °C / 102 F, em comparação com a média de 35.9 °C / 97 F , variando de 21.4 a 59 °C para a classe Subnotebook.
(±) A parte inferior aquece até um máximo de 42.5 °C / 109 F, em comparação com a média de 39.2 °C / 103 F
(+) Em uso inativo, a temperatura média para o lado superior é 29.1 °C / 84 F, em comparação com a média do dispositivo de 30.8 °C / ### class_avg_f### F.
(+) Os apoios para as mãos e o touchpad estão atingindo a temperatura máxima da pele (32.8 °C / 91 F) e, portanto, não estão quentes.
(-) A temperatura média da área do apoio para as mãos de dispositivos semelhantes foi 28.2 °C / 82.8 F (-4.6 °C / -8.2 F).
Apple MacBook 12 2017 análise de áudio
(+) | os alto-falantes podem tocar relativamente alto (###valor### dB)
Graves 100 - 315Hz
(-) | quase nenhum baixo - em média 15% menor que a mediana
(±) | a linearidade dos graves é média (8.8% delta para a frequência anterior)
Médios 400 - 2.000 Hz
(+) | médios equilibrados - apenas 2% longe da mediana
(+) | médios são lineares (3.8% delta para frequência anterior)
Altos 2 - 16 kHz
(+) | agudos equilibrados - apenas 2.3% longe da mediana
(+) | os máximos são lineares (3.3% delta da frequência anterior)
Geral 100 - 16.000 Hz
(+) | o som geral é linear (11.6% diferença em relação à mediana)
Comparado com a mesma classe
» 12% de todos os dispositivos testados nesta classe foram melhores, 3% semelhantes, 84% piores
» O melhor teve um delta de 5%, a média foi 18%, o pior foi 53%
Comparado com todos os dispositivos testados
» 8% de todos os dispositivos testados foram melhores, 2% semelhantes, 90% piores
» O melhor teve um delta de 4%, a média foi 24%, o pior foi 134%
Apple MacBook 12 (Early 2016) 1.1 GHz análise de áudio
(+) | os alto-falantes podem tocar relativamente alto (###valor### dB)
Graves 100 - 315Hz
(±) | graves reduzidos - em média 11.3% menor que a mediana
(±) | a linearidade dos graves é média (14.2% delta para a frequência anterior)
Médios 400 - 2.000 Hz
(+) | médios equilibrados - apenas 2.4% longe da mediana
(+) | médios são lineares (5.5% delta para frequência anterior)
Altos 2 - 16 kHz
(+) | agudos equilibrados - apenas 2% longe da mediana
(+) | os máximos são lineares (4.5% delta da frequência anterior)
Geral 100 - 16.000 Hz
(+) | o som geral é linear (10.2% diferença em relação à mediana)
Comparado com a mesma classe
» 7% de todos os dispositivos testados nesta classe foram melhores, 2% semelhantes, 91% piores
» O melhor teve um delta de 5%, a média foi 18%, o pior foi 53%
Comparado com todos os dispositivos testados
» 5% de todos os dispositivos testados foram melhores, 1% semelhantes, 94% piores
» O melhor teve um delta de 4%, a média foi 24%, o pior foi 134%
| desligado | |
| Ocioso | |
| Carga |
|
Key:
min: | |
| Apple MacBook 12 2017 m3-7Y32, HD Graphics 615, Apple SSD AP0256, LED IPS, 2304x1440, 12" | Apple MacBook 12 (Early 2016) 1.1 GHz 6Y30, HD Graphics 515, Apple SSD AP0256, IPS, 2304x1440, 12" | Apple MacBook Air 13.3" 1.8 GHz (2017) 5350U, HD Graphics 6000, Apple SSD SM0128G, TN LED, 1440x900, 13.3" | Apple MacBook Pro 13 2017 Touchbar i5 i5-7267U, Iris Plus Graphics 650, Apple SSD AP0256, IPS, 2560x1600, 13.3" | Apple iPad Pro 12.9 2017 A10X Fusion, A10X Fusion GPU, Toshiba THGBX669D4LLDXG 64 GB NAND , IPS, 2732x2048, 12.9" | Apple iPad Pro 10.5 2017 A10X Fusion, A10X Fusion GPU, Toshiba THGBX669D4LLDXG 64 GB NAND , IPS, 2224x1668, 10.5" | |
|---|---|---|---|---|---|---|
| Power Consumption | 1% | -50% | -111% | 7% | 26% | |
| Idle Minimum * (Watt) | 2 | 2.7 -35% | 3.4 -70% | 2.8 -40% | 1.55 22% | 1.44 28% |
| Idle Average * (Watt) | 5.4 | 2.7 50% | 6.3 -17% | 10.9 -102% | 8.58 -59% | 6.12 -13% |
| Idle Maximum * (Watt) | 6.6 | 7.2 -9% | 7 -6% | 11.4 -73% | 8.59 -30% | 6.14 7% |
| Load Average * (Watt) | 22 | 22 -0% | 34.5 -57% | 55.4 -152% | 10.09 54% | 8.55 61% |
| Load Maximum * (Watt) | 20 | 20.5 -2% | 40 -100% | 57.5 -188% | 10.61 47% | 10.62 47% |
* ... menor é melhor
| Apple MacBook 12 2017 m3-7Y32, HD Graphics 615, 41.4 Wh | Apple MacBook 12 (Early 2016) 1.1 GHz 6Y30, HD Graphics 515, 41.4 Wh | Apple MacBook Air 13.3" 1.8 GHz (2017) 5350U, HD Graphics 6000, 54 Wh | Apple MacBook Pro 13 2017 Touchbar i5 i5-7267U, Iris Plus Graphics 650, 49.2 Wh | Apple iPad Pro 12.9 2017 A10X Fusion, A10X Fusion GPU, 41 Wh | Apple iPad Pro 10.5 2017 A10X Fusion, A10X Fusion GPU, 30.8 Wh | |
|---|---|---|---|---|---|---|
| Duração da bateria | -7% | 18% | -3% | 37% | 29% | |
| WiFi v1.3 (h) | 9 | 8.4 -7% | 10.6 18% | 8.7 -3% | 12.3 37% | 11.6 29% |
| H.264 (h) | 8.5 | 6.9 | 11.3 | 10.5 | ||
| Load (h) | 3.9 | 1.2 | 4.3 | 3.3 | ||
| Reader / Idle (h) | 48.7 | 33.9 |
Pro
Contra
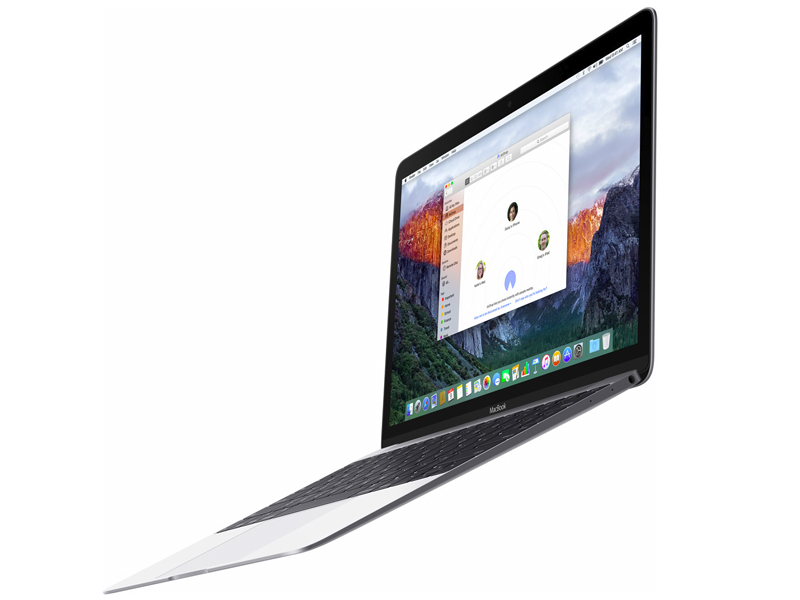
Como o novo MacBook 12 da Apple se sai cerca de 2 anos após seu primeiro lançamento? Bem, não diríamos que está "anos-luz" à frente, já que outros fabricantes não dormiram durante este tempo e também oferecem computadores móveis finos e igualmente poderosos. No entanto, o MacBook 12 ainda apresenta muitas qualidades, que são tão importantes hoje quanto dois anos atrás.
Em primeiro lugar, não só a carcaça de alumínio de gama alta se sente muito bem ao toque, mas também é muito robusto, fino e leve (1,3 cm, 0,92 kg / ~ 0,5 pol, ~ 2 lb). A única desvantagem: Há apenas uma porta USB Type-C, que também é utilizada para carregar Sem hubs ou adaptadores compatíveis, você rapidamente alcançará os limites aqui.
Em comparação com outros portáteis, incluindo os novos MacBook Pros, o teclado ainda apresenta um deslocamento extremamente curto. No entanto, o mecanismo de borboleta revisado traz vantagens significativas em comparação com o antecessor. Em contraste, o touchpad implementa uma tecnologia Force Touch totalmente desenvolvida.
A tela permaneceu inalterada desde o primeiro lançamento. No entanto, ainda é um dos melhores painéis do seu tamanho disponível no mercado em função de sua especificação e valores medidos. Em contraste com os pressupostos anteriores, a Apple aparentemente usa PWM para controle de brilho. No entanto, isso é insignificante devido à alta frequência utilizada.
O desempenho da CPU, GPU e SSD é superior que o do antecessor. No entanto, o ganho de desempenho não é suficientemente alto para justificar a substituição de um modelo de 2015 ou 2016. A perda de desempenho durante o uso intenso prolongado continua a ser um ponto crucial. No entanto, uma vez que leva cerca de 15 minutos até ocorrer (carga total!), isso não deve causar problemas, na prática.
Operação sempre silenciosa, boas durações da bateria de até 9 horas durante o uso realista, e alto-falantes muito bons, que não indicam estar espremidos em uma caixa extremamente fina, ainda são pontos positivos importantes para o MacBook 12.
O Apple MacBook 12 pode ser recomendado para usuários ultra-móveis, que precisam transportar seu dispositivo com freqüência e não possuem requisitos elevados nas reservas de desempenho de seu companheiro (as tarefas de escritório sempre rodam rapidamente). Embora haja vários companheiros melhor equipados disponíveis no mundo do Windows por um preço de 1499 euros (~ $1710), o MacBook 12 da Apple é uma opção atraente para os usuários que possam aceitar seus poucos compromissos (falta de portas, teclado com deslocamento curto das teclas, desempenho reduzido em longo prazo).
Apple MacBook 12 2017
- 06/27/2017 v6 (old)
J. Simon Leitner