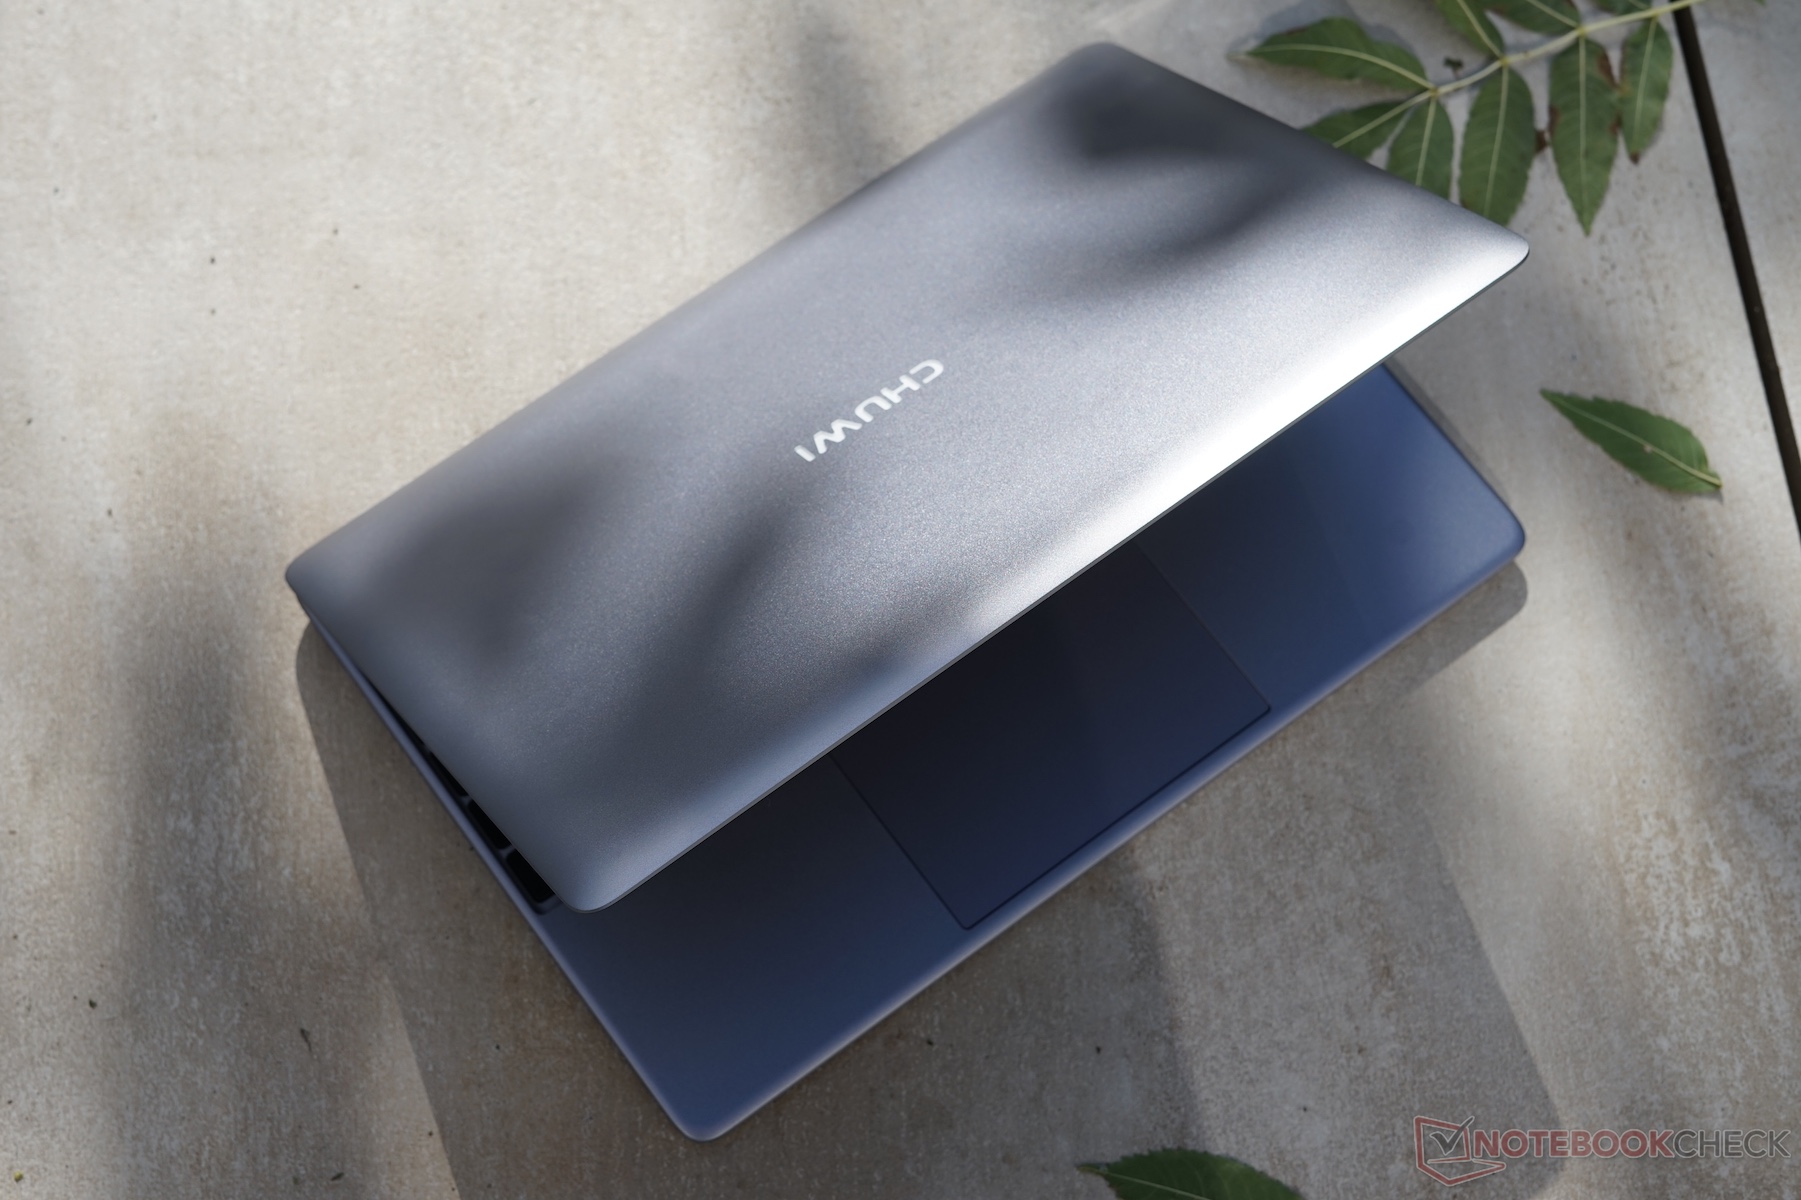
Breve Análise do Portátil Chuwi LapBook SE

| SD Card Reader | |
| average JPG Copy Test (av. of 3 runs) | |
| Dell XPS 13 9360 QHD+ i7 (Toshiba Exceria Pro SDXC 64 GB UHS-II) | |
| Apple MacBook Air 13.3" 1.8 GHz (2017) (Toshiba Exceria Pro SDXC 64 GB UHS-II) | |
| Média da turma Subnotebook (23.7 - 188, n=9, últimos 2 anos) | |
| Chuwi LapBook SE | |
| Chuwi Lapbook 12.3 (Toshiba Exceria Pro M501) | |
| Trekstor Primebook C13 (Toshiba Exceria Pro M501 microSDXC 64GB) | |
| Jumper EZbook 3 | |
| maximum AS SSD Seq Read Test (1GB) | |
| Dell XPS 13 9360 QHD+ i7 (Toshiba Exceria Pro SDXC 64 GB UHS-II) | |
| Média da turma Subnotebook (24.9 - 195, n=8, últimos 2 anos) | |
| Apple MacBook Air 13.3" 1.8 GHz (2017) (Toshiba Exceria Pro SDXC 64 GB UHS-II) | |
| Chuwi Lapbook 12.3 (Toshiba Exceria Pro M501) | |
| Trekstor Primebook C13 (Toshiba Exceria Pro M501 microSDXC 64GB) | |
| Jumper EZbook 3 (Toshiba Exceria Pro M401 64 GB) | |
| Chuwi LapBook SE | |
| |||||||||||||||||||||||||
iluminação: 89 %
Contraste: 516:1 (Preto: 0.44 cd/m²)
ΔE ColorChecker Calman: 6.6 | ∀{0.5-29.43 Ø4.72}
calibrated: 1.9
ΔE Greyscale Calman: 7.9 | ∀{0.09-98 Ø4.97}
95% sRGB (Calman 2D)
66.5% AdobeRGB 1998 (Argyll 3D)
94.8% sRGB (Argyll 3D)
65% Display P3 (Argyll 3D)
Gamma: 2.16
CCT: 8879 K
| Chuwi LapBook SE 1920x1080, 13.3" | Chuwi Lapbook 12.3 SDC8353, , 2736x1824, 12.3" | Jumper EZbook 3 MS_9003, , 1920x1080, 14.1" | Microsoft Surface Go MHN-00003 Sharp SHP14A6, , 1800x1200, 10" | Apple MacBook 12 (Early 2016) 1.1 GHz APPA027, , 2304x1440, 12" | |
|---|---|---|---|---|---|
| Display | 5% | -20% | 2% | 2% | |
| Display P3 Coverage (%) | 65 | 68 5% | 51.6 -21% | 66.5 2% | 66.8 3% |
| sRGB Coverage (%) | 94.8 | 98.4 4% | 77.3 -18% | 97.5 3% | 95.4 1% |
| AdobeRGB 1998 Coverage (%) | 66.5 | 69.5 5% | 53 -20% | 67.5 2% | 68 2% |
| Response Times | -17% | 21% | -2% | -8% | |
| Response Time Grey 50% / Grey 80% * (ms) | 39.2 ? | 48.4 ? -23% | 46 ? -17% | 44 ? -12% | 41.2 ? -5% |
| Response Time Black / White * (ms) | 27.7 ? | 30.8 ? -11% | 11.6 ? 58% | 25.6 ? 8% | 30.4 ? -10% |
| PWM Frequency (Hz) | 200 ? | 200 ? | 1020 ? | ||
| Screen | 63% | -28% | 77% | 53% | |
| Brightness middle (cd/m²) | 227 | 224 -1% | 384 69% | 456 101% | 387 70% |
| Brightness (cd/m²) | 210 | 219 4% | 341 62% | 426 103% | 358 70% |
| Brightness Distribution (%) | 89 | 81 -9% | 76 -15% | 88 -1% | 88 -1% |
| Black Level * (cd/m²) | 0.44 | 0.13 70% | 1.28 -191% | 0.31 30% | 0.47 -7% |
| Contrast (:1) | 516 | 1723 234% | 300 -42% | 1471 185% | 823 59% |
| Colorchecker dE 2000 * | 6.6 | 2.4 64% | 8.7 -32% | 1.3 80% | 1.6 76% |
| Colorchecker dE 2000 max. * | 12.2 | 3.7 70% | 16.7 -37% | 3 75% | 4 67% |
| Colorchecker dE 2000 calibrated * | 1.9 | 1.1 42% | |||
| Greyscale dE 2000 * | 7.9 | 2.5 68% | 11.1 -41% | 1.4 82% | 1 87% |
| Gamma | 2.16 102% | 2.31 95% | 2.2 100% | 2.24 98% | 2.26 97% |
| CCT | 8879 73% | 6869 95% | 12445 52% | 6687 97% | 6680 97% |
| Color Space (Percent of AdobeRGB 1998) (%) | 63.4 | 62.3 | 61.6 | ||
| Color Space (Percent of sRGB) (%) | 98.3 | 96.8 | 82.2 | ||
| Média Total (Programa/Configurações) | 17% /
37% | -9% /
-19% | 26% /
50% | 16% /
32% |
* ... menor é melhor
Exibir tempos de resposta
| ↔ Tempo de resposta preto para branco | ||
|---|---|---|
| 27.7 ms ... ascensão ↗ e queda ↘ combinadas | ↗ 14.8 ms ascensão | 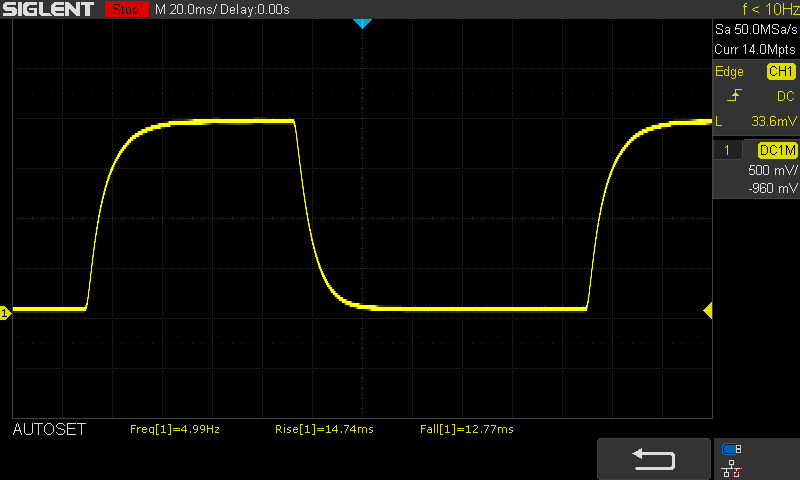 |
| ↘ 12.9 ms queda | ||
| A tela mostra taxas de resposta relativamente lentas em nossos testes e pode ser muito lenta para os jogadores. Em comparação, todos os dispositivos testados variam de 0.1 (mínimo) a 240 (máximo) ms. » 71 % de todos os dispositivos são melhores. Isso significa que o tempo de resposta medido é pior que a média de todos os dispositivos testados (19.8 ms). | ||
| ↔ Tempo de resposta 50% cinza a 80% cinza | ||
| 39.2 ms ... ascensão ↗ e queda ↘ combinadas | ↗ 19.2 ms ascensão | 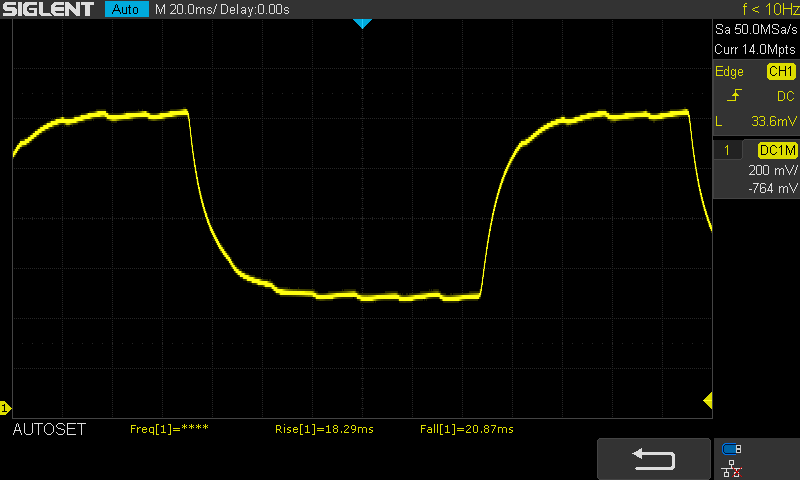 |
| ↘ 20 ms queda | ||
| A tela mostra taxas de resposta lentas em nossos testes e será insatisfatória para os jogadores. Em comparação, todos os dispositivos testados variam de 0.165 (mínimo) a 636 (máximo) ms. » 60 % de todos os dispositivos são melhores. Isso significa que o tempo de resposta medido é pior que a média de todos os dispositivos testados (31 ms). | ||
Cintilação da tela / PWM (modulação por largura de pulso)
| Tela tremeluzindo/PWM detectado | 200 Hz | ≤ 29 % configuração de brilho | 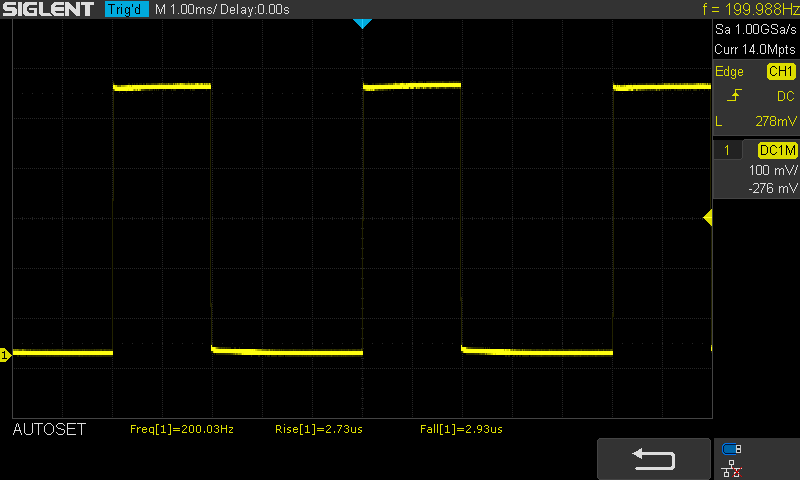 |
A luz de fundo da tela pisca em 200 Hz (pior caso, por exemplo, utilizando PWM) Cintilação detectada em uma configuração de brilho de 29 % e abaixo. Não deve haver cintilação ou PWM acima desta configuração de brilho. A frequência de 200 Hz é relativamente baixa, portanto, usuários sensíveis provavelmente notarão cintilação e sentirão fadiga ocular na configuração de brilho indicada e abaixo. [pwm_comparison] Em comparação: 52 % de todos os dispositivos testados não usam PWM para escurecer a tela. Se PWM foi detectado, uma média de 7747 (mínimo: 5 - máximo: 343500) Hz foi medida. | |||
| PCMark 8 | |
| Home Score Accelerated v2 | |
| HP 15-da0405ng | |
| Apple MacBook Air 13.3" 1.8 GHz (2017) | |
| Lenovo IdeaPad V110-15IKB 80TH001SGE | |
| Apple MacBook 12 2017 | |
| Eve-Tech Eve V m3 | |
| Lenovo Flex 6-11IGM | |
| Chuwi LapBook SE | |
| Média da turma Subnotebook (1739 - 1828, n=2, últimos 2 anos) | |
| Microsoft Surface 3 | |
| Jumper EZbook 3 | |
| Chuwi Lapbook 12.3 | |
| Microsoft Surface Go MHN-00003 | |
| Work Score Accelerated v2 | |
| HP 15-da0405ng | |
| Apple MacBook Air 13.3" 1.8 GHz (2017) | |
| Lenovo IdeaPad V110-15IKB 80TH001SGE | |
| Apple MacBook 12 2017 | |
| Chuwi LapBook SE | |
| Jumper EZbook 3 | |
| Chuwi Lapbook 12.3 | |
| Média da turma Subnotebook (1609 - 1656, n=2, últimos 2 anos) | |
| Chuwi LapBook SE SanDisk DF4032 | Chuwi LapBook SE FORESEE 128GB O1229B | Apple MacBook 12 2017 Apple SSD AP0256 | Microsoft Surface Go MHN-00003 64 GB eMMC Flash | Trekstor Primebook C13 SanDisk DF4064 | Chuwi LapBook 14 inch 2017 SanDisk DF4128 | |
|---|---|---|---|---|---|---|
| CrystalDiskMark 5.2 / 6 | 194% | 536% | 92% | 7% | 26% | |
| Read Seq (MB/s) | 247 | 422 71% | 940 281% | 268 9% | 264.7 7% | 293.6 19% |
| Write Seq (MB/s) | 87.7 | 347 296% | 867 889% | 126.2 44% | 117 33% | 106.1 21% |
| Read 4K (MB/s) | 7.2 | 10.37 44% | 22.8 217% | 19.72 174% | 5.04 -30% | 11.45 59% |
| Write 4K (MB/s) | 11.17 | 52.1 366% | 95.7 757% | 26.91 141% | 13.16 18% | 11.87 6% |

| 3DMark 06 Standard Score | 3279 pontos | |
| 3DMark 11 Performance | 541 pontos | |
| 3DMark Cloud Gate Standard Score | 2486 pontos | |
| 3DMark Time Spy Score | 97 pontos | |
Ajuda | ||
| Dota 2 Reborn - 1280x720 min (0/3) fastest | |
| Média da turma Subnotebook (33.7 - 183.5, n=61, últimos 2 anos) | |
| HP 15-da0405ng | |
| HP ProBook 645 G4 3UP62EA | |
| Eve-Tech Eve V m3 | |
| Lenovo IdeaPad V110-15IKB 80TH001SGE | |
| HP mt43 | |
| Lenovo Yoga 330-11IGM | |
| Acer Swift 1 SF114-32-P8GG | |
| Chuwi LapBook SE | |
| Jumper EZbook 3 | |
| baixo | média | alto | ultra | |
|---|---|---|---|---|
| Counter-Strike: GO (2012) | 27.4 | |||
| Dota 2 Reborn (2015) | 30 | 14.4 | 6.5 | 5.9 |
| X-Plane 11.11 (2018) | 0 o jogo não começa | |||
| World of Tanks enCore (2018) | 34.8 | 4.8 | ||
| Forza Horizon 4 (2018) | 0 o jogo não começa (hangs) | |||
| The Division 2 (2019) | 0 o jogo não começa | |||
| League of Legends (2019) | 42.5 | 29.8 | 22 | 19.2 |
(+) A temperatura máxima no lado superior é 37 °C / 99 F, em comparação com a média de 35.9 °C / 97 F , variando de 21.4 a 59 °C para a classe Subnotebook.
(+) A parte inferior aquece até um máximo de 34 °C / 93 F, em comparação com a média de 39.2 °C / 103 F
(+) Em uso inativo, a temperatura média para o lado superior é 26.2 °C / 79 F, em comparação com a média do dispositivo de 30.8 °C / ### class_avg_f### F.
(+) Os apoios para as mãos e o touchpad estão atingindo a temperatura máxima da pele (34 °C / 93.2 F) e, portanto, não estão quentes.
(-) A temperatura média da área do apoio para as mãos de dispositivos semelhantes foi 28.2 °C / 82.8 F (-5.8 °C / -10.4 F).
Chuwi LapBook SE análise de áudio
(±) | o volume do alto-falante é médio, mas bom (###valor### dB)
Graves 100 - 315Hz
(-) | quase nenhum baixo - em média 31.4% menor que a mediana
(+) | o baixo é linear (6.3% delta para a frequência anterior)
Médios 400 - 2.000 Hz
(±) | médios reduzidos - em média 6.7% menor que a mediana
(±) | a linearidade dos médios é média (7.8% delta para frequência anterior)
Altos 2 - 16 kHz
(±) | máximos mais altos - em média 6.7% maior que a mediana
(+) | os máximos são lineares (5.8% delta da frequência anterior)
Geral 100 - 16.000 Hz
(-) | o som geral não é linear (31.6% diferença em relação à mediana)
Comparado com a mesma classe
» 93% de todos os dispositivos testados nesta classe foram melhores, 2% semelhantes, 5% piores
» O melhor teve um delta de 5%, a média foi 18%, o pior foi 53%
Comparado com todos os dispositivos testados
» 90% de todos os dispositivos testados foram melhores, 2% semelhantes, 8% piores
» O melhor teve um delta de 4%, a média foi 23%, o pior foi 134%
Apple MacBook 12 (Early 2016) 1.1 GHz análise de áudio
(+) | os alto-falantes podem tocar relativamente alto (###valor### dB)
Graves 100 - 315Hz
(±) | graves reduzidos - em média 11.3% menor que a mediana
(±) | a linearidade dos graves é média (14.2% delta para a frequência anterior)
Médios 400 - 2.000 Hz
(+) | médios equilibrados - apenas 2.4% longe da mediana
(+) | médios são lineares (5.5% delta para frequência anterior)
Altos 2 - 16 kHz
(+) | agudos equilibrados - apenas 2% longe da mediana
(+) | os máximos são lineares (4.5% delta da frequência anterior)
Geral 100 - 16.000 Hz
(+) | o som geral é linear (10.2% diferença em relação à mediana)
Comparado com a mesma classe
» 7% de todos os dispositivos testados nesta classe foram melhores, 2% semelhantes, 90% piores
» O melhor teve um delta de 5%, a média foi 18%, o pior foi 53%
Comparado com todos os dispositivos testados
» 5% de todos os dispositivos testados foram melhores, 1% semelhantes, 94% piores
» O melhor teve um delta de 4%, a média foi 23%, o pior foi 134%
| desligado | |
| Ocioso | |
| Carga |
|
Key:
min: | |
| Chuwi LapBook SE Celeron N4100, UHD Graphics 600, SanDisk DF4032, , 1920x1080, 13.3" | Apple MacBook 12 2017 m3-7Y32, HD Graphics 615, Apple SSD AP0256, LED IPS, 2304x1440, 12" | Apple MacBook Air 13.3" 1.8 GHz (2017) 5350U, HD Graphics 6000, Apple SSD SM0128G, TN LED, 1440x900, 13.3" | Chuwi LapBook 14 inch 2017 Celeron N3450, HD Graphics 500, SanDisk DF4128, IPS, 1920x1080, 14.1" | Lenovo Flex 6-11IGM Celeron N4000, UHD Graphics 600, SanDisk DF4064, TN LED, 1366x768, 11.6" | Lenovo Yoga 330-11IGM Pentium N5000, UHD Graphics 605, 128 GB eMMC Flash, TN LED, 1366x768, 11.6" | Microsoft Surface Go MHN-00003 Pentium 4415Y, UHD Graphics 615, 64 GB eMMC Flash, IPS, 1800x1200, 10" | Média Intel UHD Graphics 600 | Média da turma Subnotebook | |
|---|---|---|---|---|---|---|---|---|---|
| Power Consumption | -1% | -51% | 4% | 12% | 14% | -3% | 1% | -89% | |
| Idle Minimum * (Watt) | 2.7 | 2 26% | 3.4 -26% | 3.6 -33% | 2.7 -0% | 2.3 15% | 2.88 -7% | 3.47 ? -29% | 3.76 ? -39% |
| Idle Average * (Watt) | 6.3 | 5.4 14% | 6.3 -0% | 6.2 2% | 4.5 29% | 4.2 33% | 4.8 24% | 5.61 ? 11% | 6.54 ? -4% |
| Idle Maximum * (Watt) | 7.6 | 6.6 13% | 7 8% | 6.5 14% | 5.7 25% | 5.4 29% | 7.5 1% | 6.6 ? 13% | 7.89 ? -4% |
| Load Average * (Watt) | 12.6 | 22 -75% | 34.5 -174% | 13.5 -7% | 13.7 -9% | 15.4 -22% | 16.9 -34% | 13.6 ? -8% | 42 ? -233% |
| Load Maximum * (Watt) | 24.6 | 20 19% | 40 -63% | 14.3 42% | 20.3 17% | 21.4 13% | 23.8 3% | 20.2 ? 18% | 64.8 ? -163% |
* ... menor é melhor
| Chuwi LapBook SE Celeron N4100, UHD Graphics 600, 37 Wh | Chuwi LapBook 14 inch 2017 Celeron N3450, HD Graphics 500, 38 Wh | Chuwi Lapbook 12.3 Celeron N3450, HD Graphics 500, 36.48 Wh | Apple MacBook Air 13.3" 1.8 GHz (2017) 5350U, HD Graphics 6000, 54 Wh | Apple MacBook 12 2017 m3-7Y32, HD Graphics 615, 41.4 Wh | Microsoft Surface Go MHN-00003 Pentium 4415Y, UHD Graphics 615, 28 Wh | Média da turma Subnotebook | |
|---|---|---|---|---|---|---|---|
| Duração da bateria | -30% | -11% | 43% | 22% | -26% | 29% | |
| H.264 (h) | 9.4 | 6.4 -32% | 15.4 ? 64% | ||||
| WiFi v1.3 (h) | 7.4 | 6.2 -16% | 6.6 -11% | 10.6 43% | 9 22% | 7.5 1% | 14 ? 89% |
| Load (h) | 5.8 | 3.3 -43% | 3 -48% | 1.969 ? -66% | |||
| Reader / Idle (h) | 11.6 | 12.9 | 28.6 ? |
Pro
Contra
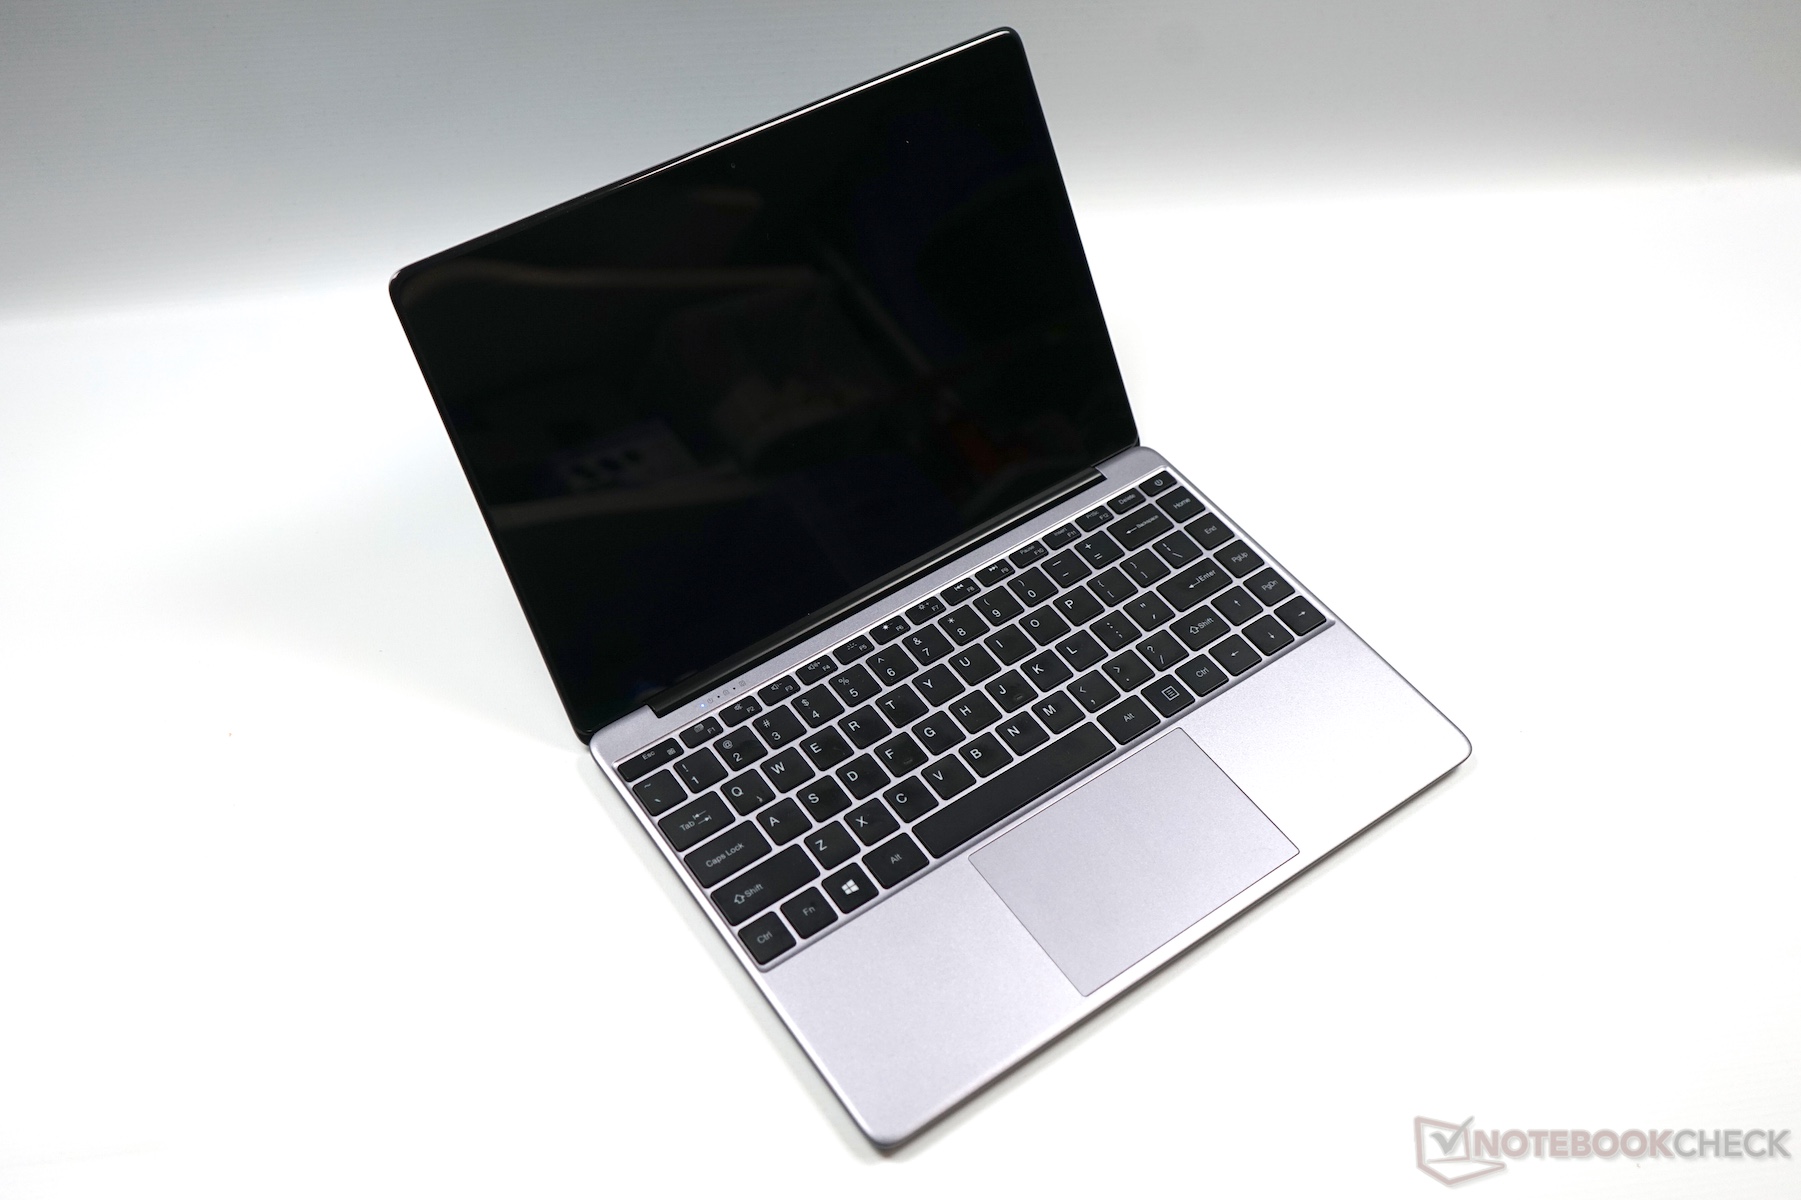
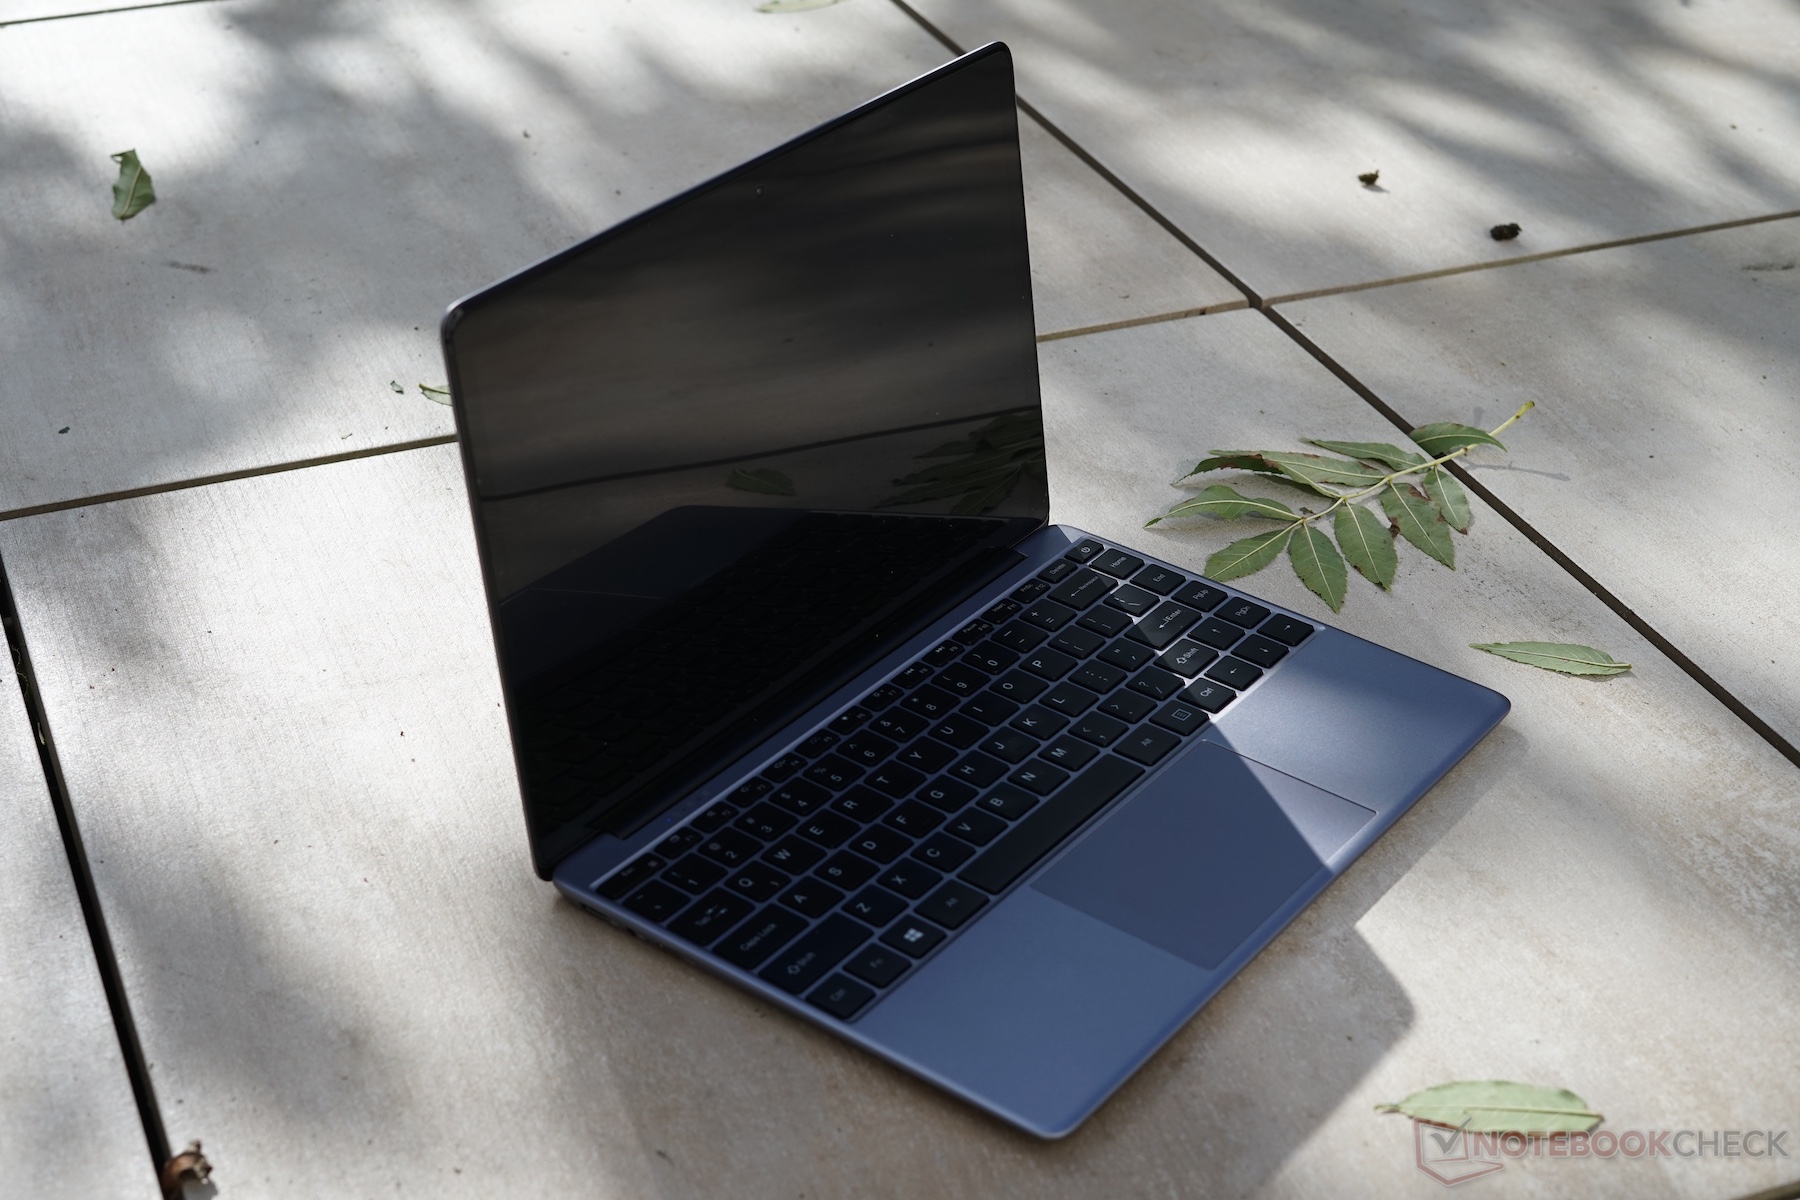
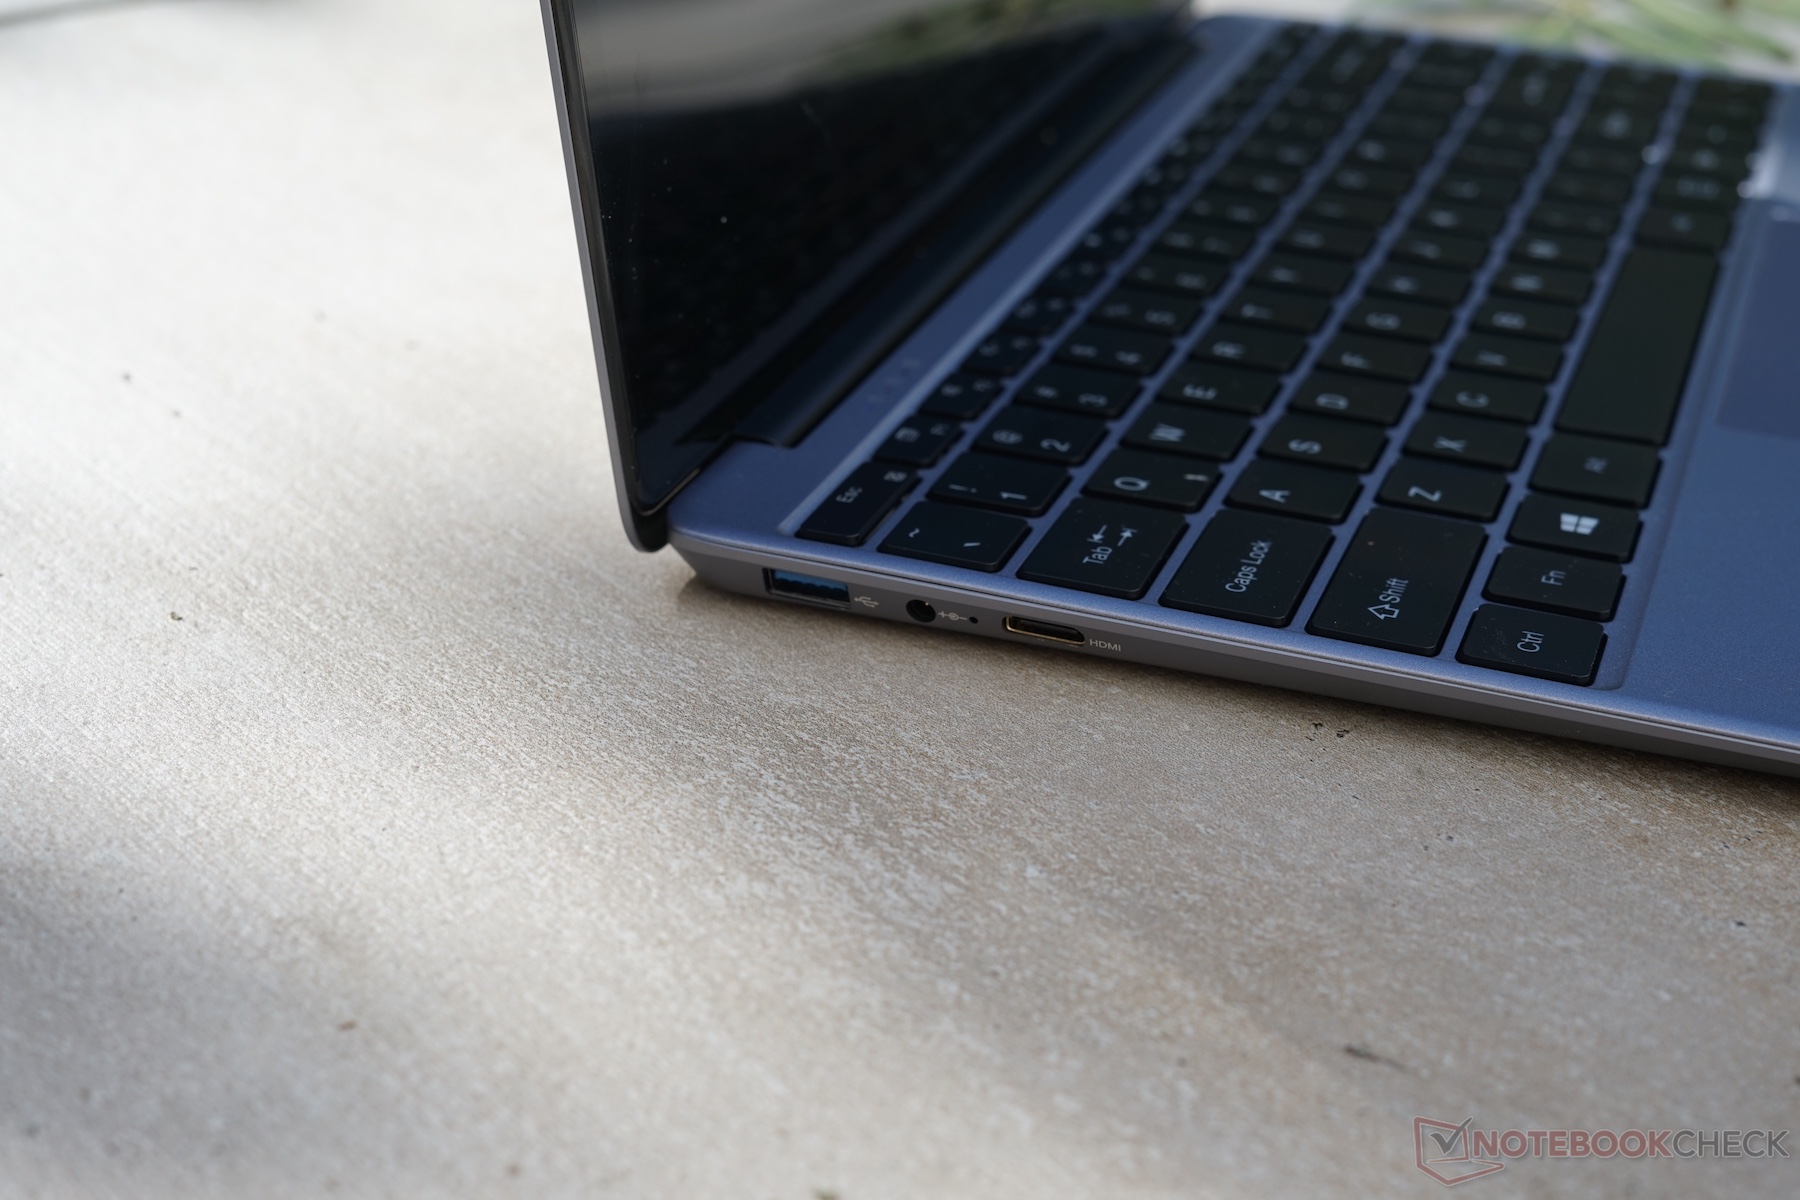
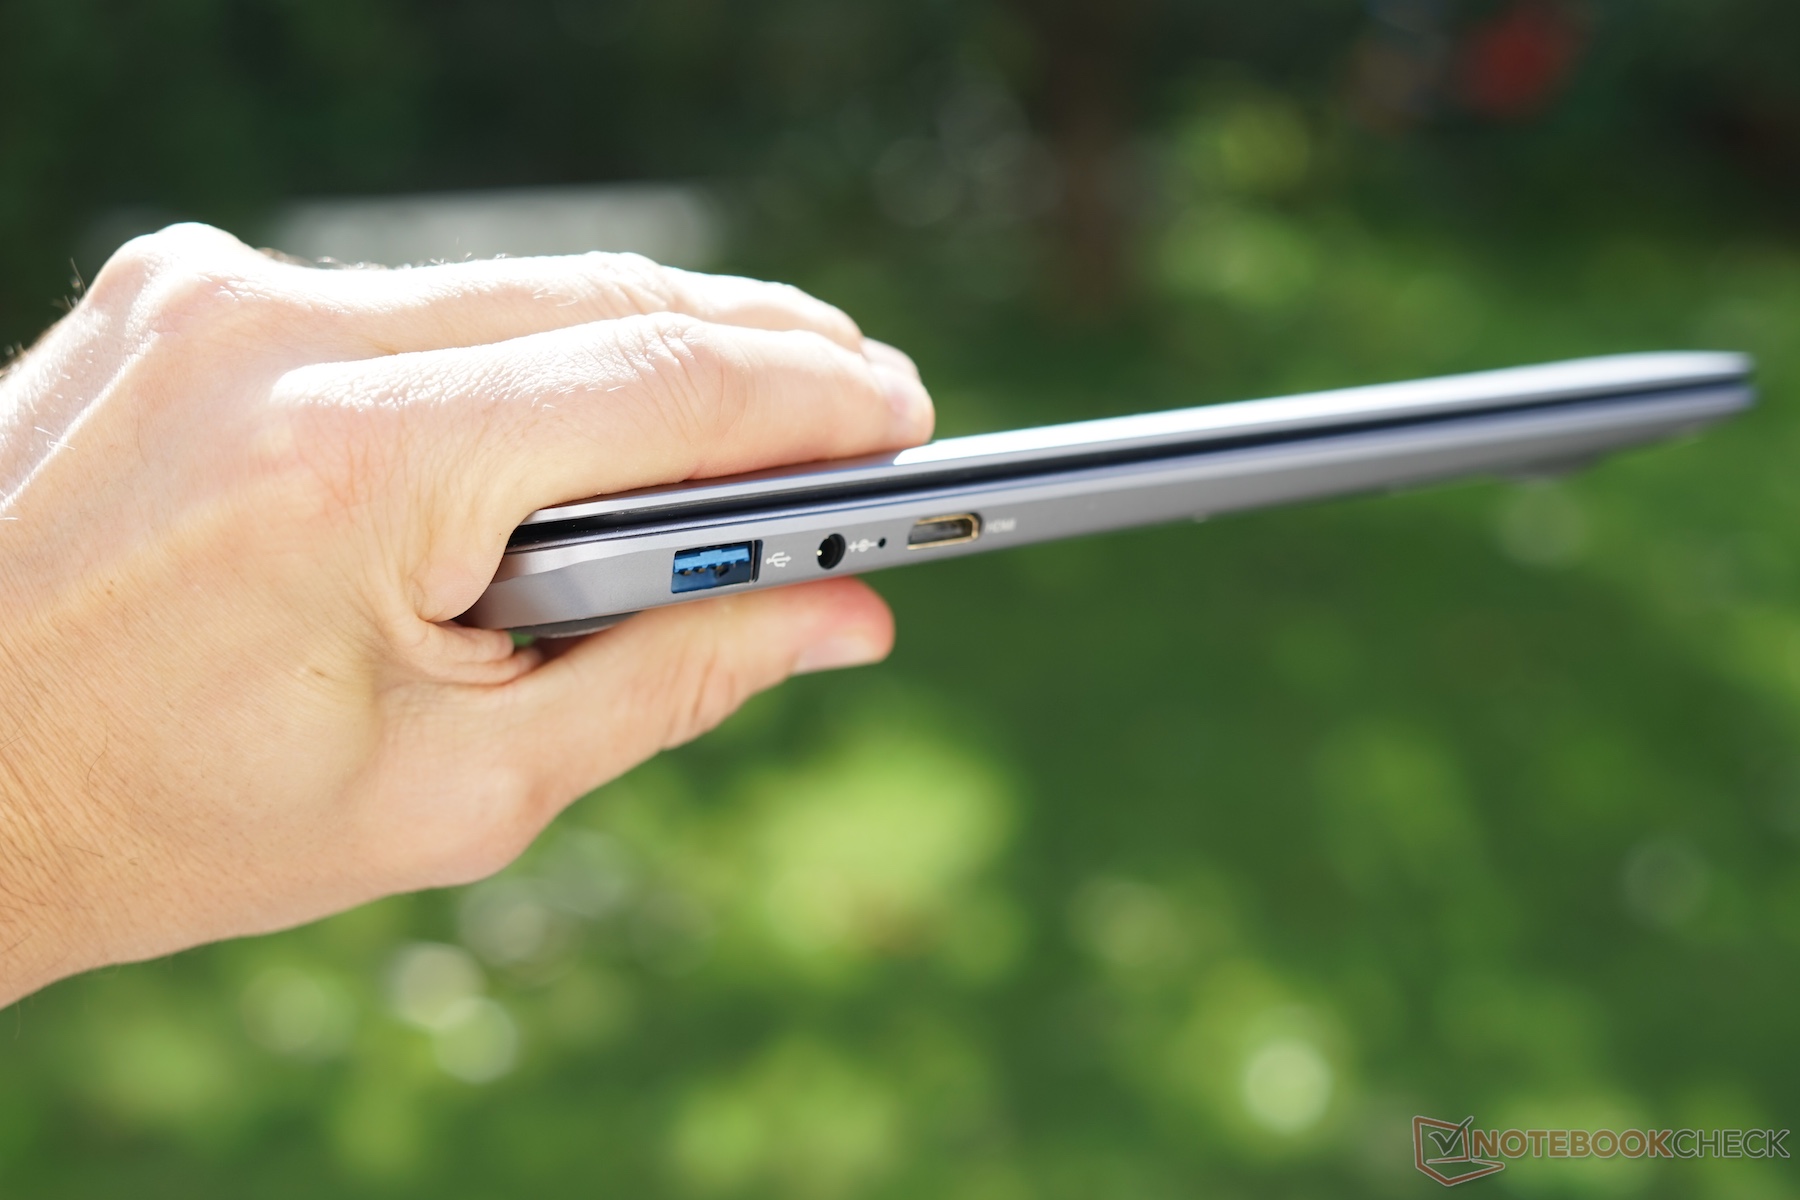
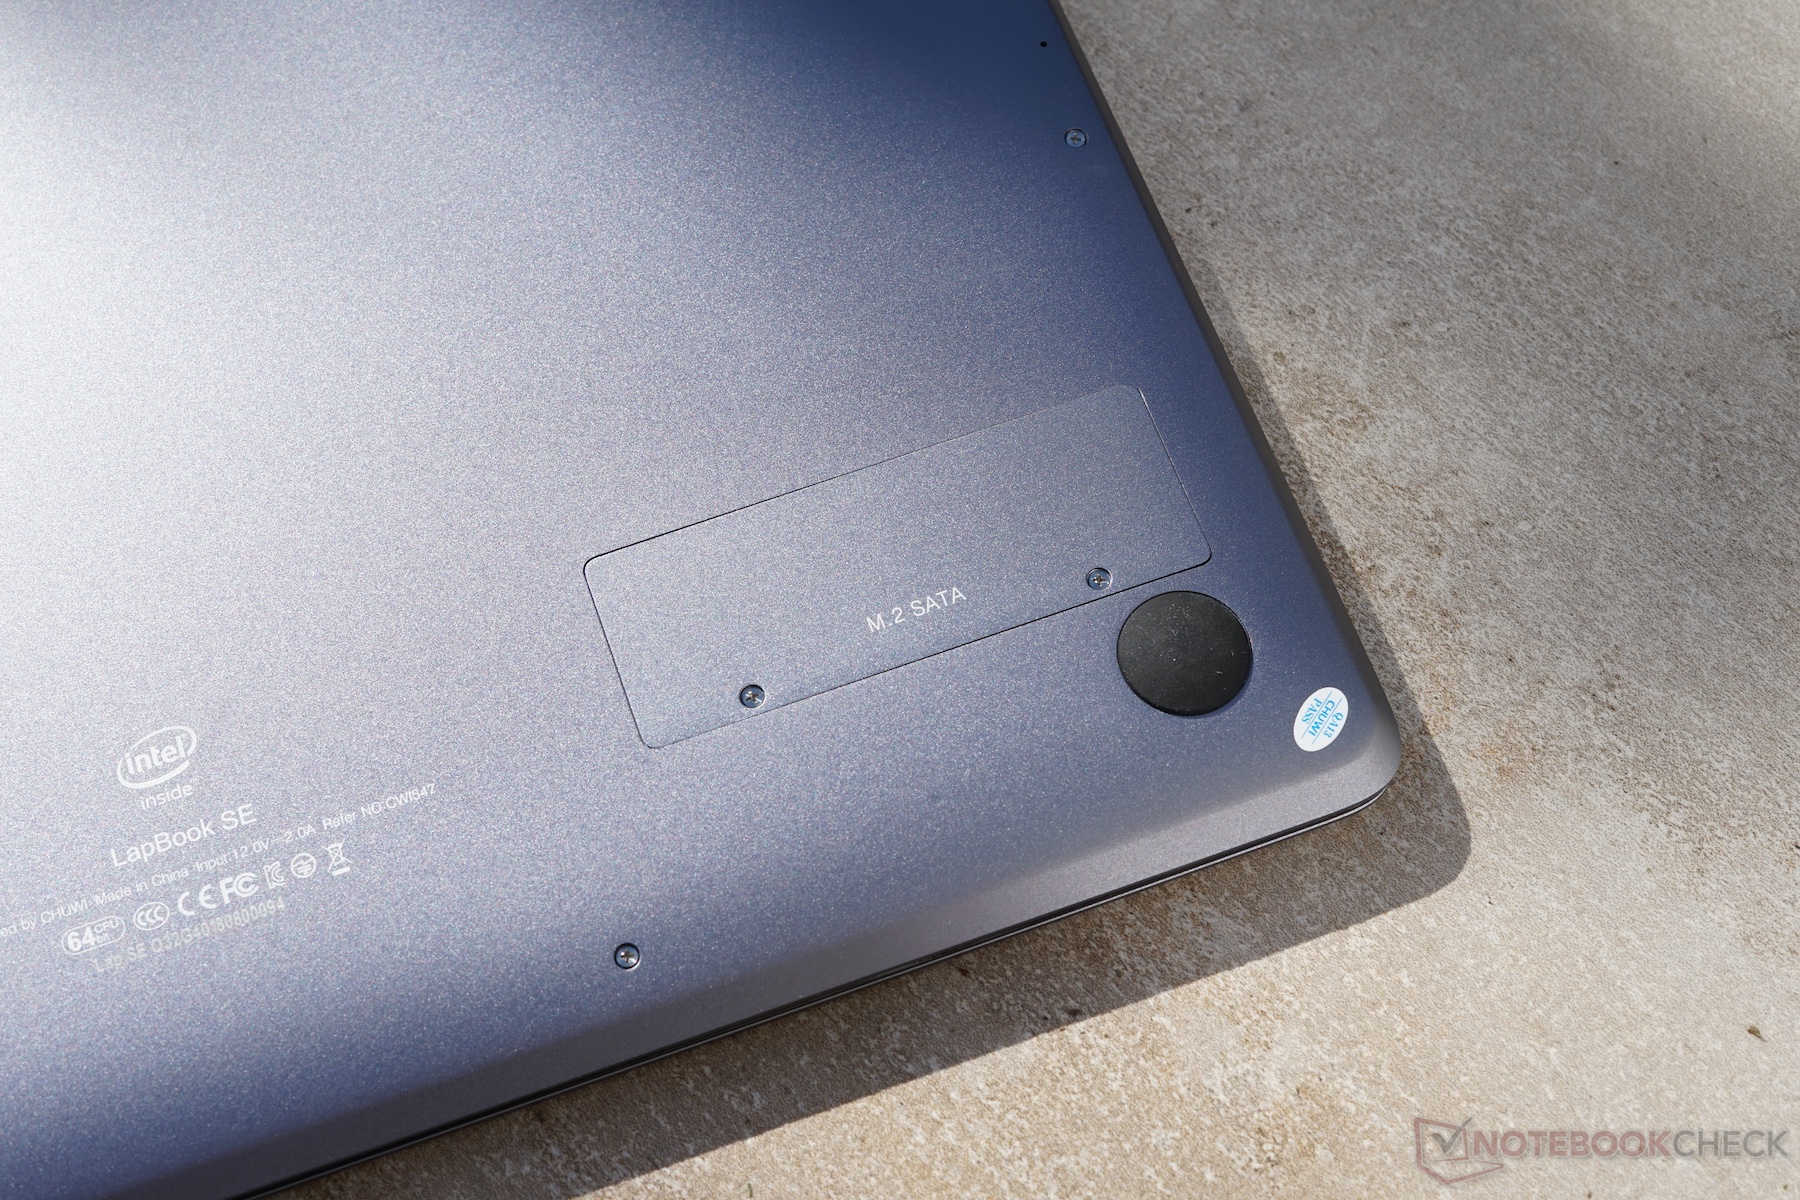
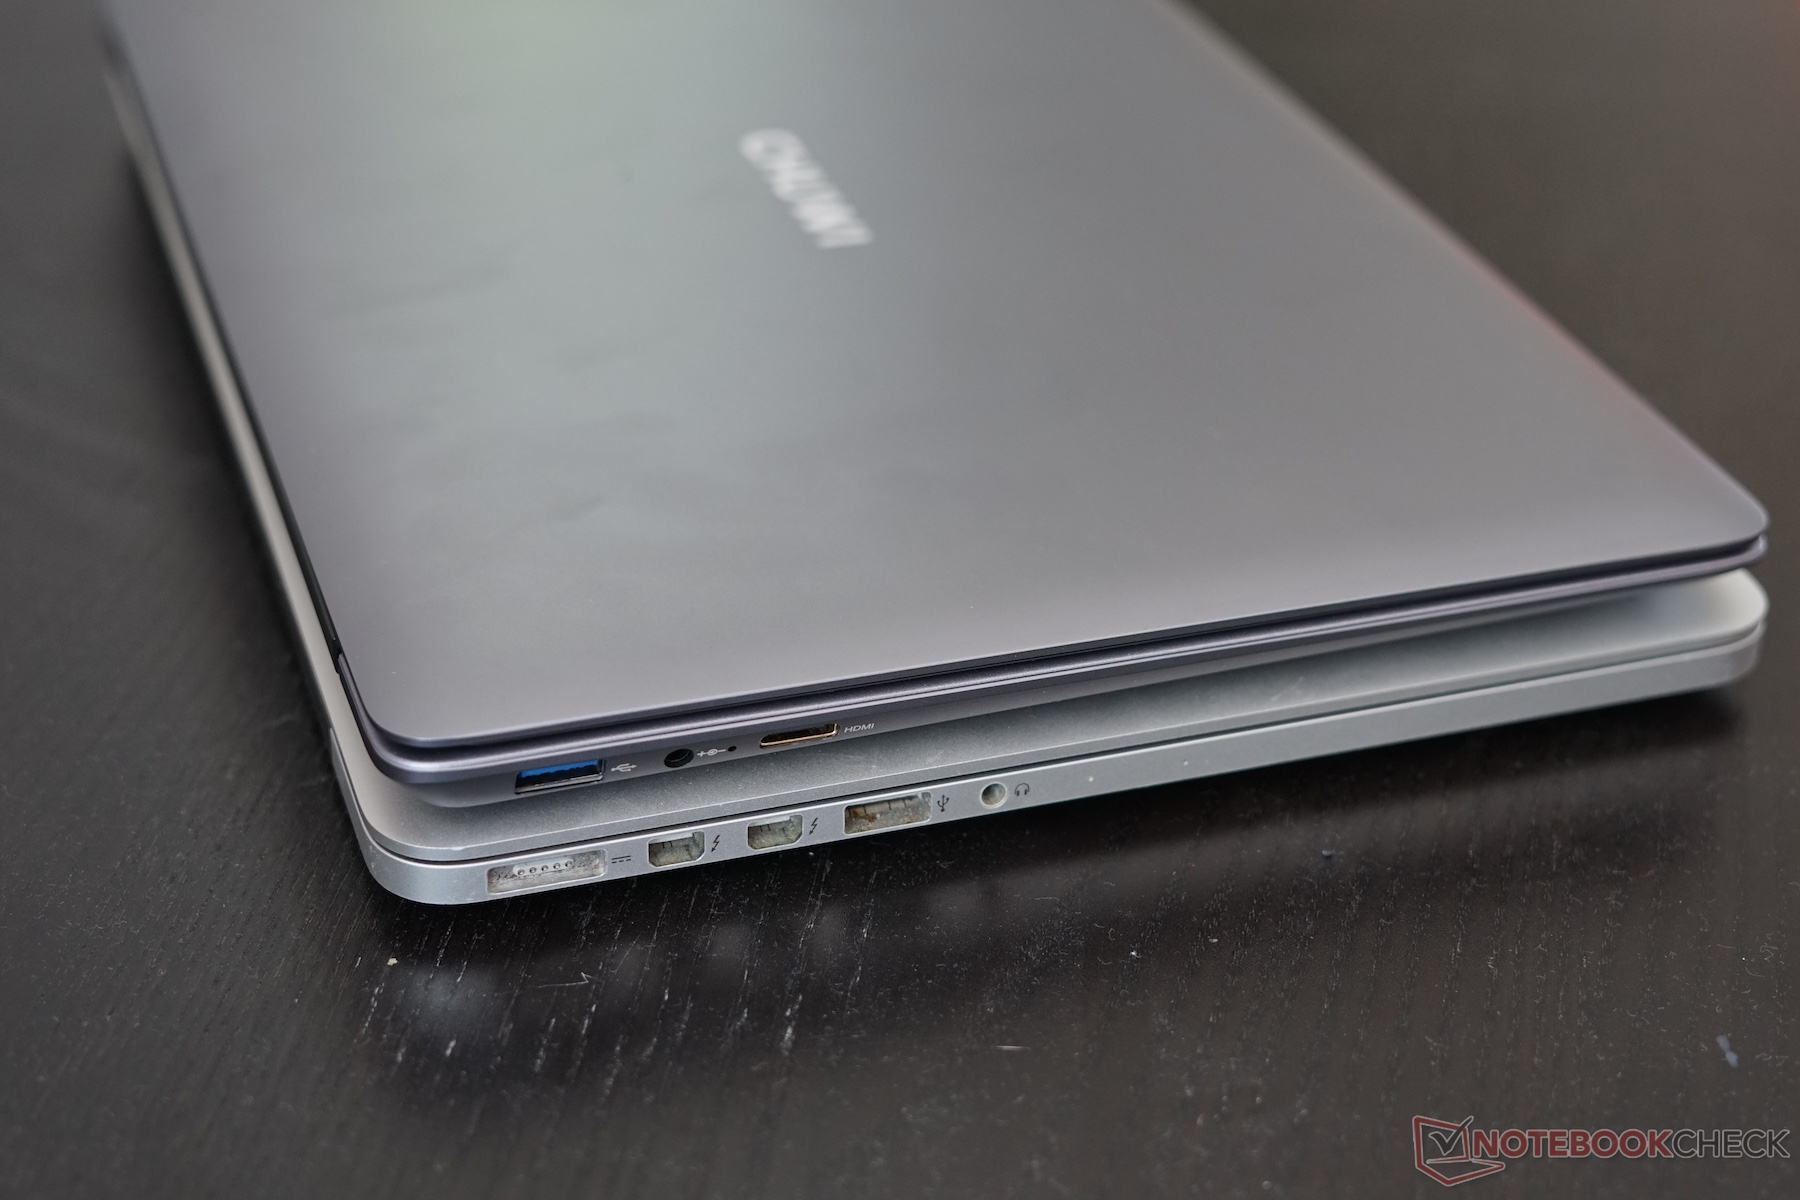
O Chuwi LapBook SE é um portátil chinês acessível que parece consideravelmente mais caro e premium do que é. O SSD facilmente trocável é um bônus, mas gostaríamos de ver uma porta USB Type-C.
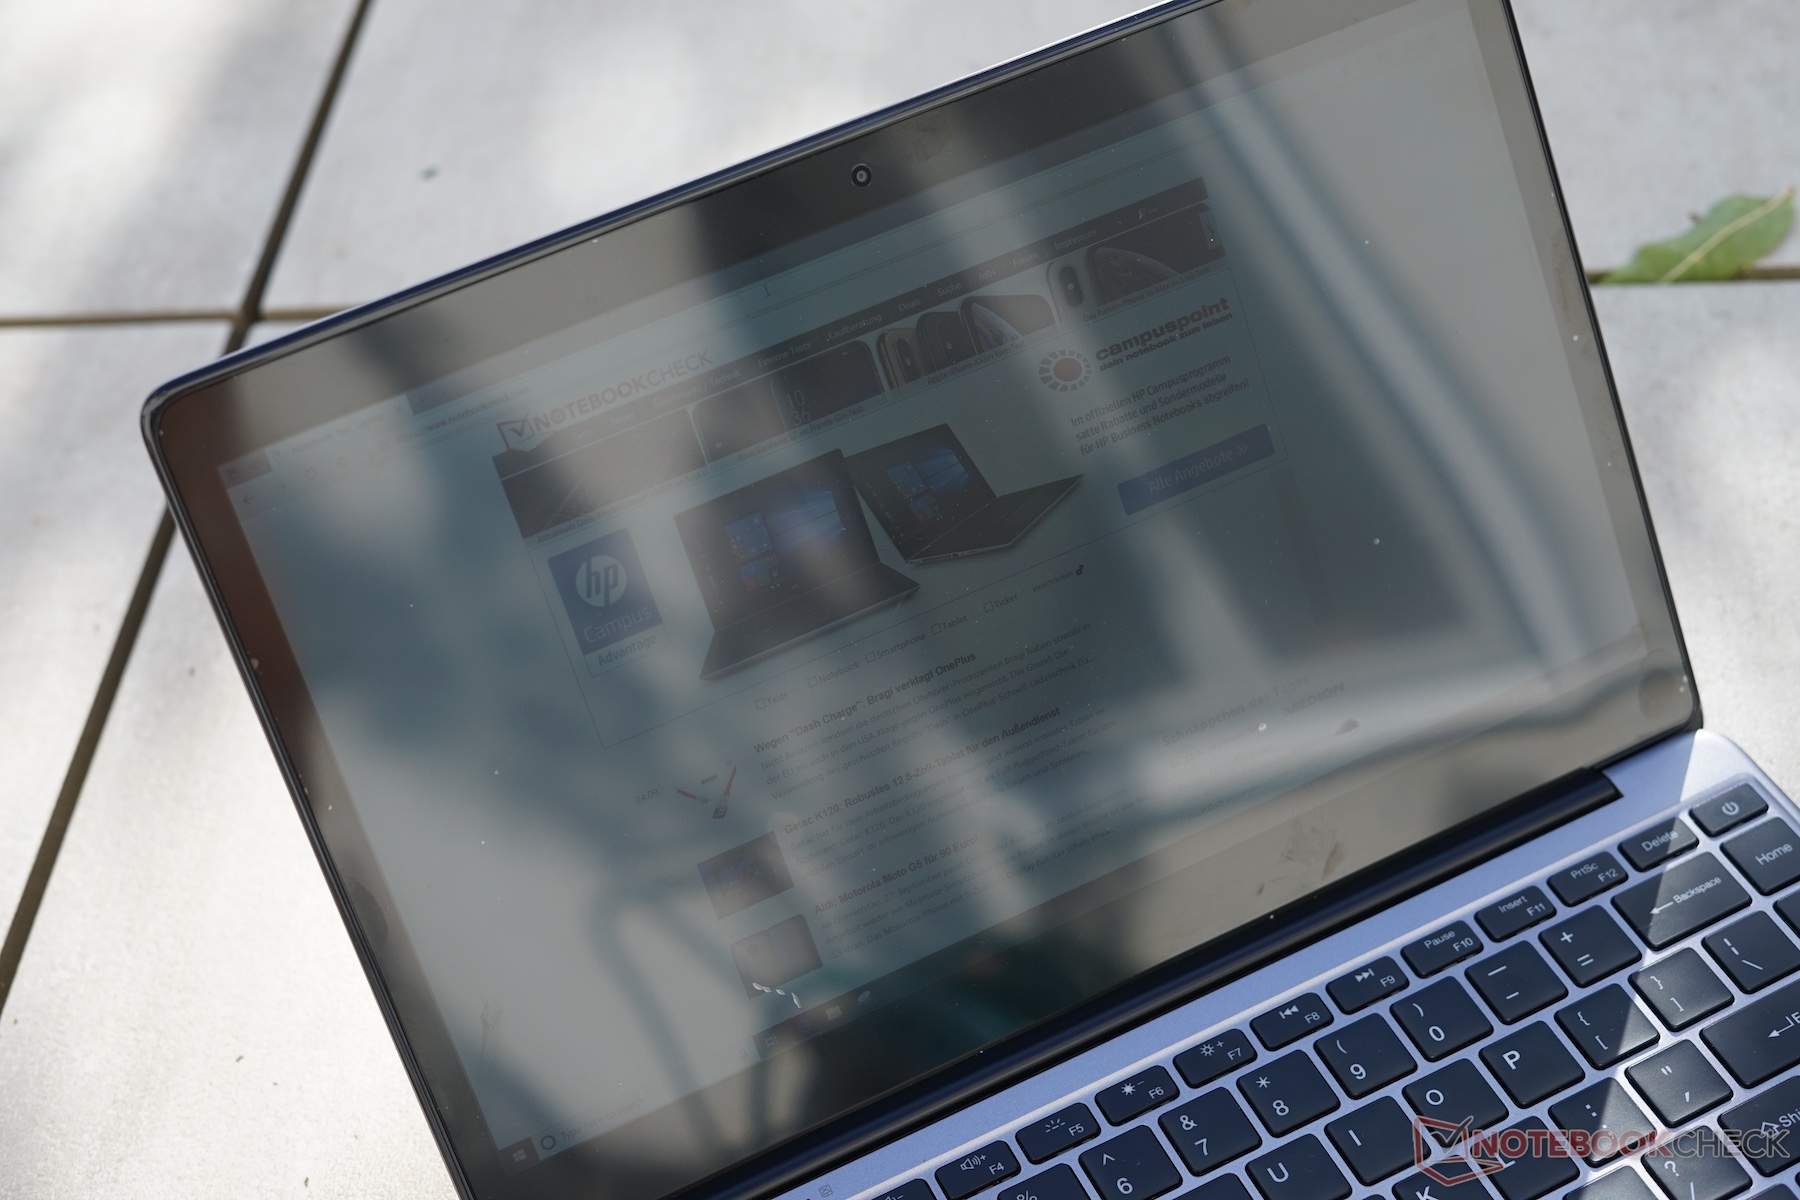
Os dispositivos de entrada também são bons pelo dinheiro, mas a tela diminui a avaliação com sua má luminosidade máxima. Os alto falantes são outro ponto negativo, mas, felizmente, o conector de fone de ouvido fornece áudio limpo. Além disso, a CPU quad-core é poderosa, mas o desempenho comparativamente fraco da GPU é desanimador.
O Chuwi LapBook SE é um portátil incrivelmente bom pelo dinheiro, mas é prejudicado por uma tela escura, alto-falantes fracos e desempenho de GPU relativamente ruim.
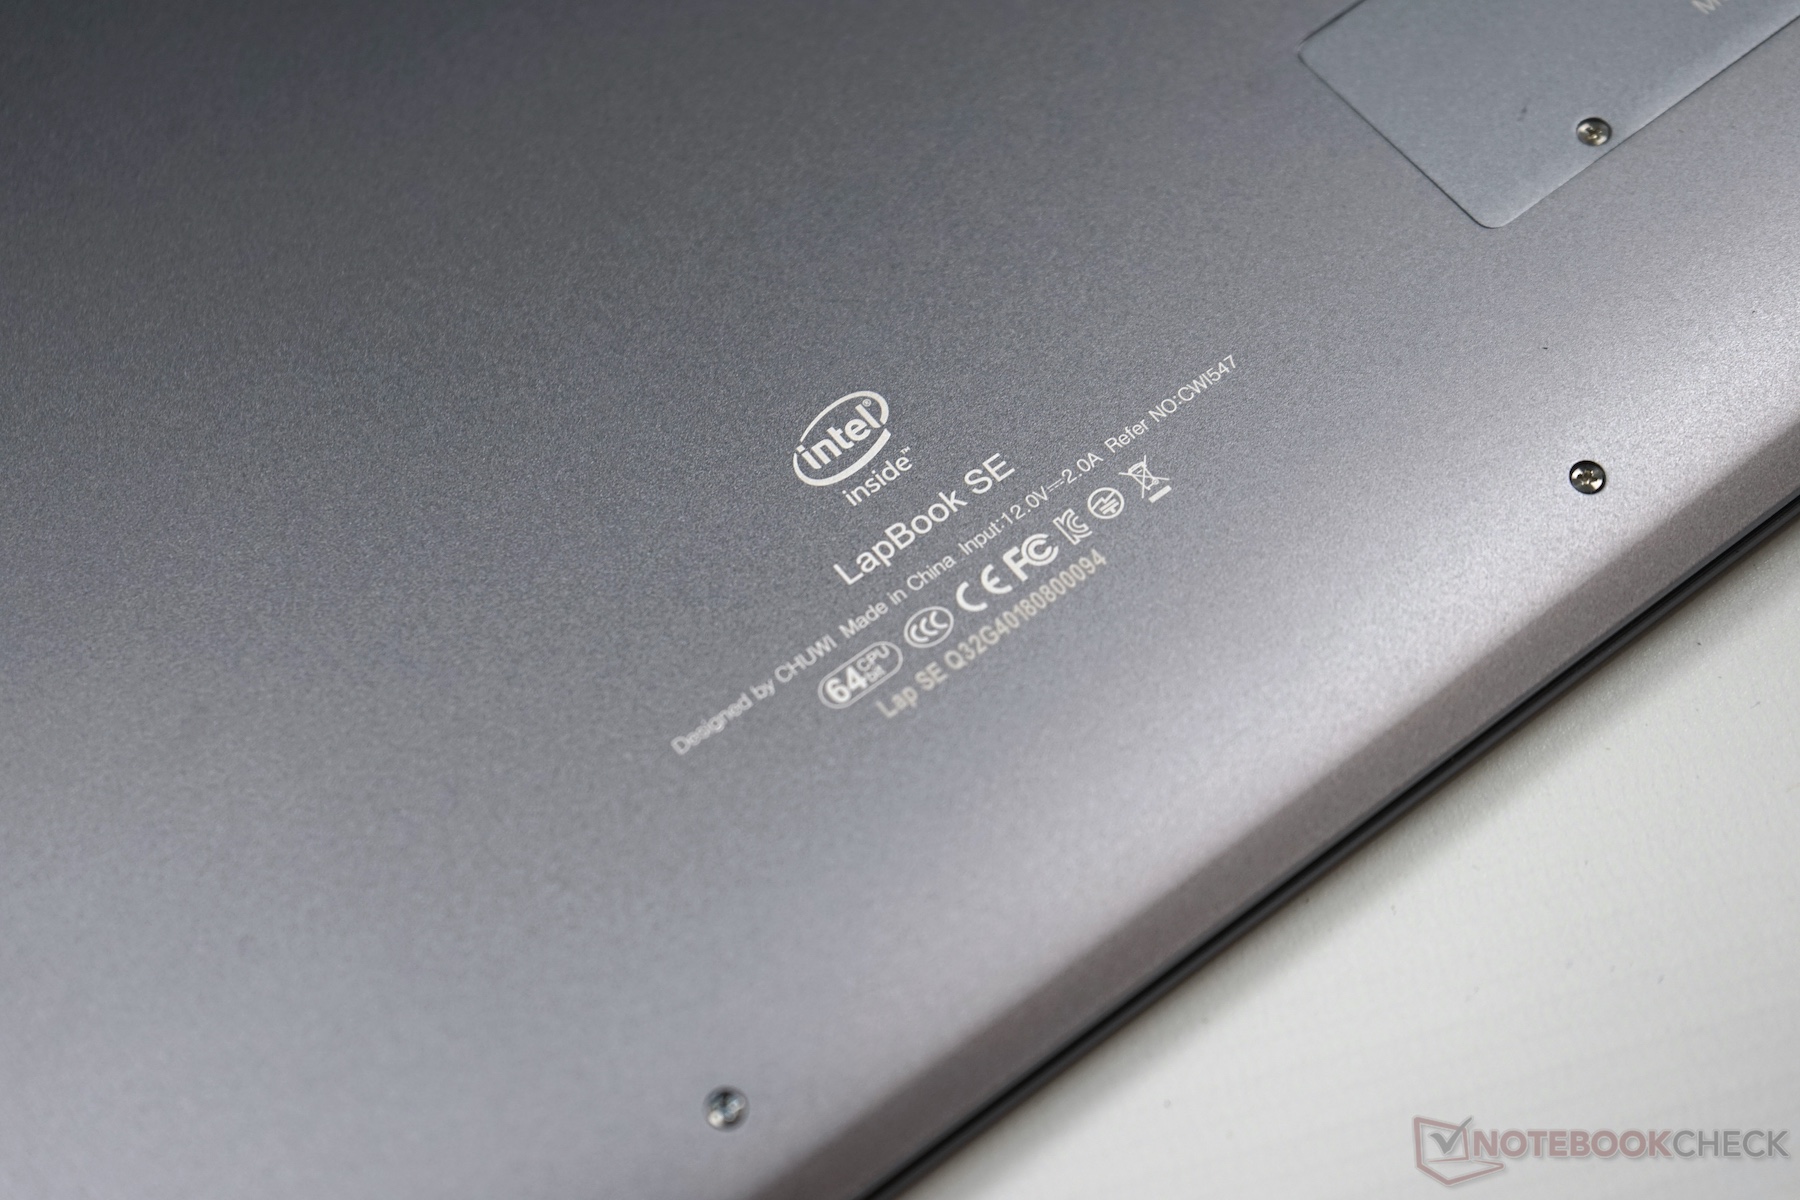
O LapBook SE custa cerca de €245 / $280 incluindo o envio, mas não com os cargos e impostos associados à importação de um dispositivo da China. Recomendamos que você pesquise os riscos de importar um dispositivo da China, pois não há garantia de receber garantia do fabricante e pode haver impostos adicionais.
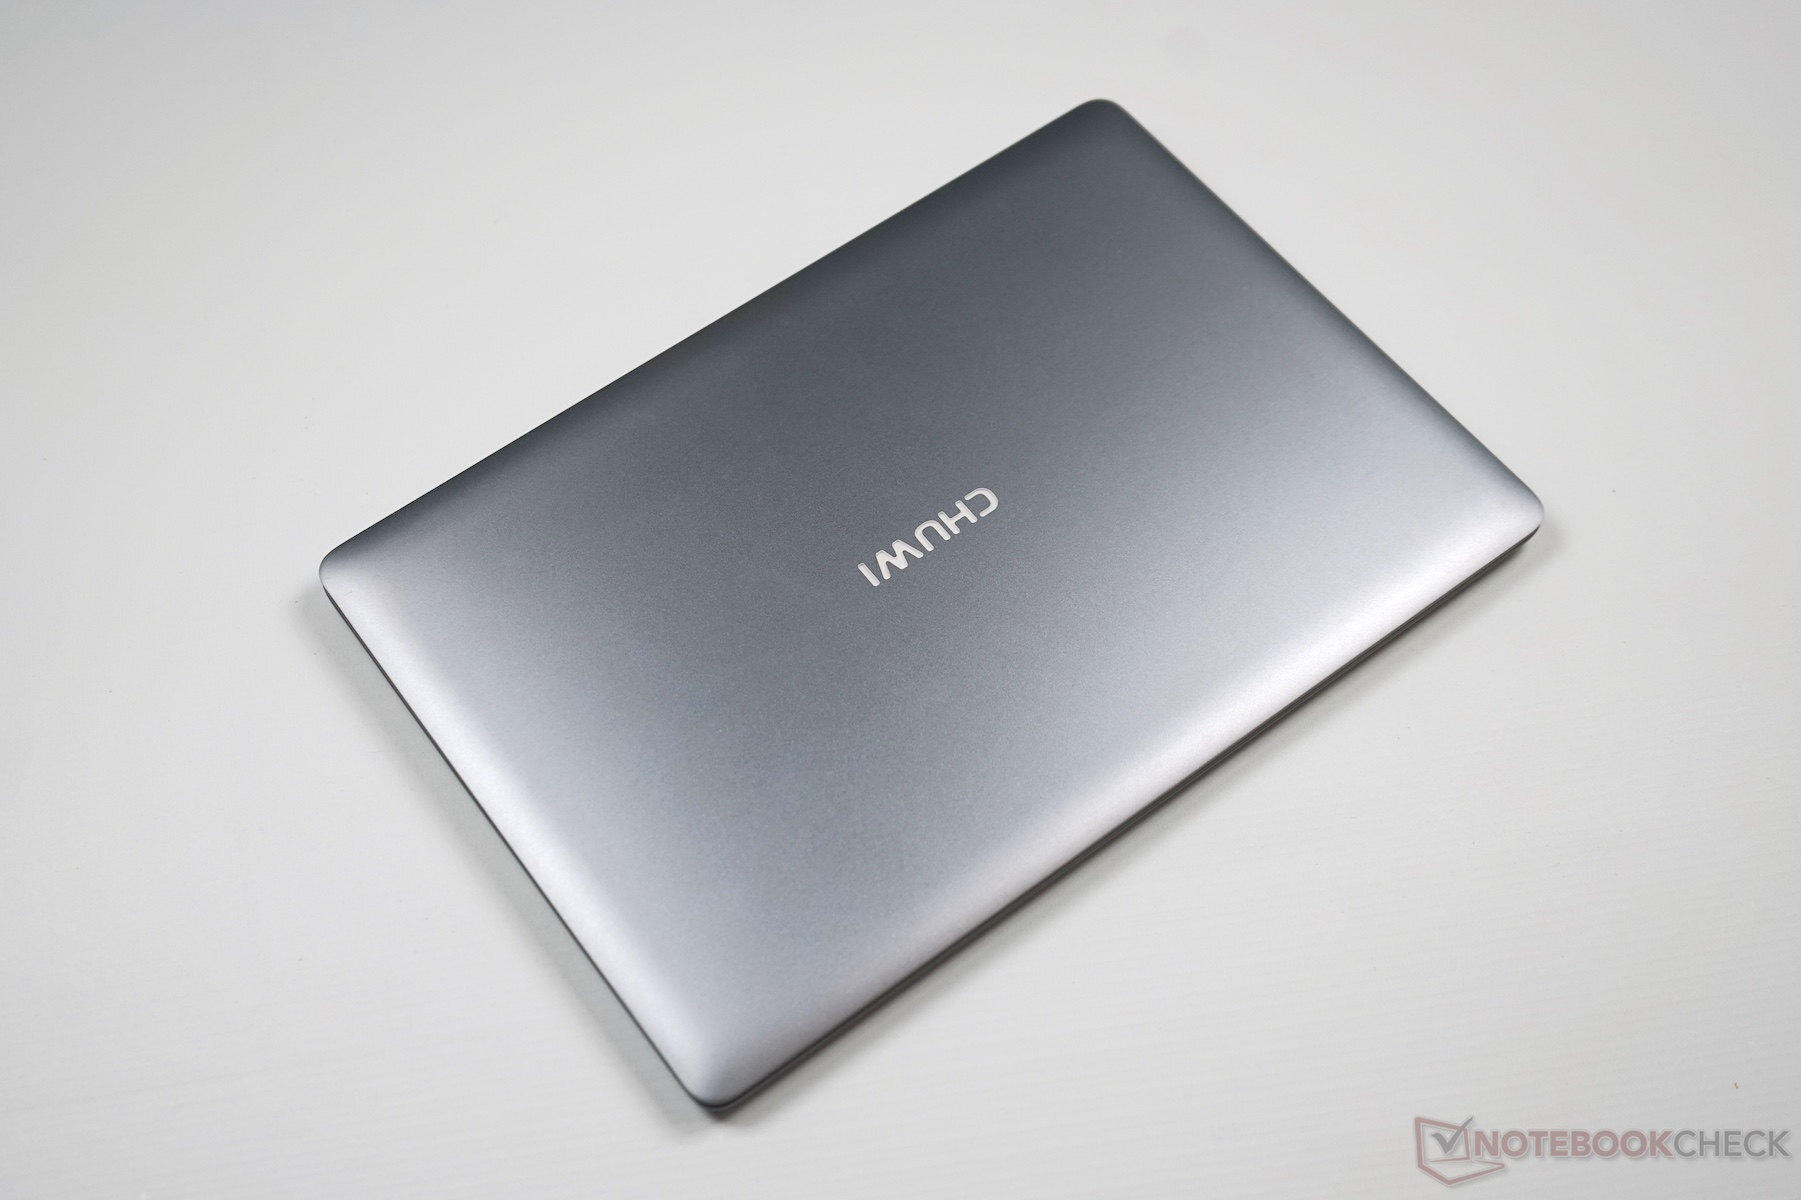
Chuwi LapBook SE
- 10/02/2018 v6 (old)
Klaus Hinum
Price comparison
