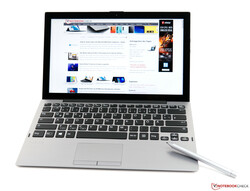
Breve Análise do Conversível VAIO A12 (Core i7-8500Y, 16 GB RAM, SSD de 512 GB, FHD)

| SD Card Reader | |
| average JPG Copy Test (av. of 3 runs) | |
| Dell Latitude 5290 2-in-1 (Toshiba Exceria Pro M501 UHS-II) | |
| Lenovo ThinkPad X1 Tablet G3-20KJ001NGE (Toshiba Exceria Pro M501 UHS-II) | |
| Microsoft Surface Pro 6, Core i7, 512 GB (Toshiba Exceria Pro M501 microSDXC 64GB) | |
| Média da turma Convertible (28.1 - 197, n=23, últimos 2 anos) | |
| VAIO A12-92993 (Toshiba Exceria Pro SDXC 64 GB UHS-II) | |
| maximum AS SSD Seq Read Test (1GB) | |
| Dell Latitude 5290 2-in-1 (Toshiba Exceria Pro M501 UHS-II) | |
| Média da turma Convertible (28.9 - 254, n=22, últimos 2 anos) | |
| Microsoft Surface Pro 6, Core i7, 512 GB (Toshiba Exceria Pro M501 microSDXC 64GB) | |
| Lenovo ThinkPad X1 Tablet G3-20KJ001NGE (Toshiba Exceria Pro M501 UHS-II) | |
| VAIO A12-92993 (Toshiba Exceria Pro SDXC 64 GB UHS-II) | |
| |||||||||||||||||||||||||
iluminação: 89 %
iluminação com acumulador: 315 cd/m²
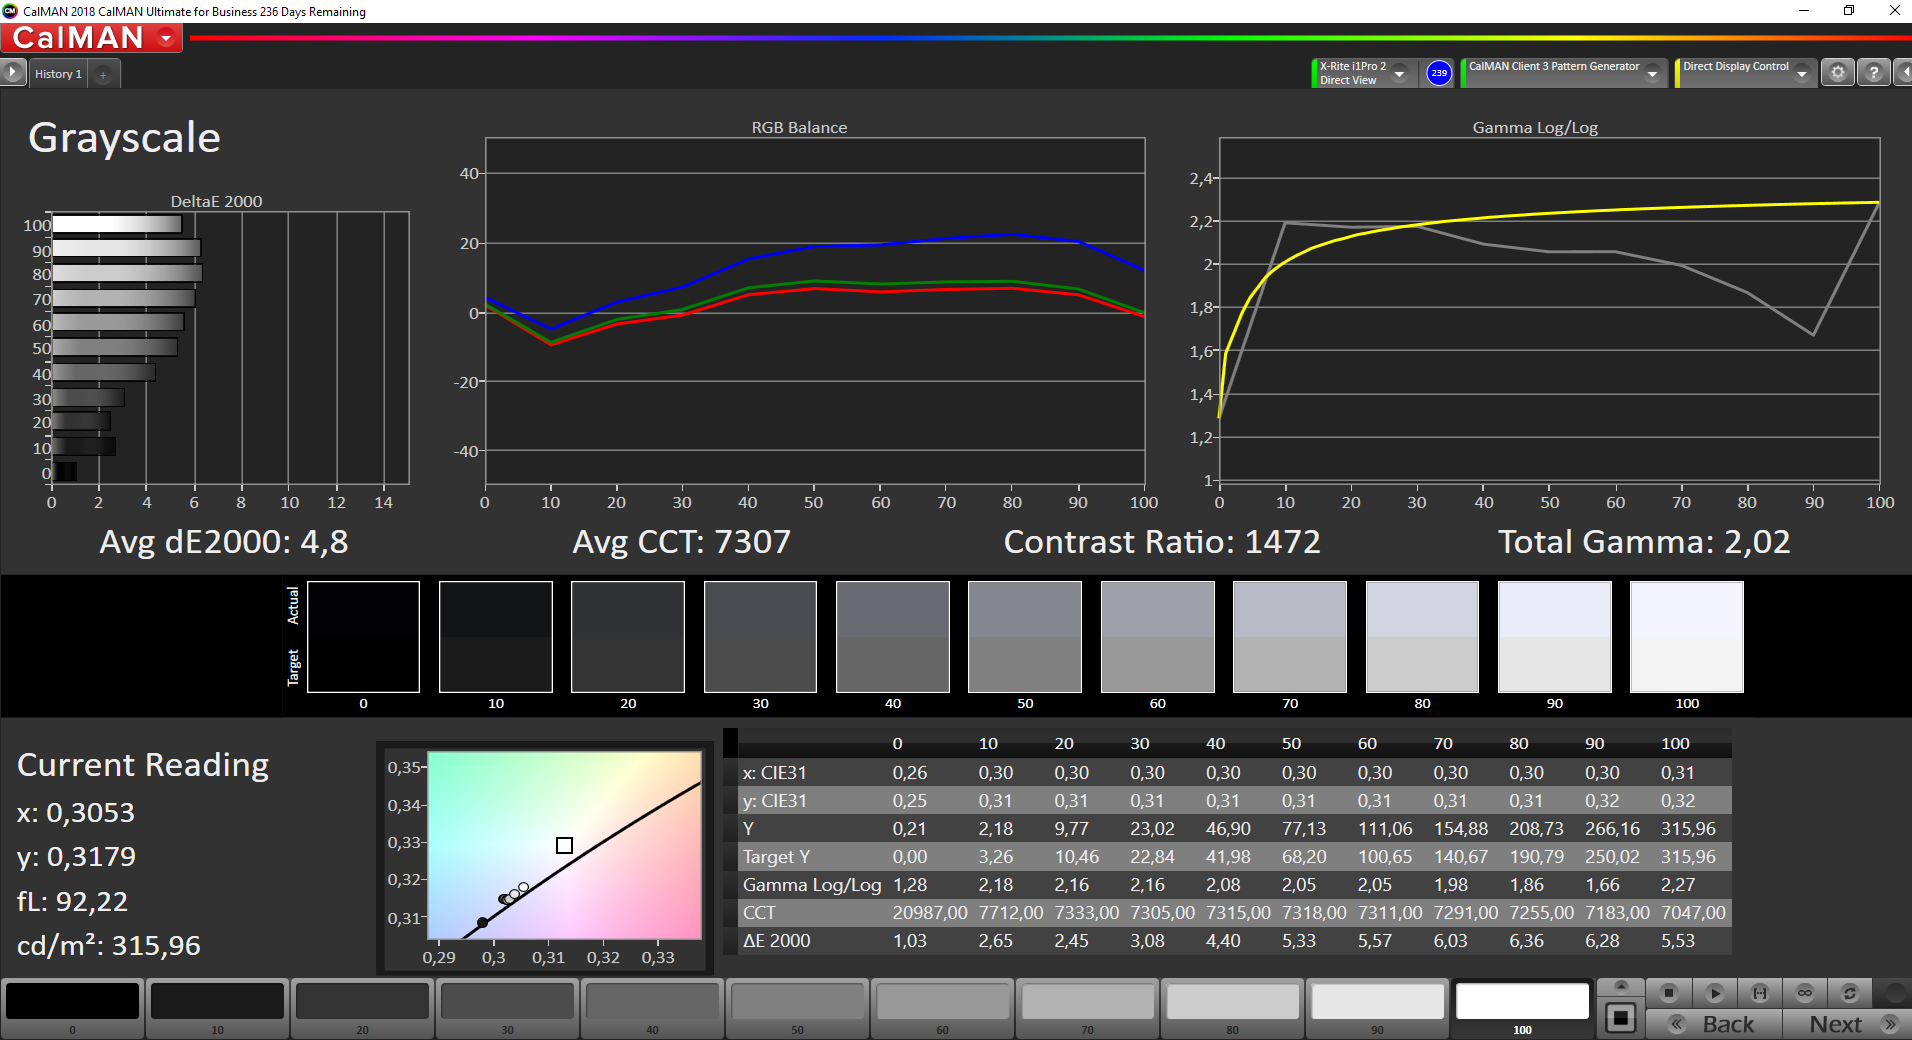
Contraste: 1500:1 (Preto: 0.21 cd/m²)
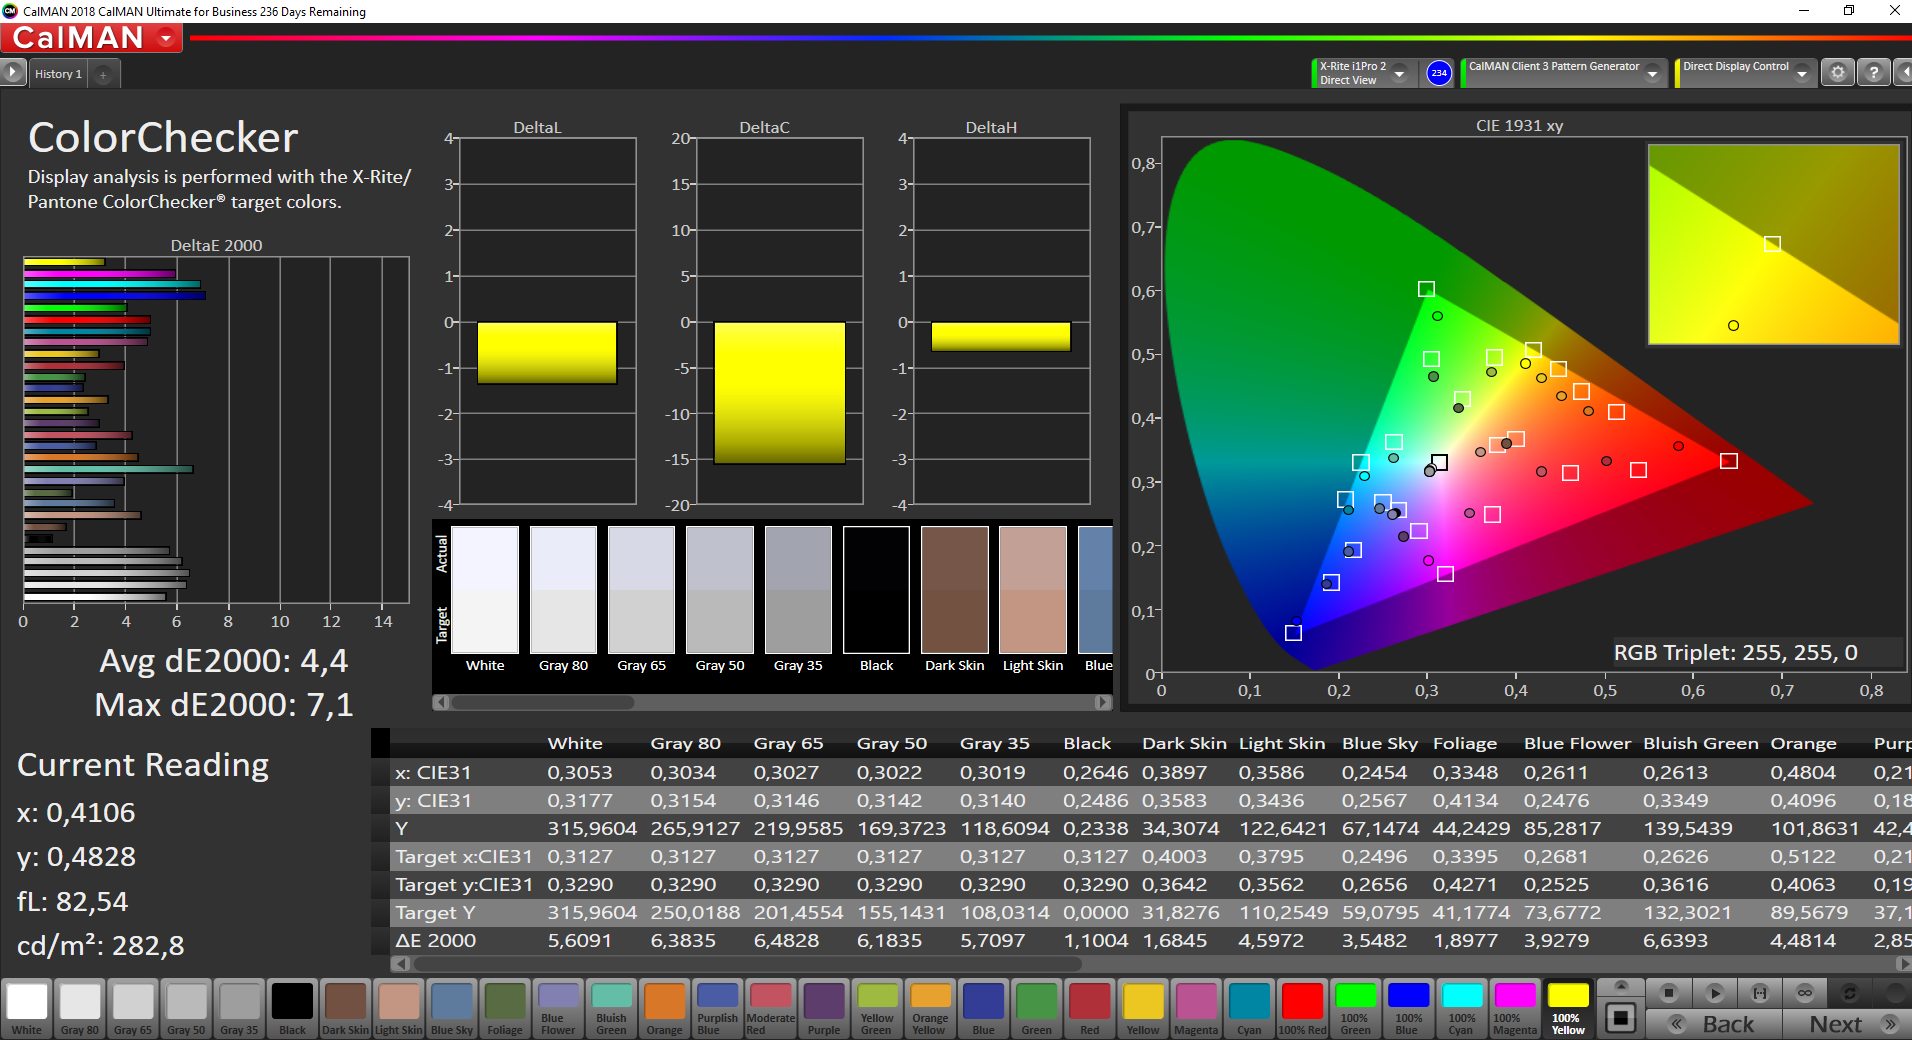
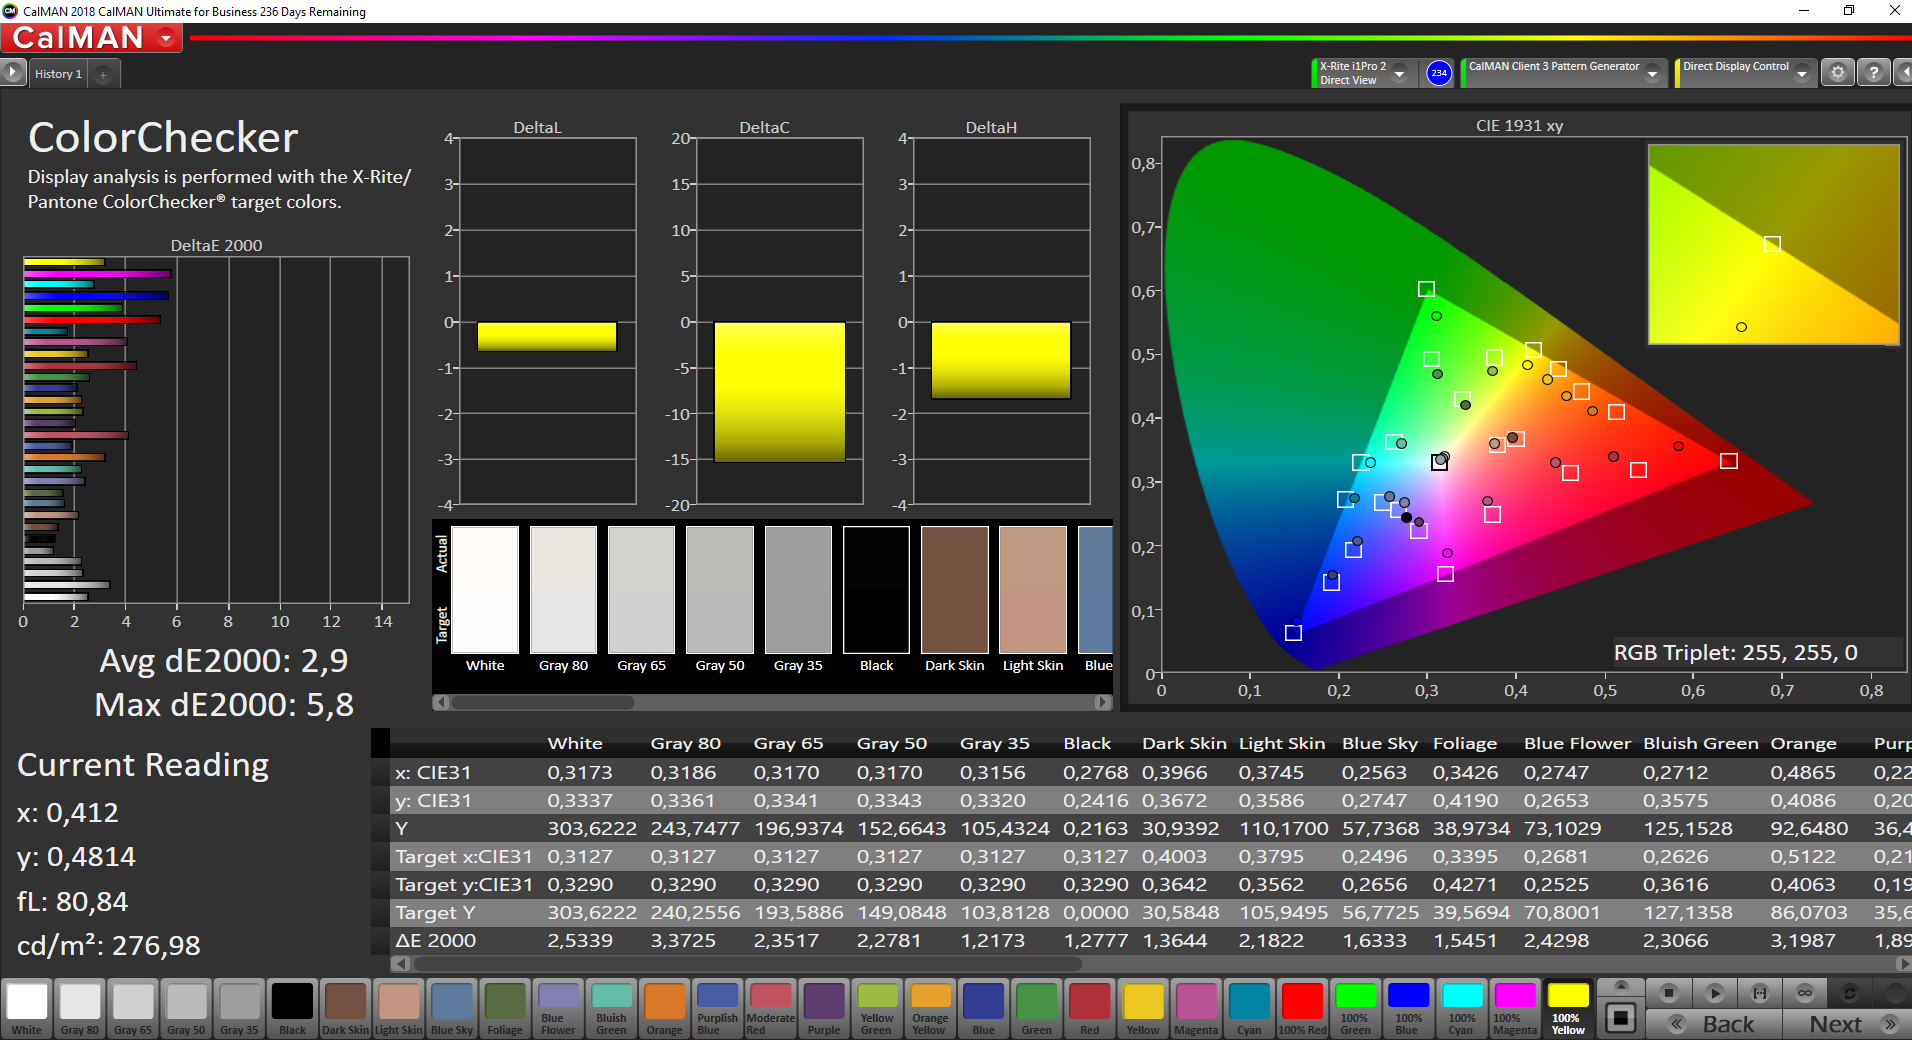
ΔE ColorChecker Calman: 4.4 | ∀{0.5-29.43 Ø4.73}
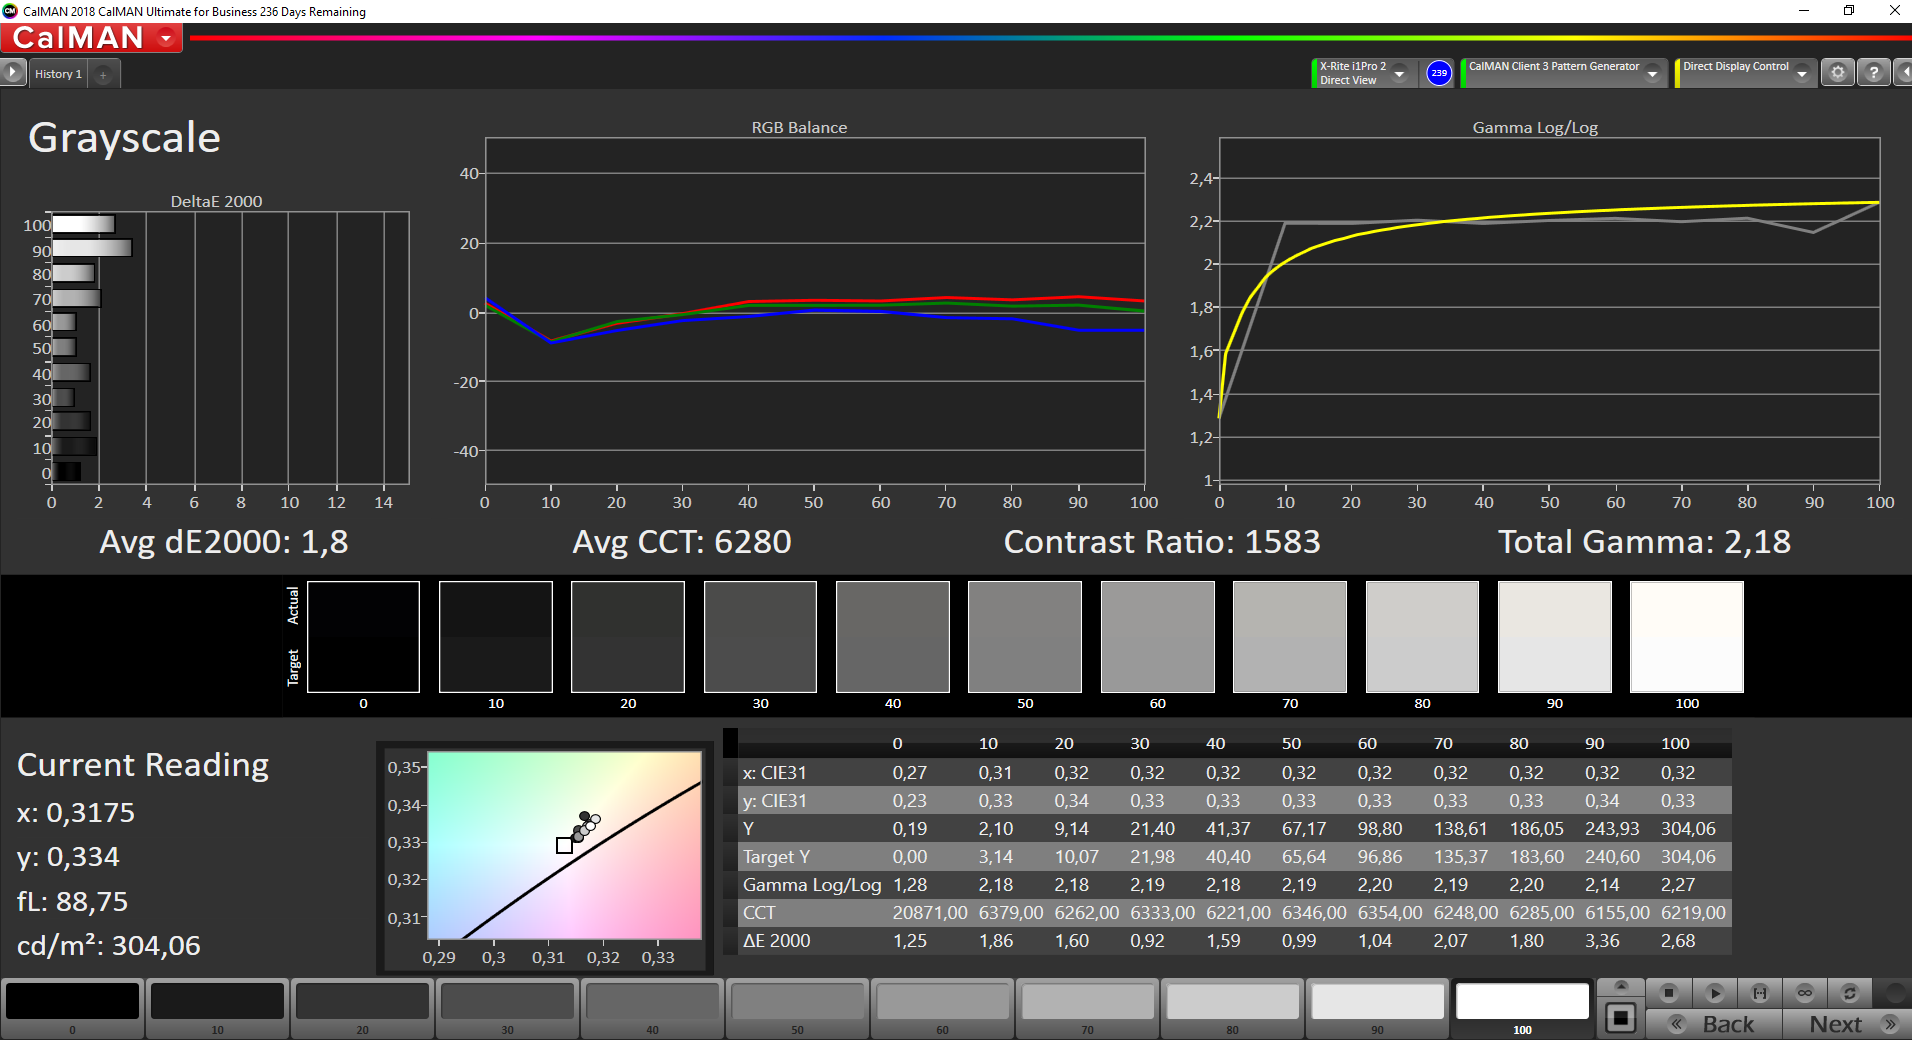
calibrated: 2.9
ΔE Greyscale Calman: 4.8 | ∀{0.09-98 Ø4.97}
69.5% sRGB (Argyll 1.6.3 3D)
44% AdobeRGB 1998 (Argyll 1.6.3 3D)
47.52% AdobeRGB 1998 (Argyll 3D)
69.3% sRGB (Argyll 3D)
46% Display P3 (Argyll 3D)
Gamma: 2.02
CCT: 7307 K
| VAIO A12-92993 InfoVision IVO04E6, , 1920x1080, 12.5" | Microsoft Surface Pro 6, Core i7, 512 GB LGPhilips LP123WQ112604, , 2736x1824, 12.3" | Dell Latitude 5290 2-in-1 SHP1479, , 1920x1280, 12.3" | Lenovo ThinkPad X1 Tablet G3-20KJ001NGE LP130QP1-SPA1, , 3000x2000, 13" | HP Elite x2 1013 G3-2TT14EA AU Optronics AUO101A, , 3000x2000, 13" | HP Spectre Folio 13t-ak000 AU Optronics AUO572D, , 1920x1080, 13.3" | |
|---|---|---|---|---|---|---|
| Display | 42% | 48% | 46% | 44% | 43% | |
| Display P3 Coverage (%) | 46 | 67.1 46% | 70.5 53% | 68.1 48% 67.8 47% | 67.5 47% | 66.2 44% |
| sRGB Coverage (%) | 69.3 | 95.5 38% | 98.6 42% | 99.4 43% 99.1 43% | 96.7 40% | 97.4 41% |
| AdobeRGB 1998 Coverage (%) | 47.52 | 67.9 43% | 71.5 50% | 69.9 47% 69.3 46% | 68.2 44% | 68.1 43% |
| Response Times | 19% | -13% | -14% | 13% | -10% | |
| Response Time Grey 50% / Grey 80% * (ms) | 52.8 ? | 43 ? 19% | 56.8 ? -8% | 47.2 ? 11% | 47 ? 11% | 52 ? 2% |
| Response Time Black / White * (ms) | 30.4 ? | 25 ? 18% | 36 ? -18% | 42.4 ? -39% | 26 ? 14% | 37.2 ? -22% |
| PWM Frequency (Hz) | 990 ? | 22000 ? | 1852 ? | |||
| Screen | 19% | 10% | 20% | 5% | 22% | |
| Brightness middle (cd/m²) | 315 | 484 54% | 548 74% | 474 50% | 452 43% | 389.8 24% |
| Brightness (cd/m²) | 294 | 473 61% | 545 85% | 418 42% | 412 40% | 396 35% |
| Brightness Distribution (%) | 89 | 91 2% | 86 -3% | 76 -15% | 85 -4% | 88 -1% |
| Black Level * (cd/m²) | 0.21 | 0.33 -57% | 0.51 -143% | 0.33 -57% | 0.48 -129% | 0.27 -29% |
| Contrast (:1) | 1500 | 1467 -2% | 1075 -28% | 1436 -4% | 942 -37% | 1444 -4% |
| Colorchecker dE 2000 * | 4.4 | 4.29 2% | 3.65 17% | 3.2 27% | 4.05 8% | 2.72 38% |
| Colorchecker dE 2000 max. * | 7.1 | 6.46 9% | 7.15 -1% | 6.1 14% | 6.64 6% | 5.49 23% |
| Colorchecker dE 2000 calibrated * | 2.9 | 1.34 54% | 1.81 38% | 0.9 69% | 1.56 46% | 1.25 57% |
| Greyscale dE 2000 * | 4.8 | 4.3 10% | 5.5 -15% | 4.5 6% | 4.87 -1% | 4.2 12% |
| Gamma | 2.02 109% | 2.51 88% | 2.154 102% | 2.07 106% | 2.71 81% | 2.1 105% |
| CCT | 7307 89% | 7315 89% | 7052 92% | 5881 111% | 7160 91% | 7470 87% |
| Color Space (Percent of AdobeRGB 1998) (%) | 44 | 62 41% | 65.2 48% | 64 45% | 62 41% | 62.2 41% |
| Color Space (Percent of sRGB) (%) | 69.5 | 95 37% | 99.1 43% | 99.4 43% | 97 40% | 98.2 41% |
| Média Total (Programa/Configurações) | 27% /
23% | 15% /
15% | 17% /
25% | 21% /
13% | 18% /
22% |
* ... menor é melhor

Exibir tempos de resposta
| ↔ Tempo de resposta preto para branco | ||
|---|---|---|
| 30.4 ms ... ascensão ↗ e queda ↘ combinadas | ↗ 15.6 ms ascensão | 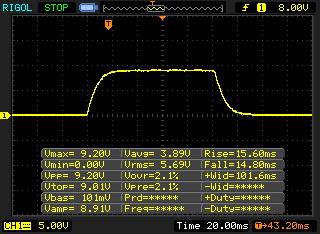 |
| ↘ 14.8 ms queda | ||
| A tela mostra taxas de resposta lentas em nossos testes e será insatisfatória para os jogadores. Em comparação, todos os dispositivos testados variam de 0.1 (mínimo) a 240 (máximo) ms. » 82 % de todos os dispositivos são melhores. Isso significa que o tempo de resposta medido é pior que a média de todos os dispositivos testados (19.9 ms). | ||
| ↔ Tempo de resposta 50% cinza a 80% cinza | ||
| 52.8 ms ... ascensão ↗ e queda ↘ combinadas | ↗ 24.4 ms ascensão | 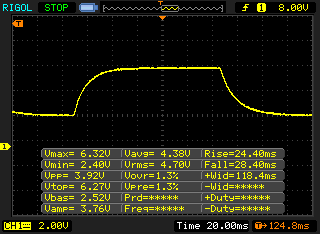 |
| ↘ 28.4 ms queda | ||
| A tela mostra taxas de resposta lentas em nossos testes e será insatisfatória para os jogadores. Em comparação, todos os dispositivos testados variam de 0.165 (mínimo) a 636 (máximo) ms. » 89 % de todos os dispositivos são melhores. Isso significa que o tempo de resposta medido é pior que a média de todos os dispositivos testados (31.1 ms). | ||
Cintilação da tela / PWM (modulação por largura de pulso)
| Tela tremeluzindo/PWM detectado | 990 Hz | ≤ 99 % configuração de brilho | 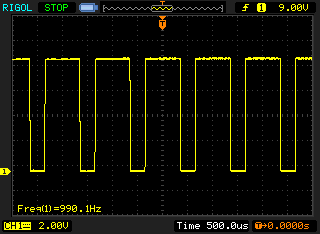 |
A luz de fundo da tela pisca em 990 Hz (pior caso, por exemplo, utilizando PWM) Cintilação detectada em uma configuração de brilho de 99 % e abaixo. Não deve haver cintilação ou PWM acima desta configuração de brilho. A frequência de 990 Hz é bastante alta, então a maioria dos usuários sensíveis ao PWM não deve notar nenhuma oscilação. [pwm_comparison] Em comparação: 52 % de todos os dispositivos testados não usam PWM para escurecer a tela. Se PWM foi detectado, uma média de 7784 (mínimo: 5 - máximo: 343500) Hz foi medida. | |||

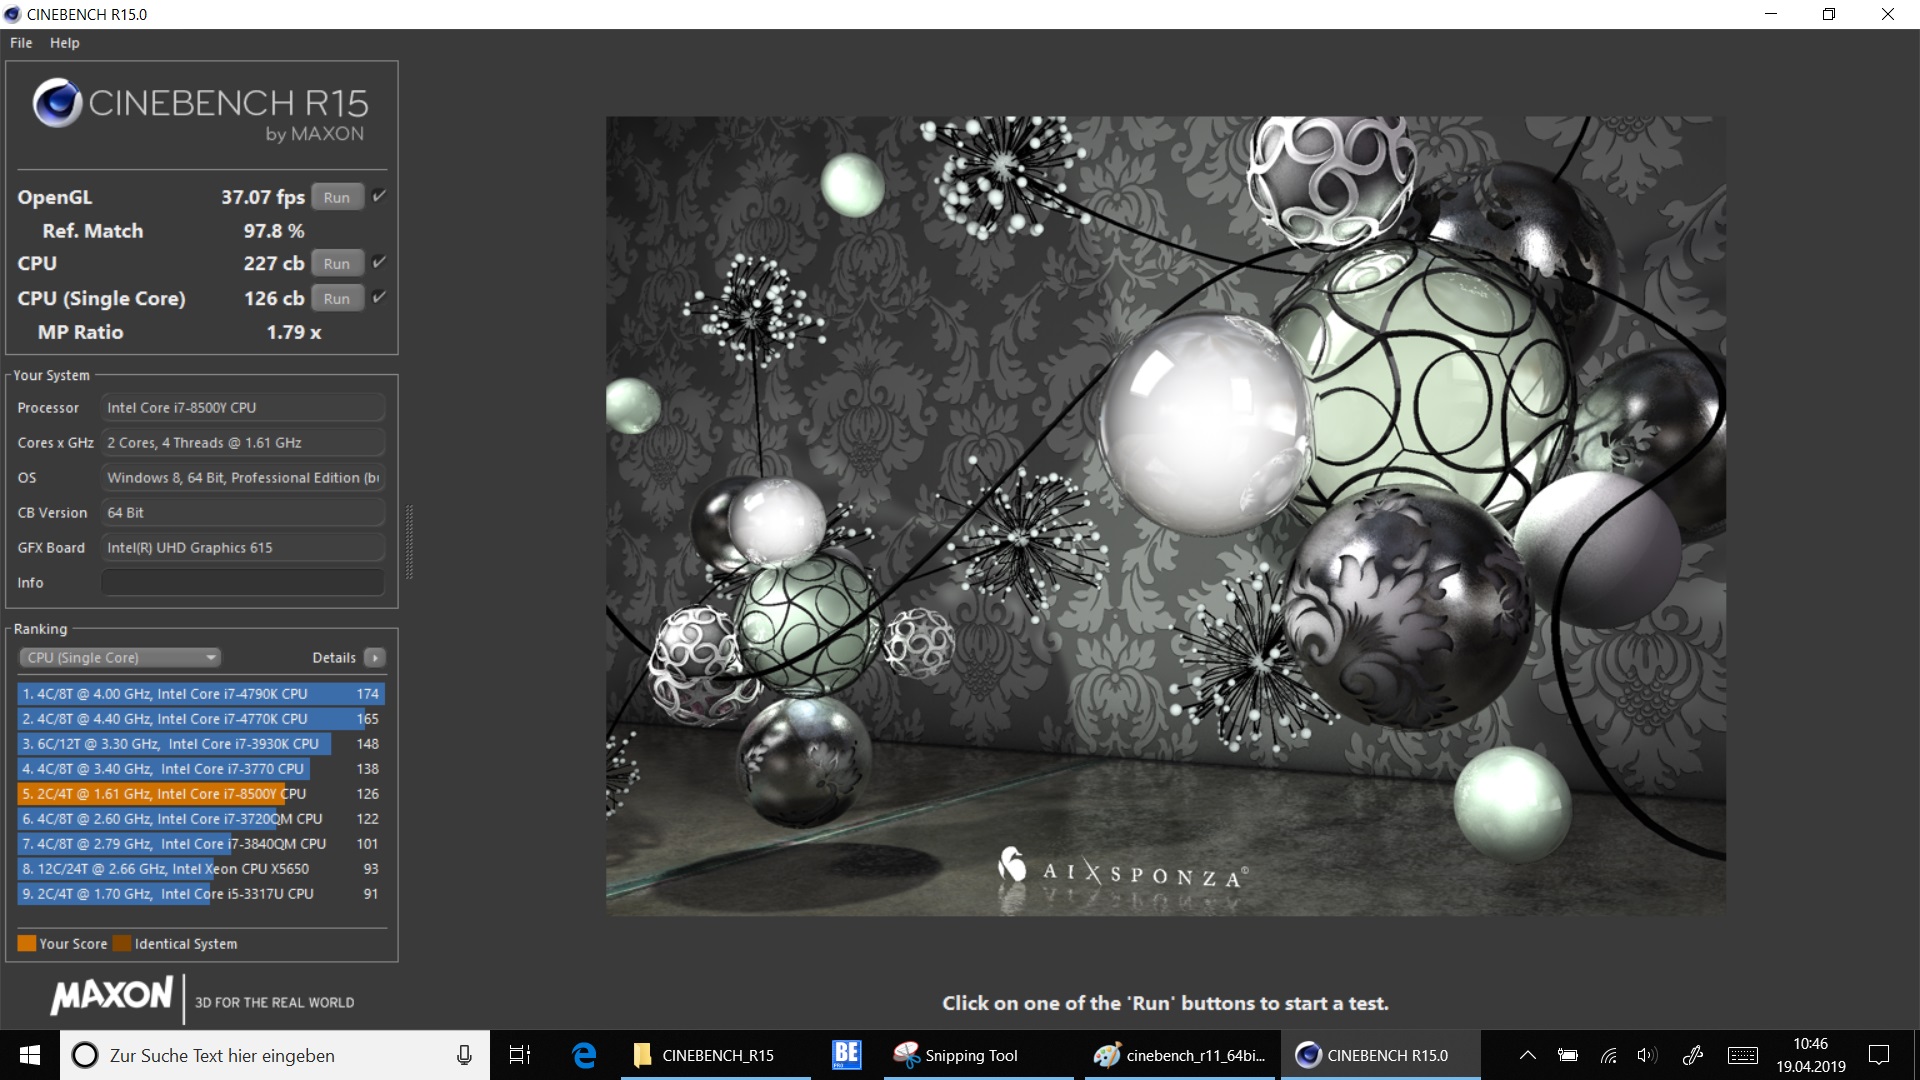
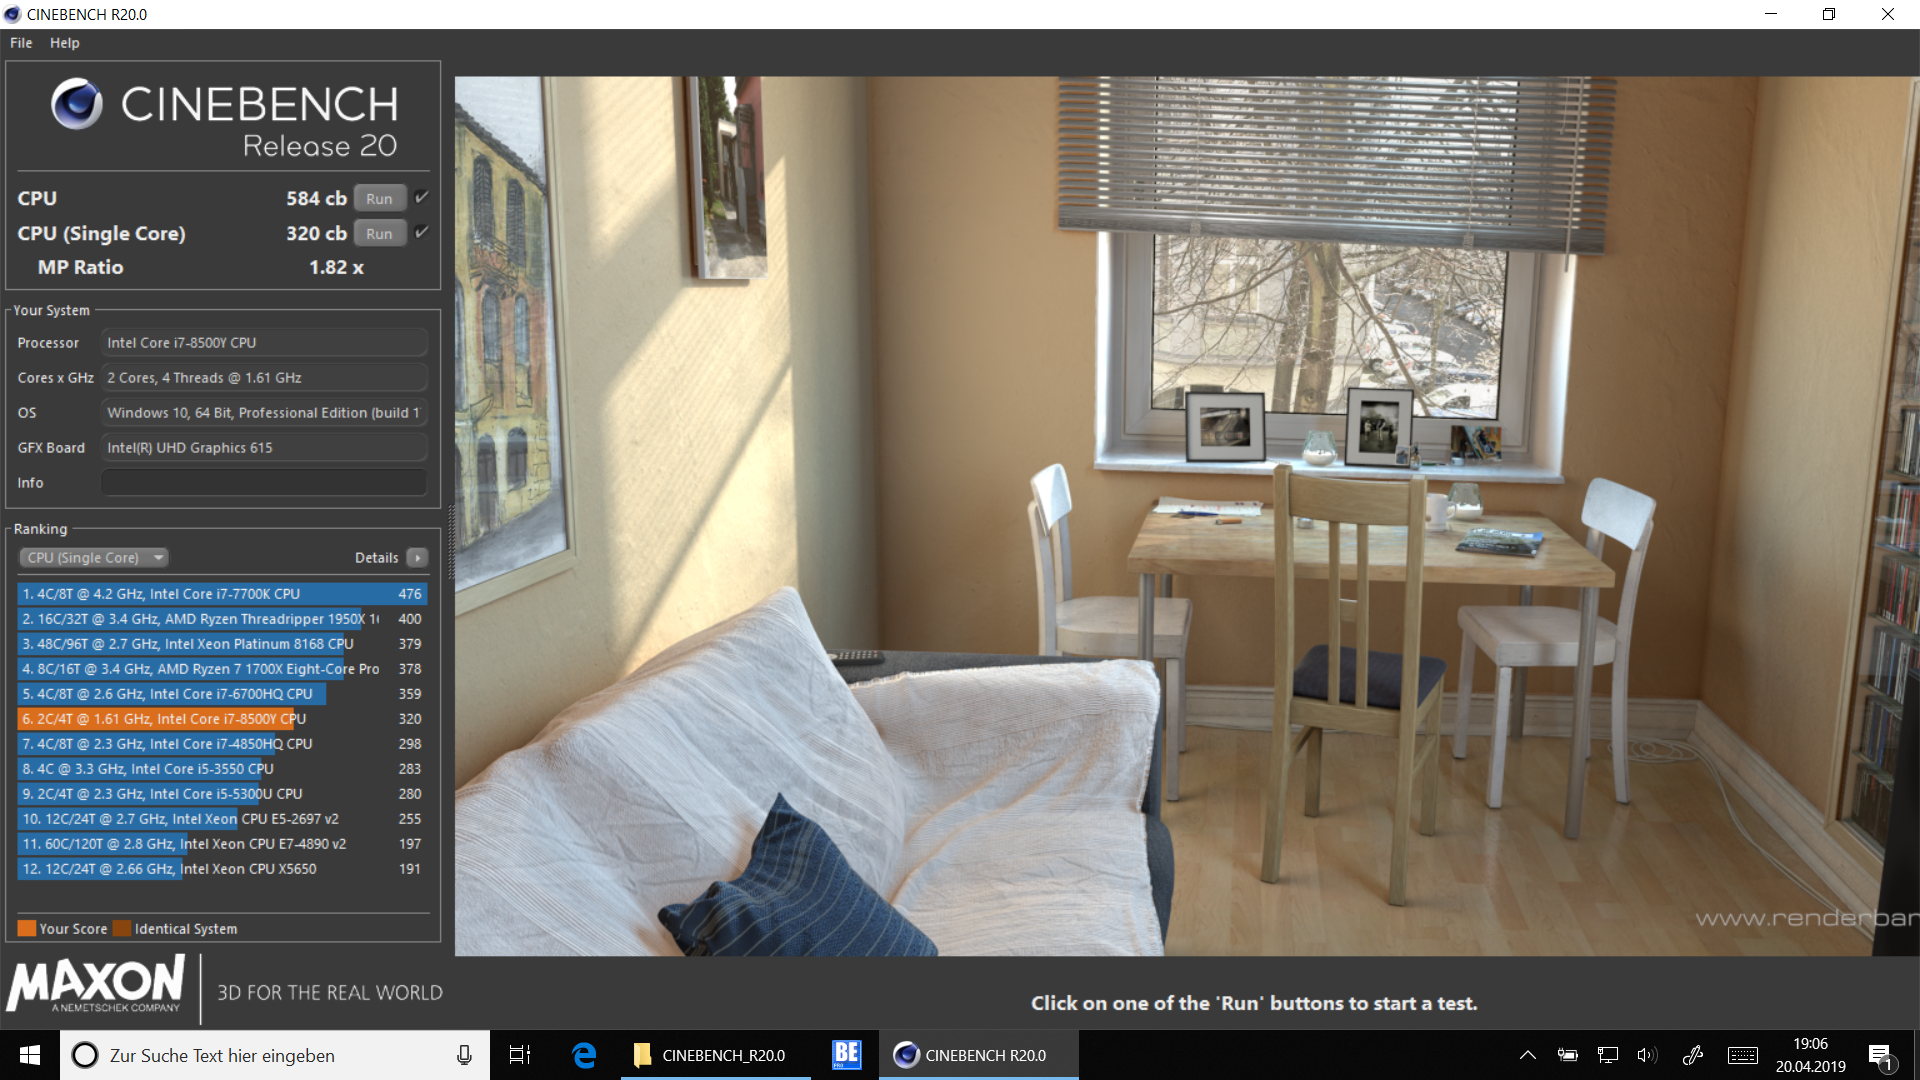
| Cinebench R20 | |
| CPU (Single Core) | |
| Média da turma Convertible (273 - 834, n=50, últimos 2 anos) | |
| VAIO A12-92993 | |
| Média Intel Core i7-8500Y (304 - 320, n=2) | |
| CPU (Multi Core) | |
| Média da turma Convertible (595 - 12102, n=50, últimos 2 anos) | |
| Média Intel Core i7-8500Y (584 - 591, n=2) | |
| VAIO A12-92993 | |
| HWBOT x265 Benchmark v2.2 - 4k Preset | |
| Média da turma Convertible (3.43 - 36.2, n=49, últimos 2 anos) | |
| VAIO A12-92993 | |
| Média Intel Core i7-8500Y (n=1) | |
| Blender - v2.79 BMW27 CPU | |
| HP Spectre Folio 13t-ak000 | |
| Média Intel Core i7-8500Y (1772 - 2159, n=2) | |
| VAIO A12-92993 | |
| Média da turma Convertible (105 - 1051, n=49, últimos 2 anos) | |
* ... menor é melhor
| PCMark 8 Home Score Accelerated v2 | 3493 pontos | |
| PCMark 8 Creative Score Accelerated v2 | 4126 pontos | |
| PCMark 8 Work Score Accelerated v2 | 4700 pontos | |
| PCMark 10 Score | 3161 pontos | |
Ajuda | ||
| VAIO A12-92993 Samsung SSD PM981 MZVLB512HAJQ | Microsoft Surface Pro 6, Core i7, 512 GB Toshiba KBG30ZPZ512G | Dell Latitude 5290 2-in-1 Toshiba XG5 KXG50ZNV256G | Lenovo ThinkPad X1 Tablet G3-20KJ001NGE Samsung PM961 MZVLW256HEHP | HP Elite x2 1013 G3-2TT14EA Samsung PM961 MZVLW256HEHP | HP Spectre Folio 13t-ak000 Samsung PM961 MZVLW256HEHP | Média Samsung SSD PM981 MZVLB512HAJQ | |
|---|---|---|---|---|---|---|---|
| CrystalDiskMark 5.2 / 6 | -40% | -27% | -3% | -16% | -17% | 39% | |
| Write 4K (MB/s) | 113.9 | 83.2 -27% | 121.7 7% | 95.4 -16% | 91 -20% | 140 23% | 126.7 ? 11% |
| Read 4K (MB/s) | 46.8 | 43.84 -6% | 32.66 -30% | 39.19 -16% | 36.84 -21% | 52.4 12% | 44 ? -6% |
| Write Seq (MB/s) | 1868 | 636 -66% | 359.3 -81% | 1197 -36% | 948 -49% | 1617 ? -13% | |
| Read Seq (MB/s) | 2226 | 900 -60% | 1463 -34% | 1705 -23% | 922 -59% | 1716 ? -23% | |
| Write 4K Q32T1 (MB/s) | 313.4 | 192.9 -38% | 353.6 13% | 399.2 27% | 355.8 14% | 227.8 -27% | 413 ? 32% |
| Read 4K Q32T1 (MB/s) | 284.6 | 247.4 -13% | 387 36% | 260.7 -8% | 256.9 -10% | 299.2 5% | 420 ? 48% |
| Write Seq Q32T1 (MB/s) | 1881 | 861 -54% | 358.1 -81% | 1287 -32% | 1222 -35% | 1259 -33% | 2076 ? 10% |
| Read Seq Q32T1 (MB/s) | 3402 | 1615 -53% | 1779 -48% | 3025 -11% | 3460 2% | 3112 -9% | 3130 ? -8% |
| Write 4K Q8T8 (MB/s) | 410.2 | 381 -7% | 1264 ? 208% | ||||
| Read 4K Q8T8 (MB/s) | 527 | 750 42% | 1193 ? 126% | ||||
| AS SSD | -146% | -58% | -25% | -37% | -4% | -1% | |
| Seq Read (MB/s) | 2650 | 1154 -56% | 1385 -48% | 2243 -15% | 2062 -22% | 1693 -36% | 1976 ? -25% |
| Seq Write (MB/s) | 1328 | 393.6 -70% | 302.1 -77% | 847 -36% | 832 -37% | 1214 -9% | 1637 ? 23% |
| 4K Read (MB/s) | 56.8 | 34.42 -39% | 30.97 -45% | 42.48 -25% | 41.45 -27% | 42.69 -25% | 50.5 ? -11% |
| 4K Write (MB/s) | 142.5 | 68.9 -52% | 102.7 -28% | 112.2 -21% | 91.1 -36% | 95.9 -33% | 112 ? -21% |
| 4K-64 Read (MB/s) | 1316 | 494.1 -62% | 472.7 -64% | 741 -44% | 669 -49% | 1621 23% | 1203 ? -9% |
| 4K-64 Write (MB/s) | 767 | 171.3 -78% | 411.2 -46% | 597 -22% | 596 -22% | 605 -21% | 1504 ? 96% |
| Access Time Read * (ms) | 0.04 | 0.213 -433% | 0.082 -105% | 0.041 -2% | 0.063 -58% | 0.051 -27% | 0.05092 ? -27% |
| Access Time Write * (ms) | 0.029 | 0.3 -934% | 0.053 -83% | 0.032 -10% | 0.041 -41% | 0.037 -28% | 0.08337 ? -187% |
| Score Read (Points) | 1638 | 644 -61% | 642 -61% | 1008 -38% | 917 -44% | 1833 12% | 1451 ? -11% |
| Score Write (Points) | 1042 | 280 -73% | 544 -48% | 794 -24% | 770 -26% | 823 -21% | 1780 ? 71% |
| Score Total (Points) | 3462 | 1225 -65% | 1469 -58% | 2257 -35% | 2105 -39% | 3569 3% | 3966 ? 15% |
| Copy ISO MB/s (MB/s) | 1941 | 985 -49% | 512 -74% | 761 -61% | 1374 -29% | 1755 ? -10% | |
| Copy Program MB/s (MB/s) | 273.1 | 143.1 -48% | 226.9 -17% | 237.3 -13% | 631 131% | 454 ? 66% | |
| Copy Game MB/s (MB/s) | 876 | 676 -23% | 317.3 -64% | 512 -42% | 971 11% | 1057 ? 21% | |
| Média Total (Programa/Configurações) | -93% /
-107% | -43% /
-47% | -14% /
-15% | -27% /
-29% | -11% /
-8% | 19% /
16% |
* ... menor é melhor

| 3DMark 11 Performance | 1291 pontos | |
| 3DMark Ice Storm Standard Score | 41219 pontos | |
| 3DMark Cloud Gate Standard Score | 5622 pontos | |
| 3DMark Fire Strike Score | 858 pontos | |
| 3DMark Fire Strike Extreme Score | 420 pontos | |
| 3DMark Time Spy Score | 328 pontos | |
Ajuda | ||
(±) A temperatura máxima no lado superior é 42.4 °C / 108 F, em comparação com a média de 35.4 °C / 96 F , variando de 19.6 a 60 °C para a classe Convertible.
(-) A parte inferior aquece até um máximo de 47.1 °C / 117 F, em comparação com a média de 36.9 °C / 98 F
(+) Em uso inativo, a temperatura média para o lado superior é 24.7 °C / 76 F, em comparação com a média do dispositivo de 30.3 °C / ### class_avg_f### F.
(-) Os apoios para as mãos e o touchpad podem ficar muito quentes ao toque, com um máximo de 42.4 °C / 108.3 F.
(-) A temperatura média da área do apoio para as mãos de dispositivos semelhantes foi 28 °C / 82.4 F (-14.4 °C / -25.9 F).
| VAIO A12-92993 UHD Graphics 615, i7-8500Y, Samsung SSD PM981 MZVLB512HAJQ | Microsoft Surface Pro 6, Core i7, 512 GB UHD Graphics 620, i7-8650U, Toshiba KBG30ZPZ512G | Dell Latitude 5290 2-in-1 UHD Graphics 620, i5-8350U, Toshiba XG5 KXG50ZNV256G | Lenovo ThinkPad X1 Tablet G3-20KJ001NGE UHD Graphics 620, i5-8250U, Samsung PM961 MZVLW256HEHP | HP Elite x2 1013 G3-2TT14EA UHD Graphics 620, i5-8350U, Samsung PM961 MZVLW256HEHP | HP Spectre Folio 13t-ak000 UHD Graphics 615, i7-8500Y, Samsung PM961 MZVLW256HEHP | |
|---|---|---|---|---|---|---|
| Heat | -9% | -15% | -7% | -21% | -18% | |
| Maximum Upper Side * (°C) | 42.4 | 40.4 5% | 44.4 -5% | 44.3 -4% | 49.4 -17% | 44.2 -4% |
| Maximum Bottom * (°C) | 47.1 | 43.8 7% | 52 -10% | 48.9 -4% | 47.1 -0% | 48.2 -2% |
| Idle Upper Side * (°C) | 26.6 | 33.5 -26% | 32 -20% | 30 -13% | 38 -43% | 33 -24% |
| Idle Bottom * (°C) | 24.9 | 30.2 -21% | 31.2 -25% | 26.6 -7% | 30.8 -24% | 35.6 -43% |
* ... menor é melhor
VAIO A12-92993 análise de áudio
(±) | o volume do alto-falante é médio, mas bom (###valor### dB)
Graves 100 - 315Hz
(-) | quase nenhum baixo - em média 26% menor que a mediana
(+) | o baixo é linear (2.9% delta para a frequência anterior)
Médios 400 - 2.000 Hz
(±) | médios mais altos - em média 9.1% maior que a mediana
(-) | médios não são lineares (15.3% delta para frequência anterior)
Altos 2 - 16 kHz
(±) | máximos mais altos - em média 12.9% maior que a mediana
(±) | a linearidade dos máximos é média (12.4% delta para frequência anterior)
Geral 100 - 16.000 Hz
(-) | o som geral não é linear (47.7% diferença em relação à mediana)
Comparado com a mesma classe
» 99% de todos os dispositivos testados nesta classe foram melhores, 0% semelhantes, 0% piores
» O melhor teve um delta de 6%, a média foi 20%, o pior foi 57%
Comparado com todos os dispositivos testados
» 96% de todos os dispositivos testados foram melhores, 0% semelhantes, 4% piores
» O melhor teve um delta de 4%, a média foi 24%, o pior foi 134%
HP Spectre Folio 13t-ak000 análise de áudio
(-) | alto-falantes não muito altos (###valor### dB)
Graves 100 - 315Hz
(-) | quase nenhum baixo - em média 21.7% menor que a mediana
(±) | a linearidade dos graves é média (11.9% delta para a frequência anterior)
Médios 400 - 2.000 Hz
(+) | médios equilibrados - apenas 4% longe da mediana
(±) | a linearidade dos médios é média (8.6% delta para frequência anterior)
Altos 2 - 16 kHz
(+) | agudos equilibrados - apenas 3.6% longe da mediana
(±) | a linearidade dos máximos é média (8.3% delta para frequência anterior)
Geral 100 - 16.000 Hz
(±) | a linearidade do som geral é média (27.2% diferença em relação à mediana)
Comparado com a mesma classe
» 83% de todos os dispositivos testados nesta classe foram melhores, 4% semelhantes, 13% piores
» O melhor teve um delta de 6%, a média foi 20%, o pior foi 57%
Comparado com todos os dispositivos testados
» 83% de todos os dispositivos testados foram melhores, 4% semelhantes, 13% piores
» O melhor teve um delta de 4%, a média foi 24%, o pior foi 134%
| desligado | |
| Ocioso | |
| Carga |
|
Key:
min: | |
| VAIO A12-92993 i7-8500Y, UHD Graphics 615, Samsung SSD PM981 MZVLB512HAJQ, IPS, 1920x1080, 12.5" | Microsoft Surface Pro 6, Core i7, 512 GB i7-8650U, UHD Graphics 620, Toshiba KBG30ZPZ512G, IPS, 2736x1824, 12.3" | Dell Latitude 5290 2-in-1 i5-8350U, UHD Graphics 620, Toshiba XG5 KXG50ZNV256G, IPS, 1920x1280, 12.3" | Lenovo ThinkPad X1 Tablet G3-20KJ001NGE i5-8250U, UHD Graphics 620, Samsung PM961 MZVLW256HEHP, IPS, 3000x2000, 13" | HP Elite x2 1013 G3-2TT14EA i5-8350U, UHD Graphics 620, Samsung PM961 MZVLW256HEHP, IPS, 3000x2000, 13" | HP Spectre Folio 13t-ak000 i7-8500Y, UHD Graphics 615, Samsung PM961 MZVLW256HEHP, IPS, 1920x1080, 13.3" | Média Intel UHD Graphics 615 | Média da turma Convertible | |
|---|---|---|---|---|---|---|---|---|
| Power Consumption | -29% | -28% | -63% | -38% | 4% | 7% | -56% | |
| Idle Minimum * (Watt) | 4.4 | 3.2 27% | 3 32% | 4.8 -9% | 4.9 -11% | 1.8 59% | 3.55 ? 19% | 4.24 ? 4% |
| Idle Average * (Watt) | 6.5 | 8.7 -34% | 7.2 -11% | 9 -38% | 8.9 -37% | 3.8 42% | 6.17 ? 5% | 7.03 ? -8% |
| Idle Maximum * (Watt) | 7.1 | 10.4 -46% | 10 -41% | 10.5 -48% | 11 -55% | 7.7 -8% | 7.61 ? -7% | 8.61 ? -21% |
| Load Average * (Watt) | 20.2 | 29.2 -45% | 37.1 -84% | 42.8 -112% | 32 -58% | 26.9 -33% | 18.2 ? 10% | 43.9 ? -117% |
| Load Maximum * (Watt) | 28 | 40.8 -46% | 38.2 -36% | 57.8 -106% | 36 -29% | 38.5 -38% | 25.4 ? 9% | 67.2 ? -140% |
* ... menor é melhor
| VAIO A12-92993 i7-8500Y, UHD Graphics 615, 23.4 Wh | Microsoft Surface Pro 6, Core i7, 512 GB i7-8650U, UHD Graphics 620, 45 Wh | Dell Latitude 5290 2-in-1 i5-8350U, UHD Graphics 620, 42 Wh | Lenovo ThinkPad X1 Tablet G3-20KJ001NGE i5-8250U, UHD Graphics 620, 42 Wh | HP Elite x2 1013 G3-2TT14EA i5-8350U, UHD Graphics 620, 50 Wh | HP Spectre Folio 13t-ak000 i7-8500Y, UHD Graphics 615, 54.28 Wh | Média da turma Convertible | |
|---|---|---|---|---|---|---|---|
| Duração da bateria | 55% | -22% | 42% | 45% | 160% | 154% | |
| Reader / Idle (h) | 8.6 | 18.1 110% | 13.2 53% | 13 51% | 31.4 265% | 27.7 ? 222% | |
| H.264 (h) | 3.7 | 8.7 135% | 6.5 76% | 15.3 ? 314% | |||
| WiFi v1.3 (h) | 7.2 | 8.5 18% | 5 -31% | 6.6 -8% | 7.7 7% | 14.2 97% | 12.1 ? 68% |
| Load (h) | 1.6 | 2.2 38% | 1.4 -13% | 1.4 -13% | 2.3 44% | 3.5 119% | 1.779 ? 11% |
Pro
Contra
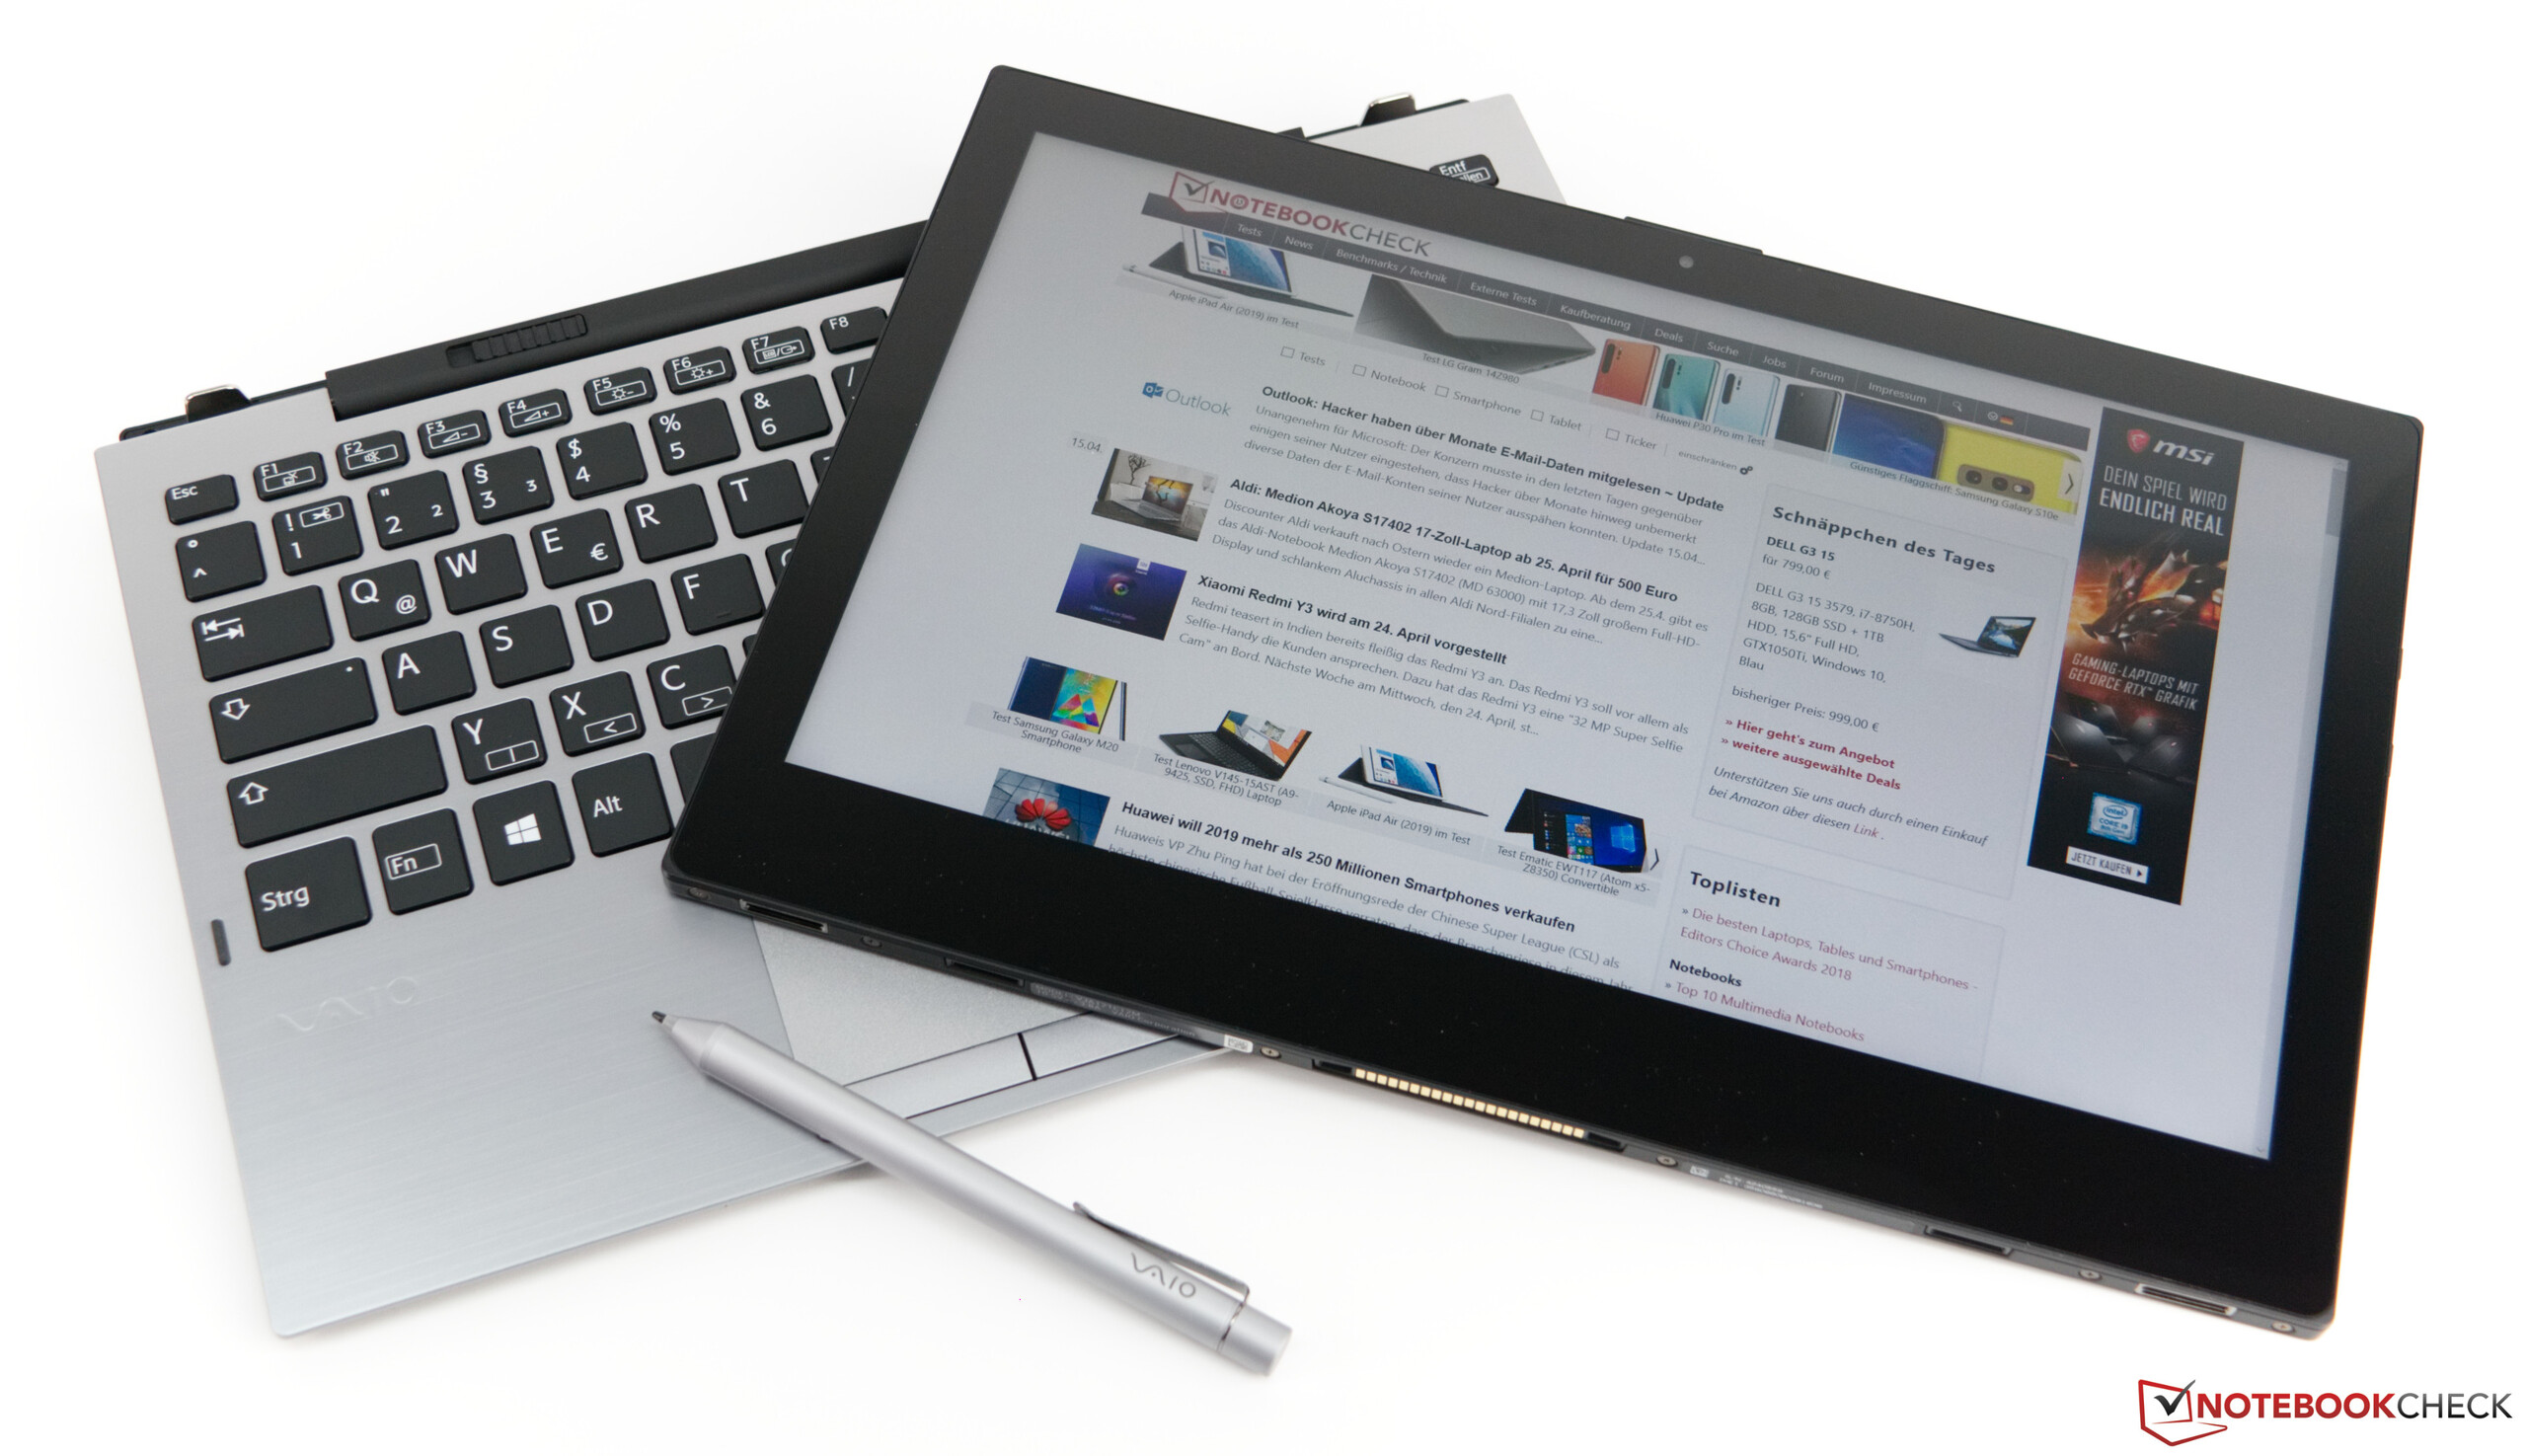
O VAIO A12 é uma espécie de enigma. O preço é muito alto e tem inúmeros inconvenientes, embora o VAIO seja bom em algumas áreas.
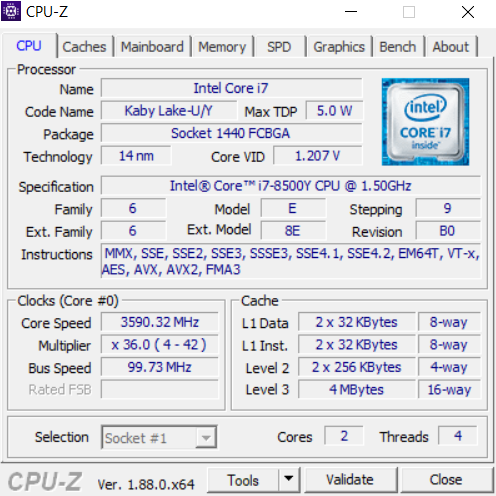
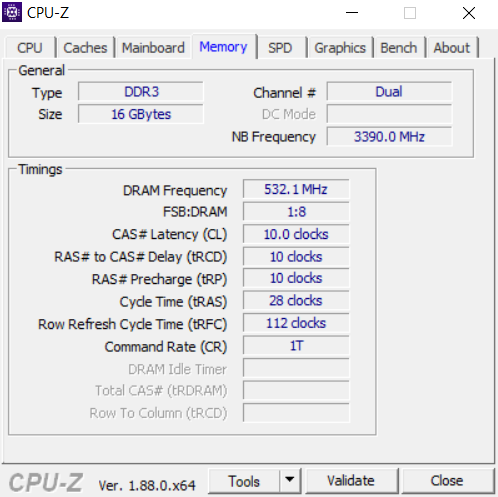
O processador da série Y é mais eficiente em termos energéticos do que os seus homólogos da série U e ainda é poderoso o suficiente para o trabalho de escritório diário. No entanto, a CPU dual-core atingirá seus limites em programas que exigem muitos recursos. Os 16 GB de RAM parecem um exagero aqui, no entanto, os recebem muito bem, e o SSD de 512 GB também. No geral, não tivemos problemas de desempenho inesperados, e o A12 até nos surpreendeu com comparativamente boas pontuações nos benchmarks de desempenho do sistema.
O VAIO A12 é simplesmente muito caro. Não oferece nada que seus concorrentes não possam fazer melhor e também tem uma série de problemas. Procure outra coisa e poupe algum dinheiro
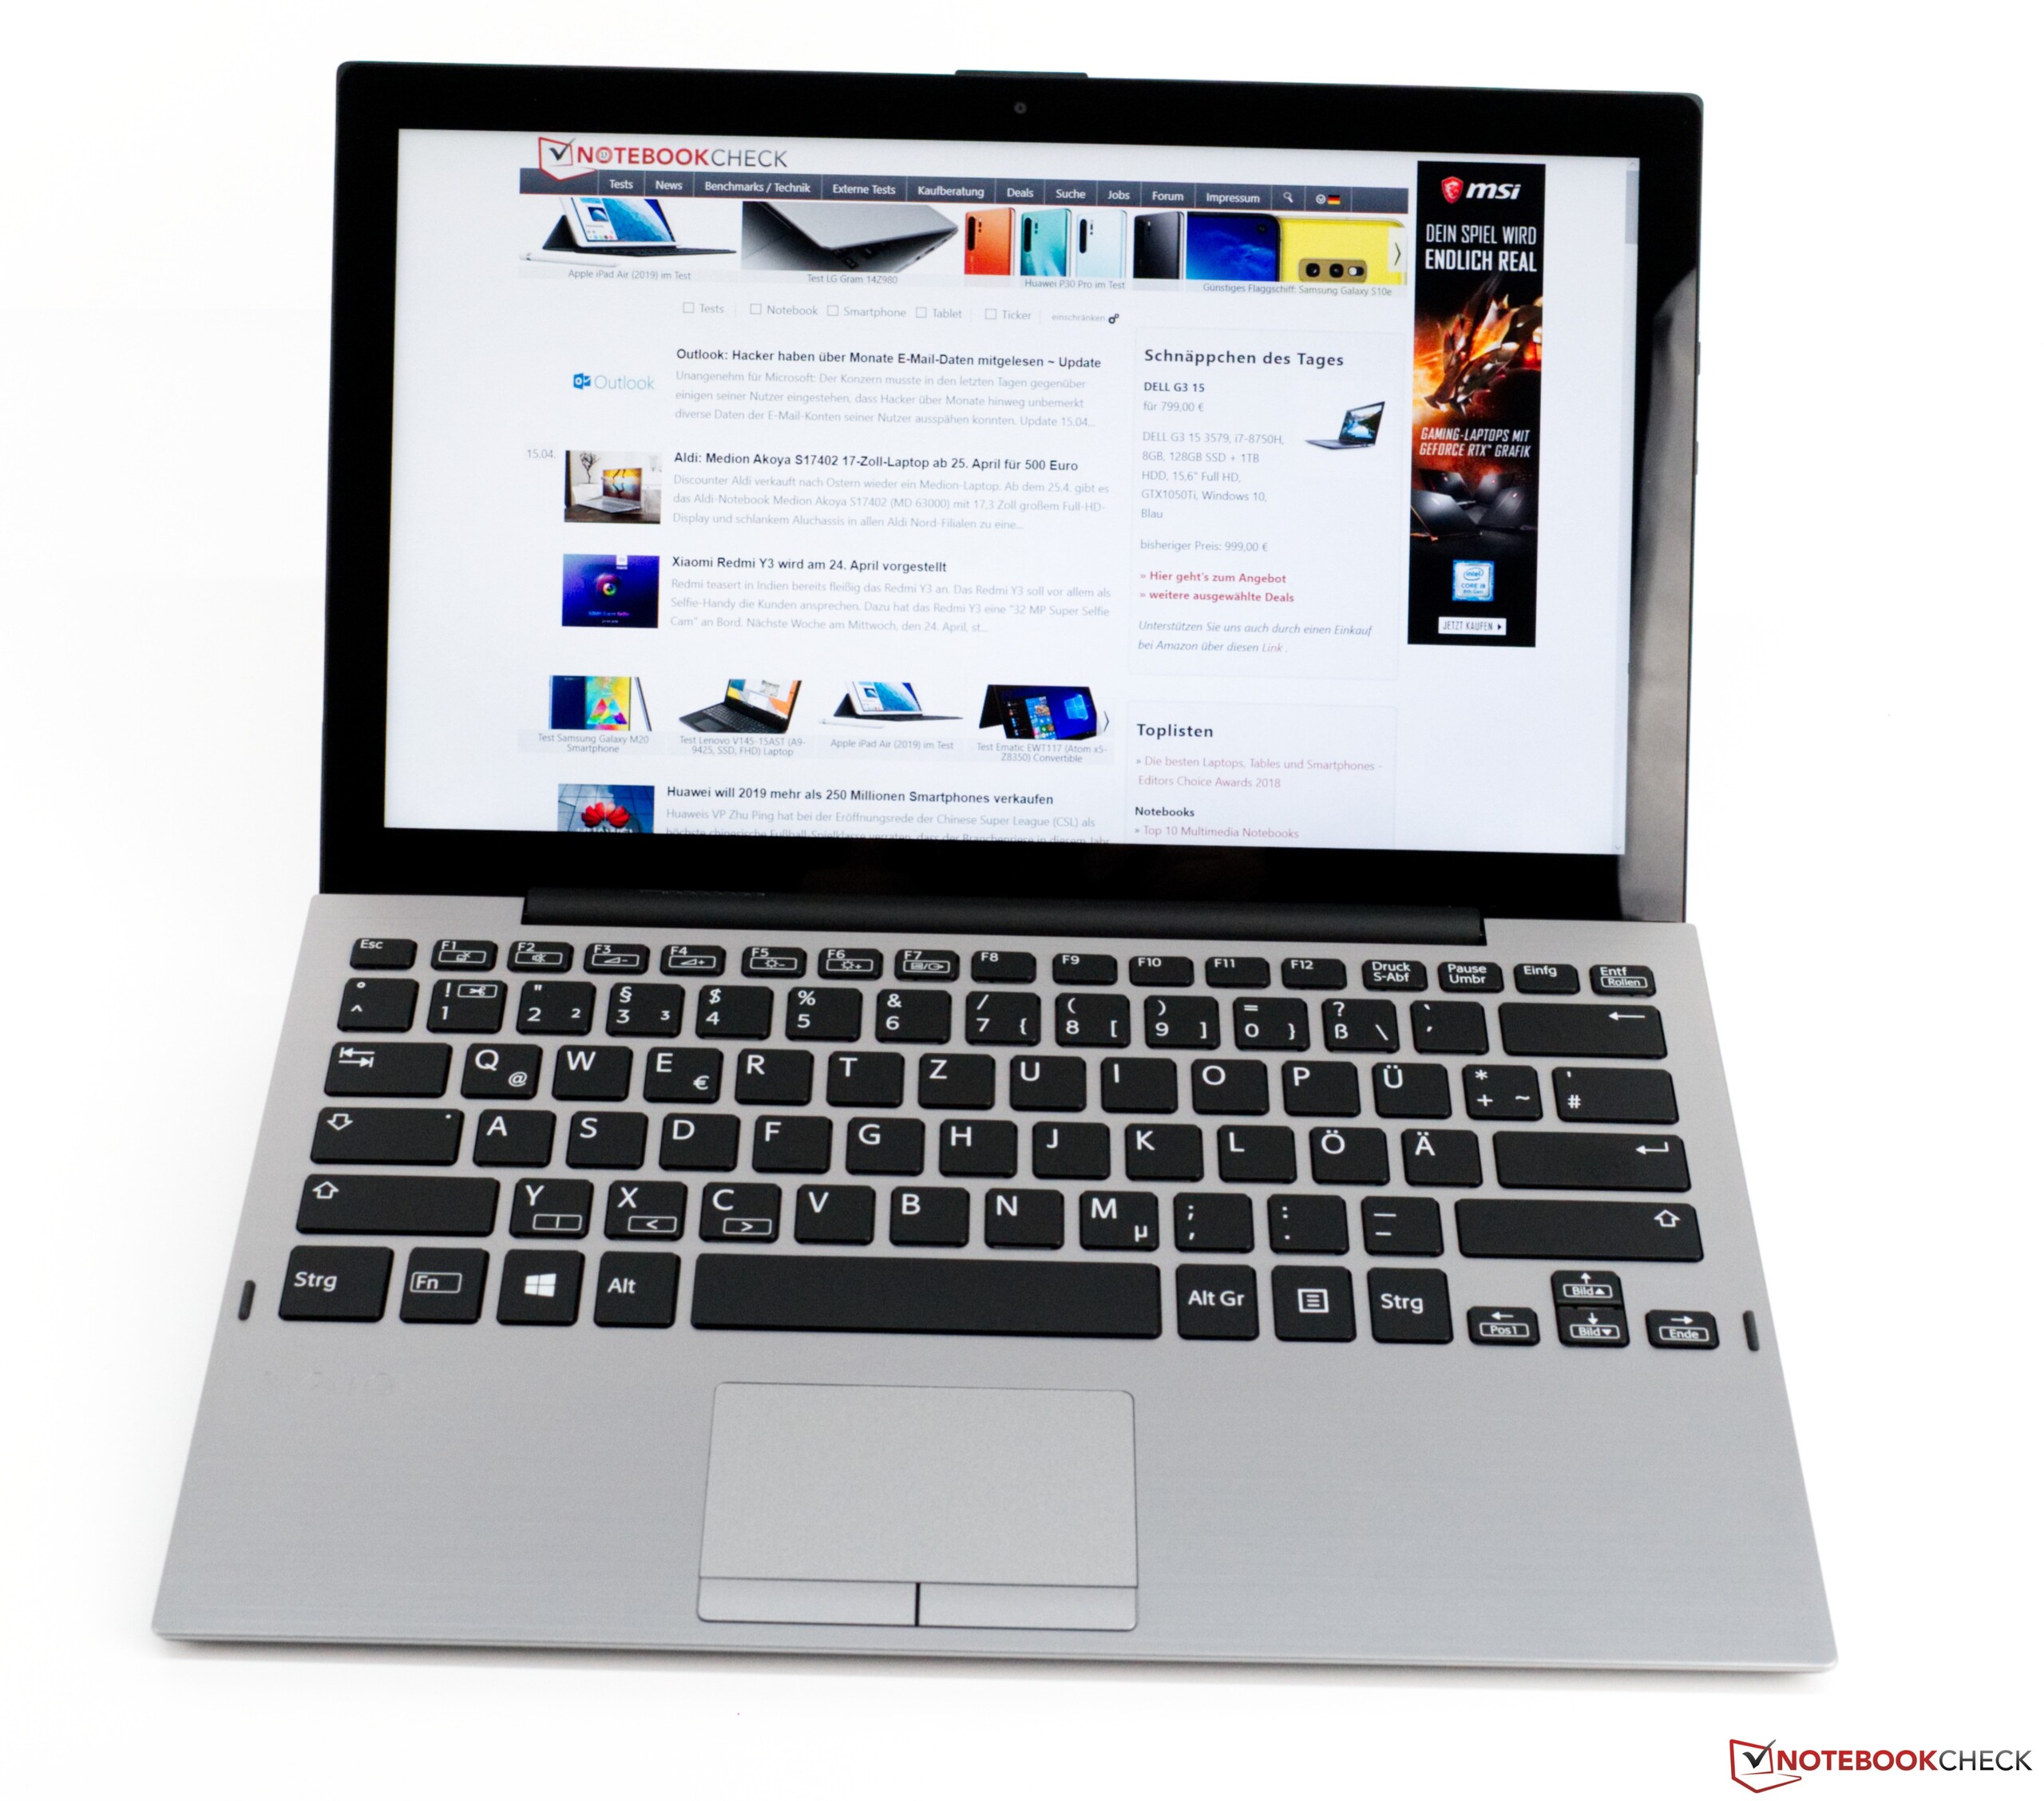
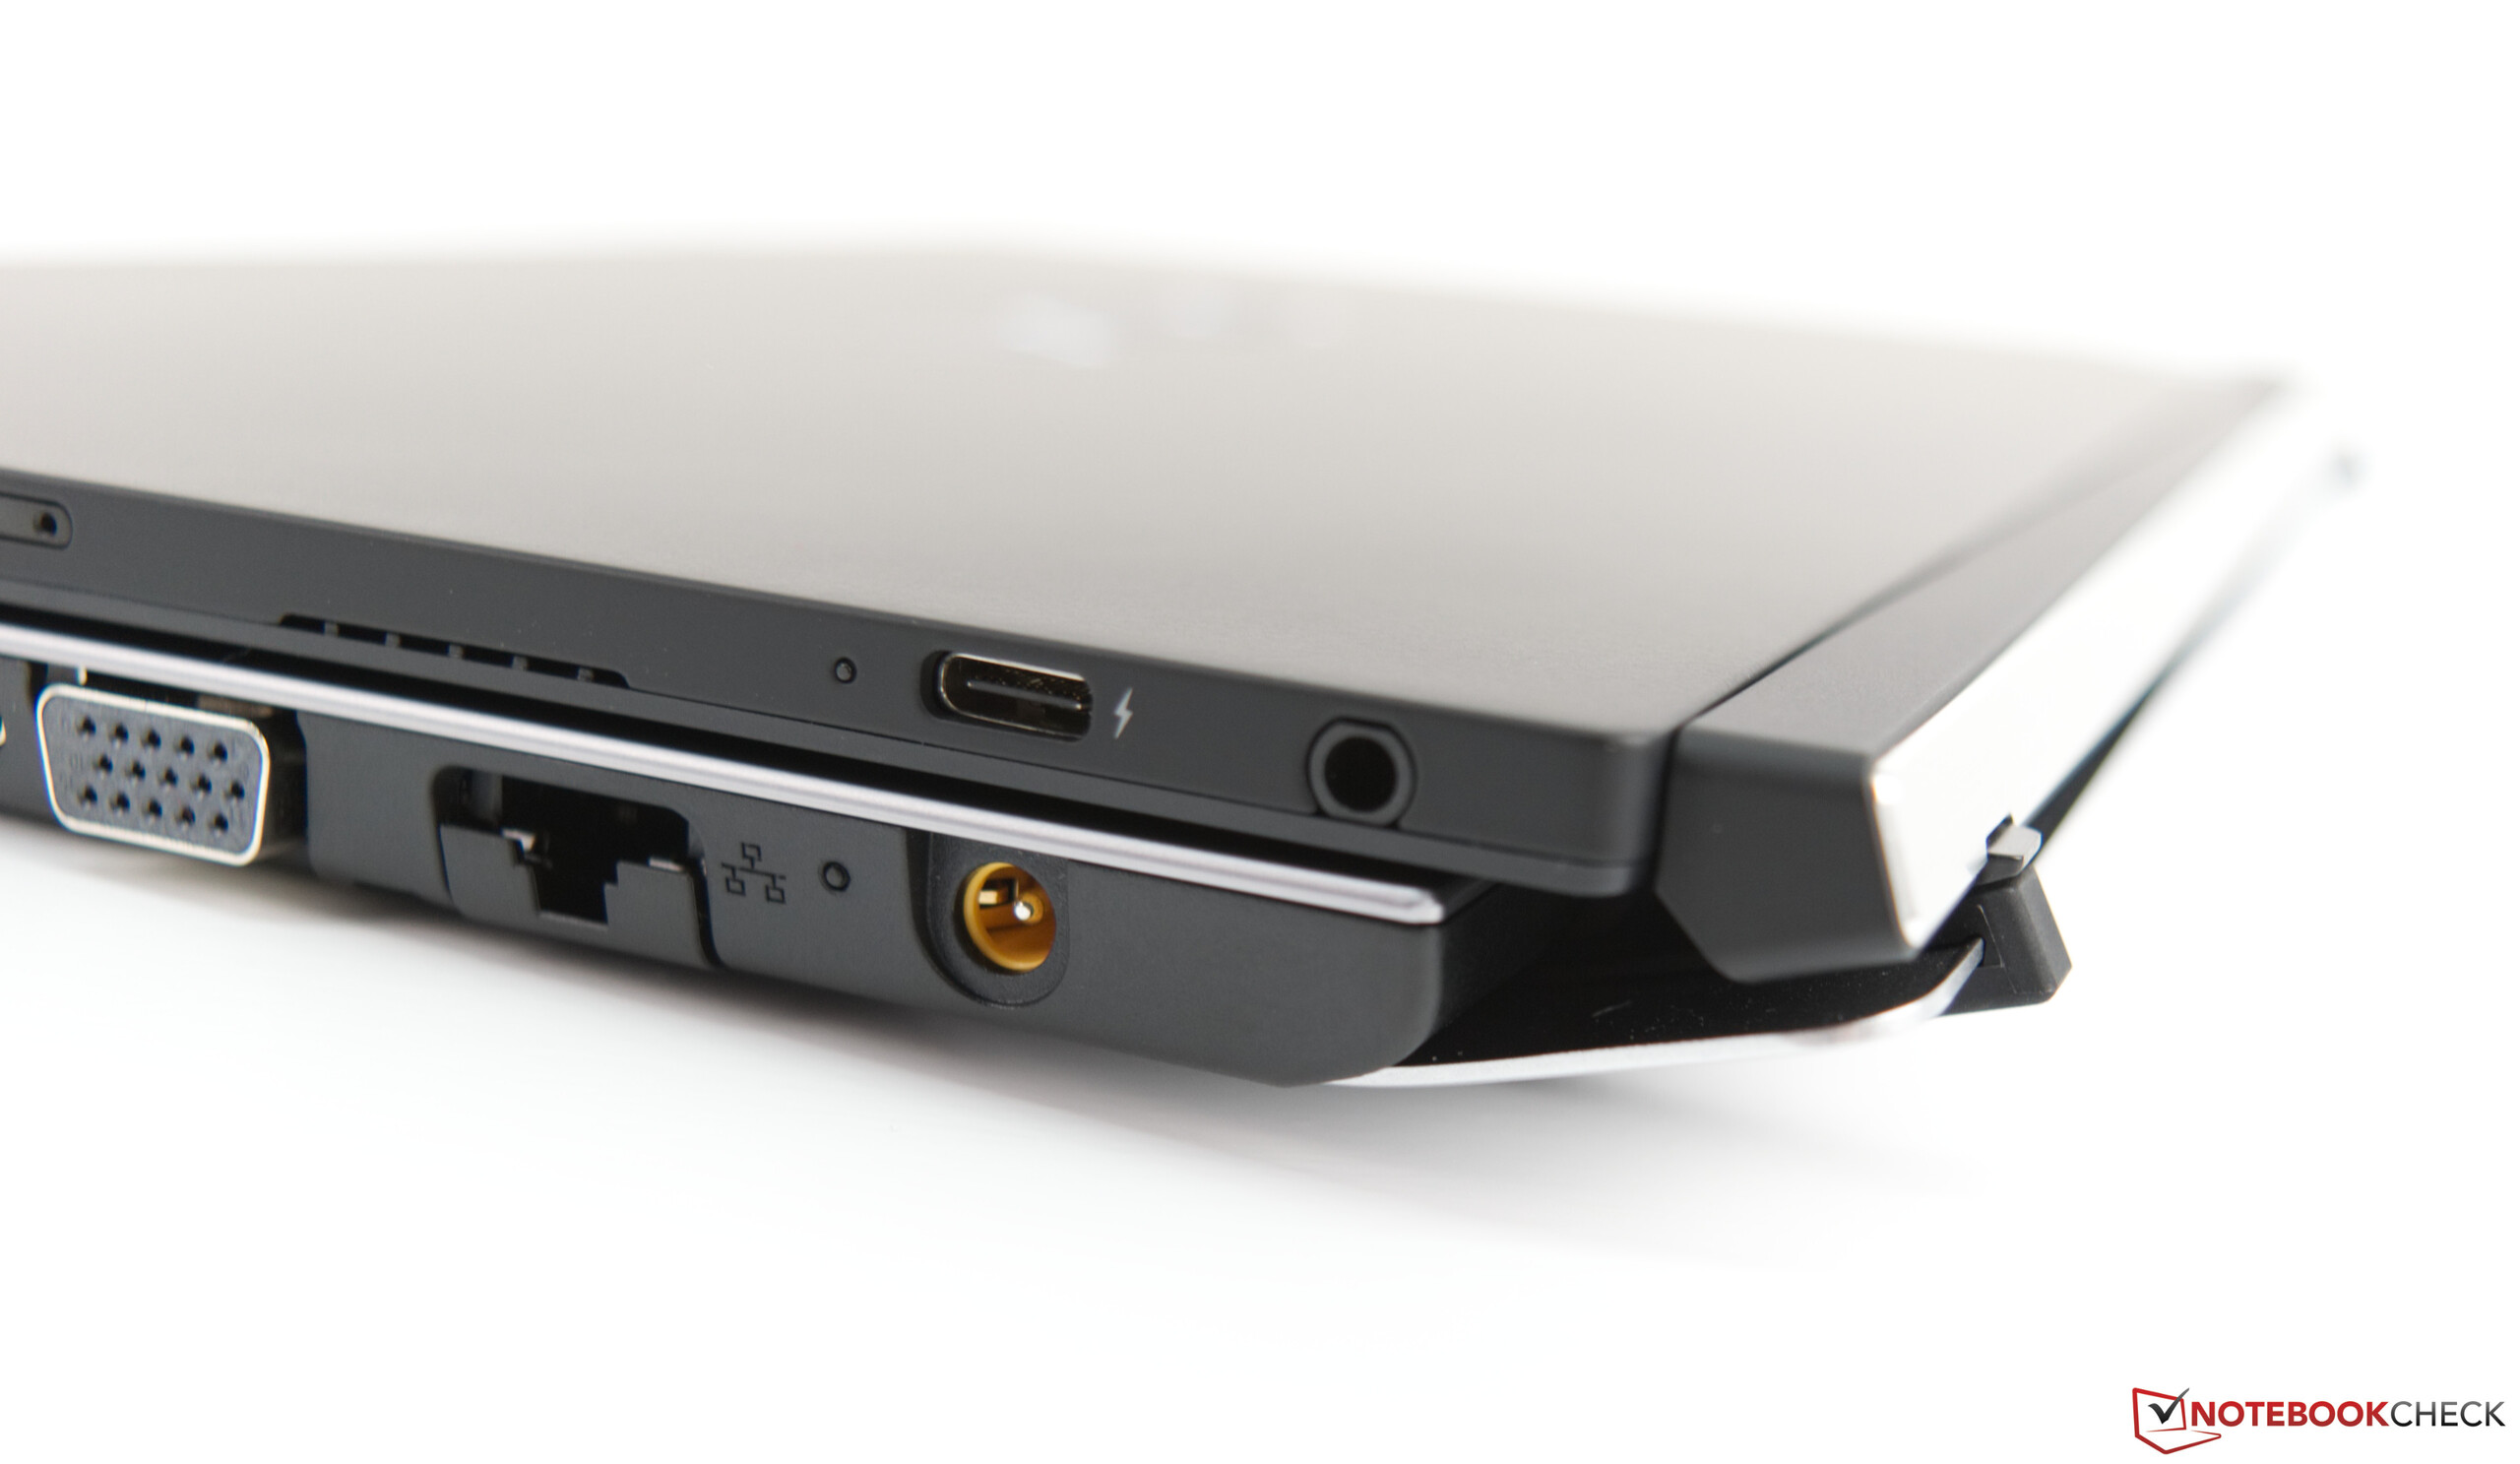
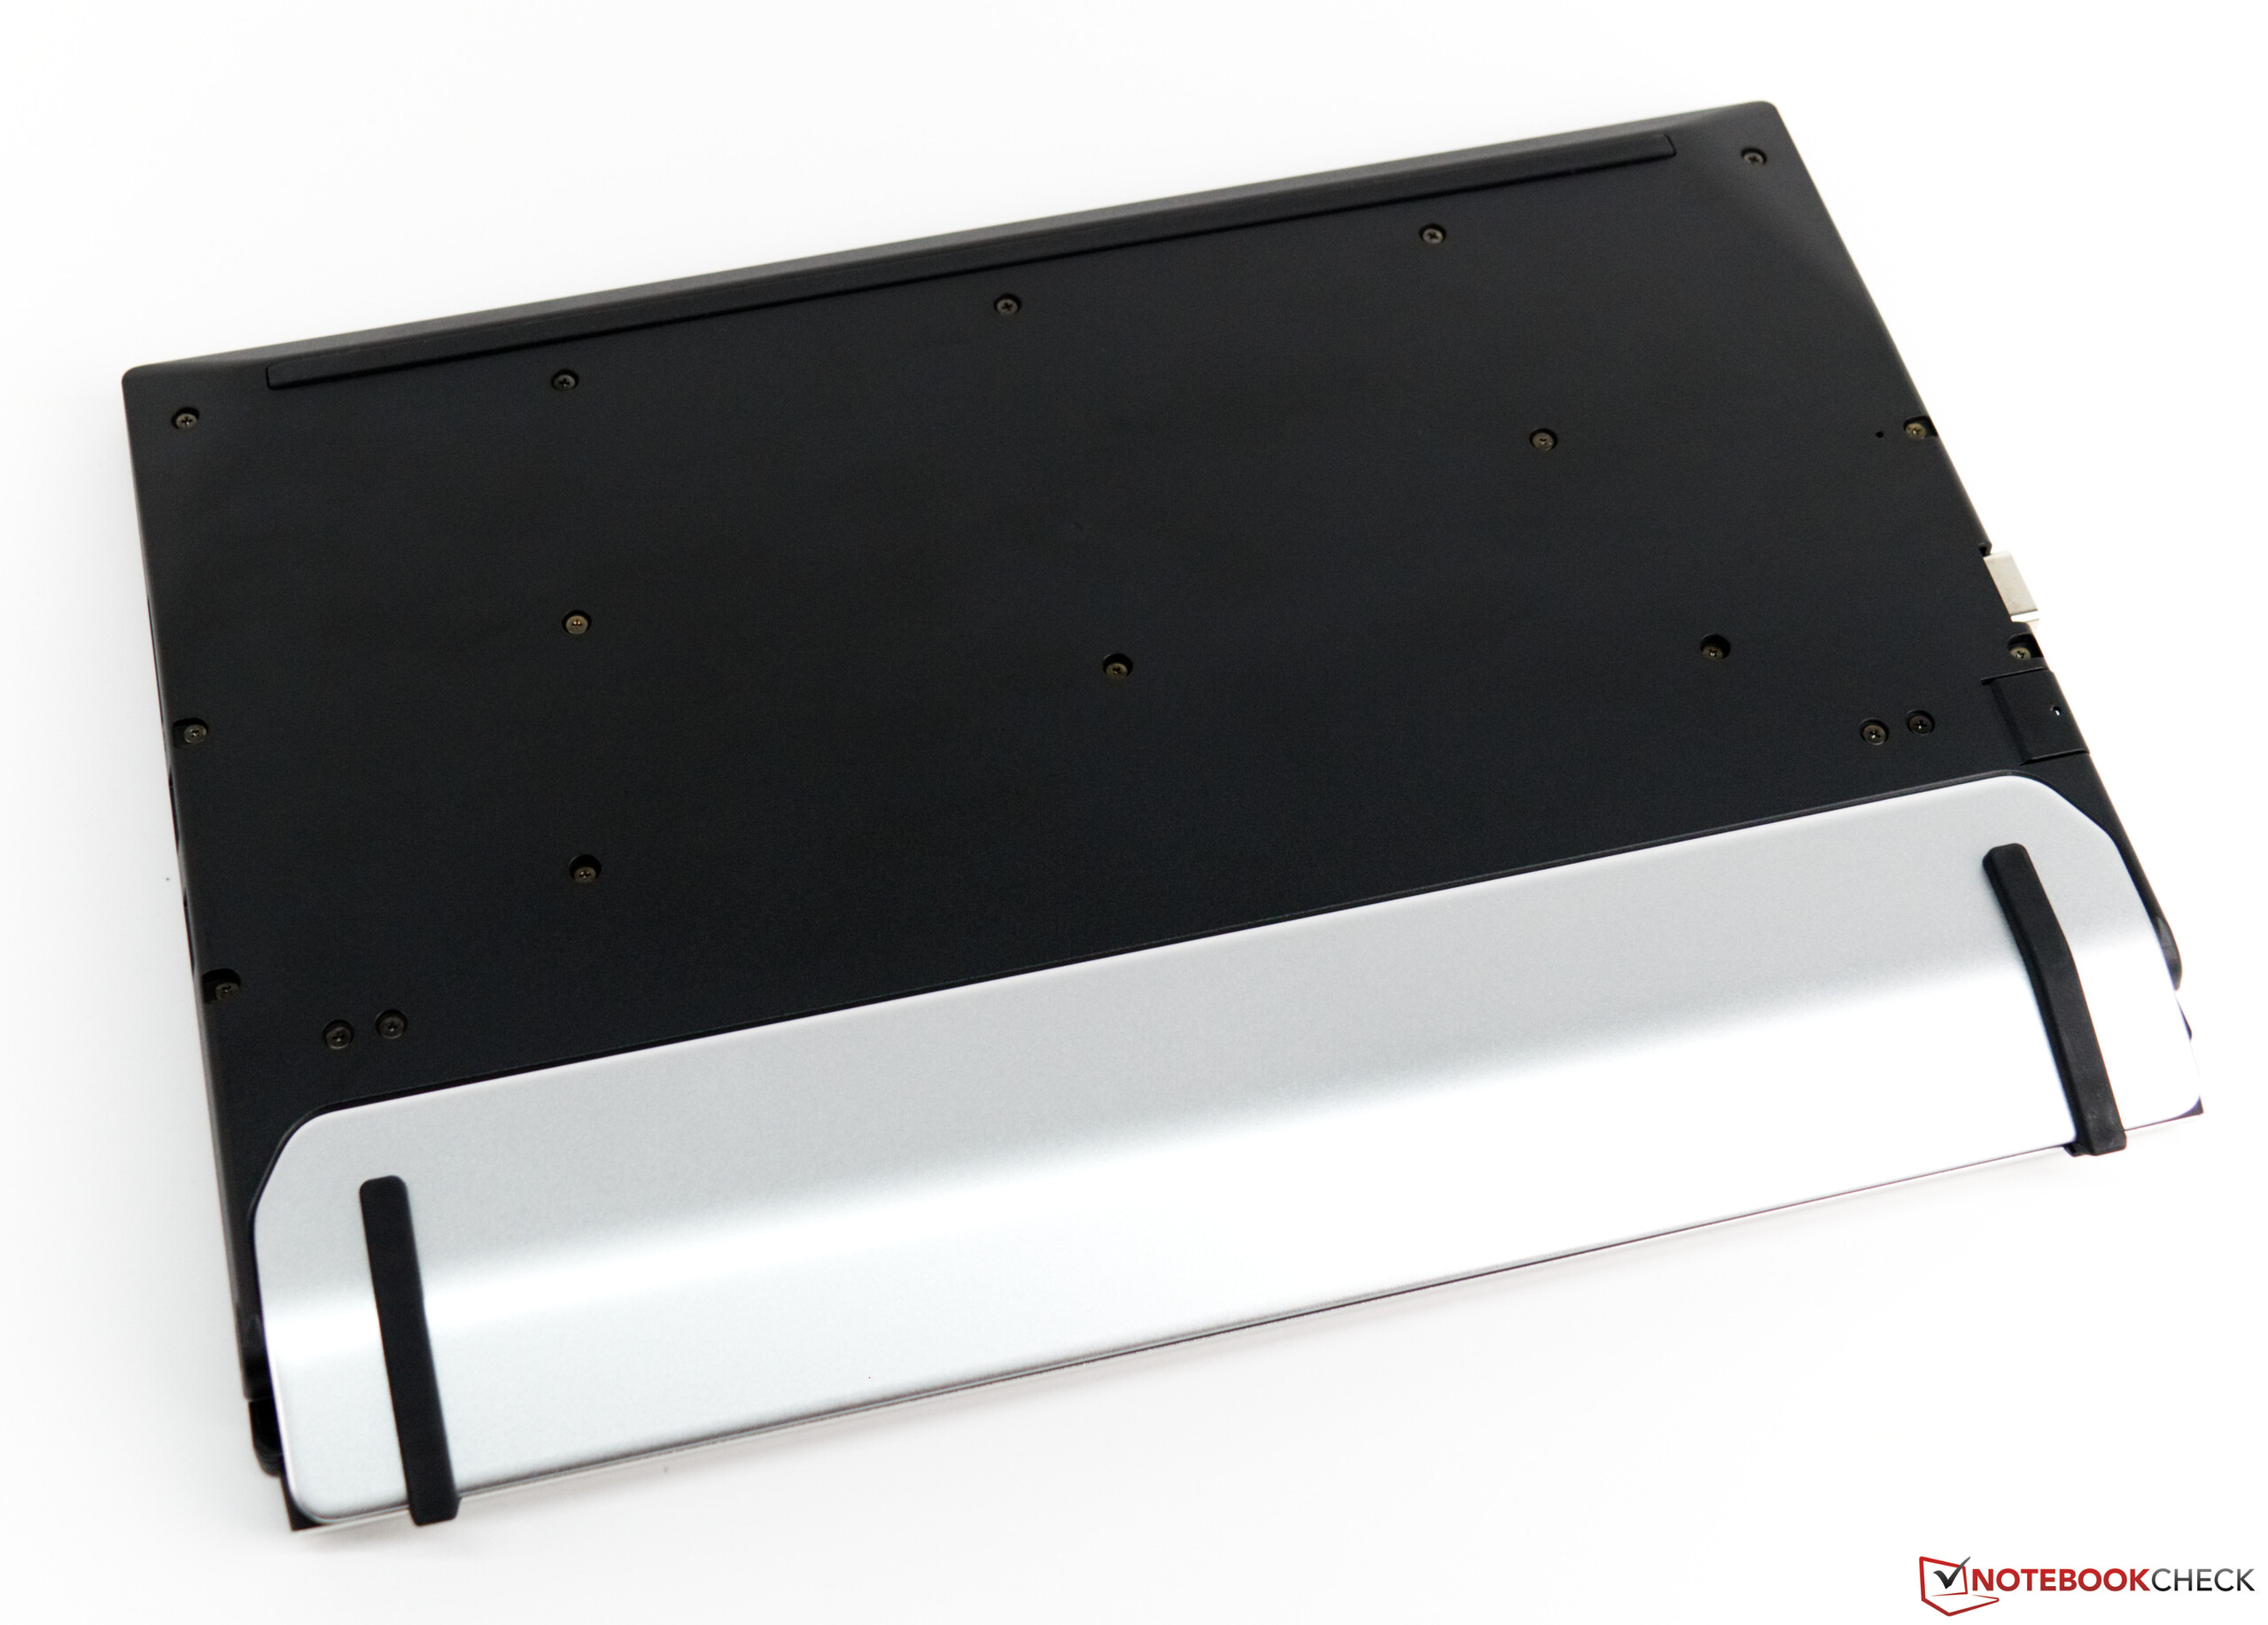
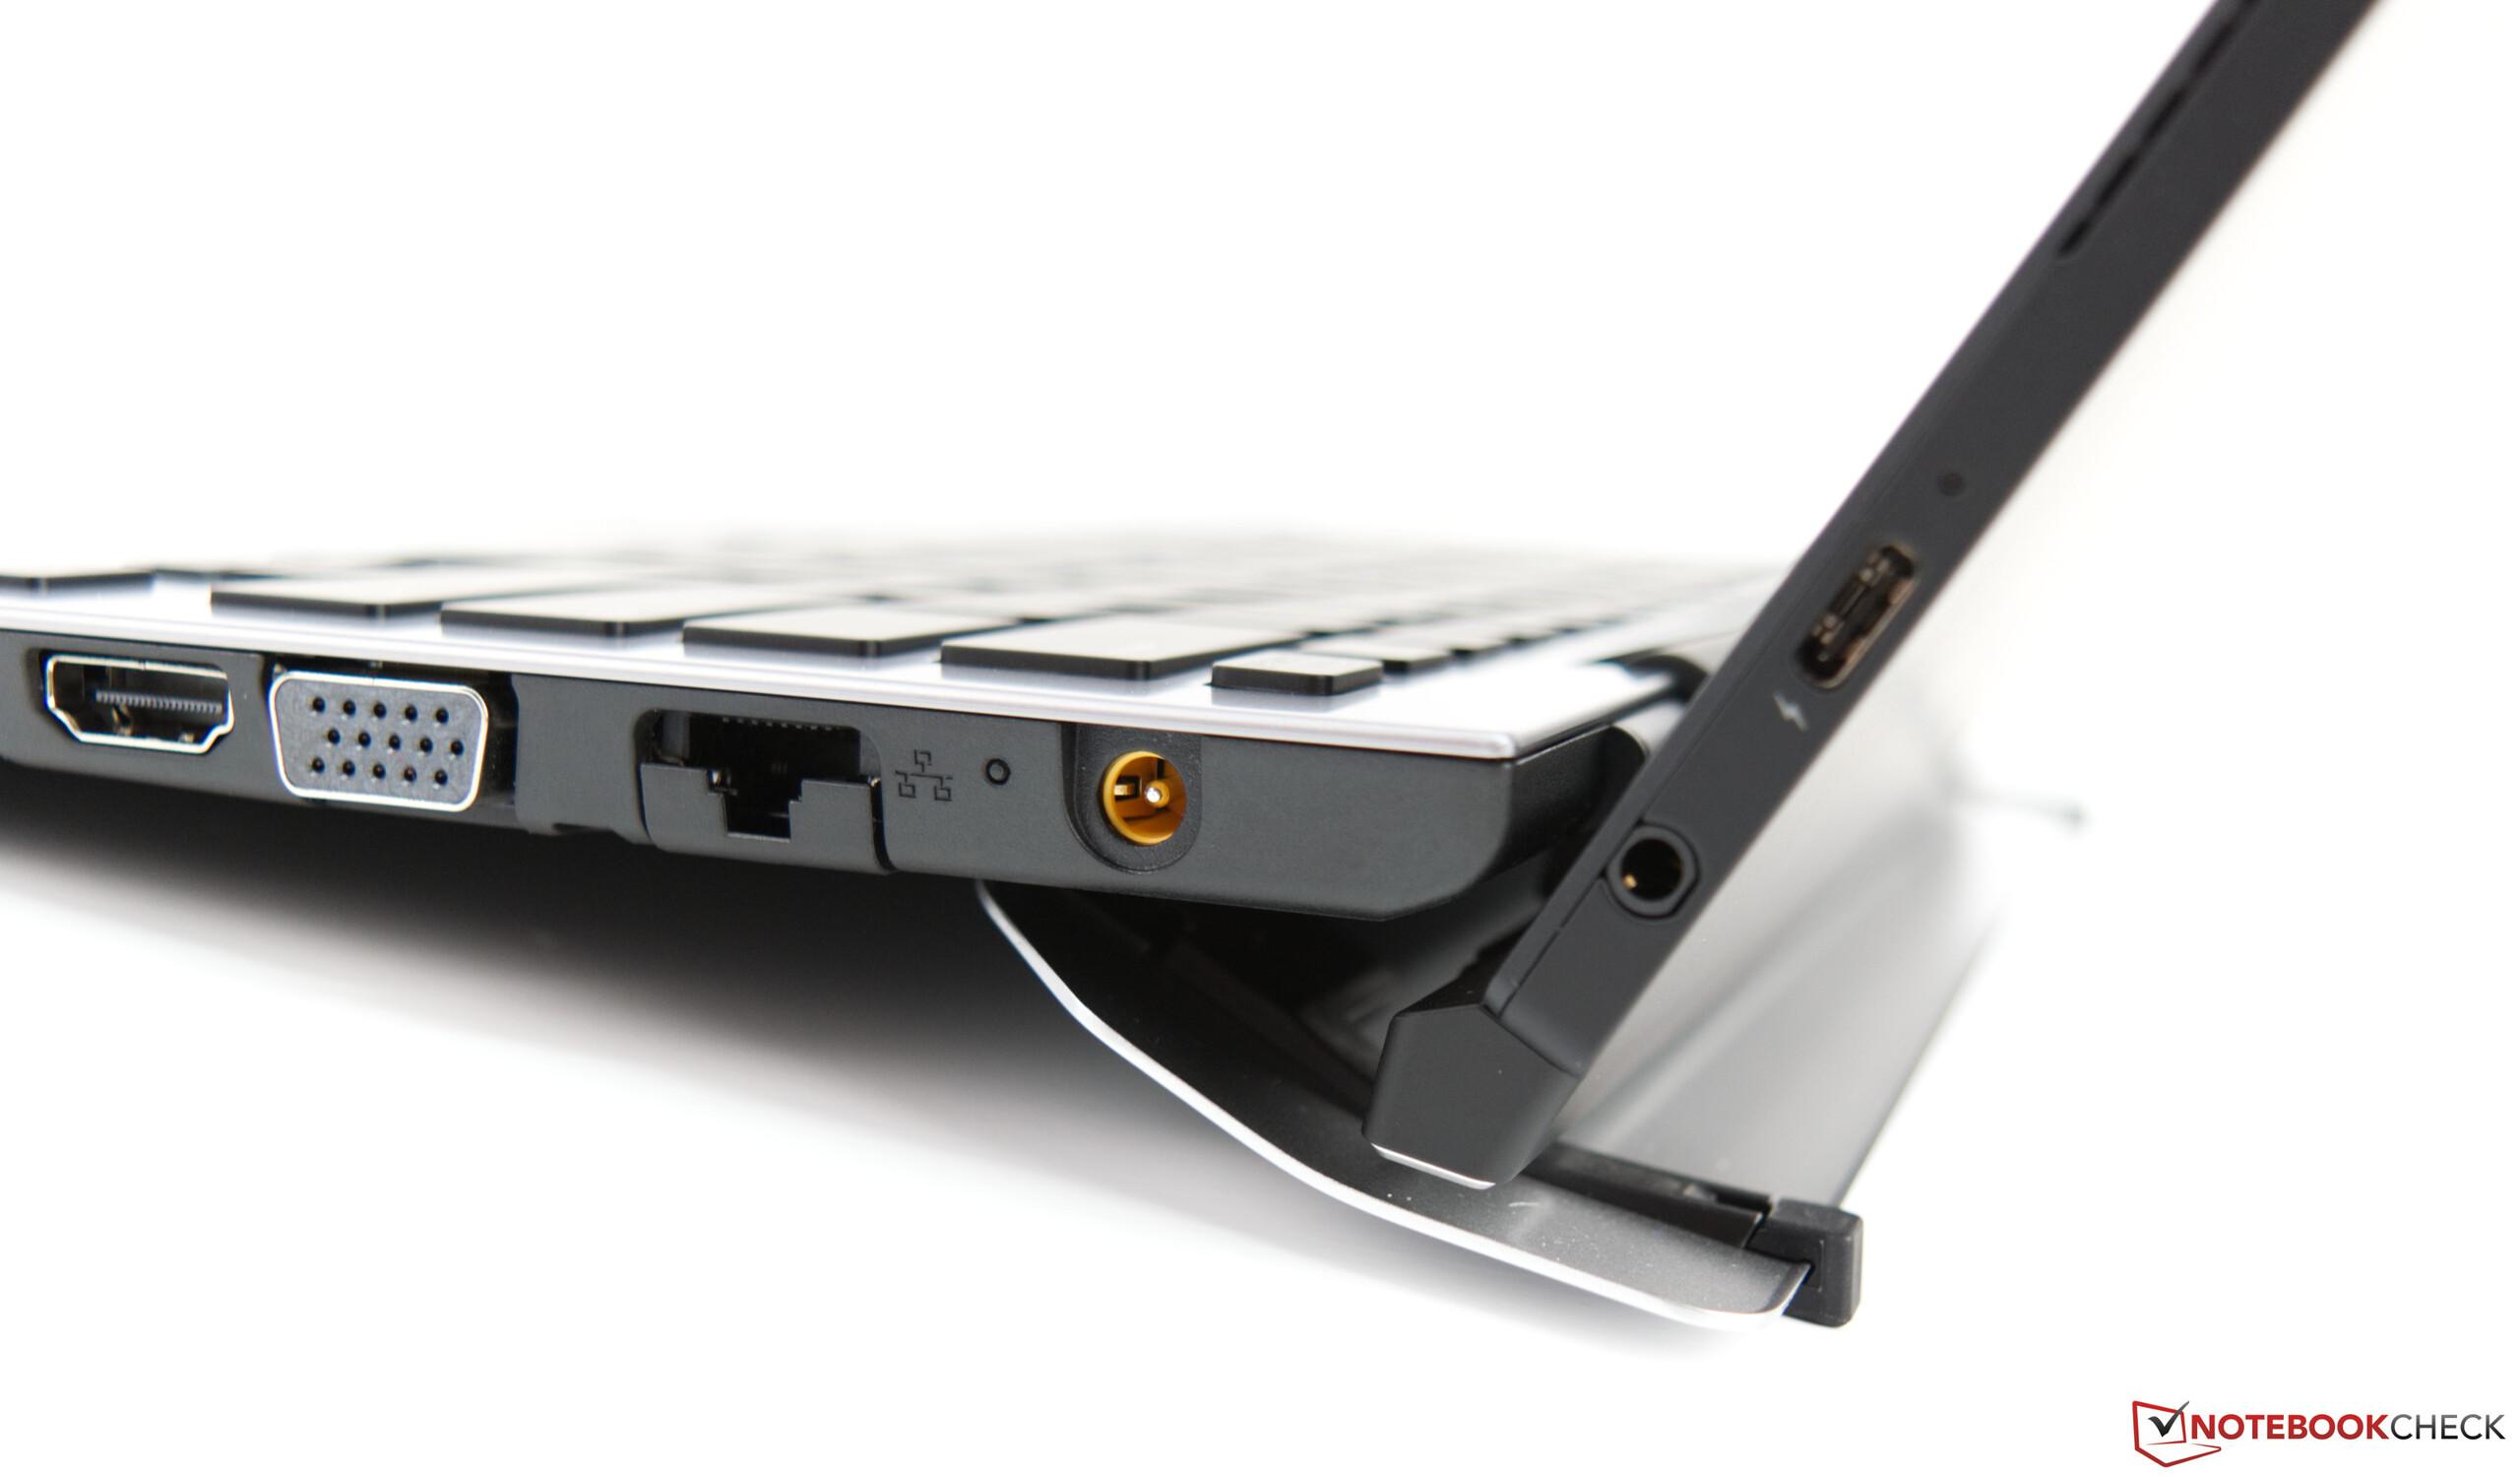
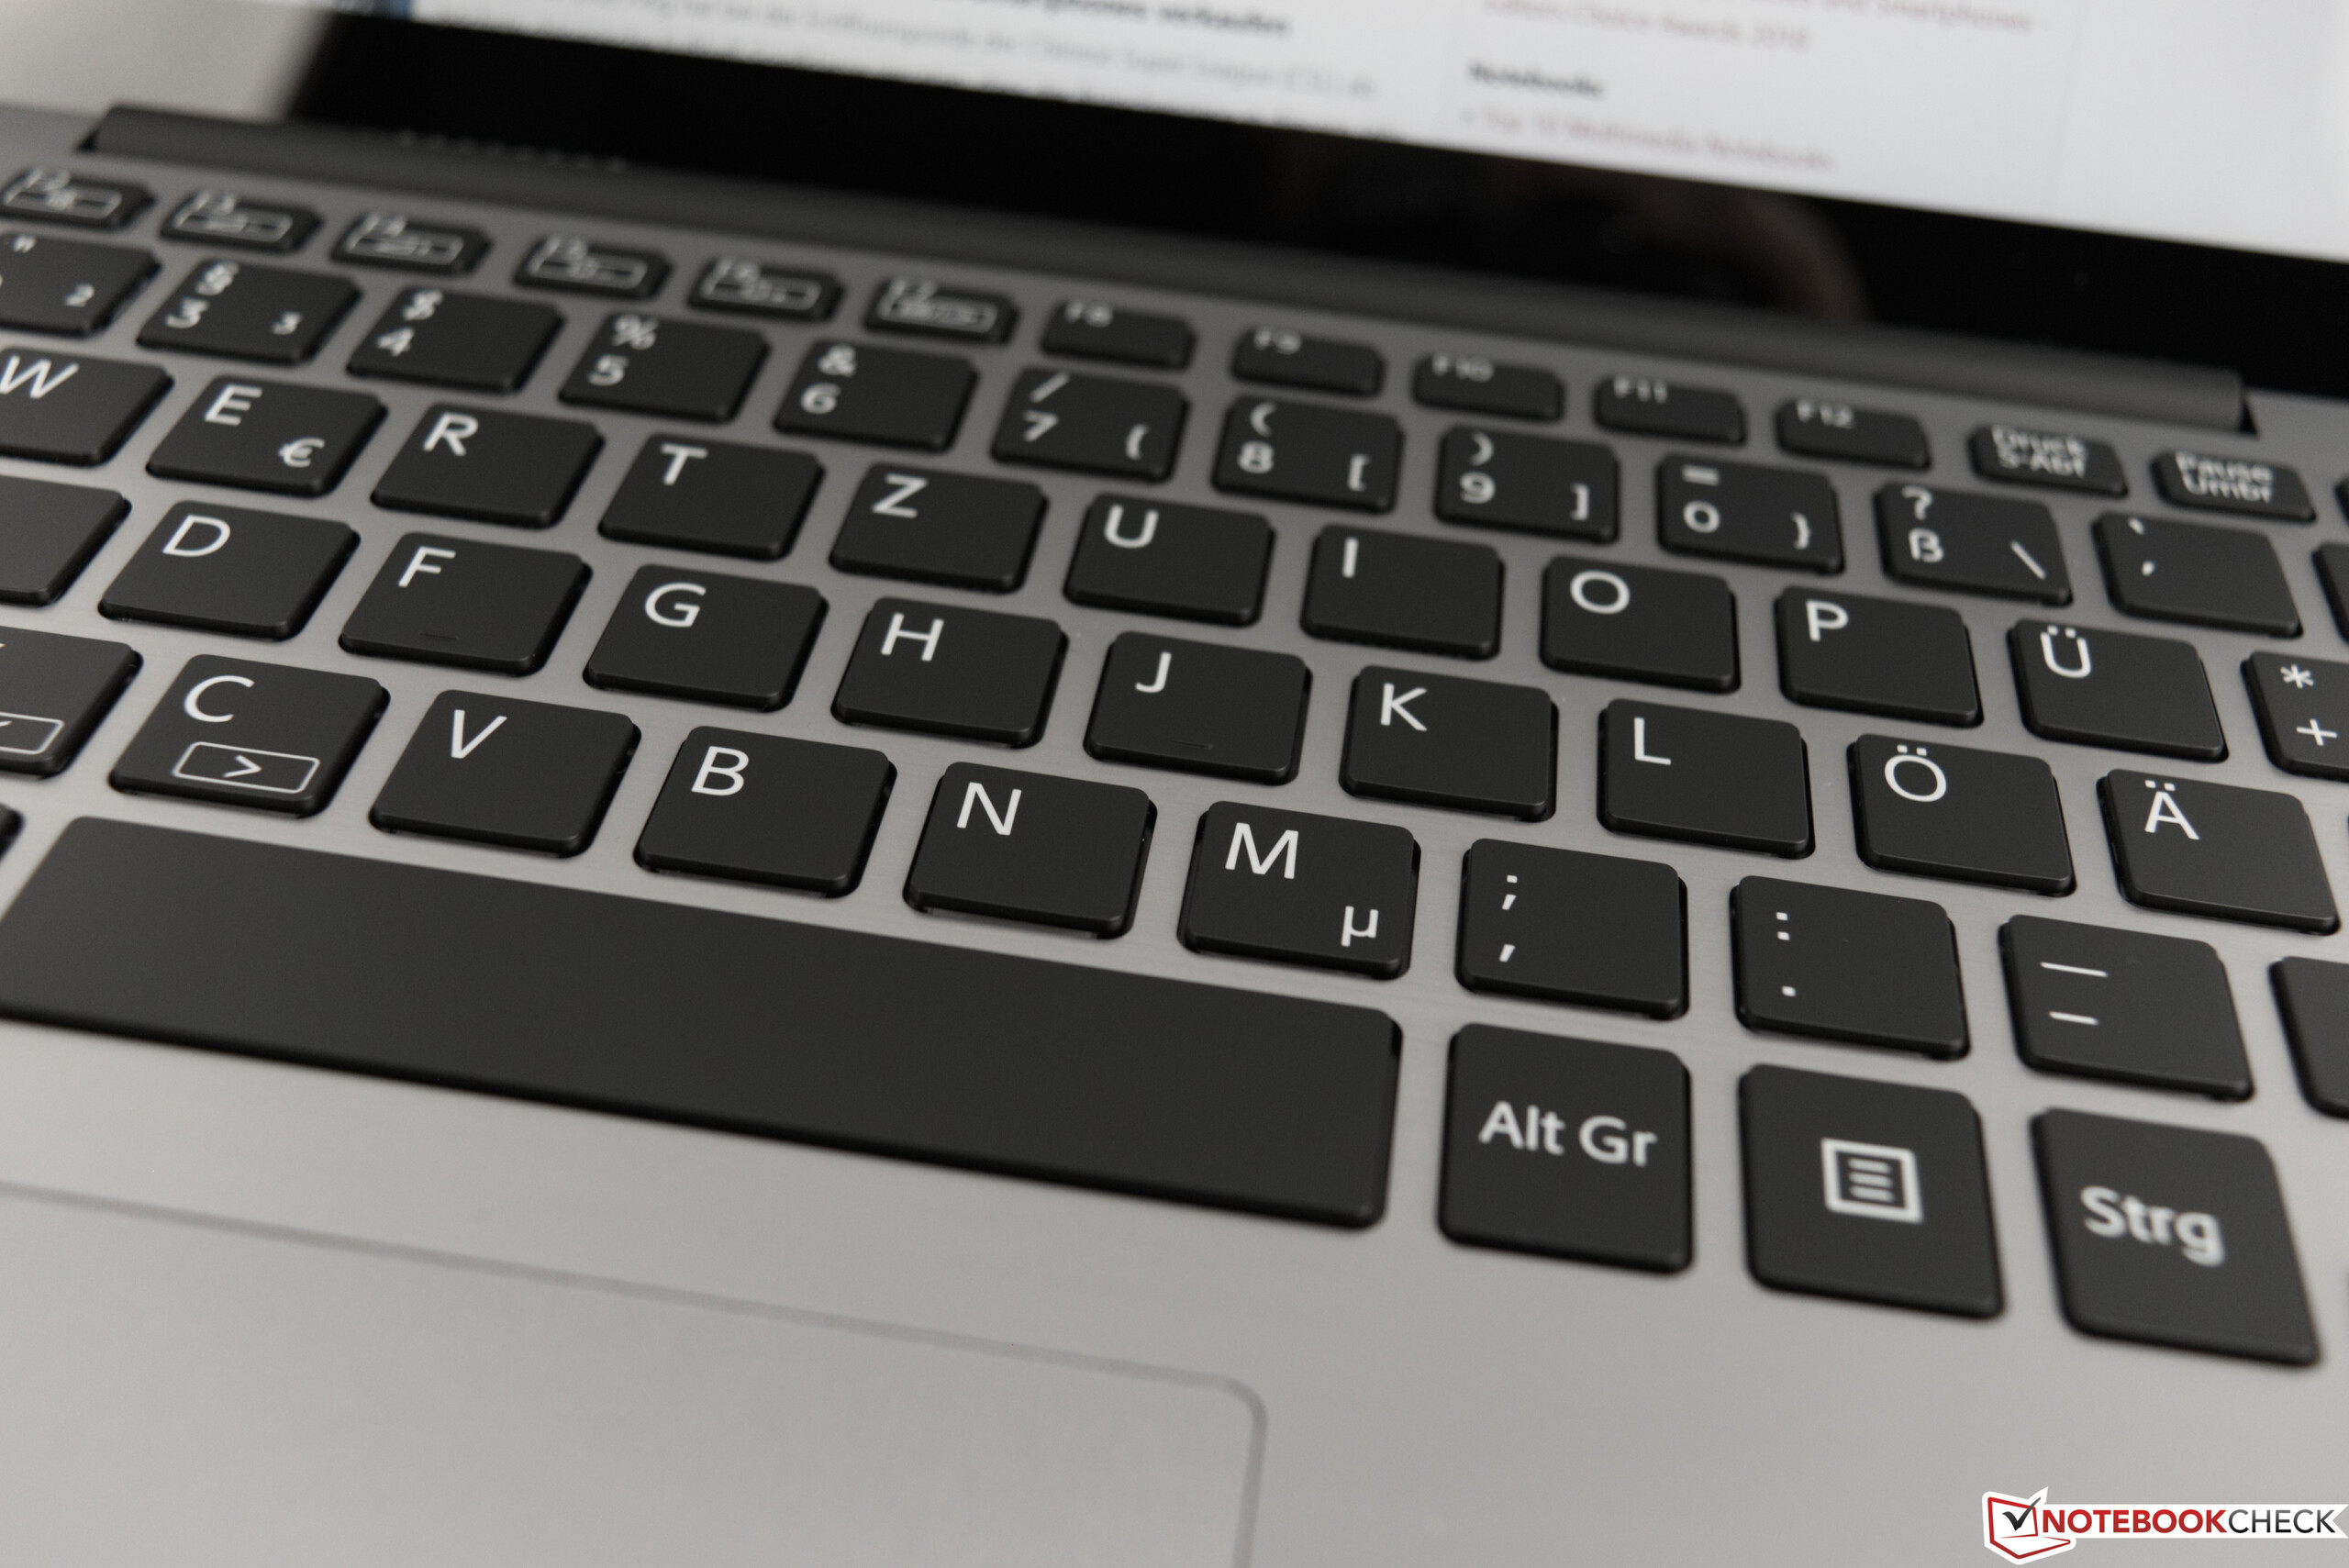
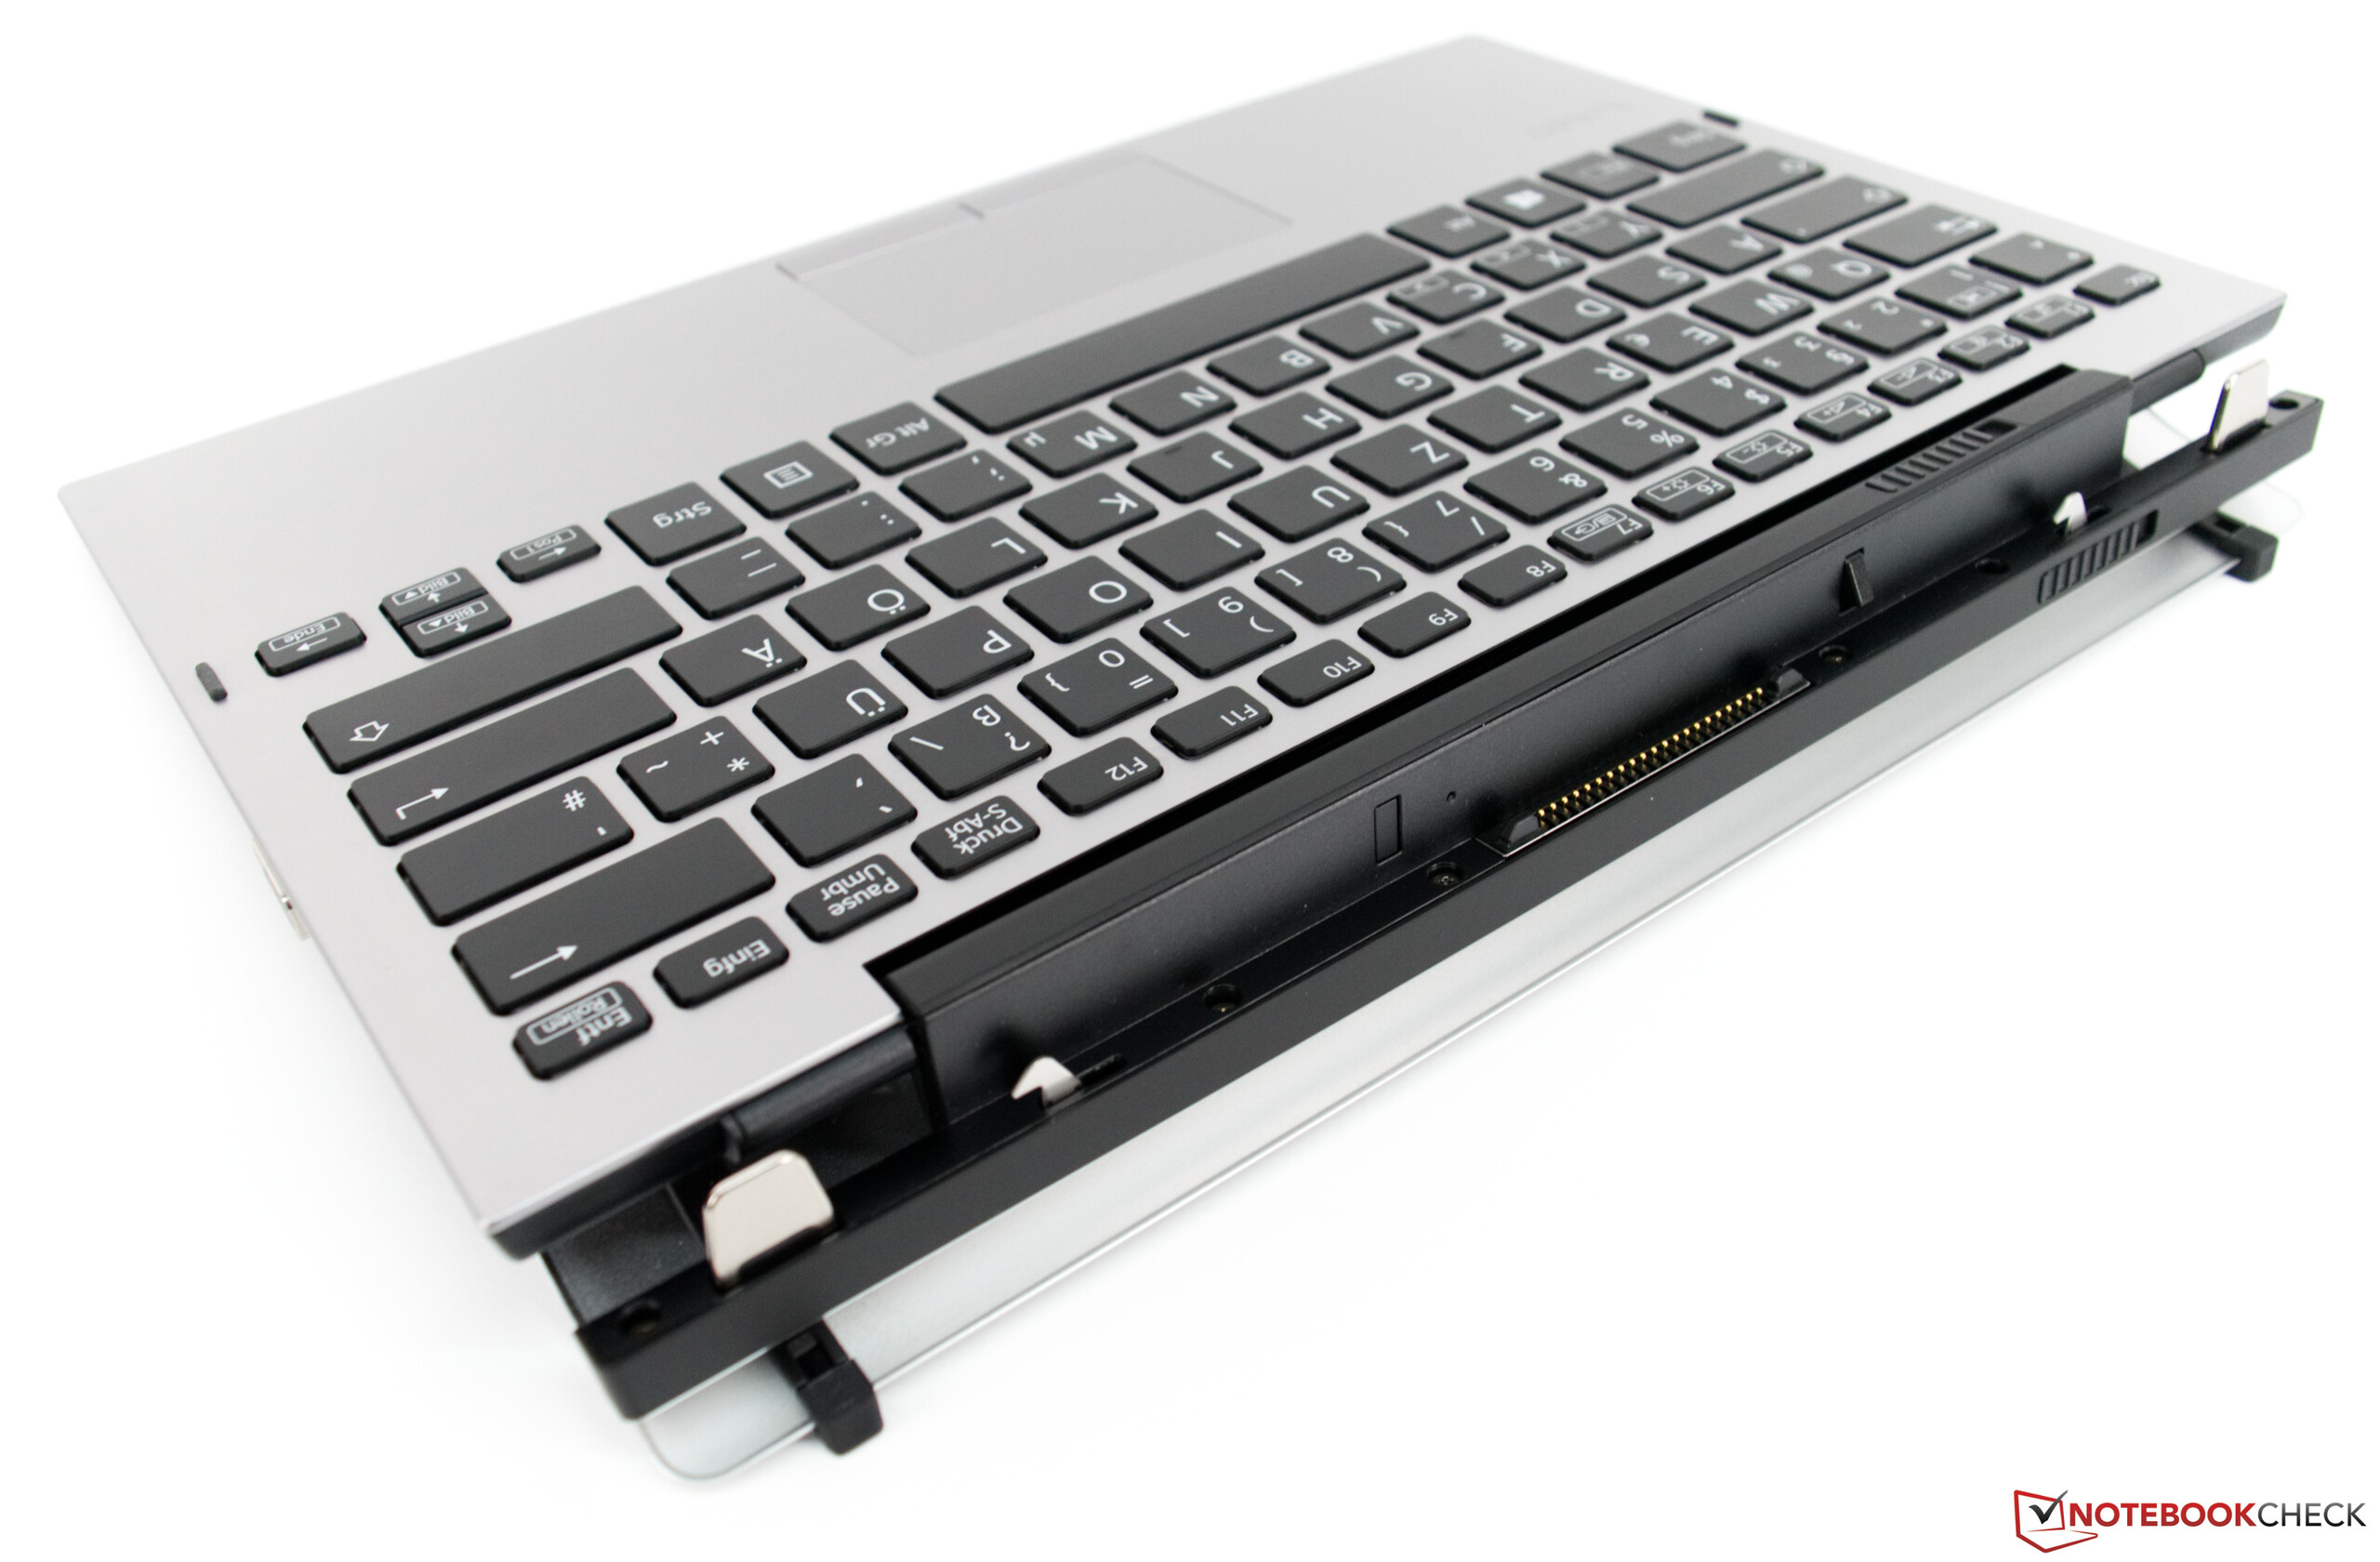
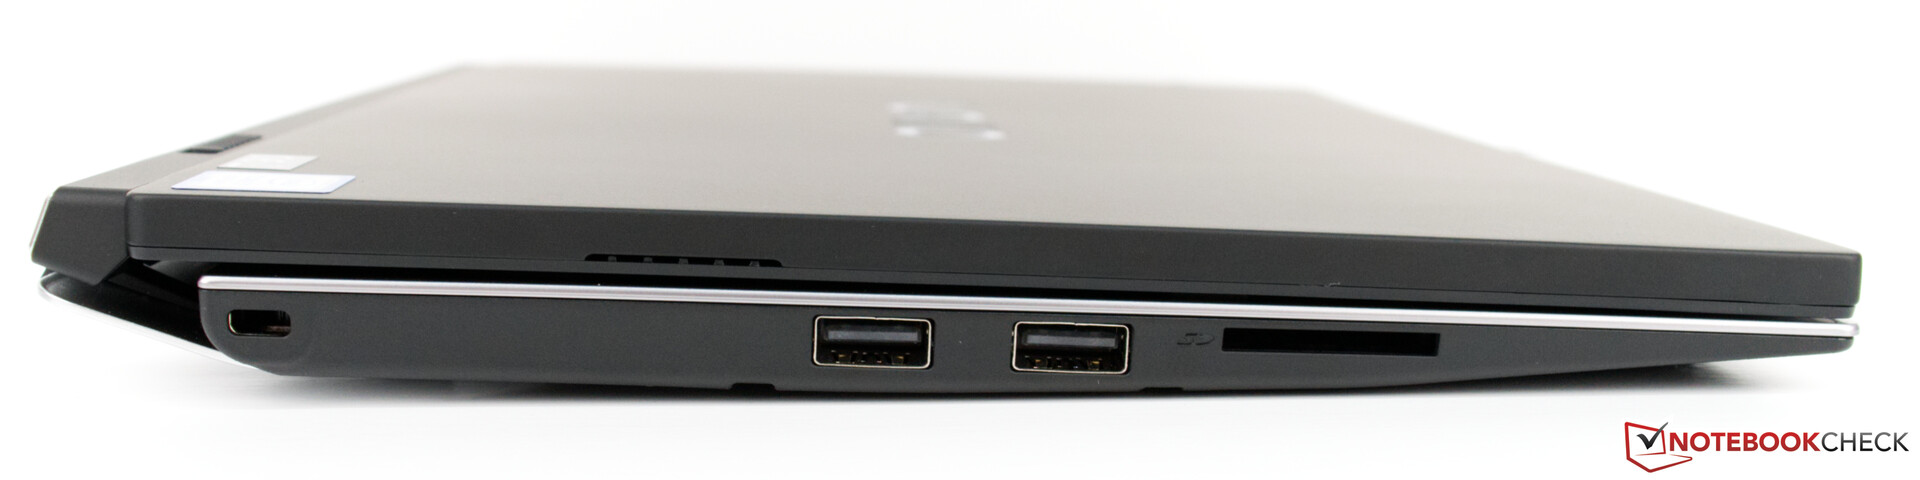
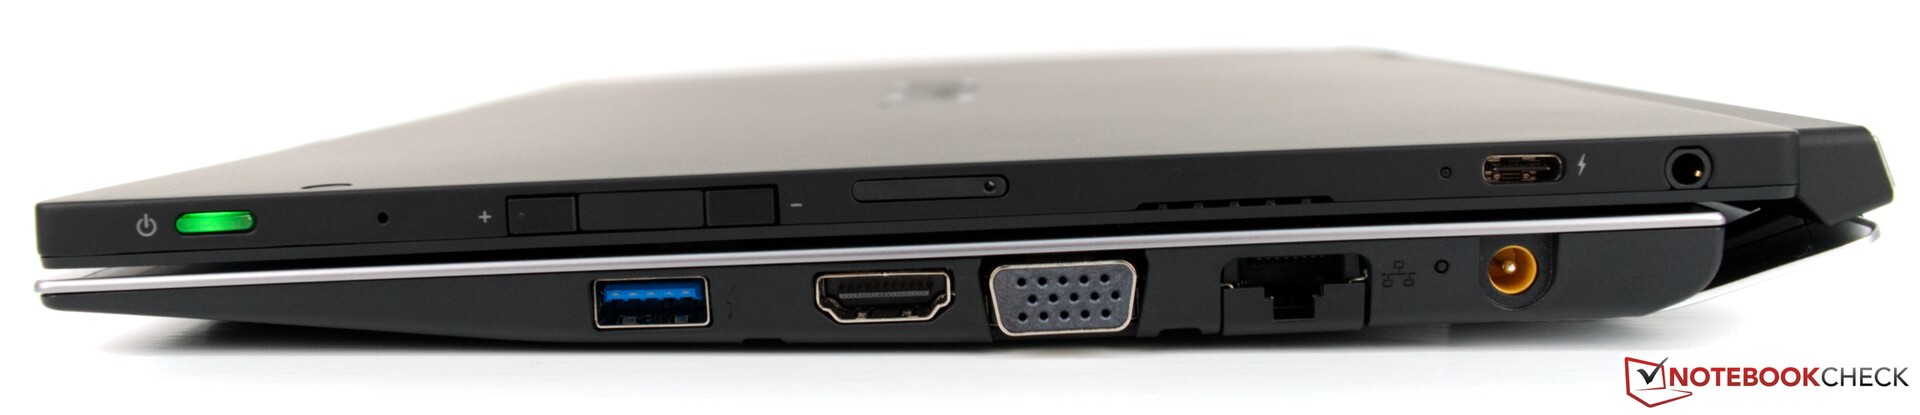
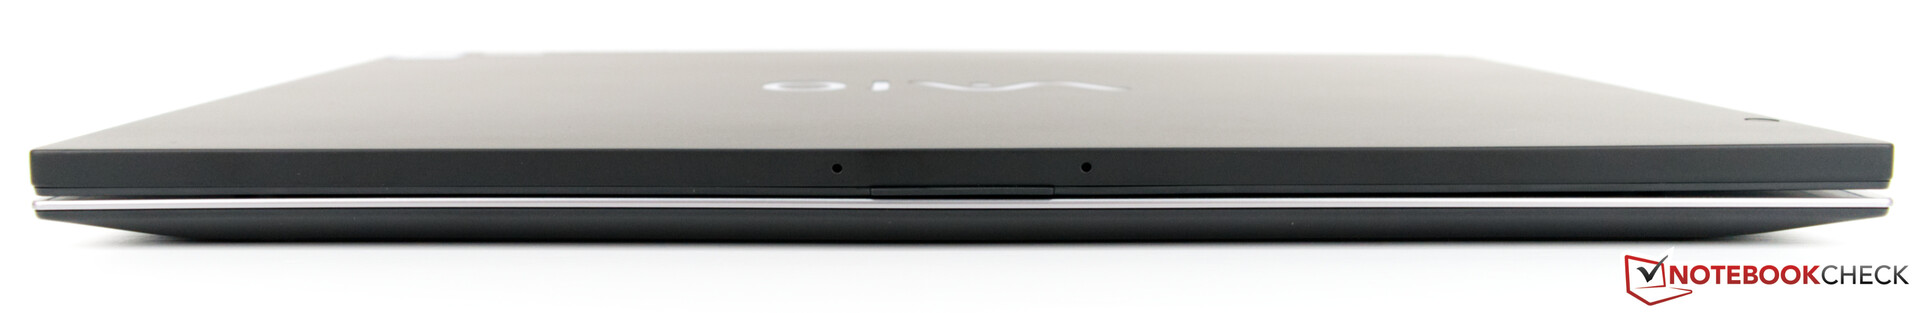
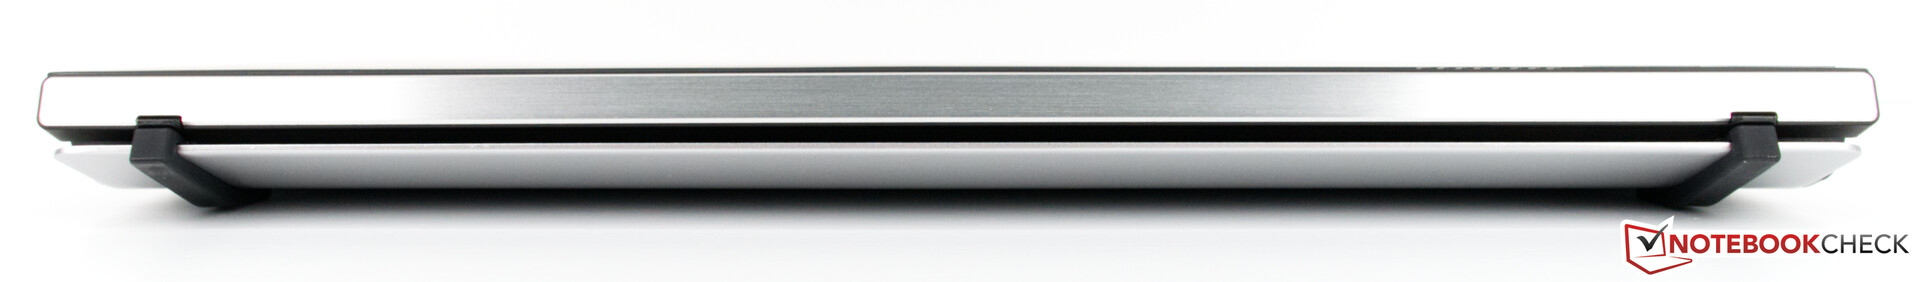
O A12 também tem a aparência de deve ser um dispositivo robusto com seu design grosso e o uso de materiais premium, mas ocorre o oposto. O tablet se flexiona muito facilmente para o nosso gosto e o dock de teclado se curva no meio ao digitar. Da mesma forma, apreciamos que a VAIO tenha equipado o A12 com um leitor de cartão SD em tamanho completo, mas a decisão de incluir um USB 2.0 em um dispositivo tão caro é desconcertante.
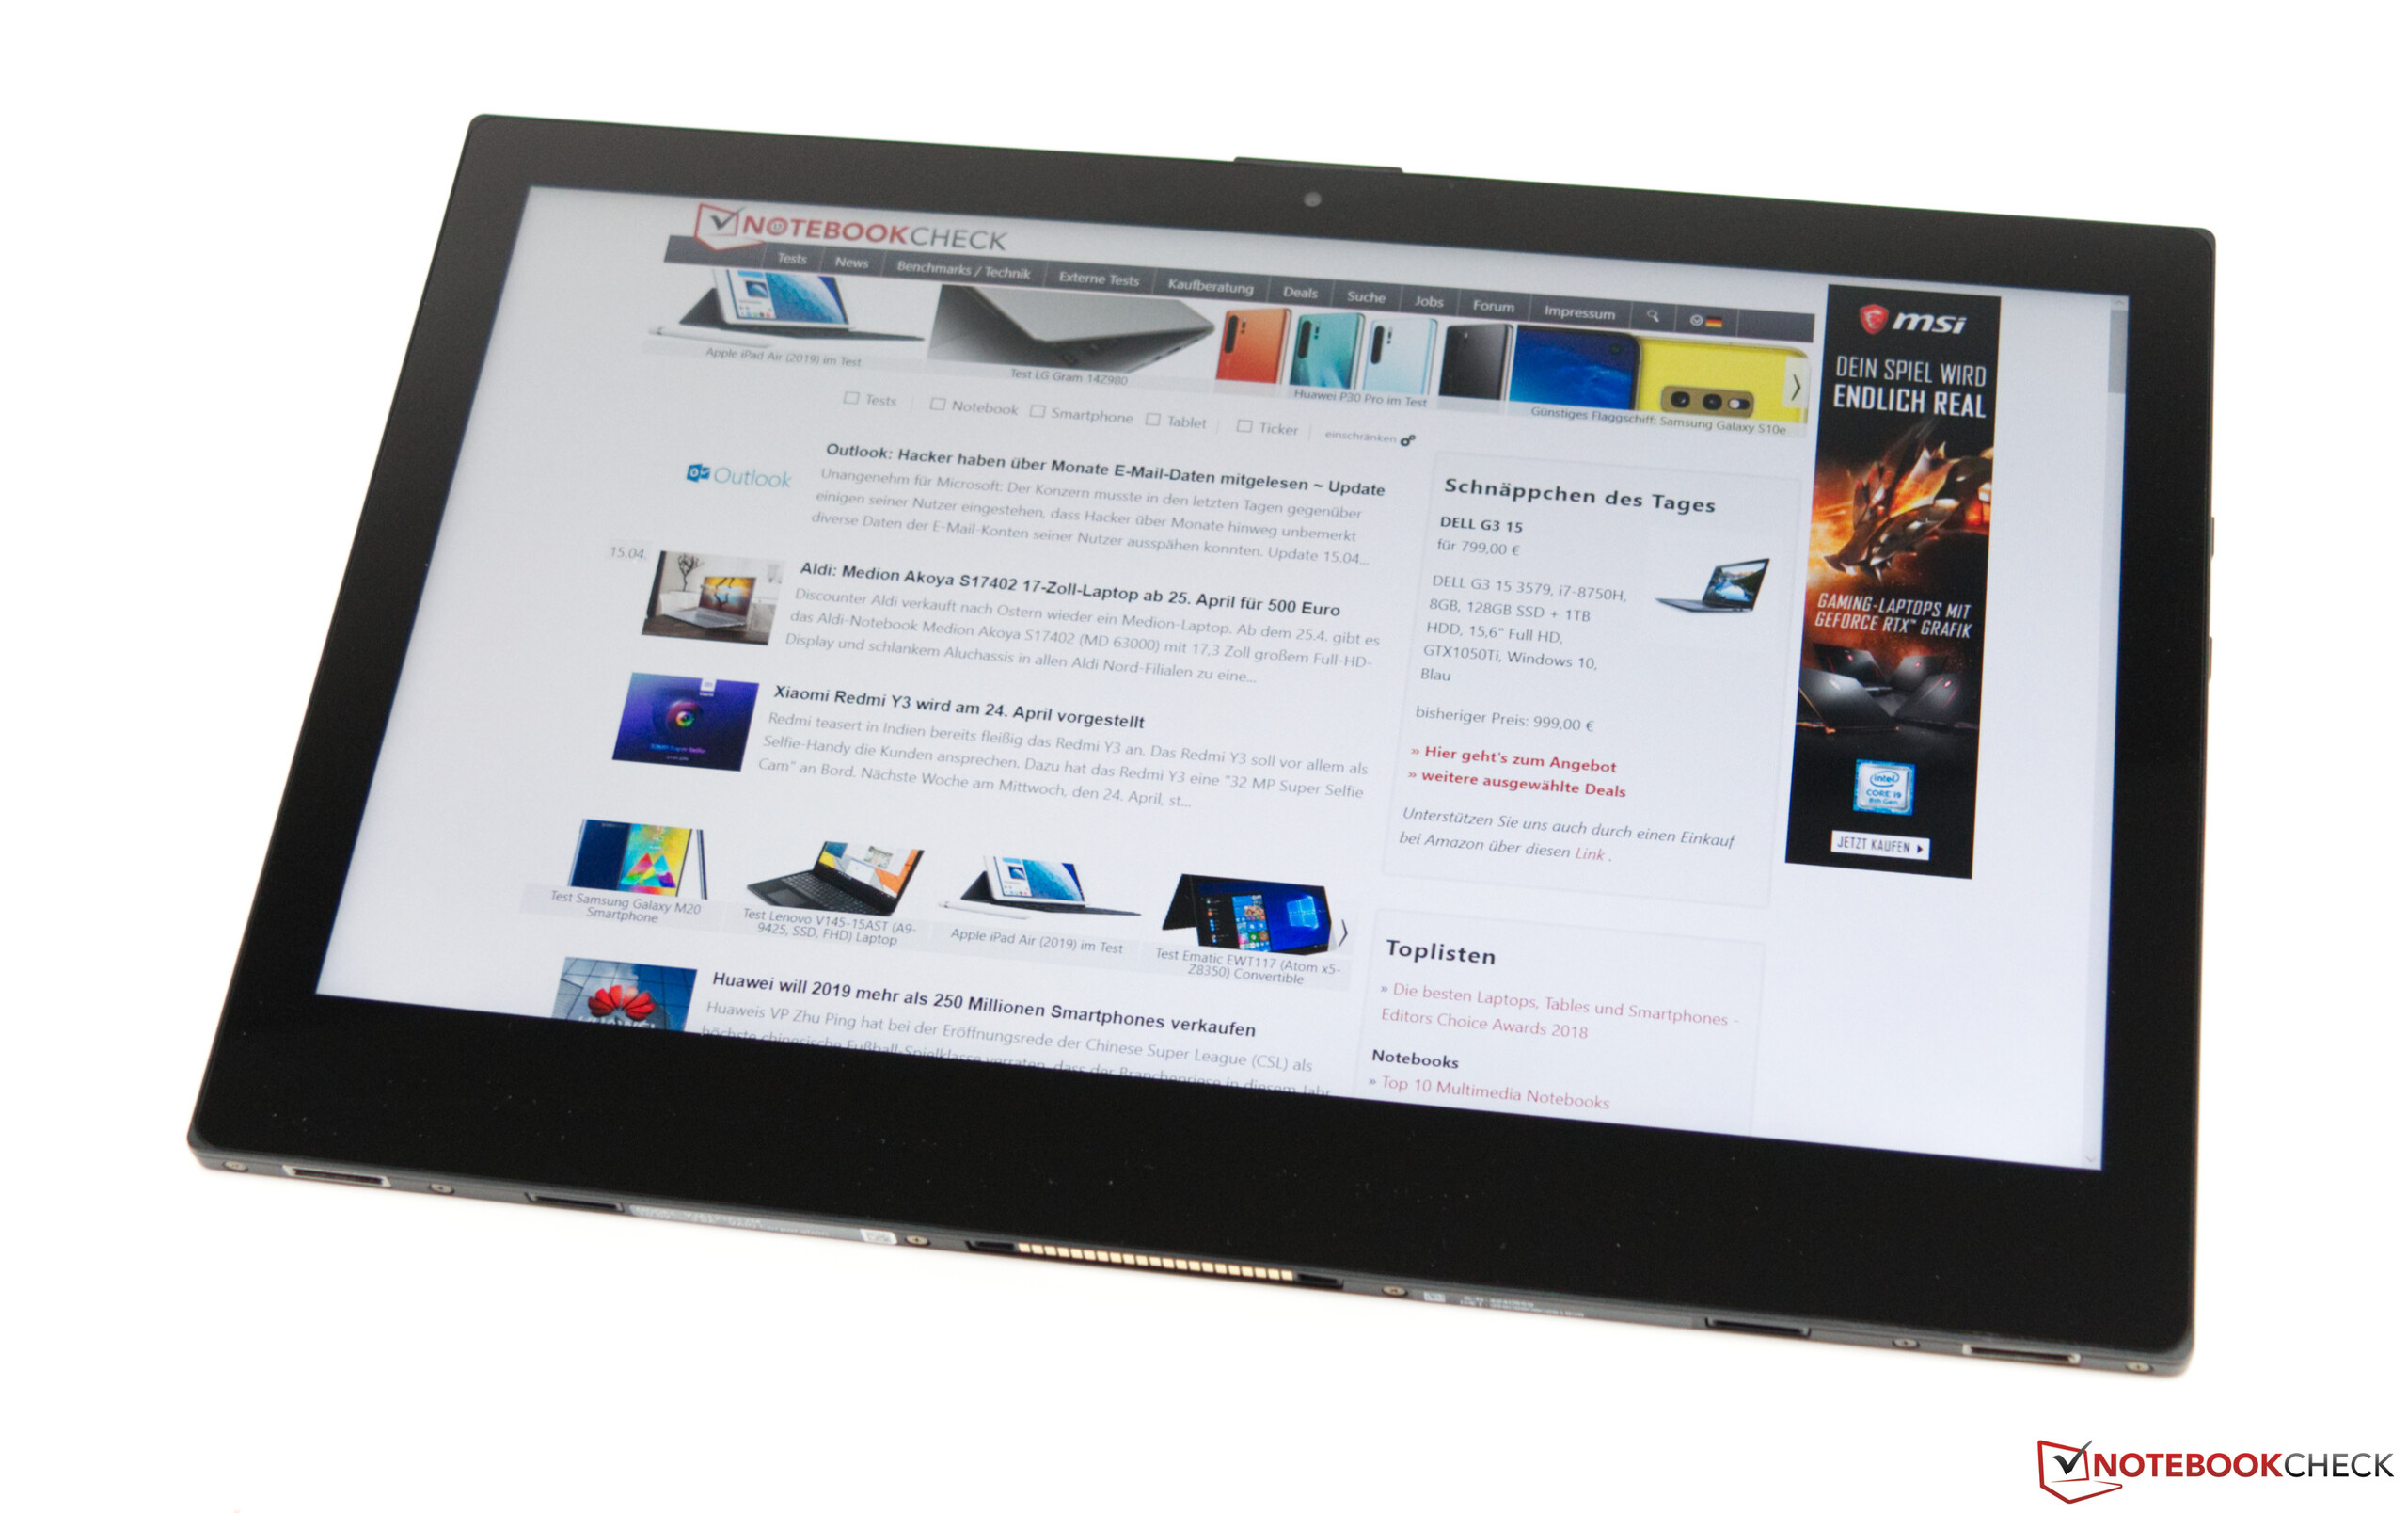
Em última análise, não seriamos tão duros com o A12 se fosse mais barato. Poderíamos perdoar um dispositivo por ter uma tela fraca, uma bateria pequena, alto-falantes abaixo da média e portas mal pensadas se fosse uma barganha, mas nenhuma que custasse € 2.799 (~$3148). O Surface Pro 6 não tem nenhum dos problemas que o A12 traz, tem uma CPU mais potente e é quase € 800 (~$900) mais barato também.
Em suma, o A12 está muito aquém das nossas expectativas, e pouco faz para justificar o seu preço alto. Embora o VAIO A12 tenha recebido respeitáveis 82% no geral, recomendamos que você considere um de seus concorrentes: você gastará menos e obterá um dispositivo melhor.
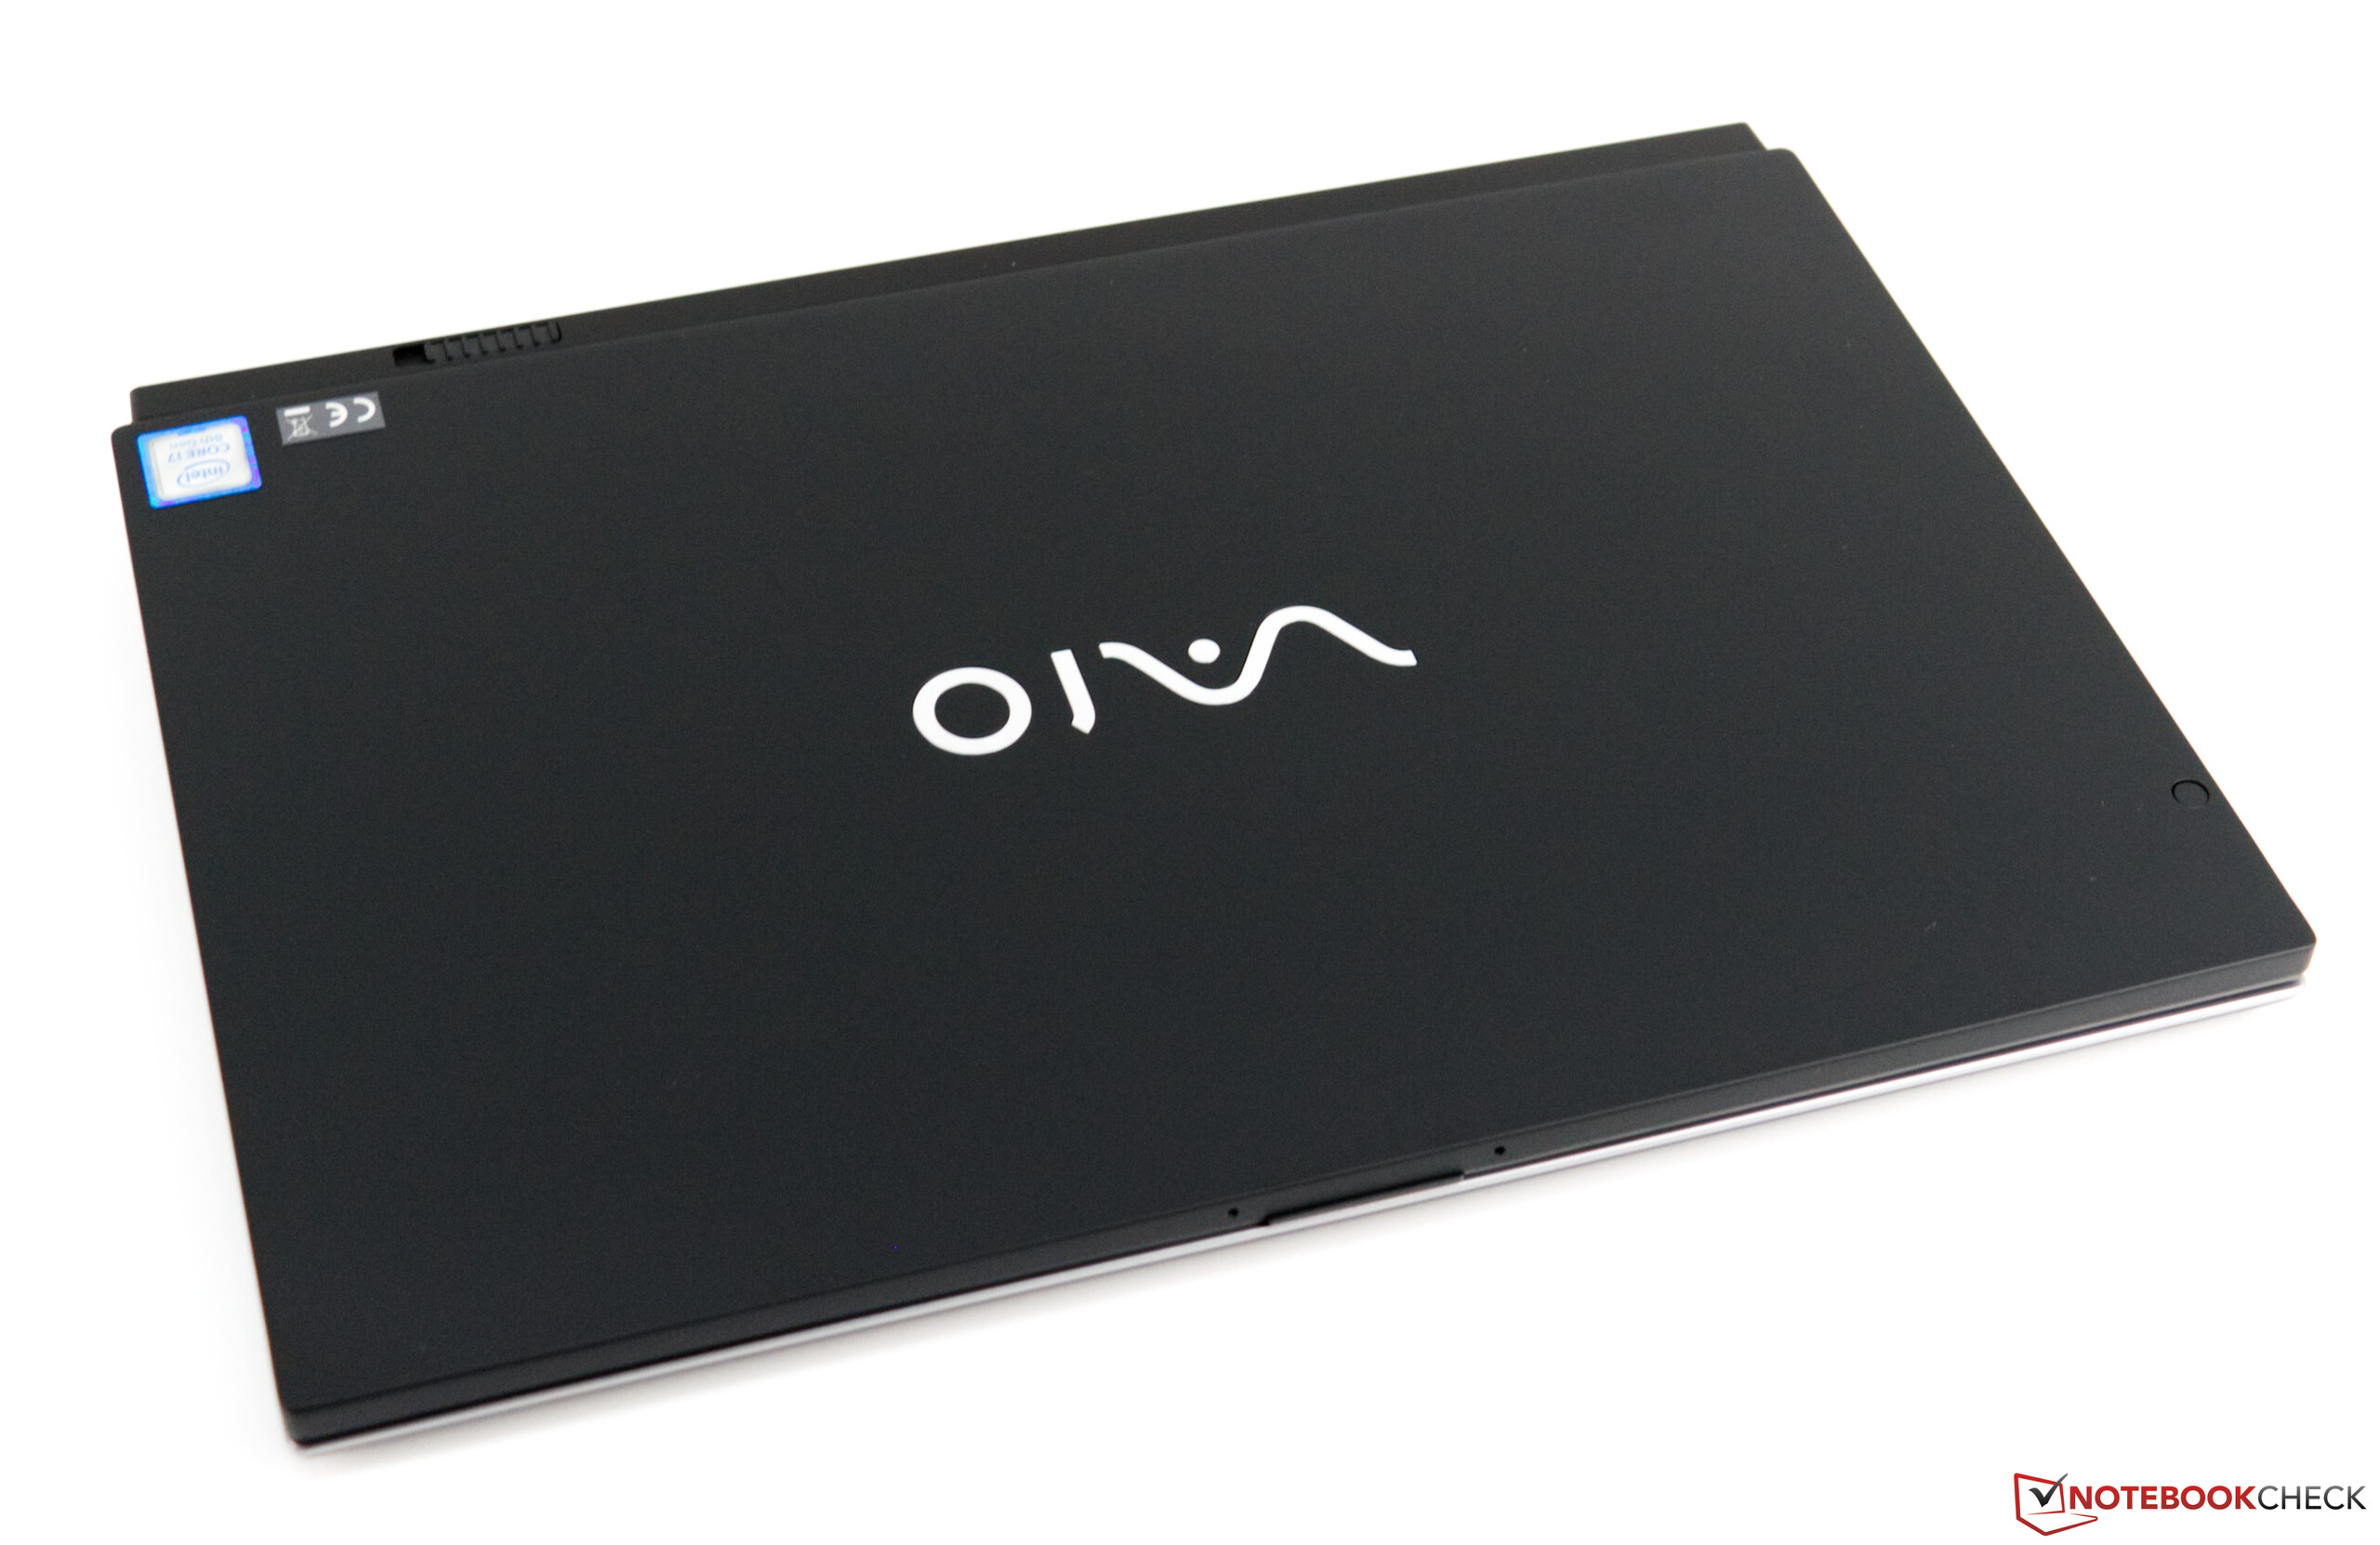
VAIO A12-92993
- 05/02/2019 v6 (old)
Sebastian Bade
Price comparison
