Breve Análise do Dell Inspiron 15 3585: Locked-In Office Ryzen
| SD Card Reader | |
| average JPG Copy Test (av. of 3 runs) | |
| Lenovo ThinkPad E485-20KU000NGE (Toshiba Exceria Pro M501) | |
| Média da turma Office (22.4 - 198.5, n=22, últimos 2 anos) | |
| Dell Inspiron 15 3585 (2300U, Vega 6) (Toshiba Exceria Pro SDXC 64 GB UHS-II) | |
| Dell Inspiron 15 5575-98MH4 (Toshiba Exceria Pro SDXC 64 GB UHS-II) | |
| maximum AS SSD Seq Read Test (1GB) | |
| Lenovo ThinkPad E485-20KU000NGE (Toshiba Exceria Pro M501) | |
| Média da turma Office (27.4 - 249, n=20, últimos 2 anos) | |
| Dell Inspiron 15 5575-98MH4 (Toshiba Exceria Pro SDXC 64 GB UHS-II) | |
| Dell Inspiron 15 3585 (2300U, Vega 6) (Toshiba Exceria Pro SDXC 64 GB UHS-II) | |
| Networking | |
| iperf3 transmit AX12 | |
| Dell Inspiron 15 5575-98MH4 | |
| Lenovo ThinkPad E485-20KU000NGE | |
| Dell Inspiron 15 3585 (2300U, Vega 6) | |
| iperf3 receive AX12 | |
| Dell Inspiron 15 5575-98MH4 | |
| Dell Inspiron 15 3585 (2300U, Vega 6) | |
| Lenovo ThinkPad E485-20KU000NGE | |
| |||||||||||||||||||||||||
iluminação: 88 %
iluminação com acumulador: 173 cd/m²
Contraste: 421:1 (Preto: 0.535 cd/m²)
ΔE ColorChecker Calman: 10.37 | ∀{0.5-29.43 Ø4.73}
calibrated: 3.89
ΔE Greyscale Calman: 12.09 | ∀{0.09-98 Ø4.97}
59% sRGB (Argyll 1.6.3 3D)
37% AdobeRGB 1998 (Argyll 1.6.3 3D)
40.52% AdobeRGB 1998 (Argyll 3D)
58.9% sRGB (Argyll 3D)
39.22% Display P3 (Argyll 3D)
Gamma: 2.72
CCT: 13335 K
| Dell Inspiron 15 3585 (2300U, Vega 6) BOE0802, , 1920x1080, 15.6" | Dell Inspiron 15 5575-98MH4 Innolux JMC9X 156BGA, , 1366x768, 15.6" | Lenovo ThinkPad E485-20KU000NGE B140HAN04.2, , 1920x1080, 14" | HP 250 G7 6HM85ES BOE0687, , 1920x1080, 15.6" | Acer Aspire 3 A315-41-R7BM Chi Mei CMN15D5, , 1920x1080, 15.6" | Acer Swift 3 SF314-55-31N8 Chi Mei N140HCE-EN2, , 1920x1080, 14" | |
|---|---|---|---|---|---|---|
| Display | 2% | -1% | 1% | 2% | 68% | |
| Display P3 Coverage (%) | 39.22 | 40.02 2% | 39.21 0% 38.48 -2% | 39.61 1% | 40.09 2% | 66.2 69% |
| sRGB Coverage (%) | 58.9 | 59.8 2% | 58.8 0% 57.9 -2% | 59.5 1% | 59.7 1% | 98.3 67% |
| AdobeRGB 1998 Coverage (%) | 40.52 | 41.37 2% | 40.52 0% 39.76 -2% | 40.93 1% | 41.47 2% | 67.8 67% |
| Response Times | -64% | -98% | -3% | -15% | -78% | |
| Response Time Grey 50% / Grey 80% * (ms) | 39 ? | 50 ? -28% | 44.8 ? -15% | 41 ? -5% | 44 ? -13% | 41 ? -5% |
| Response Time Black / White * (ms) | 12 ? | 24 ? -100% | 33.6 ? -180% | 12 ? -0% | 14 ? -17% | 30 ? -150% |
| PWM Frequency (Hz) | 250 ? | 250 ? | 25000 ? | 25000 ? | 25000 ? | |
| Screen | 3% | 43% | 0% | 6% | 58% | |
| Brightness middle (cd/m²) | 225 | 197 -12% | 289 28% | 205 -9% | 234 4% | 291 29% |
| Brightness (cd/m²) | 213 | 195 -8% | 271 27% | 205 -4% | 211 -1% | 276 30% |
| Brightness Distribution (%) | 88 | 78 -11% | 87 -1% | 88 0% | 83 -6% | 90 2% |
| Black Level * (cd/m²) | 0.535 | 0.43 20% | 0.19 64% | 0.52 3% | 0.43 20% | 0.27 50% |
| Contrast (:1) | 421 | 458 9% | 1521 261% | 394 -6% | 544 29% | 1078 156% |
| Colorchecker dE 2000 * | 10.37 | 10.35 -0% | 5.6 46% | 11.15 -8% | 11.27 -9% | 3.86 63% |
| Colorchecker dE 2000 max. * | 19.75 | 16.02 19% | 20.8 -5% | 19.08 3% | 18.03 9% | 8.26 58% |
| Colorchecker dE 2000 calibrated * | 3.89 | 4.7 -21% | 2.98 23% | |||
| Greyscale dE 2000 * | 12.09 | 11.25 7% | 2.7 78% | 12.62 -4% | 11.54 5% | 5.33 56% |
| Gamma | 2.72 81% | 2.08 106% | 1.96 112% | 2.38 92% | 2.09 105% | 2.25 98% |
| CCT | 13335 49% | 11592 56% | 6506 100% | 14189 46% | 11607 56% | 7426 88% |
| Color Space (Percent of AdobeRGB 1998) (%) | 37 | 38 3% | 37.2 1% | 38 3% | 38 3% | 62 68% |
| Color Space (Percent of sRGB) (%) | 59 | 60 2% | 58.5 -1% | 59 0% | 60 2% | 98 66% |
| Média Total (Programa/Configurações) | -20% /
-6% | -19% /
15% | -1% /
-0% | -2% /
2% | 16% /
42% |
* ... menor é melhor
Exibir tempos de resposta
| ↔ Tempo de resposta preto para branco | ||
|---|---|---|
| 12 ms ... ascensão ↗ e queda ↘ combinadas | ↗ 7 ms ascensão | 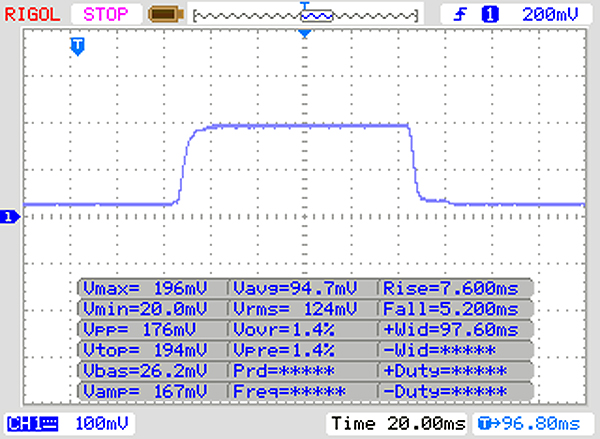 |
| ↘ 5 ms queda | ||
| A tela mostra boas taxas de resposta em nossos testes, mas pode ser muito lenta para jogadores competitivos. Em comparação, todos os dispositivos testados variam de 0.1 (mínimo) a 240 (máximo) ms. » 31 % de todos os dispositivos são melhores. Isso significa que o tempo de resposta medido é melhor que a média de todos os dispositivos testados (19.9 ms). | ||
| ↔ Tempo de resposta 50% cinza a 80% cinza | ||
| 39 ms ... ascensão ↗ e queda ↘ combinadas | ↗ 20 ms ascensão | 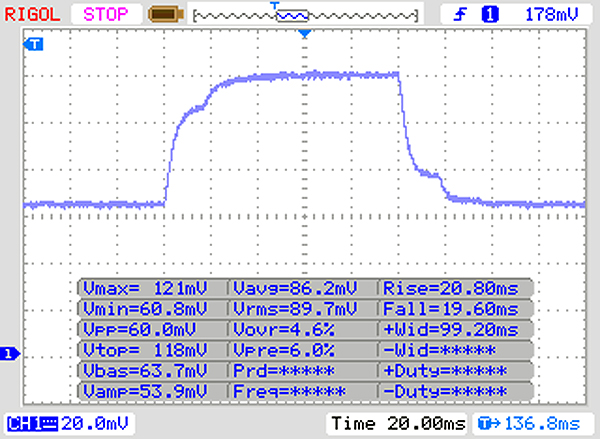 |
| ↘ 19 ms queda | ||
| A tela mostra taxas de resposta lentas em nossos testes e será insatisfatória para os jogadores. Em comparação, todos os dispositivos testados variam de 0.165 (mínimo) a 636 (máximo) ms. » 59 % de todos os dispositivos são melhores. Isso significa que o tempo de resposta medido é pior que a média de todos os dispositivos testados (31.1 ms). | ||
Cintilação da tela / PWM (modulação por largura de pulso)
| Tela tremeluzindo/PWM detectado | 250 Hz | ≤ 90 % configuração de brilho | 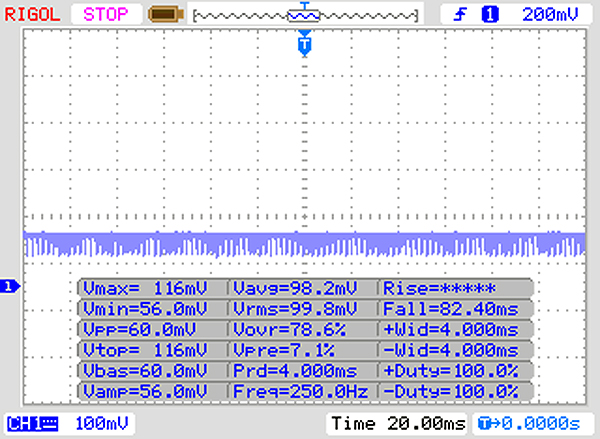 |
A luz de fundo da tela pisca em 250 Hz (pior caso, por exemplo, utilizando PWM) Cintilação detectada em uma configuração de brilho de 90 % e abaixo. Não deve haver cintilação ou PWM acima desta configuração de brilho. A frequência de 250 Hz é relativamente baixa, portanto, usuários sensíveis provavelmente notarão cintilação e sentirão fadiga ocular na configuração de brilho indicada e abaixo. [pwm_comparison] Em comparação: 52 % de todos os dispositivos testados não usam PWM para escurecer a tela. Se PWM foi detectado, uma média de 7810 (mínimo: 5 - máximo: 343500) Hz foi medida. | |||
| Cinebench R15 | |
| CPU Single 64Bit | |
| Média da turma Office (99.5 - 312, n=74, últimos 2 anos) | |
| HP 250 G7 6HM85ES | |
| Acer Swift 3 SF314-55-31N8 | |
| Lenovo ThinkPad E485-20KU000NGE | |
| Acer Aspire 3 A315-41-R7BM | |
| Dell Inspiron 15 5575-98MH4 | |
| Dell Inspiron 15 3585 (2300U, Vega 6) | |
| Média AMD Ryzen 3 2300U (n=1) | |
| CPU Multi 64Bit | |
| Média da turma Office (250 - 3380, n=74, últimos 2 anos) | |
| Lenovo ThinkPad E485-20KU000NGE | |
| HP 250 G7 6HM85ES | |
| Média AMD Ryzen 3 2300U (n=1) | |
| Dell Inspiron 15 3585 (2300U, Vega 6) | |
| Acer Swift 3 SF314-55-31N8 | |
| Acer Aspire 3 A315-41-R7BM | |
| Dell Inspiron 15 5575-98MH4 | |
| Cinebench R11.5 | |
| CPU Single 64Bit | |
| Média da turma Office (2 - 3.6, n=13, últimos 2 anos) | |
| Acer Swift 3 SF314-55-31N8 | |
| HP 250 G7 6HM85ES | |
| Acer Aspire 3 A315-41-R7BM | |
| Dell Inspiron 15 5575-98MH4 | |
| Dell Inspiron 15 3585 (2300U, Vega 6) | |
| Média AMD Ryzen 3 2300U (n=1) | |
| CPU Multi 64Bit | |
| Média da turma Office (9.76 - 31.5, n=13, últimos 2 anos) | |
| HP 250 G7 6HM85ES | |
| Dell Inspiron 15 3585 (2300U, Vega 6) | |
| Média AMD Ryzen 3 2300U (n=1) | |
| Acer Swift 3 SF314-55-31N8 | |
| Acer Aspire 3 A315-41-R7BM | |
| Dell Inspiron 15 5575-98MH4 | |
| Cinebench R10 | |
| Rendering Single CPUs 64Bit | |
| Média da turma Office (11106 - 15443, n=6, últimos 2 anos) | |
| HP 250 G7 6HM85ES | |
| Dell Inspiron 15 3585 (2300U, Vega 6) | |
| Média AMD Ryzen 3 2300U (n=1) | |
| Rendering Multiple CPUs 64Bit | |
| Média da turma Office (48700 - 76704, n=6, últimos 2 anos) | |
| Dell Inspiron 15 3585 (2300U, Vega 6) | |
| Média AMD Ryzen 3 2300U (n=1) | |
| HP 250 G7 6HM85ES | |
| PCMark 8 | |
| Home Score Accelerated v2 | |
| Média da turma Office (n=1últimos 2 anos) | |
| Lenovo ThinkPad E485-20KU000NGE | |
| Acer Aspire 3 A315-41-R7BM | |
| Acer Swift 3 SF314-55-31N8 | |
| HP 250 G7 6HM85ES | |
| Dell Inspiron 15 5575-98MH4 | |
| Dell Inspiron 15 3585 (2300U, Vega 6) | |
| Média AMD Ryzen 3 2300U, AMD Radeon RX Vega 6 (Ryzen 2000/3000) (n=1) | |
| Work Score Accelerated v2 | |
| Média da turma Office (n=1últimos 2 anos) | |
| Lenovo ThinkPad E485-20KU000NGE | |
| Acer Aspire 3 A315-41-R7BM | |
| Acer Swift 3 SF314-55-31N8 | |
| HP 250 G7 6HM85ES | |
| Dell Inspiron 15 3585 (2300U, Vega 6) | |
| Média AMD Ryzen 3 2300U, AMD Radeon RX Vega 6 (Ryzen 2000/3000) (n=1) | |
| PCMark 8 Home Score Accelerated v2 | 2915 pontos | |
| PCMark 8 Work Score Accelerated v2 | 3915 pontos | |
| PCMark 10 Score | 2901 pontos | |
Ajuda | ||
| Dell Inspiron 15 3585 (2300U, Vega 6) Toshiba BG3 KBG30ZMS256G | Dell Inspiron 15 5575-98MH4 Seagate Mobile HDD 1TB ST1000LM035 | Lenovo ThinkPad E485-20KU000NGE Samsung PM961 MZVLW256HEHP | HP 250 G7 6HM85ES WDC PC SN520 SDAPNUW-512G | Acer Aspire 3 A315-41-R7BM SK Hynix HFS256G39TND-N210A | Acer Swift 3 SF314-55-31N8 Kingston RBUSNS8154P3128GJ | Apple MacBook 12 (Early 2016) 1.1 GHz Apple SSD AP0256 | Média Toshiba BG3 KBG30ZMS256G | |
|---|---|---|---|---|---|---|---|---|
| CrystalDiskMark 5.2 / 6 | -92% | 45% | 95% | -32% | 16% | -8% | ||
| Write 4K (MB/s) | 87.3 | 3.776 -96% | 72.2 -17% | 179.3 105% | 64.5 -26% | 96.8 11% | 80.3 ? -8% | |
| Read 4K (MB/s) | 23.54 | 0.439 -98% | 35.25 50% | 47.7 103% | 25.1 7% | 36.99 57% | 30.1 ? 28% | |
| Write Seq (MB/s) | 824 | 74.9 -91% | 1412 71% | 1265 54% | 260.2 -68% | 463.1 -44% | 338 ? -59% | |
| Read Seq (MB/s) | 715 | 136.3 -81% | 1523 113% | 1184 66% | 505 -29% | 794 11% | 863 ? 21% | |
| Write 4K Q32T1 (MB/s) | 147.8 | 4.585 -97% | 102.1 -31% | 450.6 205% | 164 11% | 291.7 97% | 155 ? 5% | |
| Read 4K Q32T1 (MB/s) | 256.1 | 1.135 -100% | 170.9 -33% | 556 117% | 200.7 -22% | 352 37% | 297 ? 16% | |
| Write Seq Q32T1 (MB/s) | 733 | 114.5 -84% | 1429 95% | 1455 98% | 258.5 -65% | 468.1 -36% | 331 ? -55% | |
| Read Seq Q32T1 (MB/s) | 1525 | 146 -90% | 3204 110% | 1717 13% | 513 -66% | 1489 -2% | 1397 ? -8% | |
| AS SSD | 74% | 145% | -30% | 23% | -1% | -4% | ||
| Seq Read (MB/s) | 1291 | 2030 57% | 1477 14% | 457.6 -65% | 1201 -7% | 1056 -18% | 1143 ? -11% | |
| Seq Write (MB/s) | 688 | 1395 103% | 1339 95% | 241.8 -65% | 434.5 -37% | 651 -5% | 297 ? -57% | |
| 4K Read (MB/s) | 21.87 | 38.63 77% | 46.26 112% | 22.24 2% | 40.9 87% | 16.4 -25% | 27 ? 23% | |
| 4K Write (MB/s) | 35.62 | 63.9 79% | 143.9 304% | 40.46 14% | 90 153% | 22.1 -38% | 61.9 ? 74% | |
| 4K-64 Read (MB/s) | 632 | 1035 64% | 937 48% | 187.9 -70% | 425.5 -33% | 509 -19% | 390 ? -38% | |
| 4K-64 Write (MB/s) | 221.2 | 371.5 68% | 1190 438% | 145 -34% | 390.9 77% | 283 28% | 153.5 ? -31% | |
| Access Time Read * (ms) | 0.33 | 0.054 84% | 0.046 86% | 0.136 59% | 0.184 44% | 0.186 44% | 0.2922 ? 11% | |
| Access Time Write * (ms) | 0.234 | 0.059 75% | 0.024 90% | 0.225 4% | 0.048 79% | 0.2796 ? -19% | ||
| Score Read (Points) | 783 | 1277 63% | 1131 44% | 256 -67% | 586 -25% | 531 ? -32% | ||
| Score Write (Points) | 326 | 575 76% | 1468 350% | 210 -36% | 524 61% | 245 ? -25% | ||
| Score Total (Points) | 1489 | 2478 66% | 3181 114% | 594 -60% | 1386 -7% | 1014 ? -32% | ||
| Copy ISO MB/s (MB/s) | 432.6 | 765 77% | 199.8 -54% | 310.1 -28% | 545 26% | 457 ? 6% | ||
| Copy Program MB/s (MB/s) | 95.6 | 239.9 151% | 94 -2% | 88.4 -8% | 175.9 ? 84% | |||
| Copy Game MB/s (MB/s) | 263.4 | 528 100% | 145.4 -45% | 166.4 -37% | 239 ? -9% | |||
| Média Total (Programa/Configurações) | -92% /
-92% | 60% /
62% | 120% /
127% | -31% /
-31% | 20% /
20% | -1% /
-1% | -6% /
-5% |
* ... menor é melhor

| 3DMark 11 - 1280x720 Performance GPU | |
| Média da turma Office (2551 - 18313, n=68, últimos 2 anos) | |
| Média AMD Radeon RX Vega 6 (Ryzen 2000/3000) (2986 - 3325, n=3) | |
| Dell Inspiron 15 3585 (2300U, Vega 6) | |
| Lenovo ThinkPad E485-20KU000NGE | |
| Acer Aspire 3 A315-41-R7BM | |
| Lenovo ThinkCentre M920z | |
| HP 250 G7 6HM85ES | |
| 3DMark | |
| 1280x720 Cloud Gate Standard Graphics | |
| Média da turma Office (11640 - 118515, n=37, últimos 2 anos) | |
| Média AMD Radeon RX Vega 6 (Ryzen 2000/3000) (15850 - 18140, n=3) | |
| Dell Inspiron 15 3585 (2300U, Vega 6) | |
| Lenovo ThinkPad E485-20KU000NGE | |
| Acer Aspire 3 A315-41-R7BM | |
| Lenovo ThinkCentre M920z | |
| HP 250 G7 6HM85ES | |
| Dell Inspiron 15 5575-98MH4 | |
| 1920x1080 Fire Strike Graphics | |
| Média da turma Office (736 - 21871, n=72, últimos 2 anos) | |
| Média AMD Radeon RX Vega 6 (Ryzen 2000/3000) (2064 - 2312, n=3) | |
| Dell Inspiron 15 3585 (2300U, Vega 6) | |
| Lenovo ThinkPad E485-20KU000NGE | |
| Acer Aspire 3 A315-41-R7BM | |
| Lenovo ThinkCentre M920z | |
| HP 250 G7 6HM85ES | |
| Dell Inspiron 15 5575-98MH4 | |
| 3DMark 06 Score 1366x768 | 11313 pontos | |
| 3DMark Vantage P Result | 8189 pontos | |
| 3DMark 11 Performance | 3111 pontos | |
| 3DMark Ice Storm Standard Score | 72343 pontos | |
| 3DMark Cloud Gate Standard Score | 9963 pontos | |
| 3DMark Fire Strike Score | 1878 pontos | |
| 3DMark Time Spy Score | 585 pontos | |
Ajuda | ||
| The Witcher 3 | |
| 1024x768 Low Graphics & Postprocessing | |
| Média da turma Office (32.2 - 103.7, n=4, últimos 2 anos) | |
| Dell Inspiron 15 3585 (2300U, Vega 6) | |
| Média AMD Radeon RX Vega 6 (Ryzen 2000/3000) (38 - 39, n=2) | |
| Acer Aspire 3 A315-41-R7BM | |
| 1366x768 Medium Graphics & Postprocessing | |
| Média da turma Office (44.7 - 63.9, n=4, últimos 2 anos) | |
| Dell Inspiron 15 3585 (2300U, Vega 6) | |
| Média AMD Radeon RX Vega 6 (Ryzen 2000/3000) (n=1) | |
| Acer Aspire 3 A315-41-R7BM | |
| 1920x1080 High Graphics & Postprocessing (Nvidia HairWorks Off) | |
| Média da turma Office (23.7 - 39.9, n=4, últimos 2 anos) | |
| Média AMD Radeon RX Vega 6 (Ryzen 2000/3000) (7.4 - 9.7, n=2) | |
| Dell Inspiron 15 3585 (2300U, Vega 6) | |
| Acer Aspire 3 A315-41-R7BM | |
| Rise of the Tomb Raider | |
| 1024x768 Lowest Preset | |
| Média AMD Radeon RX Vega 6 (Ryzen 2000/3000) (29.8 - 37.5, n=2) | |
| Lenovo ThinkPad E485-20KU000NGE | |
| Dell Inspiron 15 3585 (2300U, Vega 6) | |
| Acer Aspire 3 A315-41-R7BM | |
| Dell Inspiron 15 5575-98MH4 | |
| HP 250 G7 6HM85ES | |
| 1366x768 Medium Preset AF:2x | |
| Dell Inspiron 15 3585 (2300U, Vega 6) | |
| Média AMD Radeon RX Vega 6 (Ryzen 2000/3000) (n=1) | |
| Acer Aspire 3 A315-41-R7BM | |
| HP 250 G7 6HM85ES | |
| Dell Inspiron 15 5575-98MH4 | |
| 1920x1080 High Preset AA:FX AF:4x | |
| Média AMD Radeon RX Vega 6 (Ryzen 2000/3000) (9.7 - 12.4, n=2) | |
| Lenovo ThinkPad E485-20KU000NGE | |
| Dell Inspiron 15 3585 (2300U, Vega 6) | |
| Acer Aspire 3 A315-41-R7BM | |
| Doom | |
| 1280x720 Low Preset | |
| Lenovo ThinkPad E485-20KU000NGE | |
| Dell Inspiron 15 3585 (2300U, Vega 6) | |
| Média AMD Radeon RX Vega 6 (Ryzen 2000/3000) (n=1) | |
| 1366x768 Medium Preset | |
| Dell Inspiron 15 3585 (2300U, Vega 6) | |
| Média AMD Radeon RX Vega 6 (Ryzen 2000/3000) (n=1) | |
| 1920x1080 Medium Preset | |
| Dell Inspiron 15 3585 (2300U, Vega 6) | |
| Média AMD Radeon RX Vega 6 (Ryzen 2000/3000) (n=1) | |
| baixo | média | alto | ultra | |
|---|---|---|---|---|
| Crysis 3 (2013) | 21.9 | 14.6 | 11.5 | |
| SimCity (2013) | 59.1 | 34.5 | 19 | 8.7 |
| Total War: Rome II (2013) | 61.1 | 42.7 | 29.8 | |
| Battlefield 4 (2013) | 40.1 | 29.9 | 19.7 | 8.4 |
| Alien: Isolation (2014) | 26.7 | 19.7 | 10.6 | |
| GTA V (2015) | 43.2 | 34.1 | 10.4 | |
| Dirt Rally (2015) | 95 | 31.1 | 16.9 | |
| The Witcher 3 (2015) | 39 | 19.6 | 7.4 | 6 |
| Rise of the Tomb Raider (2016) | 29.8 | 18.5 | 9.7 | |
| Ashes of the Singularity (2016) | 11 | 5.7 | 4.1 | |
| Doom (2016) | 13.1 | 13.2 | ||
| Farming Simulator 17 (2016) | 99.6 | 50.6 | 18.4 | |
| Rocket League (2017) | 52.6 | 26.9 | 17.4 | |
| Dirt 4 (2017) | 57.5 | 21.6 | 12.6 | |
| Call of Duty WWII (2017) | 21.9 | 17.1 | 8.8 | |
| Fortnite (2018) | 55.1 | 22.2 | 7.7 | |
| F1 2018 (2018) | 19 | 12 | 12 | |
| Shadow of the Tomb Raider (2018) | 18 | 7 | 6 | |
| FIFA 19 (2018) | 31.7 | 18.1 | 14.9 | |
| Forza Horizon 4 (2018) | 22.6 | 10.2 | 9.2 | |
| Darksiders III (2018) | 43 | 7.7 | 7 | |
| Anthem (2019) | 6.7 | 5.3 | 4.6 | |
| Rage 2 (2019) | 24.7 | 6.3 | 5.3 |
| Dell Inspiron 15 3585 (2300U, Vega 6) Vega 6, R3 2300U, Toshiba BG3 KBG30ZMS256G | Dell Inspiron 15 5575-98MH4 Vega 3, R3 2200U, Seagate Mobile HDD 1TB ST1000LM035 | Lenovo ThinkPad E485-20KU000NGE Vega 8, R5 2500U, Samsung PM961 MZVLW256HEHP | HP 250 G7 6HM85ES UHD Graphics 620, i5-8265U, WDC PC SN520 SDAPNUW-512G | Acer Aspire 3 A315-41-R7BM Vega 3, R3 2200U, SK Hynix HFS256G39TND-N210A | Acer Swift 3 SF314-55-31N8 UHD Graphics 620, i3-8145U, Kingston RBUSNS8154P3128GJ | |
|---|---|---|---|---|---|---|
| Noise | 1% | 6% | 3% | 0% | 7% | |
| desligado / ambiente * (dB) | 30.6 | 30.4 1% | 29.4 4% | 30.7 -0% | 30.3 1% | 30.3 1% |
| Idle Minimum * (dB) | 30.6 | 31.4 -3% | 29.4 4% | 30.9 -1% | 30.3 1% | 30.3 1% |
| Idle Average * (dB) | 30.6 | 31.4 -3% | 29.4 4% | 31.6 -3% | 30.3 1% | 30.3 1% |
| Idle Maximum * (dB) | 30.6 | 31.6 -3% | 31.2 -2% | 31.6 -3% | 30.9 -1% | 30.3 1% |
| Load Average * (dB) | 36.7 | 31.9 13% | 32.7 11% | 34.3 7% | 37.8 -3% | 31 16% |
| Load Maximum * (dB) | 41.1 | 40.9 -0% | 35.3 14% | 33.8 18% | 40.6 1% | 31.4 24% |
| Witcher 3 ultra * (dB) | 34.3 |
* ... menor é melhor
Barulho
| Ocioso |
| 30.6 / 30.6 / 30.6 dB |
| Carga |
| 36.7 / 41.1 dB |
 | ||
30 dB silencioso 40 dB(A) audível 50 dB(A) ruidosamente alto |
||
min: | ||
| Dell Inspiron 15 3585 (2300U, Vega 6) Vega 6, R3 2300U, Toshiba BG3 KBG30ZMS256G | Dell Inspiron 15 5575-98MH4 Vega 3, R3 2200U, Seagate Mobile HDD 1TB ST1000LM035 | Lenovo ThinkPad E485-20KU000NGE Vega 8, R5 2500U, Samsung PM961 MZVLW256HEHP | HP 250 G7 6HM85ES UHD Graphics 620, i5-8265U, WDC PC SN520 SDAPNUW-512G | Acer Aspire 3 A315-41-R7BM Vega 3, R3 2200U, SK Hynix HFS256G39TND-N210A | Acer Swift 3 SF314-55-31N8 UHD Graphics 620, i3-8145U, Kingston RBUSNS8154P3128GJ | |
|---|---|---|---|---|---|---|
| Heat | 3% | 4% | 16% | 25% | 16% | |
| Maximum Upper Side * (°C) | 44.8 | 45 -0% | 42.3 6% | 35.1 22% | 29.9 33% | 40.2 10% |
| Maximum Bottom * (°C) | 47.4 | 41.2 13% | 45.2 5% | 42.4 11% | 30.1 36% | 40 16% |
| Idle Upper Side * (°C) | 29.2 | 29.5 -1% | 28.8 1% | 25.4 13% | 25.2 14% | 24.4 16% |
| Idle Bottom * (°C) | 31.5 | 31.7 -1% | 30.7 3% | 25.8 18% | 26.6 16% | 24.1 23% |
* ... menor é melhor
(±) A temperatura máxima no lado superior é 44.8 °C / 113 F, em comparação com a média de 34.3 °C / 94 F , variando de 21.2 a 62.5 °C para a classe Office.
(-) A parte inferior aquece até um máximo de 47.4 °C / 117 F, em comparação com a média de 36.8 °C / 98 F
(+) Em uso inativo, a temperatura média para o lado superior é 26.9 °C / 80 F, em comparação com a média do dispositivo de 29.5 °C / ### class_avg_f### F.
(+) Os apoios para as mãos e o touchpad são mais frios que a temperatura da pele, com um máximo de 31.6 °C / 88.9 F e, portanto, são frios ao toque.
(-) A temperatura média da área do apoio para as mãos de dispositivos semelhantes foi 27.5 °C / 81.5 F (-4.1 °C / -7.4 F).
Dell Inspiron 15 3585 (2300U, Vega 6) análise de áudio
(-) | alto-falantes não muito altos (###valor### dB)
Graves 100 - 315Hz
(-) | quase nenhum baixo - em média 19.7% menor que a mediana
(±) | a linearidade dos graves é média (14.8% delta para a frequência anterior)
Médios 400 - 2.000 Hz
(+) | médios equilibrados - apenas 1.2% longe da mediana
(+) | médios são lineares (4.2% delta para frequência anterior)
Altos 2 - 16 kHz
(+) | agudos equilibrados - apenas 2% longe da mediana
(+) | os máximos são lineares (4.3% delta da frequência anterior)
Geral 100 - 16.000 Hz
(±) | a linearidade do som geral é média (15.3% diferença em relação à mediana)
Comparado com a mesma classe
» 15% de todos os dispositivos testados nesta classe foram melhores, 4% semelhantes, 82% piores
» O melhor teve um delta de 7%, a média foi 21%, o pior foi 53%
Comparado com todos os dispositivos testados
» 22% de todos os dispositivos testados foram melhores, 4% semelhantes, 74% piores
» O melhor teve um delta de 4%, a média foi 24%, o pior foi 134%
Acer Aspire 3 A315-41-R7BM análise de áudio
(-) | alto-falantes não muito altos (###valor### dB)
Graves 100 - 315Hz
(-) | quase nenhum baixo - em média 25.3% menor que a mediana
(±) | a linearidade dos graves é média (12.5% delta para a frequência anterior)
Médios 400 - 2.000 Hz
(+) | médios equilibrados - apenas 3% longe da mediana
(±) | a linearidade dos médios é média (10.1% delta para frequência anterior)
Altos 2 - 16 kHz
(+) | agudos equilibrados - apenas 1.8% longe da mediana
(+) | os máximos são lineares (5.5% delta da frequência anterior)
Geral 100 - 16.000 Hz
(±) | a linearidade do som geral é média (22.7% diferença em relação à mediana)
Comparado com a mesma classe
» 61% de todos os dispositivos testados nesta classe foram melhores, 8% semelhantes, 31% piores
» O melhor teve um delta de 7%, a média foi 21%, o pior foi 53%
Comparado com todos os dispositivos testados
» 67% de todos os dispositivos testados foram melhores, 6% semelhantes, 27% piores
» O melhor teve um delta de 4%, a média foi 24%, o pior foi 134%
| desligado | |
| Ocioso | |
| Carga |
|
Key:
min: | |
| Dell Inspiron 15 3585 (2300U, Vega 6) R3 2300U, Vega 6, Toshiba BG3 KBG30ZMS256G, TN, 1920x1080, 15.6" | Dell Inspiron 15 5575-98MH4 R3 2200U, Vega 3, Seagate Mobile HDD 1TB ST1000LM035, TN LED, 1366x768, 15.6" | Lenovo ThinkPad E485-20KU000NGE R5 2500U, Vega 8, Samsung PM961 MZVLW256HEHP, IPS, 1920x1080, 14" | HP 250 G7 6HM85ES i5-8265U, UHD Graphics 620, WDC PC SN520 SDAPNUW-512G, TN, 1920x1080, 15.6" | Acer Aspire 3 A315-41-R7BM R3 2200U, Vega 3, SK Hynix HFS256G39TND-N210A, TN LED, 1920x1080, 15.6" | Acer Swift 3 SF314-55-31N8 i3-8145U, UHD Graphics 620, Kingston RBUSNS8154P3128GJ, IPS, 1920x1080, 14" | Média AMD Radeon RX Vega 6 (Ryzen 2000/3000) | Média da turma Office | |
|---|---|---|---|---|---|---|---|---|
| Power Consumption | 12% | 3% | 29% | 5% | 35% | 9% | 2% | |
| Idle Minimum * (Watt) | 6.3 | 5 21% | 6.2 2% | 3.2 49% | 5.6 11% | 2.9 54% | 5.15 ? 18% | 4.4 ? 30% |
| Idle Average * (Watt) | 9.2 | 8.4 9% | 8.6 7% | 5.7 38% | 8.5 8% | 5.6 39% | 7.75 ? 16% | 7.32 ? 20% |
| Idle Maximum * (Watt) | 9.6 | 9.2 4% | 9.7 -1% | 6.1 36% | 8.4 12% | 6.1 36% | 9.45 ? 2% | 8.56 ? 11% |
| Load Average * (Watt) | 38 | 30 21% | 37.4 2% | 36.5 4% | 41 -8% | 29 24% | 36 ? 5% | 42.5 ? -12% |
| Load Maximum * (Watt) | 46 | 44.7 3% | 44.8 3% | 37.5 18% | 44.2 4% | 35.3 23% | 44 ? 4% | 64.1 ? -39% |
| Witcher 3 ultra * (Watt) | 32 |
* ... menor é melhor
| Dell Inspiron 15 3585 (2300U, Vega 6) R3 2300U, Vega 6, 42 Wh | Dell Inspiron 15 5575-98MH4 R3 2200U, Vega 3, 42 Wh | Lenovo ThinkPad E485-20KU000NGE R5 2500U, Vega 8, 45 Wh | HP 250 G7 6HM85ES i5-8265U, UHD Graphics 620, 41 Wh | Acer Aspire 3 A315-41-R7BM R3 2200U, Vega 3, 37 Wh | Média da turma Office | |
|---|---|---|---|---|---|---|
| Duração da bateria | -6% | 4% | 35% | 4% | 150% | |
| Reader / Idle (h) | 7.3 | 9.5 30% | 9.1 25% | 13.9 90% | 8.9 22% | 23.7 ? 225% |
| H.264 (h) | 4.5 | 5.7 27% | 7.1 58% | 4.9 9% | 15 ? 233% | |
| WiFi v1.3 (h) | 5.3 | 4.2 -21% | 5.4 2% | 5.7 8% | 5.7 8% | 12.9 ? 143% |
| Load (h) | 1.8 | 1.3 -28% | 1.1 -39% | 1.5 -17% | 1.4 -22% | 1.807 ? 0% |
Pro
Contra
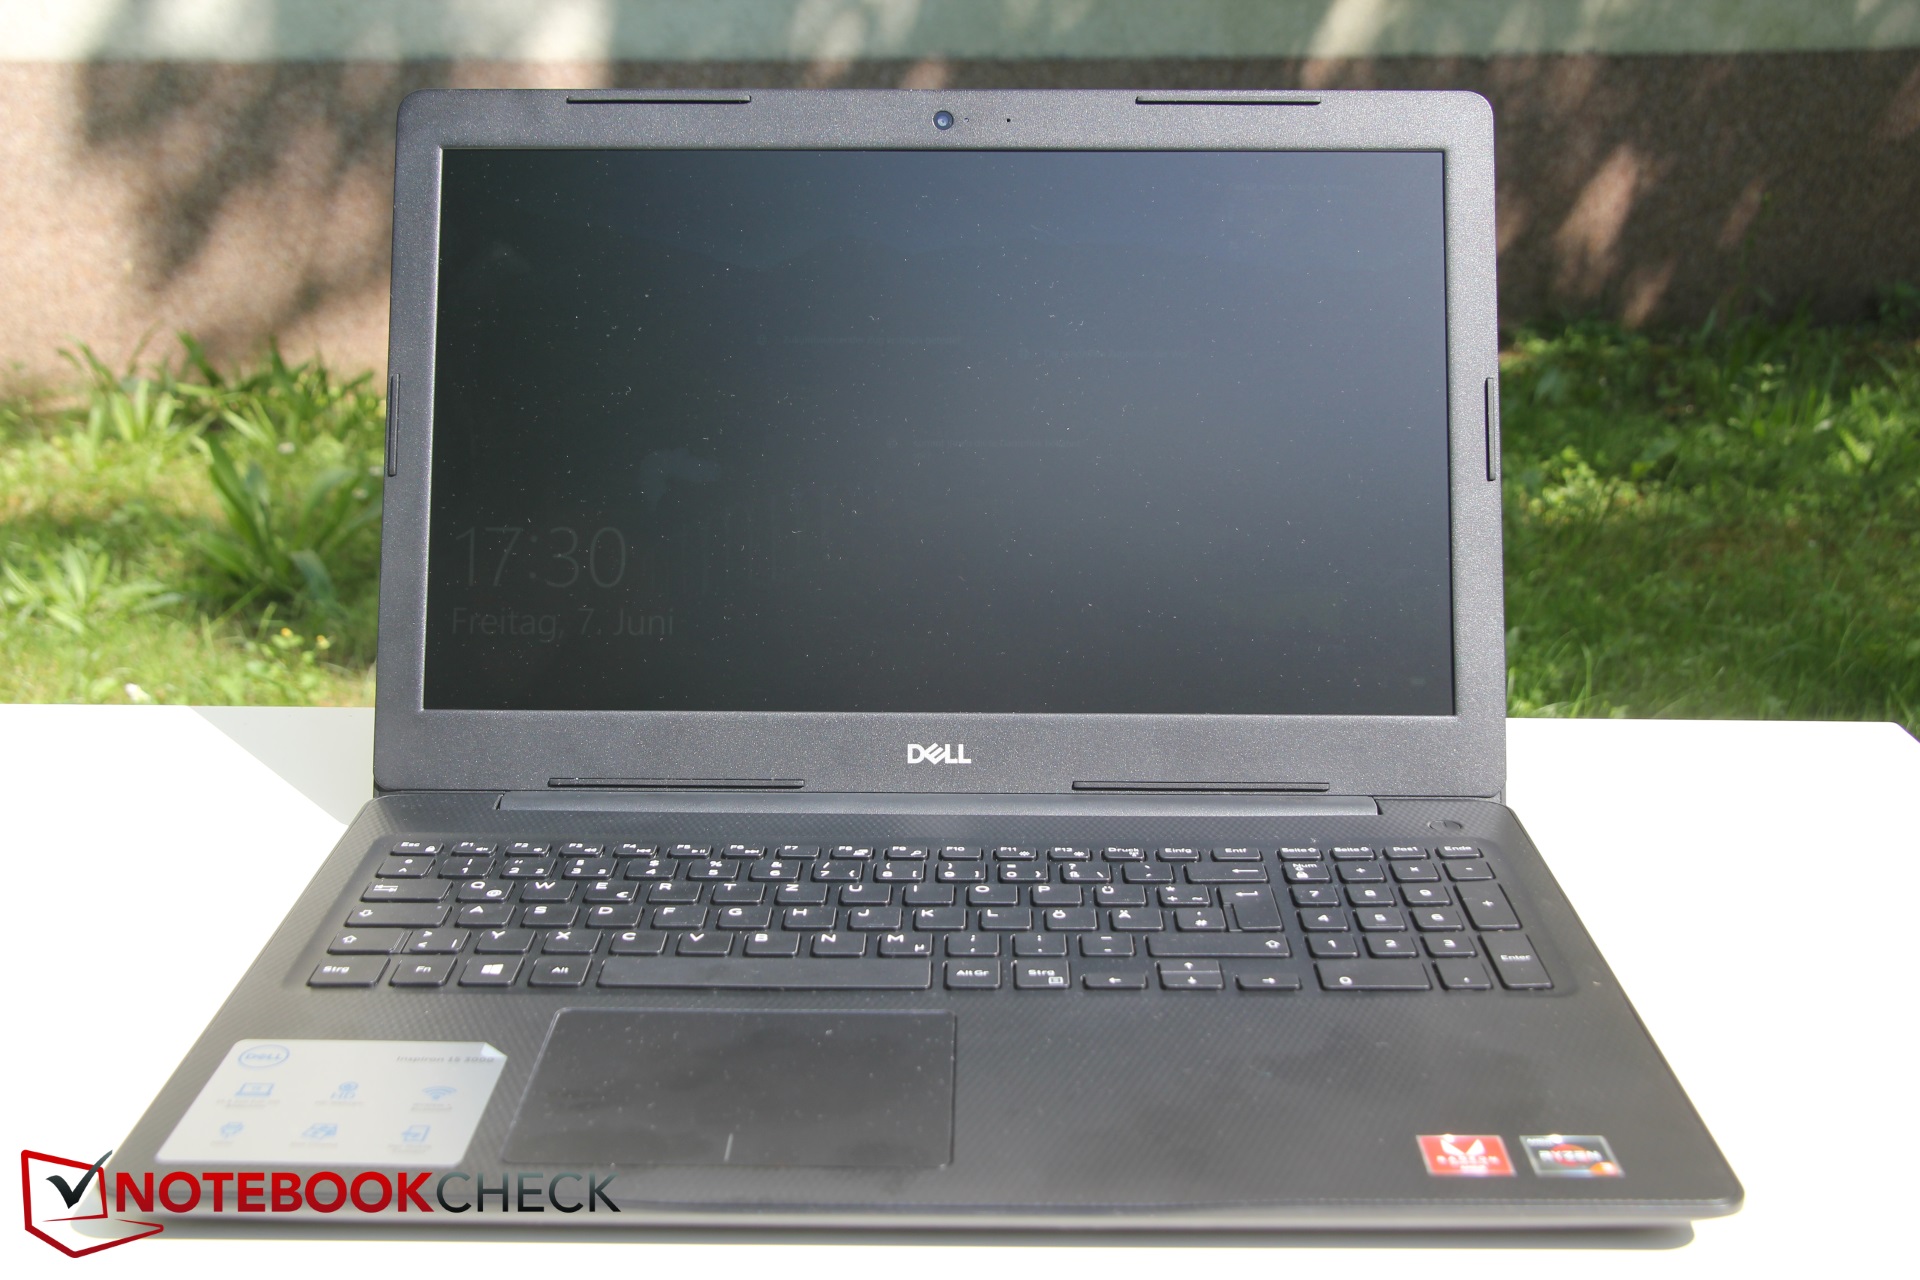
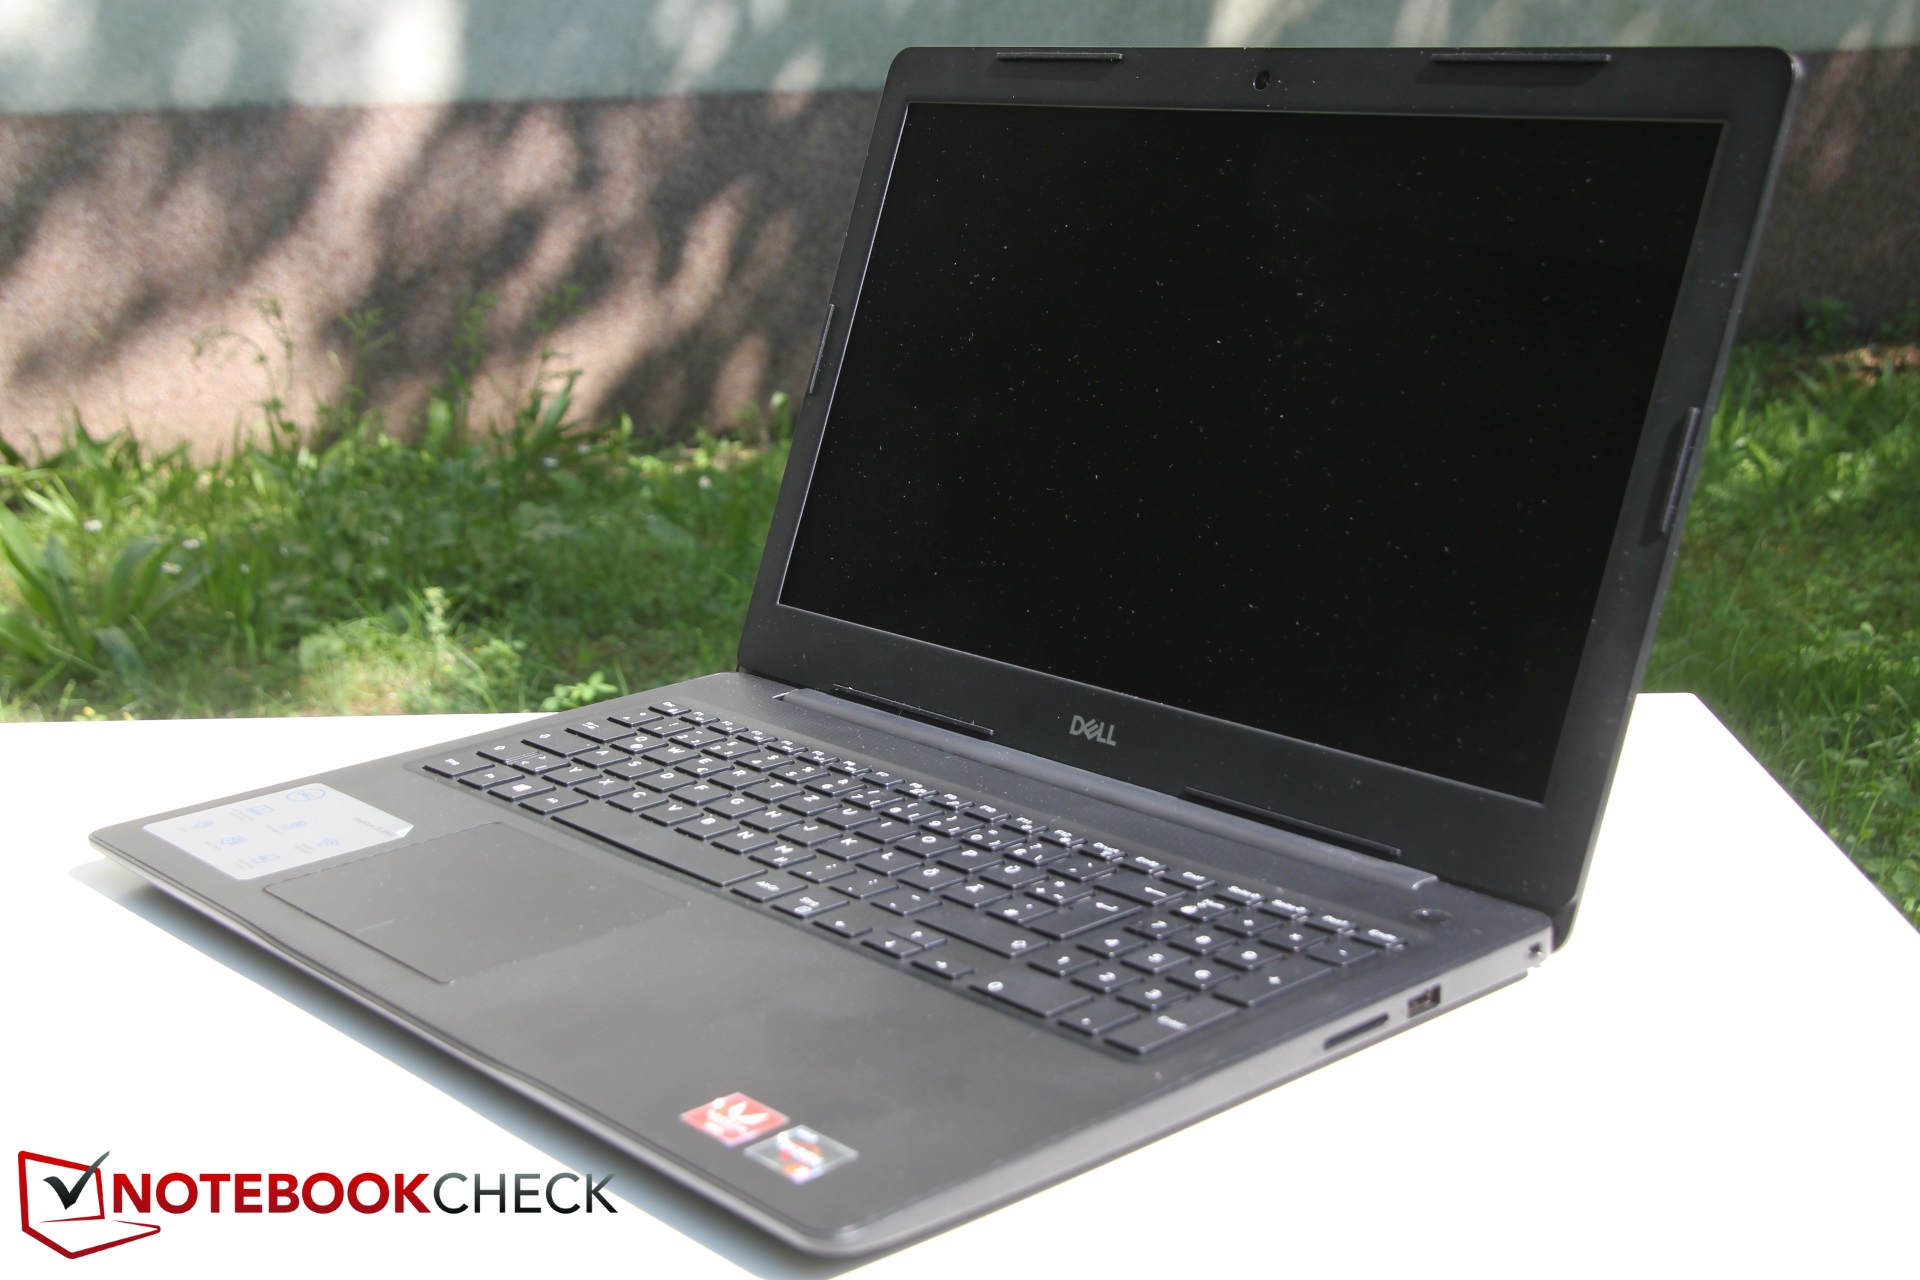
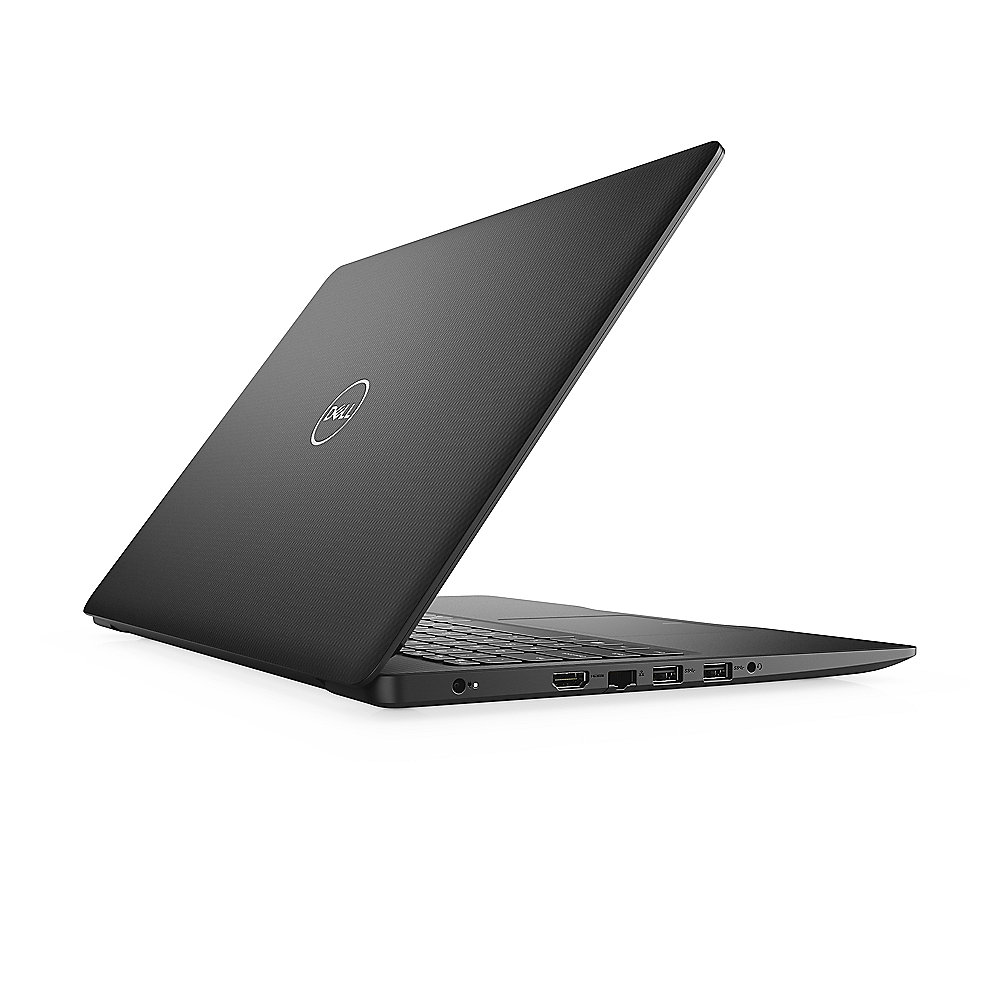
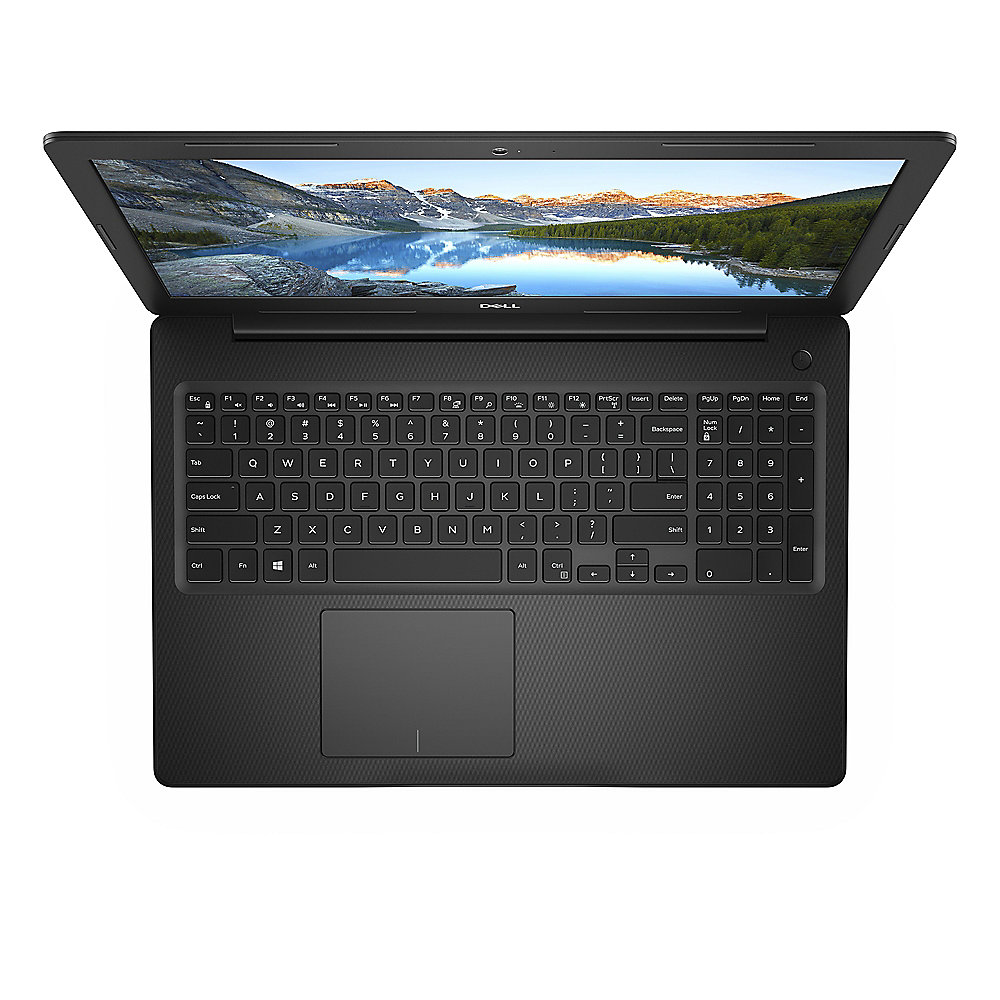
O Dell Inspiron 15 3585 é um portátil de nível de entrada e ele demonstra isso. Entre outros, ele nos recebeu com uma tela muito ruim, um processador que sofria de afogamento térmico massivo, uma solução de resfriamento ruim, pouca capacidade de atualização e falta de luz de fundo do teclado. Tudo isso, no entanto, não é muito incomum na faixa de preço do Inspiron.
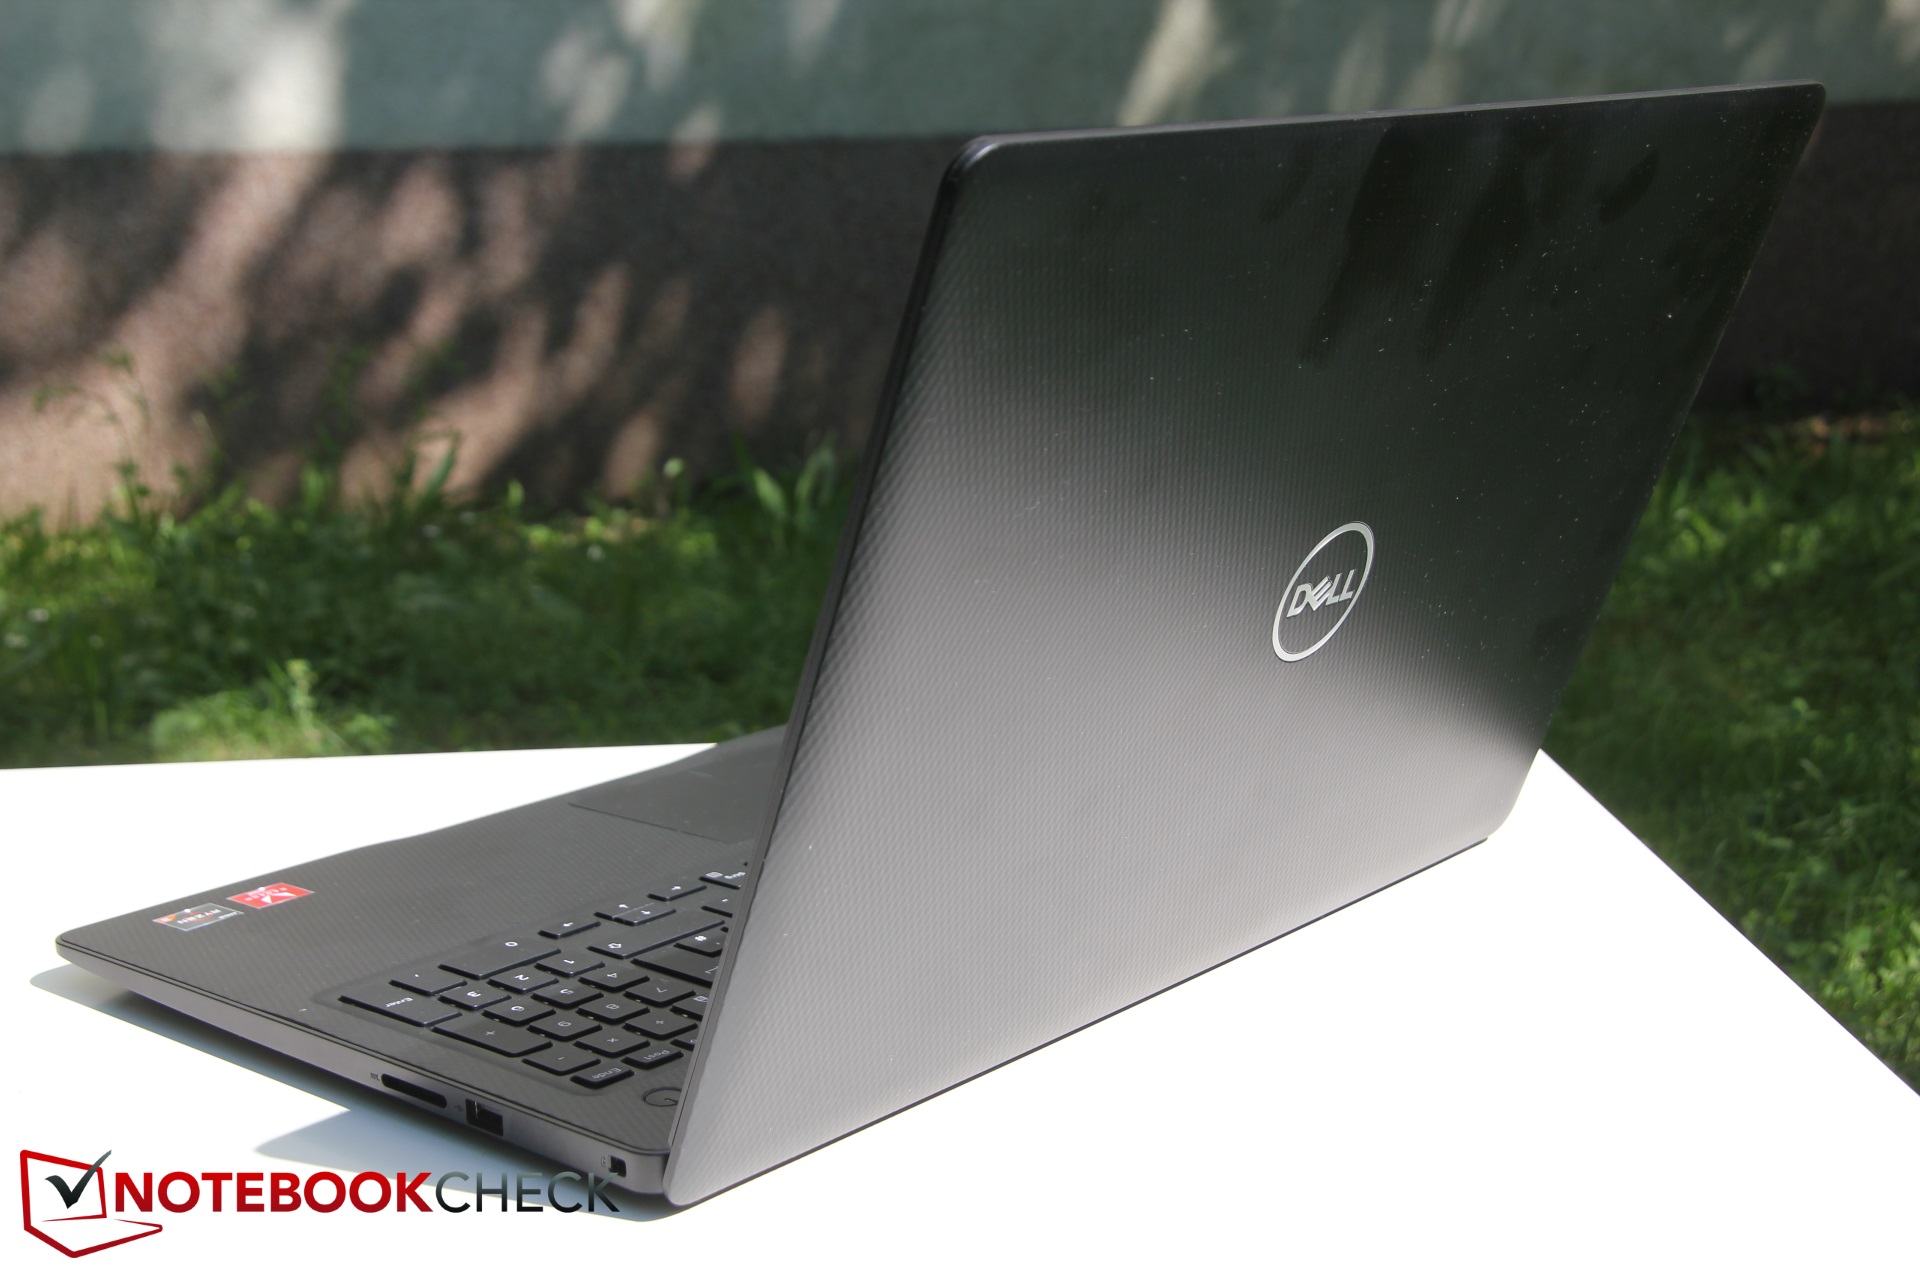
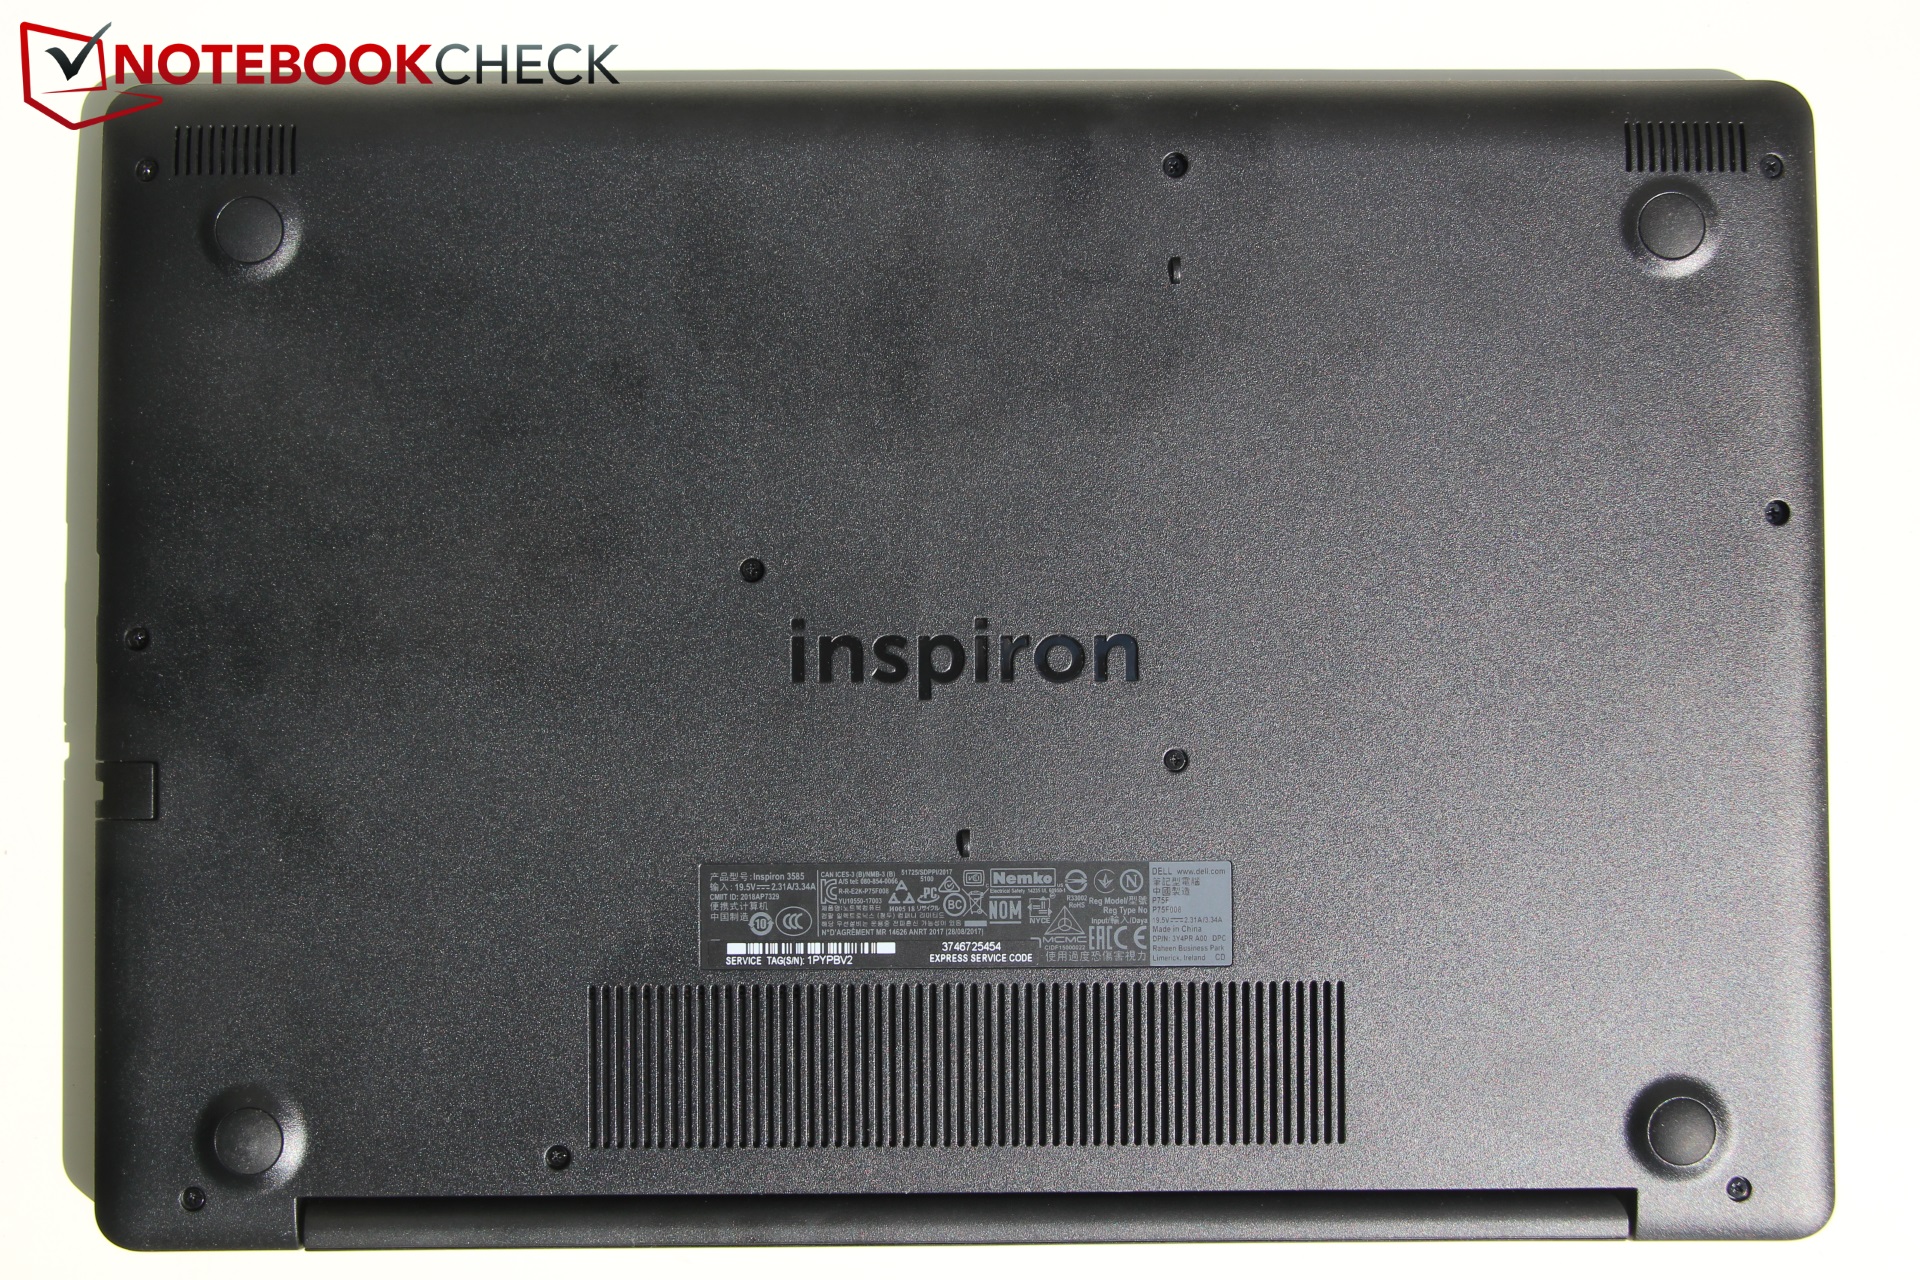
Um bônus é sua GPU integrada AMD Vega 6, que acabou sendo muito mais poderoso do que seus concorrentes diretos da Intel. Dito isto, o desempenho da GPU é muitas vezes insignificante nos portáteis de escritório, por isso tenha isso em mente. A fácil manutenção graças a uma tampa inferior facilmente removível também é um bônus.
Infelizmente, a AMD realmente não se beneficia de dispositivos de nível de entrada baratos como este. Na maioria das vezes, os OEMs optam pelo hardware da AMD por causa dos preços mais baixos e, em seguida, tentam diminuir o potencial real com o afogamento extremo. As CPUs da Intel raramente são tão restritas e frustradas em seu desempenho.
O Inspiron 15 3585 é um portátil de escritório de nível básico que oferece fácil manutenção, uma GPU Vega 6 com capacidade para jogos e um preço baixo. Infelizmente, o resto do hardware é péssimo - uma CPU sofrendo de afogamento extremo, uma carcaça que esquenta muito e um painel TN que parece ter viajado no tempo desde um passado distante.
Dell Inspiron 15 3585 (2300U, Vega 6)
- 06/17/2019 v6 (old)
Christian Hintze
Price comparison
