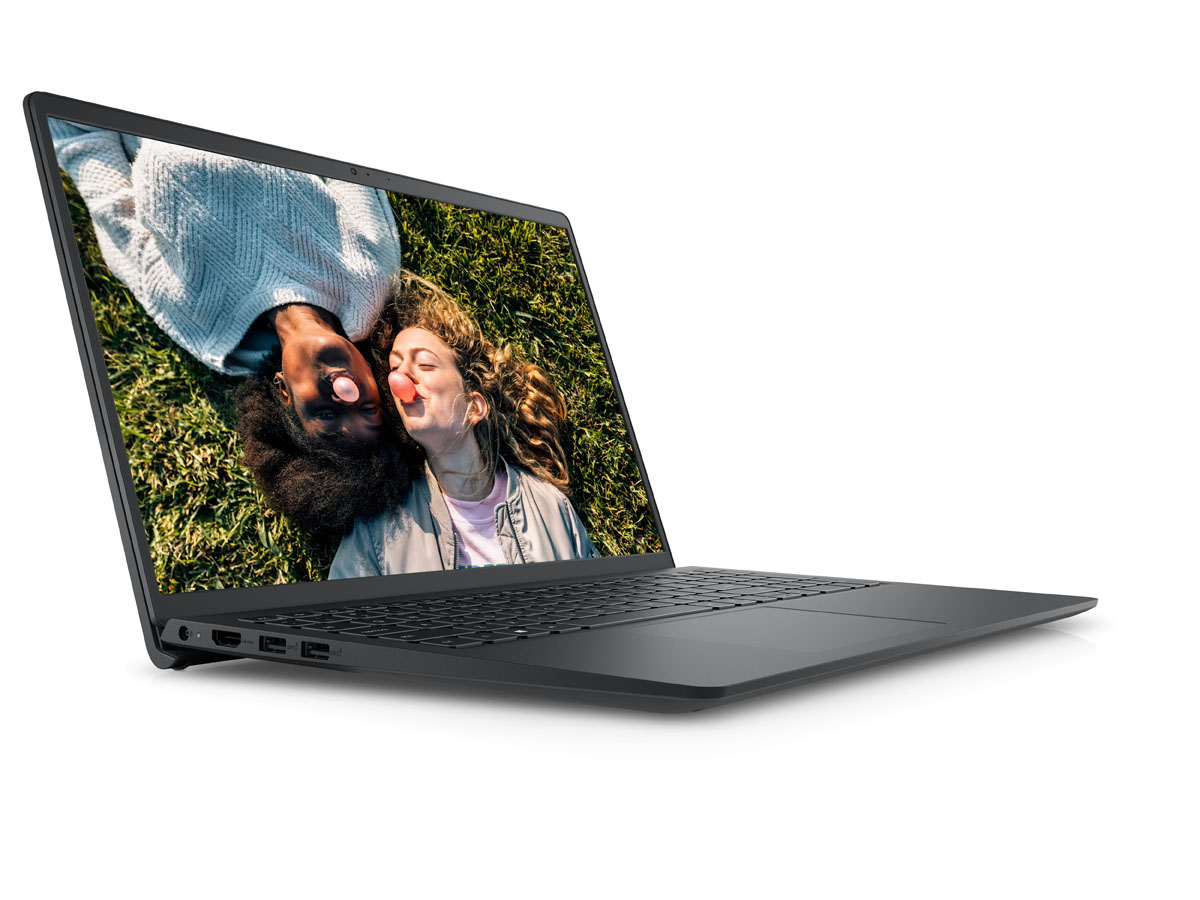
Revisão de laptop Dell Inspiron 15 3000 3511: Tornando mais barato melhor
O Inspiron 15 3511 é o sucessor direto do ano passado Inspiron 15 3501. Ele introduz um novo design de chassis que é mais fino e mais leve para aumentar a portabilidade. Há também algumas outras surpresas para ajudar o Inspiron 15 3511 a superar muitos outros modelos em sua faixa de preços orçamentários.
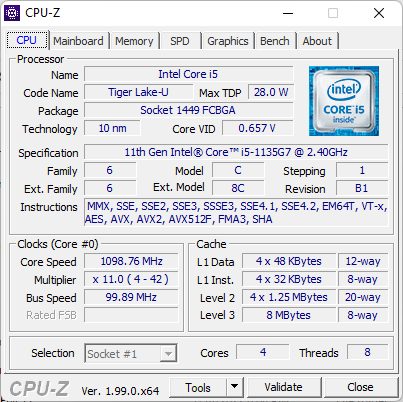
As SKUs vão desde o Core i3-1115G4 até o Core i7-1165G7 com UHD Graphics ou Iris Xe, 4 GB a 12 GB de RAM e 128 GB a 512 GB de armazenamento PCIe NVMe. Uma tela IPS 1080p vem com toque opcional. Nossa unidade específica de revisão é uma configuração de médio alcance com uma CPU Core i5, 8 GB de RAM de canal único, 256 GB de SSD e tela sensível ao toque de 1080p por aproximadamente $550 USD no varejo.
Os concorrentes neste espaço incluem outros portáteis multimídia/escritório de 15,6 polegadas de baixo custo como o HP Pavilion 15, Lenovo IdeaPad 3 15, Asus VivoBook S15, ou o Acer Aspire series
Mais análises da Dell:
Potential Competitors in Comparison
Avaliação | Data | Modelo | Peso | Altura | Size | Resolução | Preço |
|---|---|---|---|---|---|---|---|
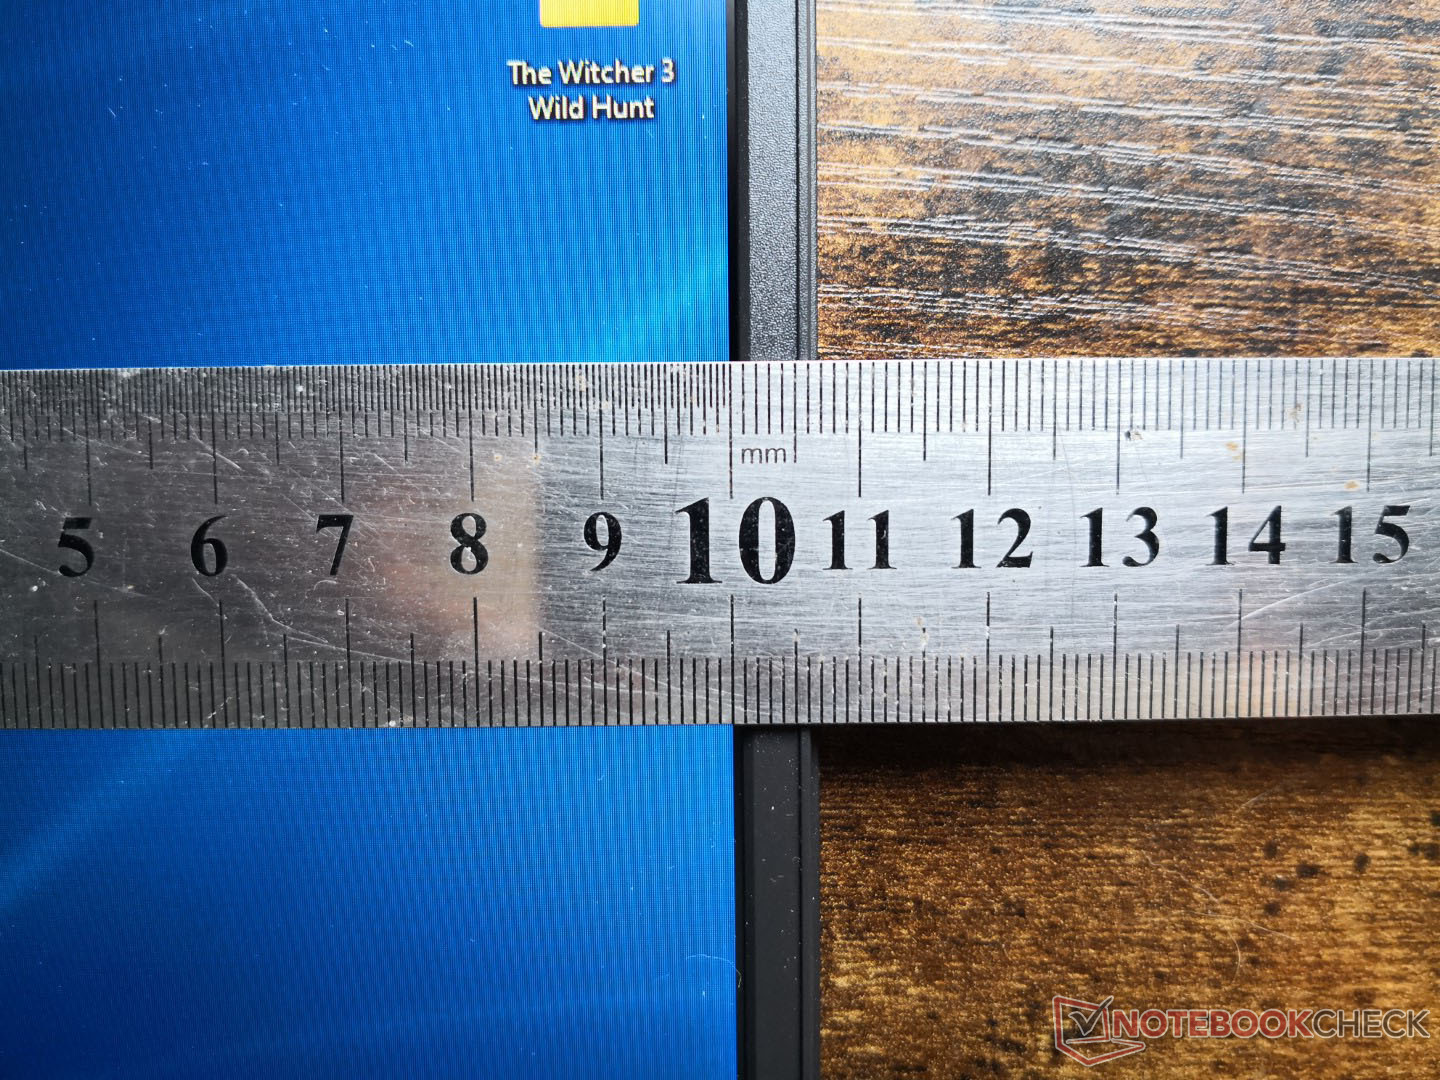
| 79.9 % v7 (old) | 01/2022 | Dell Inspiron 15 3000 3511 i5-1135G7, Iris Xe G7 80EUs | 1.7 kg | 18.99 mm | 15.60" | 1920x1080 | |
| 84.2 % v7 (old) | 10/2021 | Dell XPS 15 9510 i5 11400H FHD i5-11400H, UHD Graphics Xe 16EUs | 1.8 kg | 18 mm | 15.60" | 1920x1200 | |
| 82.1 % v7 (old) | 07/2021 | Asus VivoBook S15 D533UA R7 5700U, Vega 8 | 1.8 kg | 16.1 mm | 15.60" | 1920x1080 | |
| 80.5 % v7 (old) | 10/2021 | Dell Inspiron 15 3501 i7-1165G7, Iris Xe G7 96EUs | 2 kg | 19.9 mm | 15.60" | 1920x1080 | |
| 80.4 % v7 (old) | 12/2021 | Lenovo IdeaPad 3 15ALC6 R3 5300U, Vega 6 | 1.7 kg | 19.9 mm | 15.60" | 1920x1080 | |
| 81.2 % v7 (old) | 06/2021 | HP Pavilion 15-eg i7-1165G7, GeForce MX450 | 1.7 kg | 17.9 mm | 15.60" | 1920x1080 |
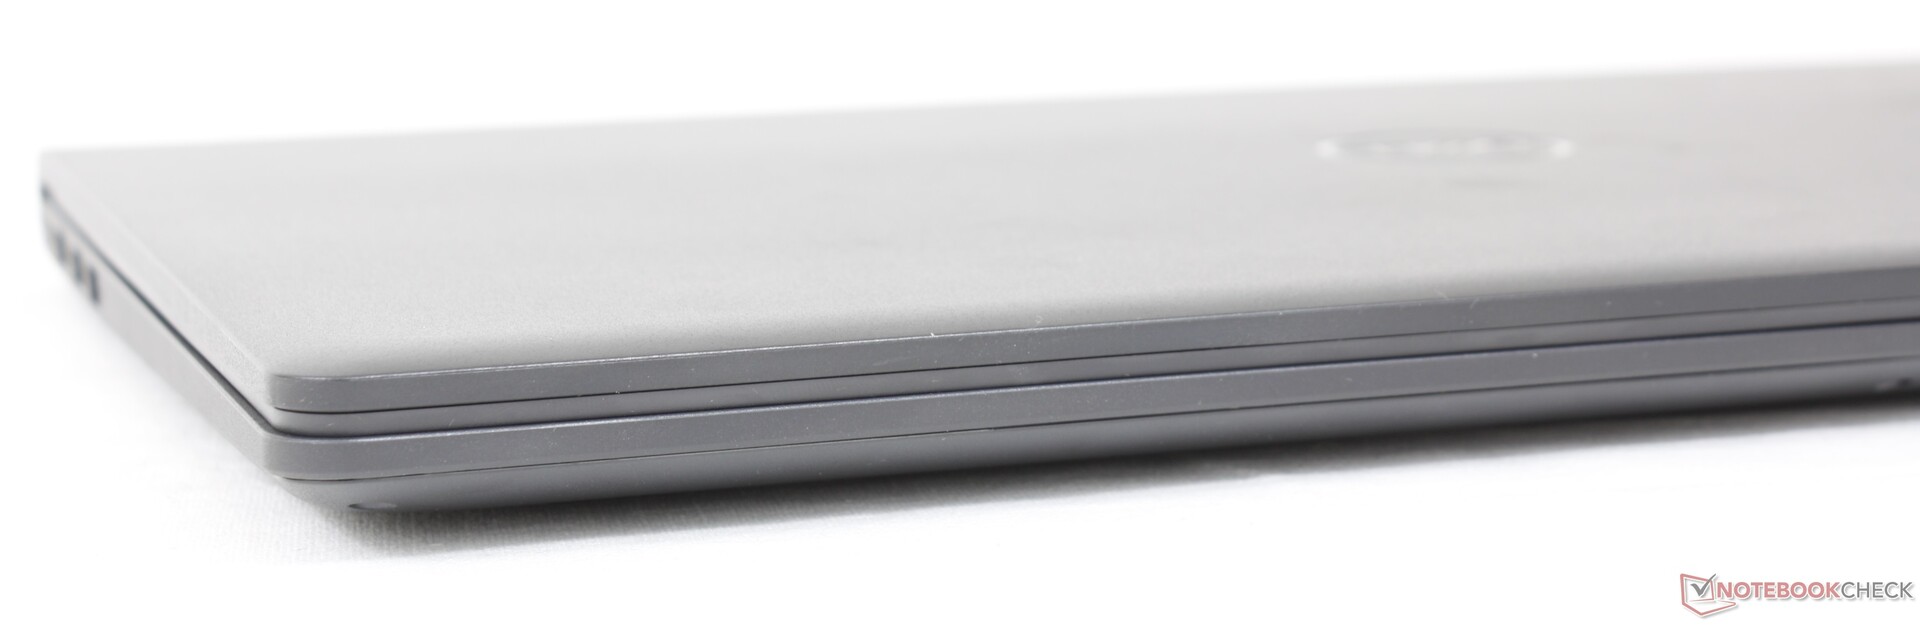
Caso
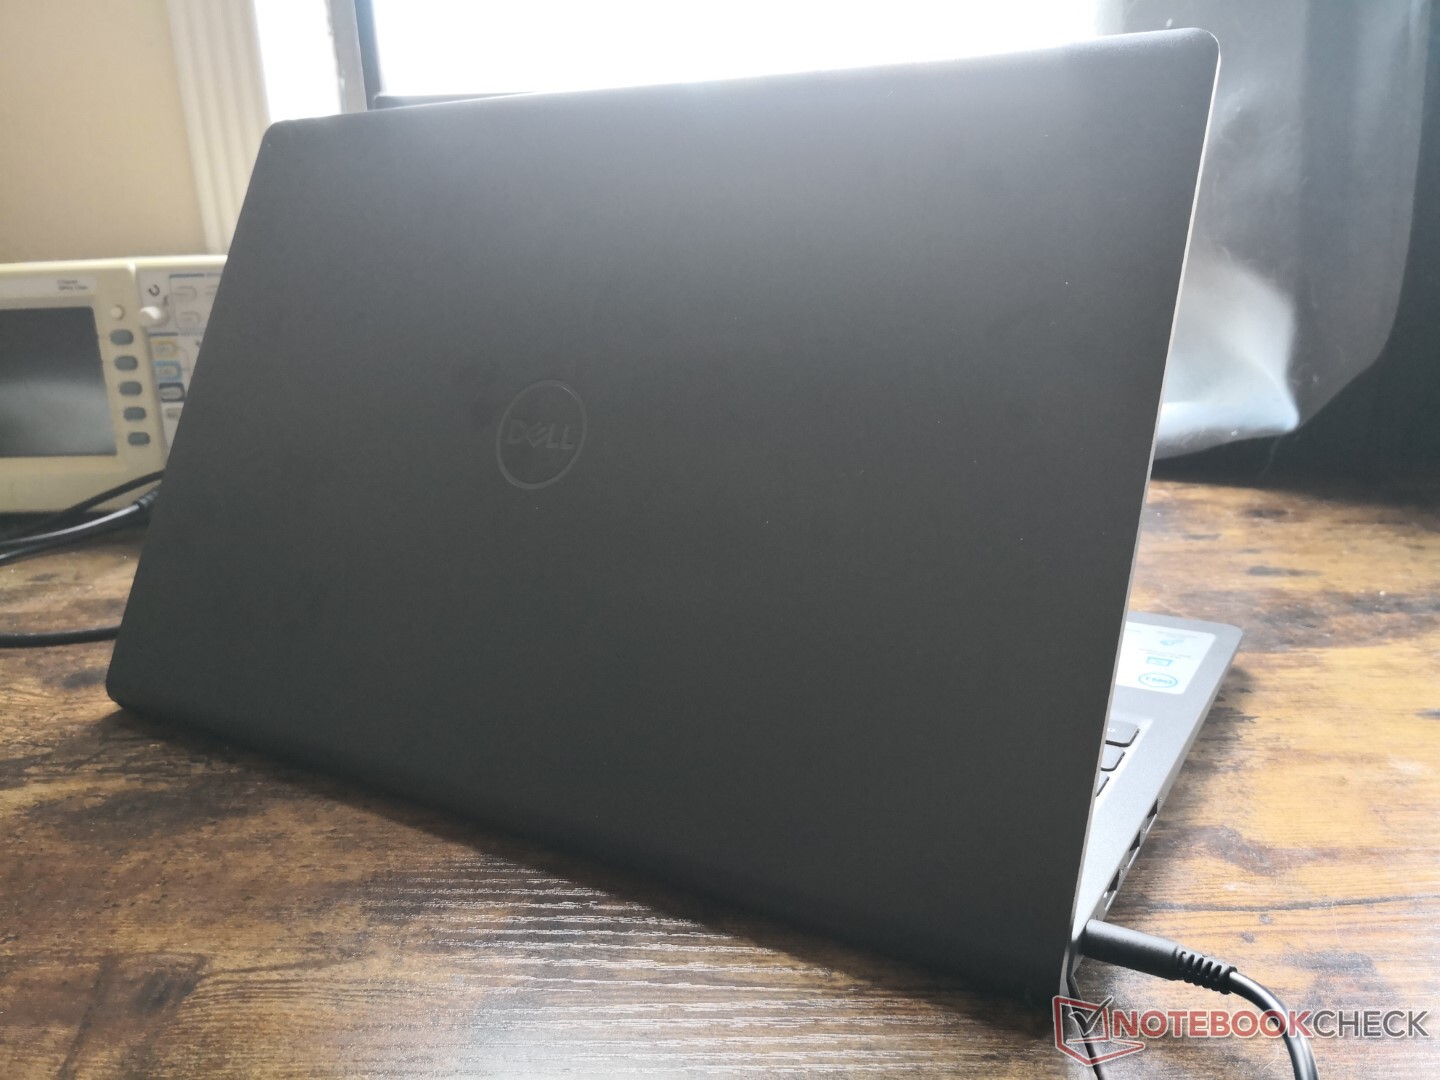
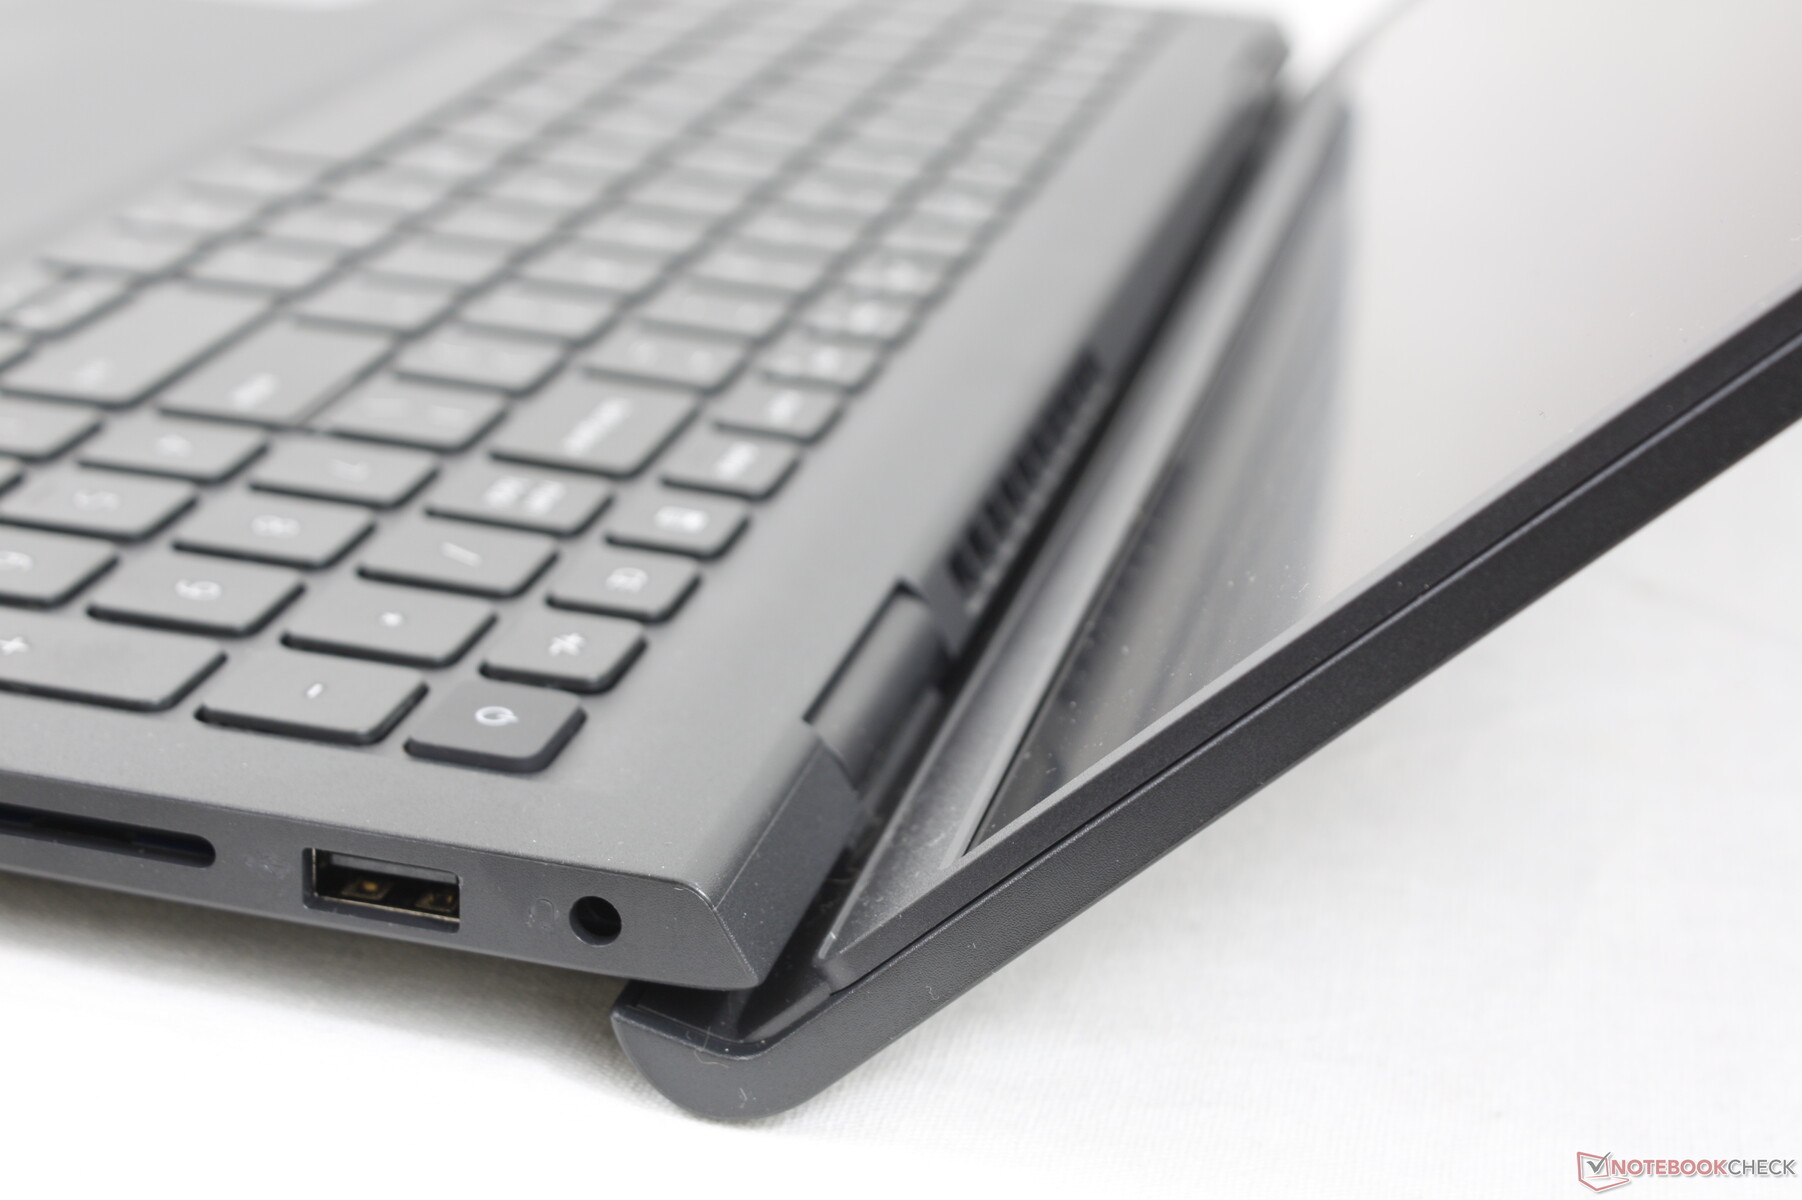
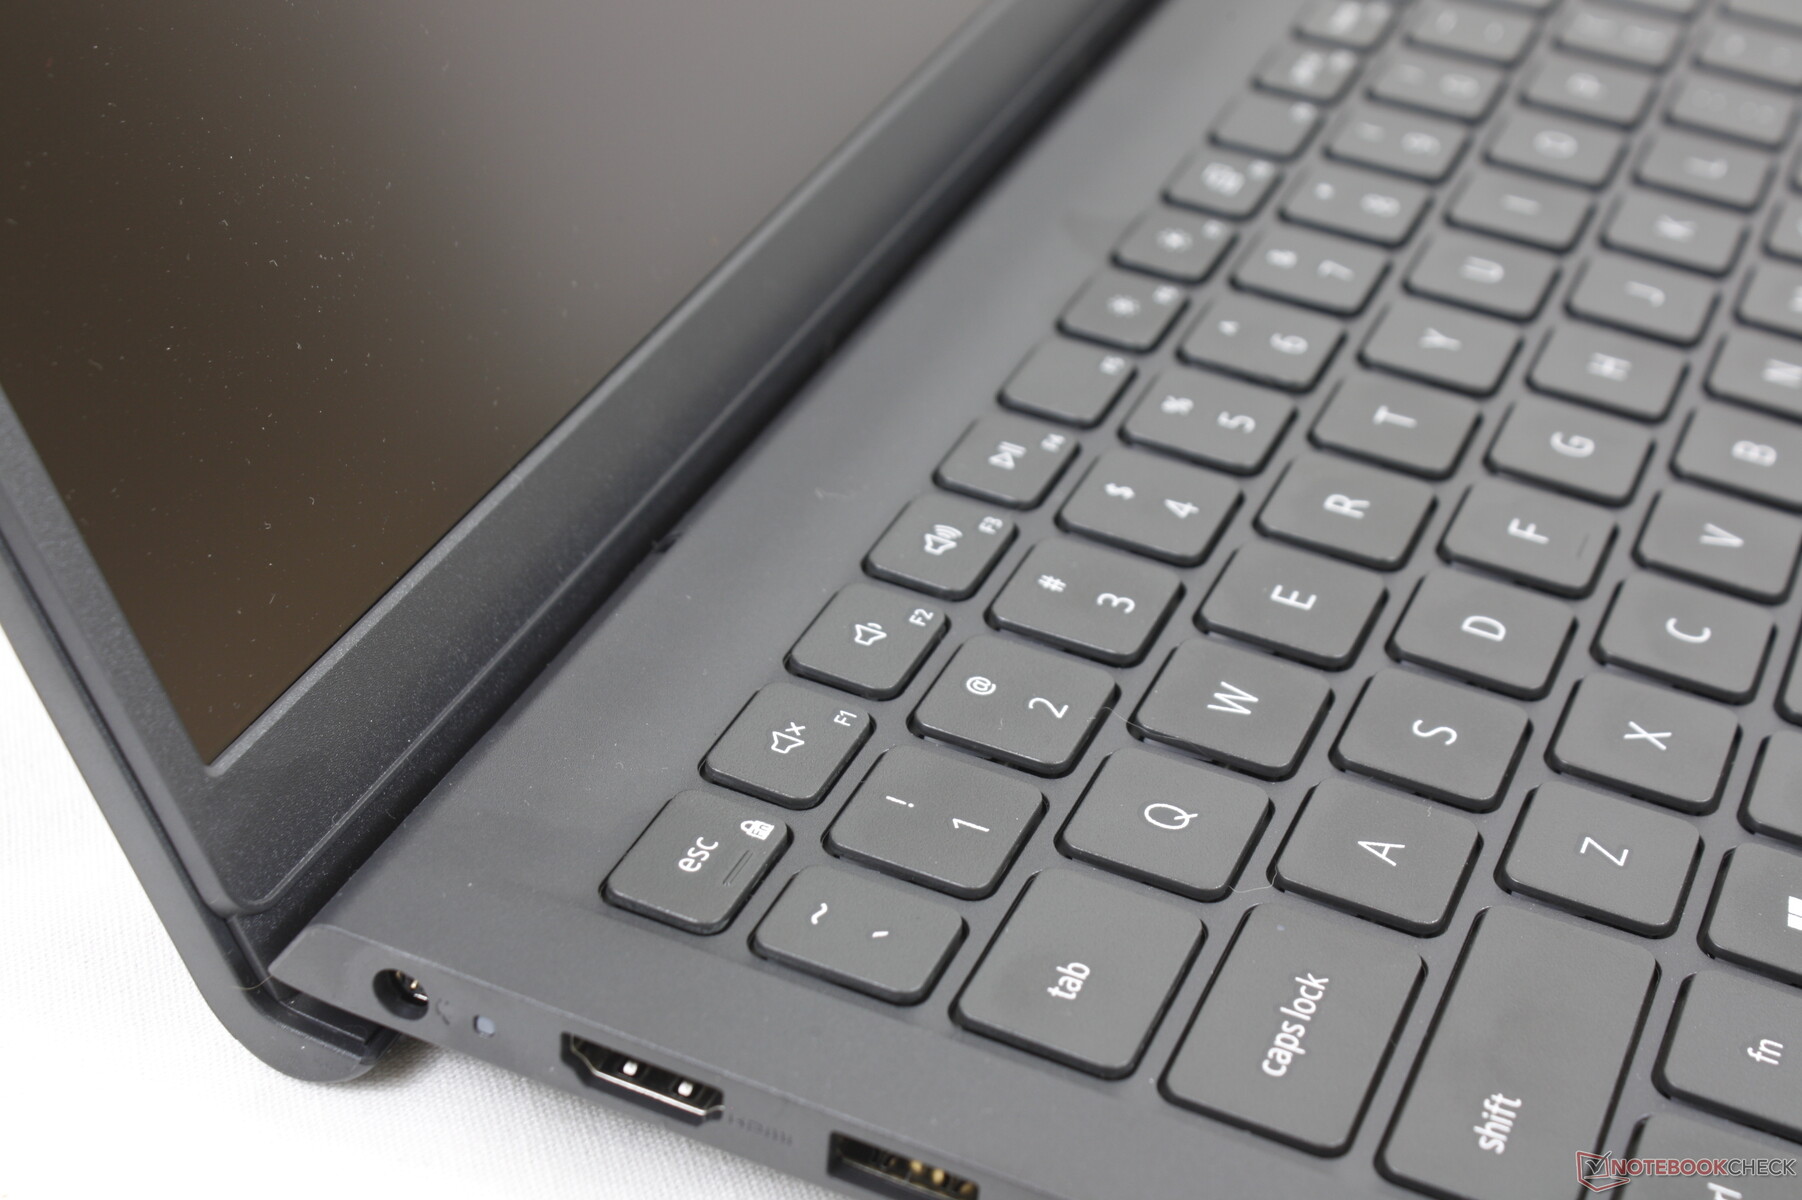
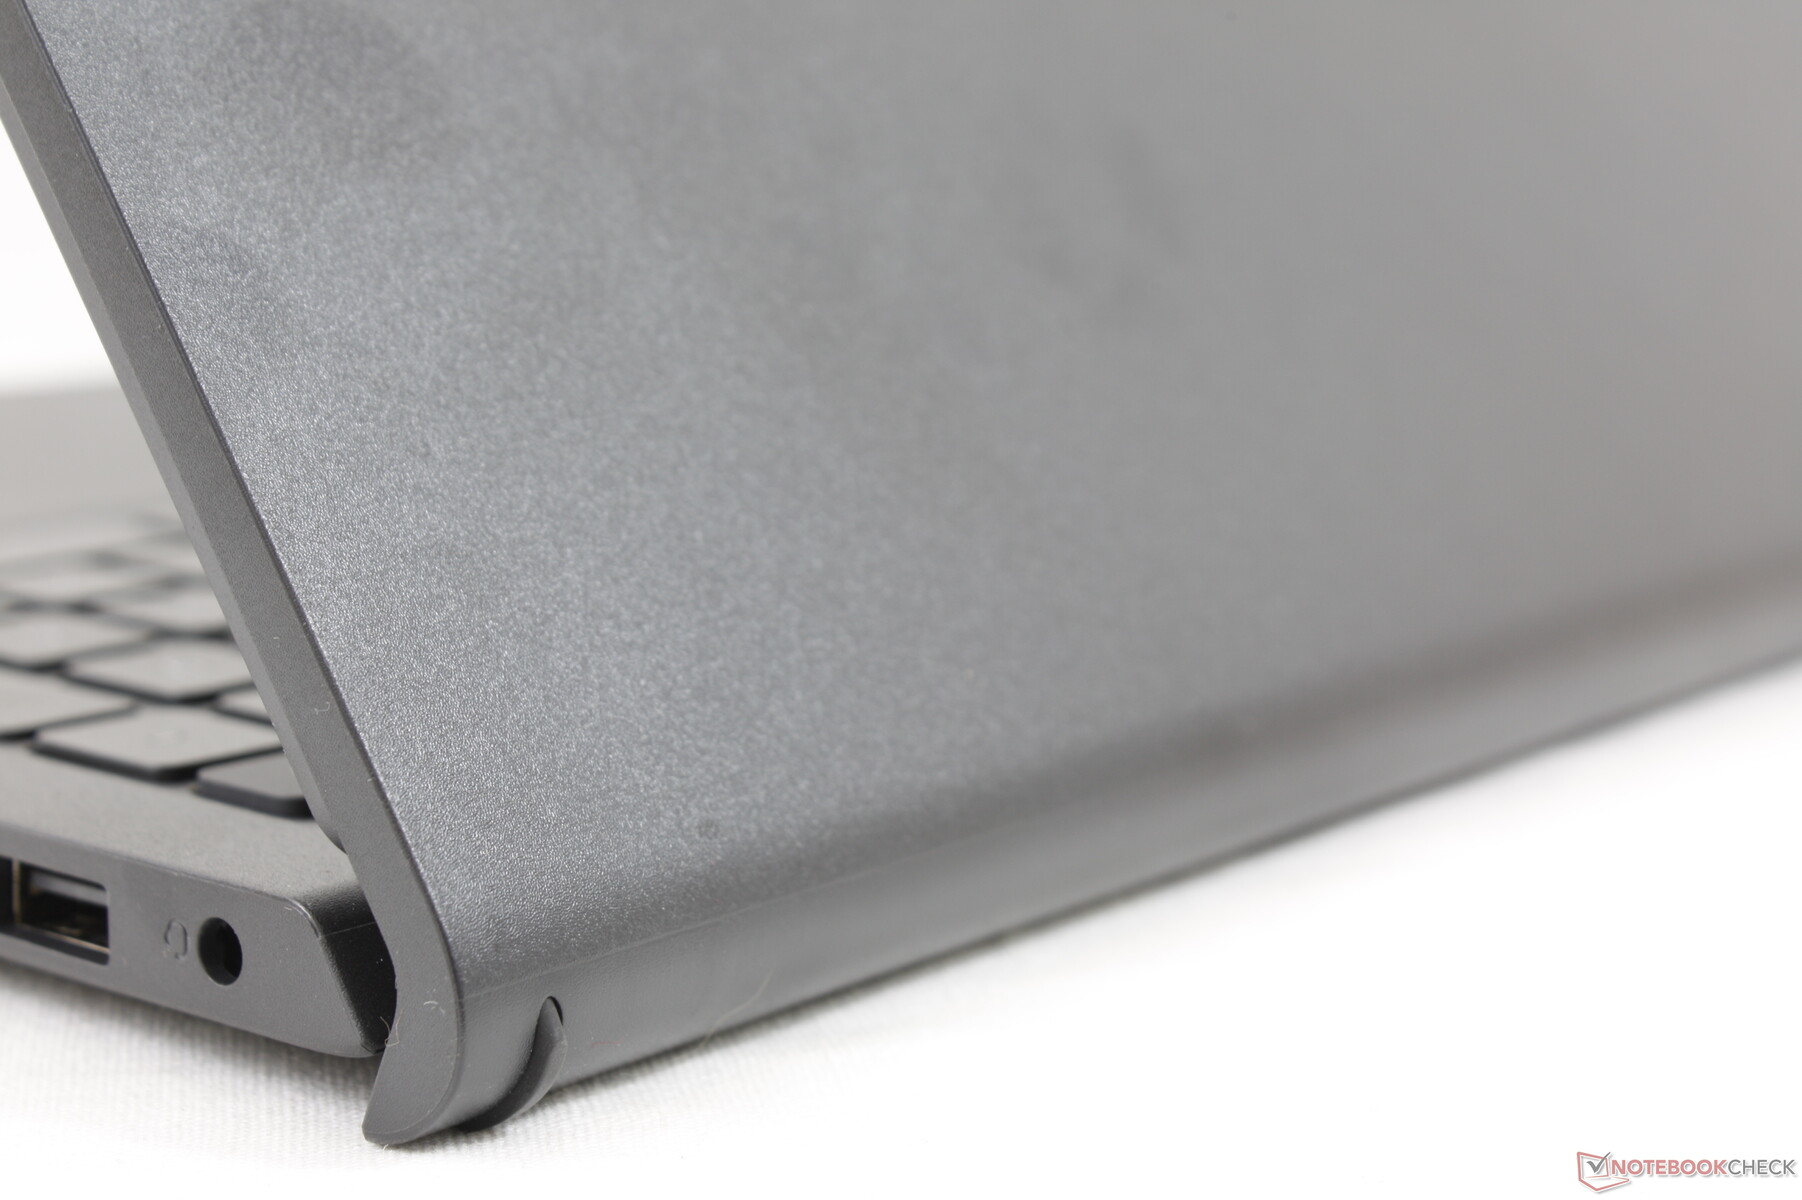
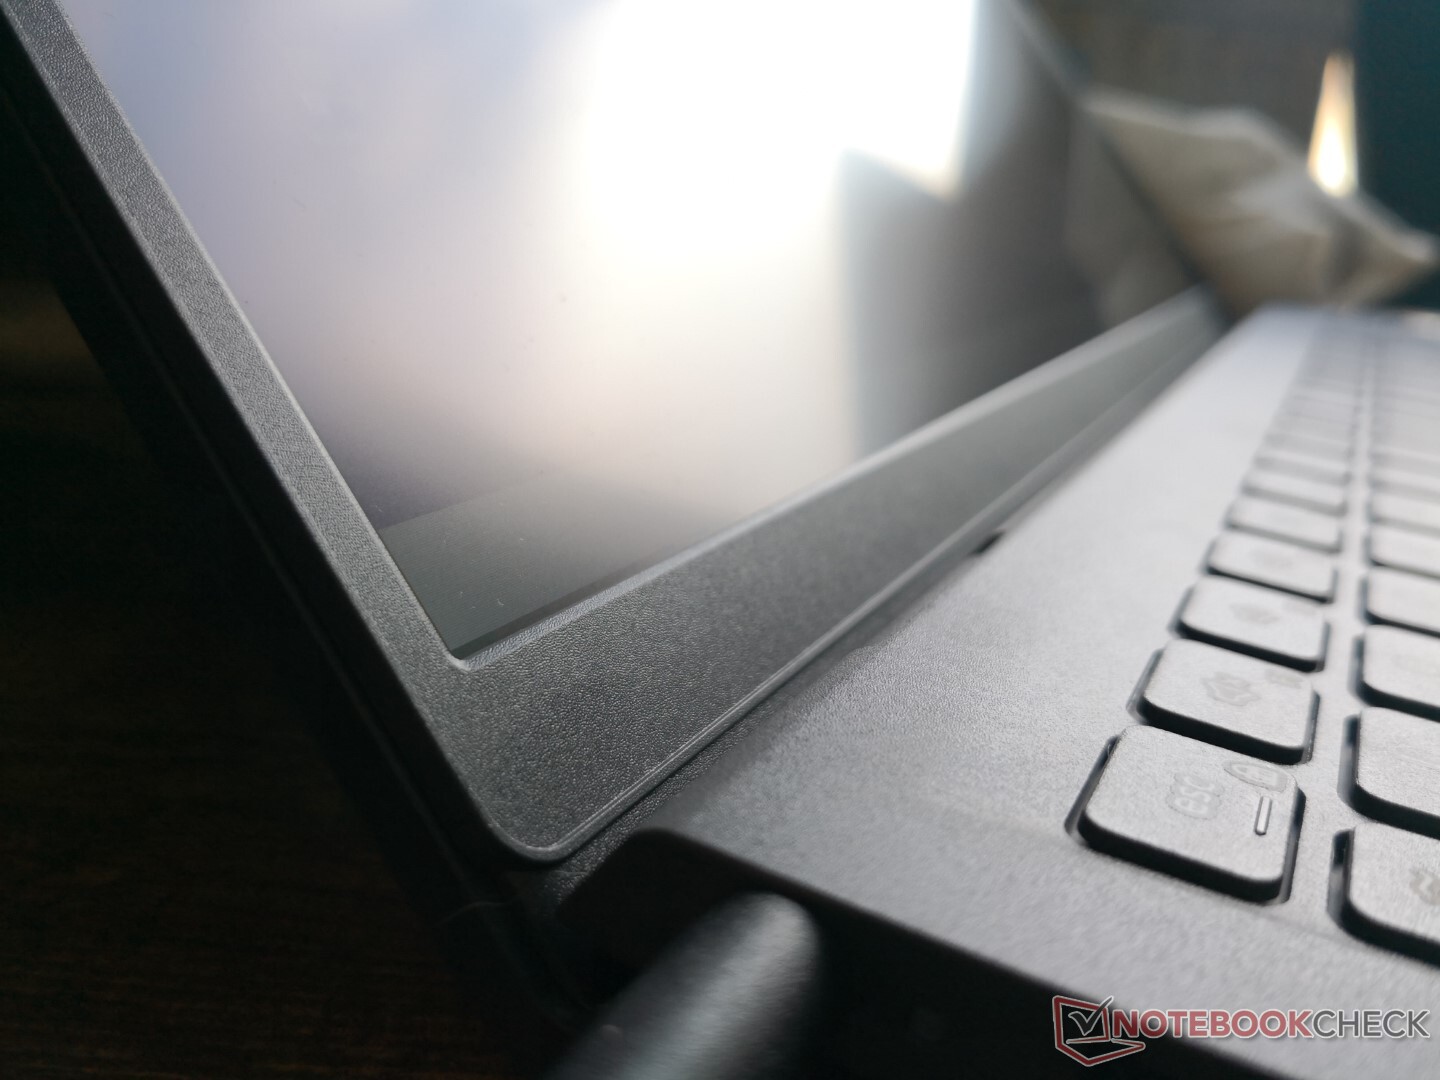
O design renovado do Inspiron 15 3511 encolhe significativamente a moldura inferior "queixo" do 3501 para uma maior relação tela/corpo. O sistema agora também utiliza dobradiças similares às encontradas no VivoBook, MSI Prestigeou HP Pavilion para levantar a base em um ligeiro ângulo para melhorar a ergonomia e o fluxo de ar. No entanto, a maioria do chassi continua sendo de plástico e, portanto, o sistema não se sente mais rígido ou de maior qualidade do que o Inspiron 15 3501 mais antigo, apesar do redesenho completo. O centro do teclado, a tampa externa e as bordas da base podem torcer e deformar com bastante facilidade com pressão suficiente.
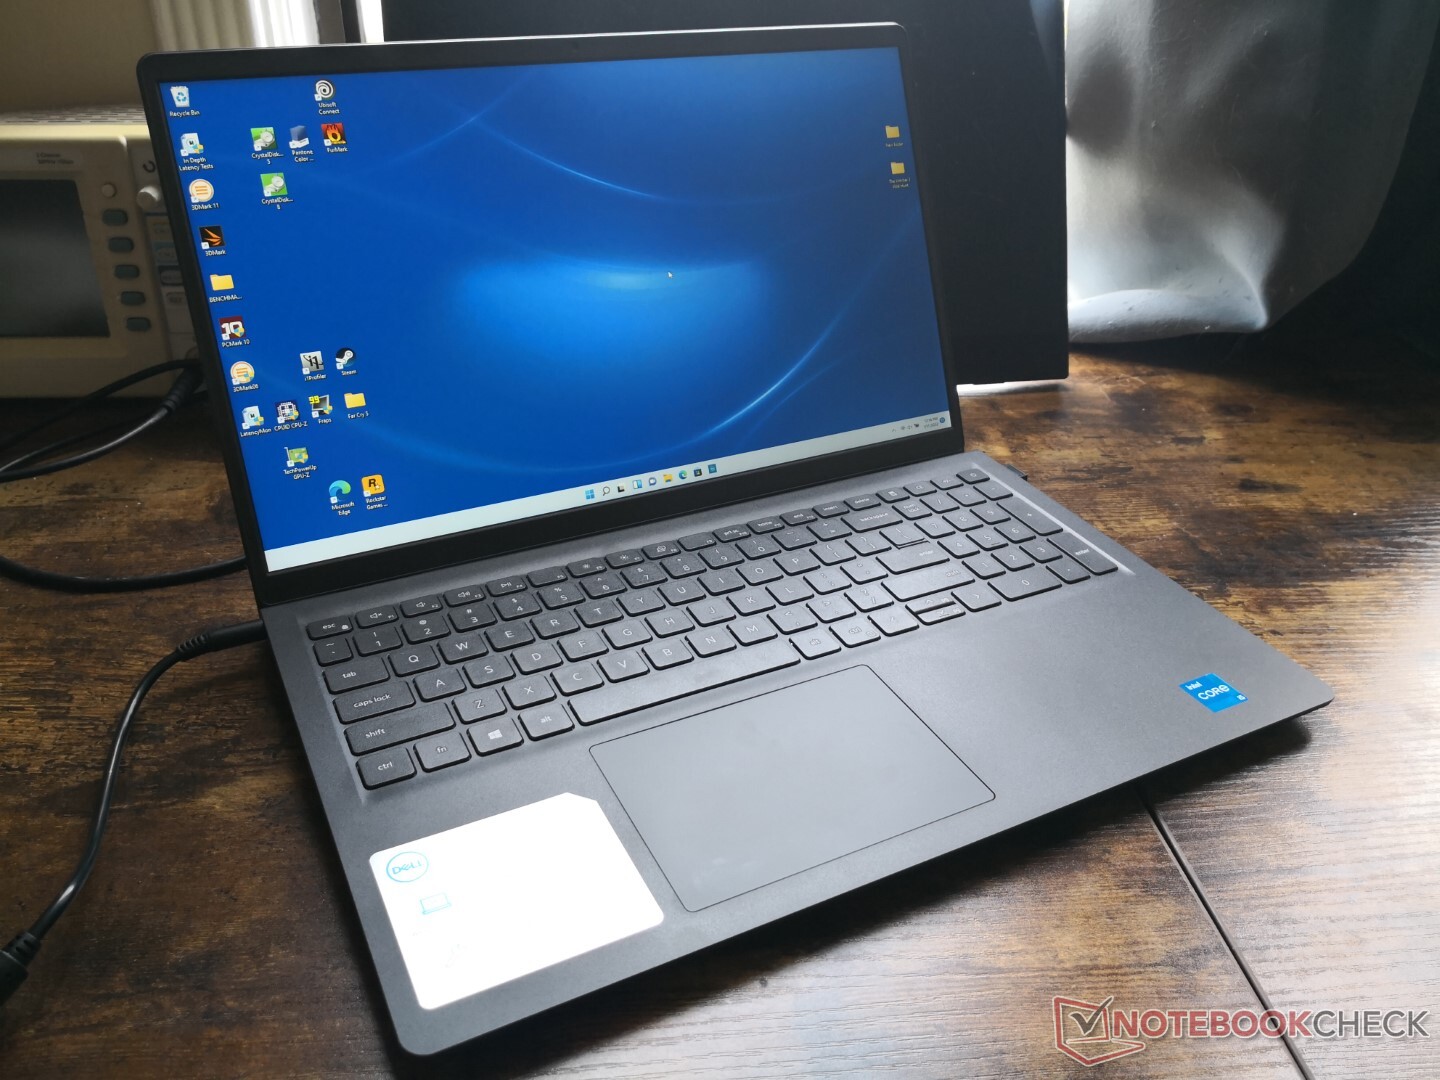
O novo modelo é aproximadamente 11% menor e 15% mais leve do que seu predecessor. Entretanto, o desenho 3501 era na verdade bastante grande, o que significa que o desenho 3511 é mais comparável ao Pavilion, VivoBook, ou IdeaPad 3 em termos de tamanho e peso.
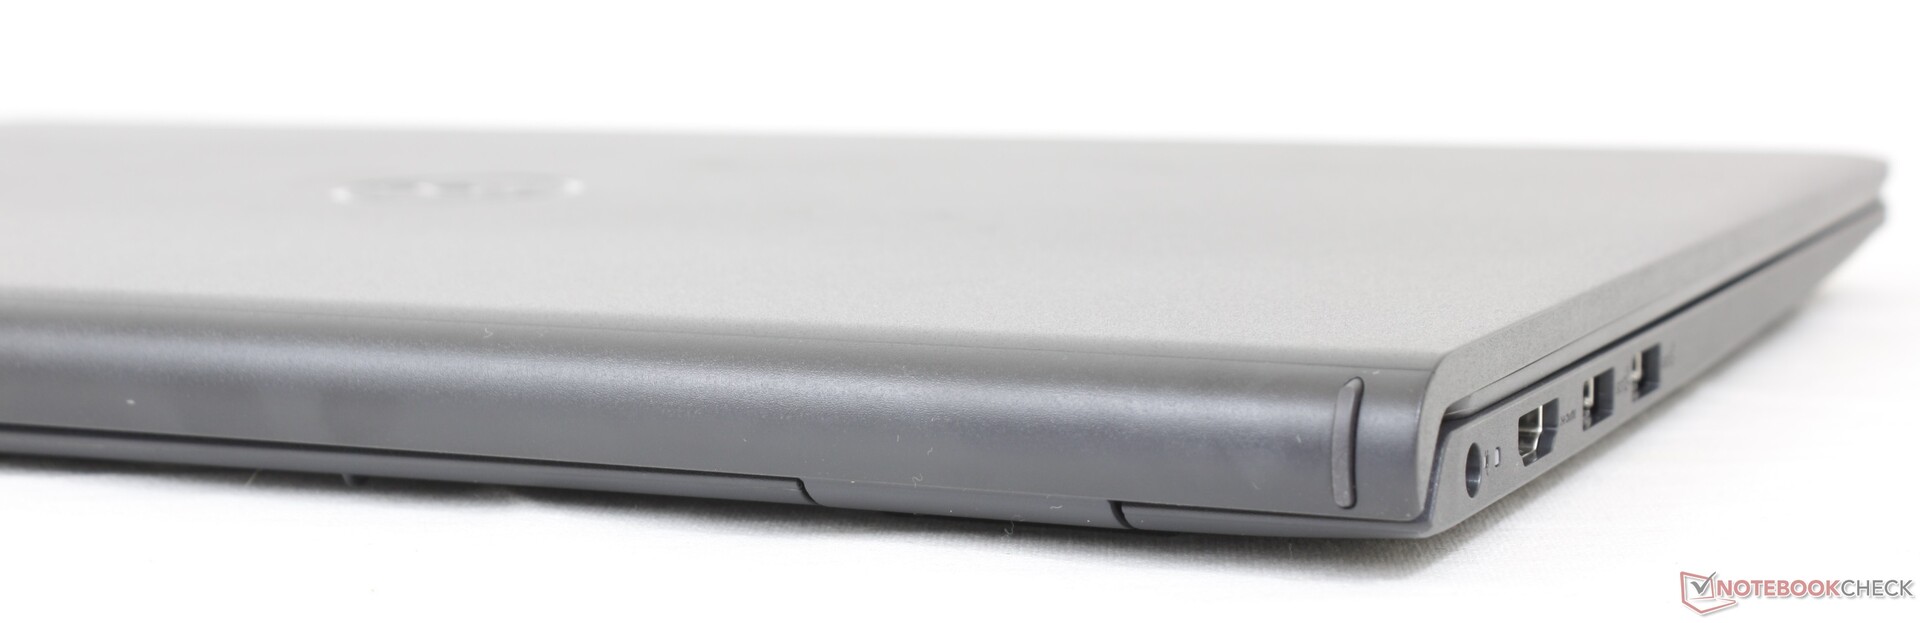
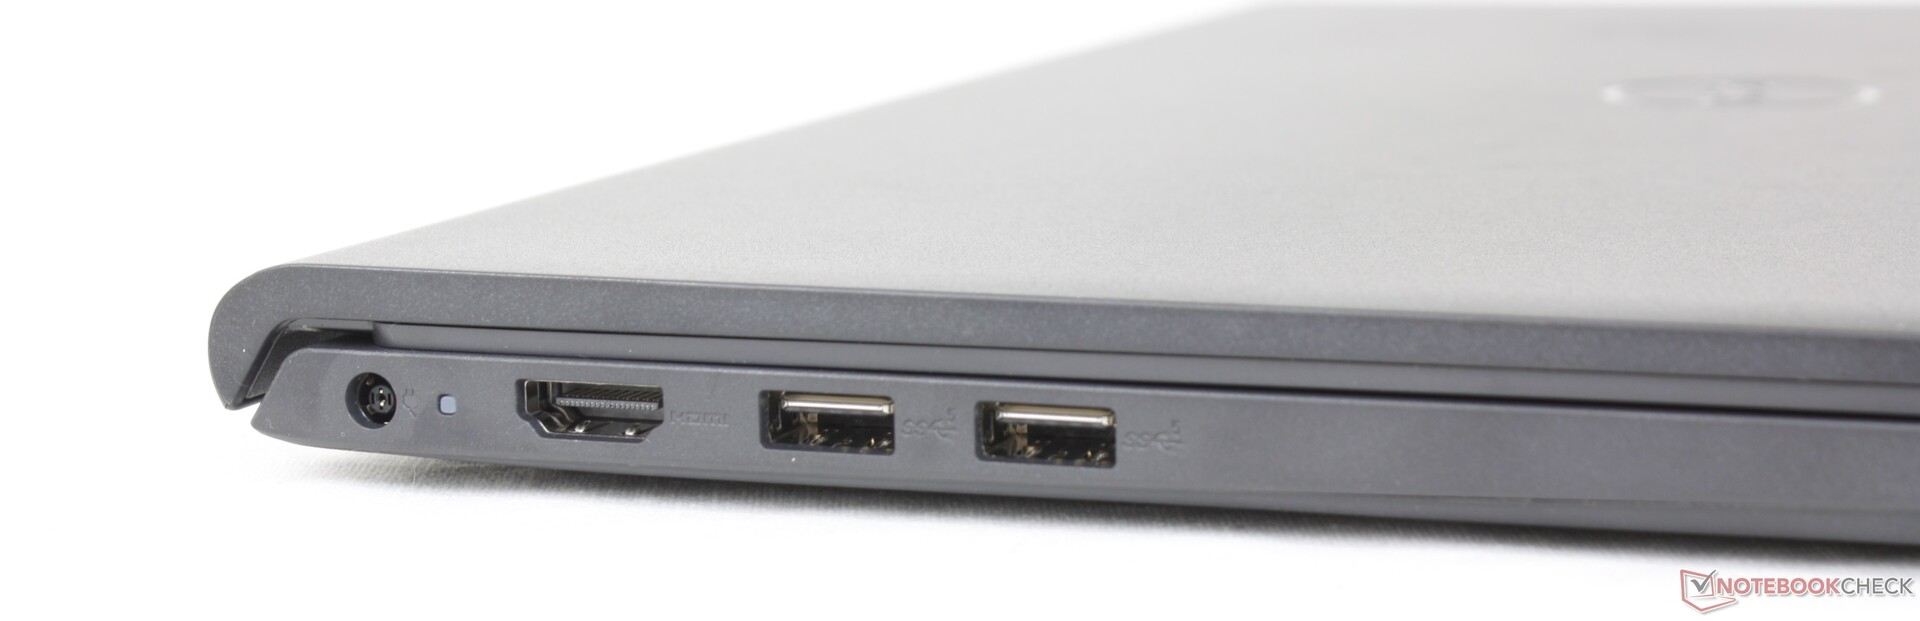
Conectividade
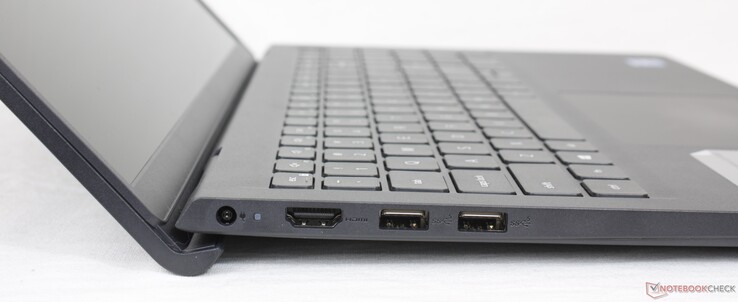
Há menos portos no mais novo Inspiron 15 3511 em comparação com o mais antigo Inspiron 15 3501. O slot de trava de cabo e a porta RJ-45, por exemplo, agora desapareceram completamente. A Dell nem mesmo se deu ao trabalho de incluir uma opção USB-C.
Curiosamente, a porta HDMI aqui só pode suportar até 1080p60 e sem opções de 2K ou 4K de acordo com a própria página de produtos da Dell.
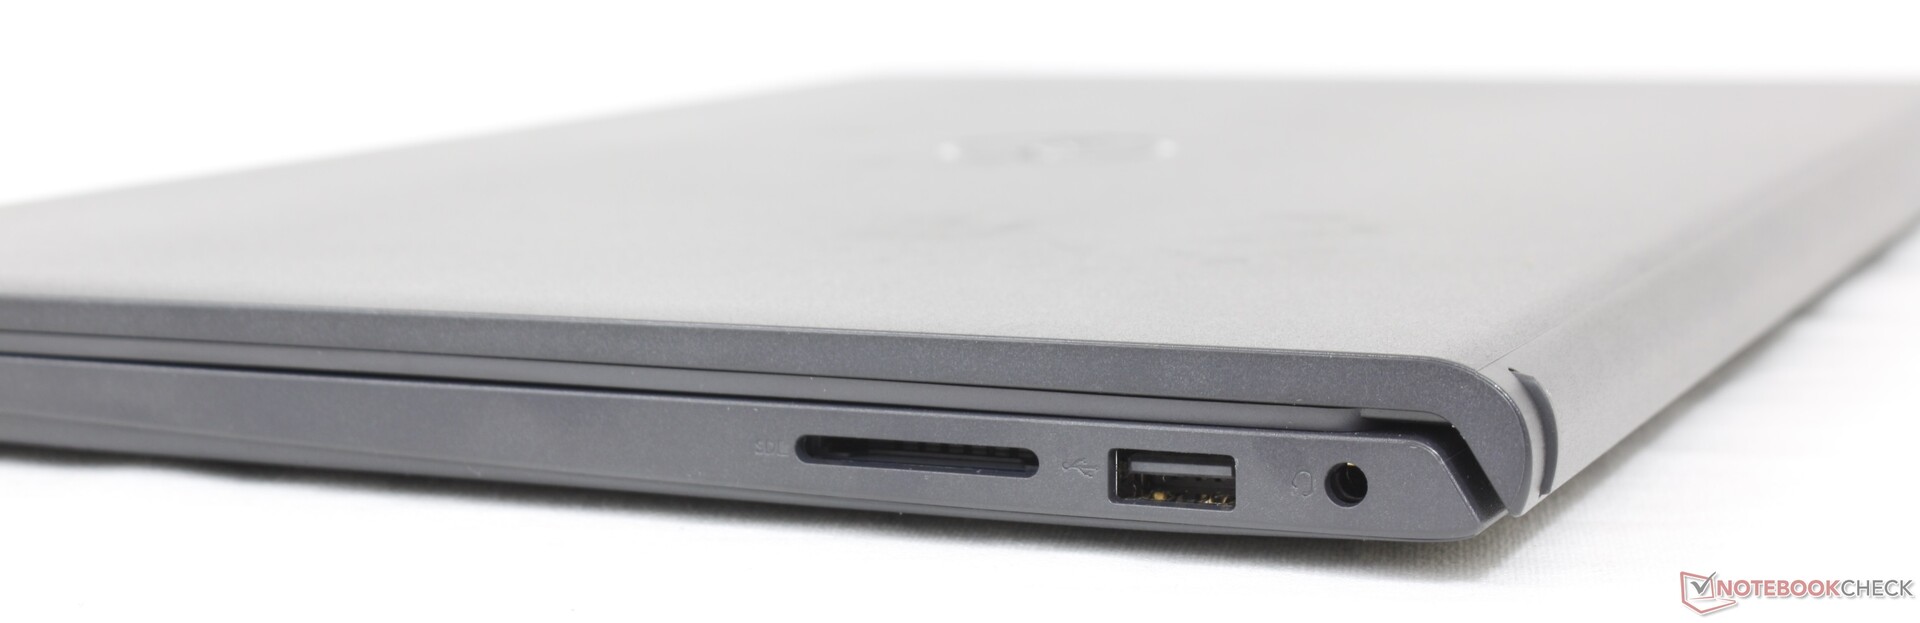
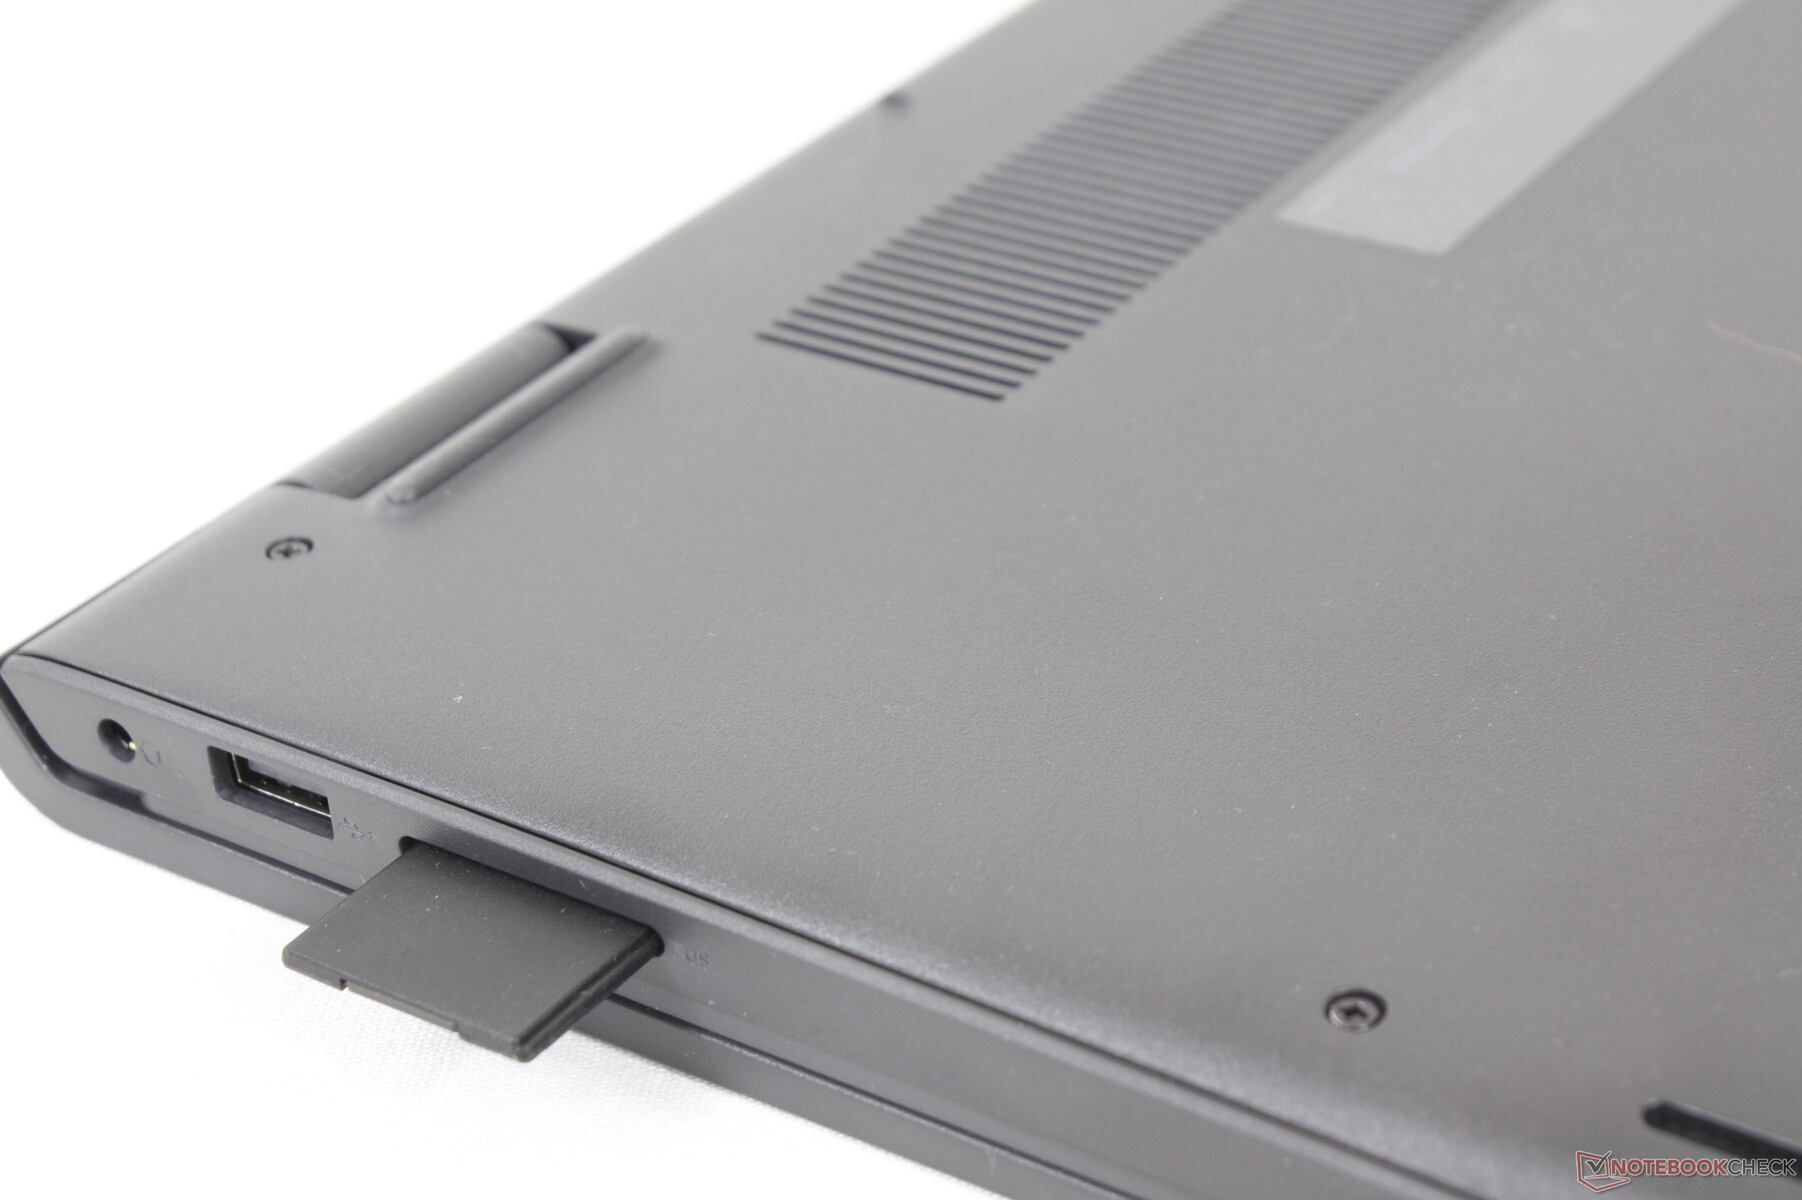
Leitor de cartões SD
O leitor de cartões SD integrado é lento. A transferência de 1 GB de fotos de nosso cartão de teste UHS-II para a área de trabalho leva mais de 50 segundos em comparação a apenas 14 segundos na HP Pavilion 15-eg.
| SD Card Reader | |
| average JPG Copy Test (av. of 3 runs) | |
| Dell XPS 15 9510 i5 11400H FHD (AV Pro V60) | |
| HP Pavilion 15-eg (AV PRO microSD 128 GB V60) | |
| Asus VivoBook S15 D533UA (AV PRO microSD 128 GB V60) | |
| Lenovo IdeaPad 3 15ALC6 (AV PRO microSD 128 GB V60) | |
| Dell Inspiron 15 3501 (AV Pro SD 128 GB V60) | |
| Dell Inspiron 15 3000 3511 (AV Pro V60) | |
| maximum AS SSD Seq Read Test (1GB) | |
| Dell XPS 15 9510 i5 11400H FHD (AV Pro V60) | |
| HP Pavilion 15-eg (AV PRO microSD 128 GB V60) | |
| Lenovo IdeaPad 3 15ALC6 (AV PRO microSD 128 GB V60) | |
| Asus VivoBook S15 D533UA (AV PRO microSD 128 GB V60) | |
| Dell Inspiron 15 3501 (AV Pro SD microSD 128 GB V60) | |
| Dell Inspiron 15 3000 3511 (AV Pro V60) | |
Comunicação
Um módulo 1x1 Wi-Fi 5 está incluído ao invés do habitual módulo 2x2 Wi-Fi 6, que provavelmente economizará em custos. Embora as taxas de transferência no mundo real sejam medíocres, elas são pelo menos estáveis e confiáveis o suficiente para fins de streaming.
Webcam
Não parece haver melhorias na qualidade da câmera do Inspiron 3501 do ano passado. Também não há obturador de webcam ou suporte a Windows Olá.


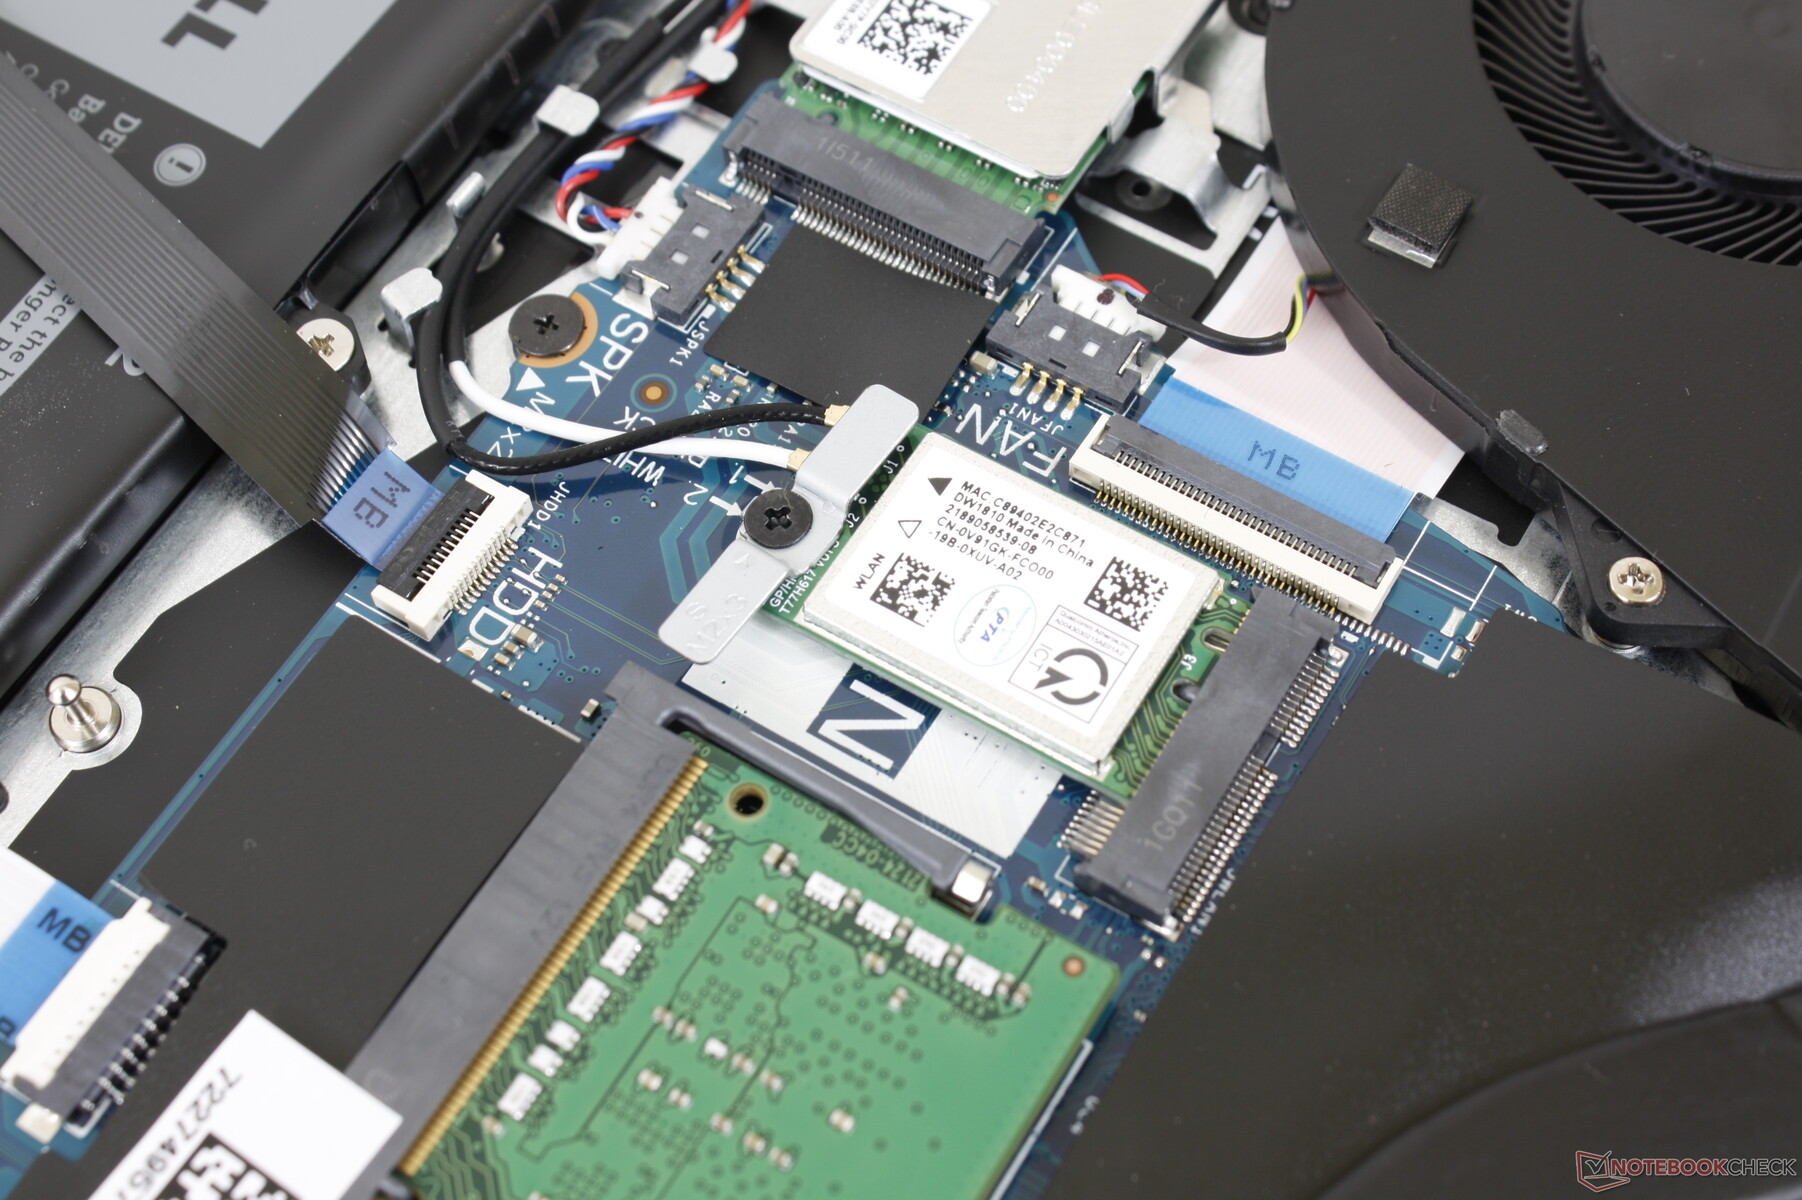
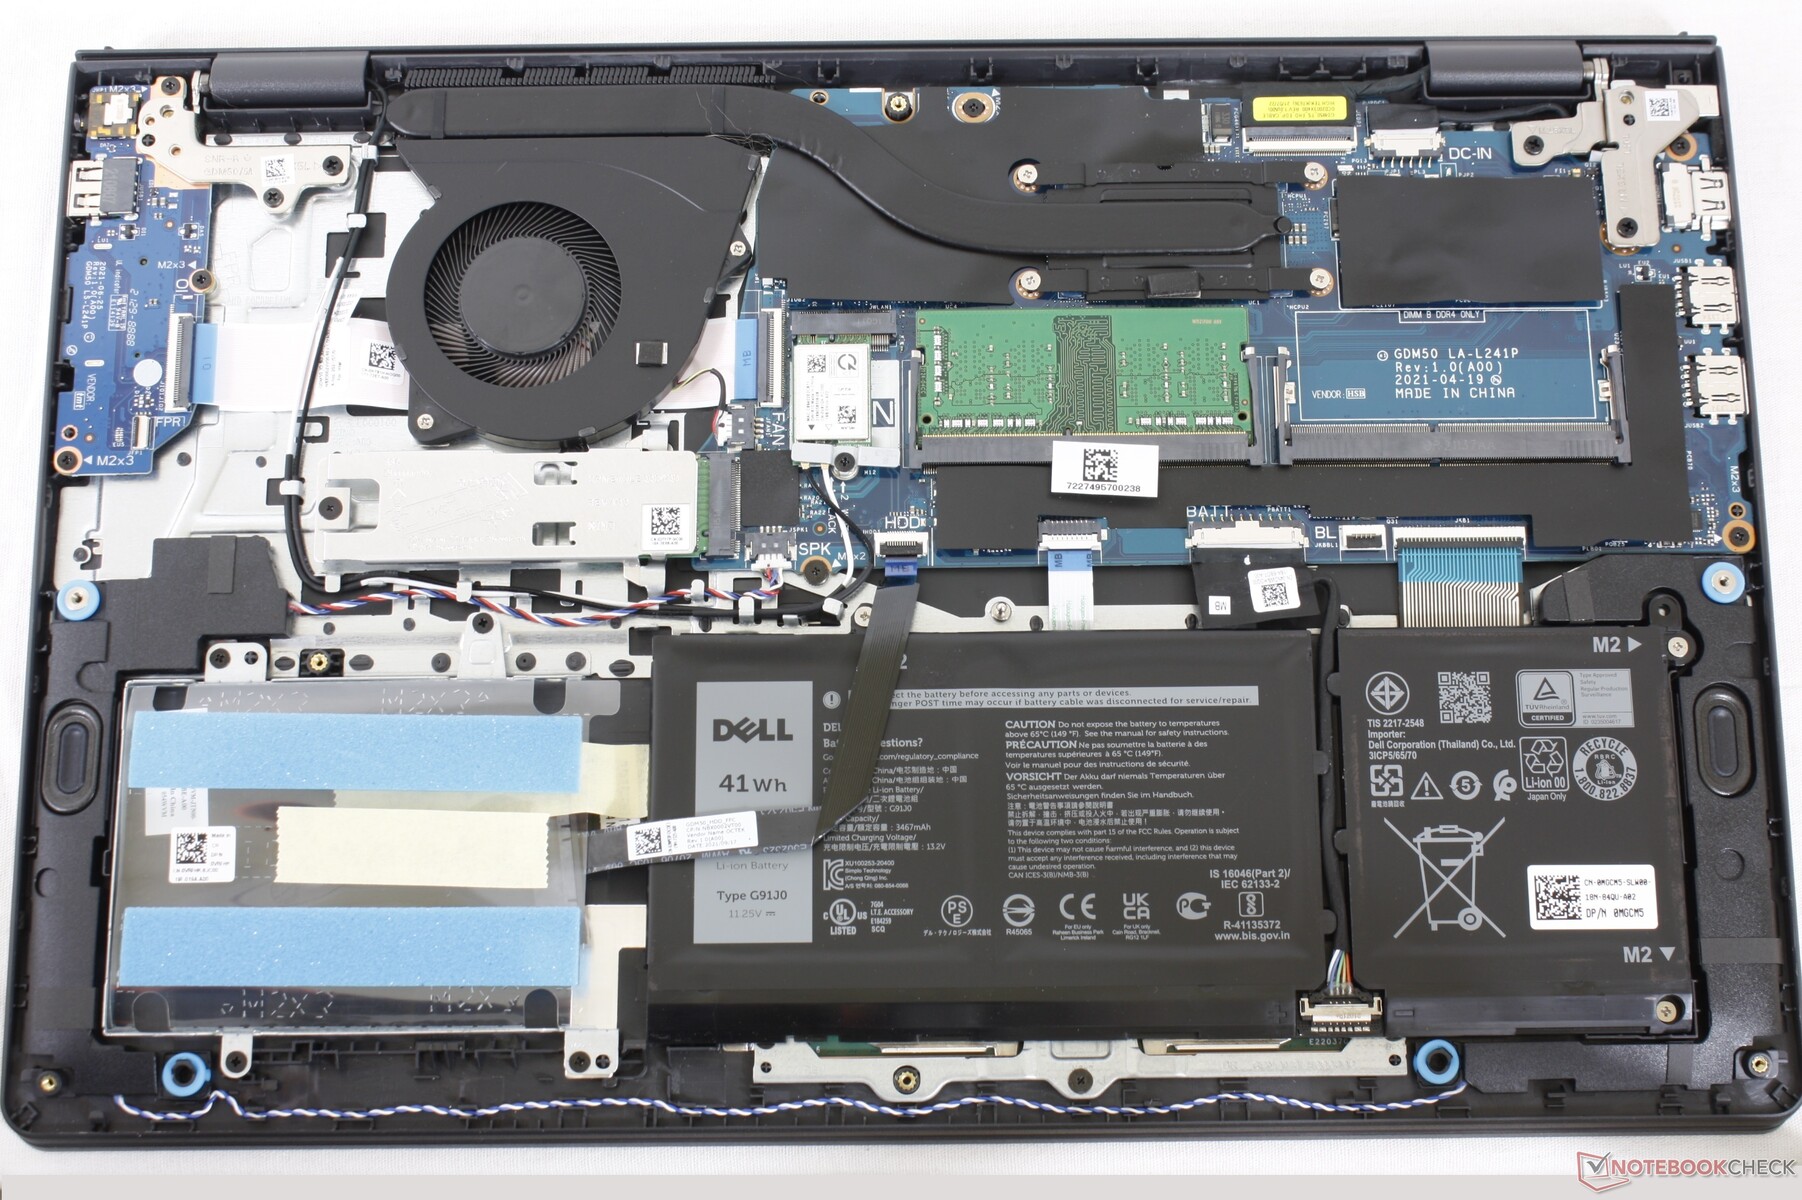
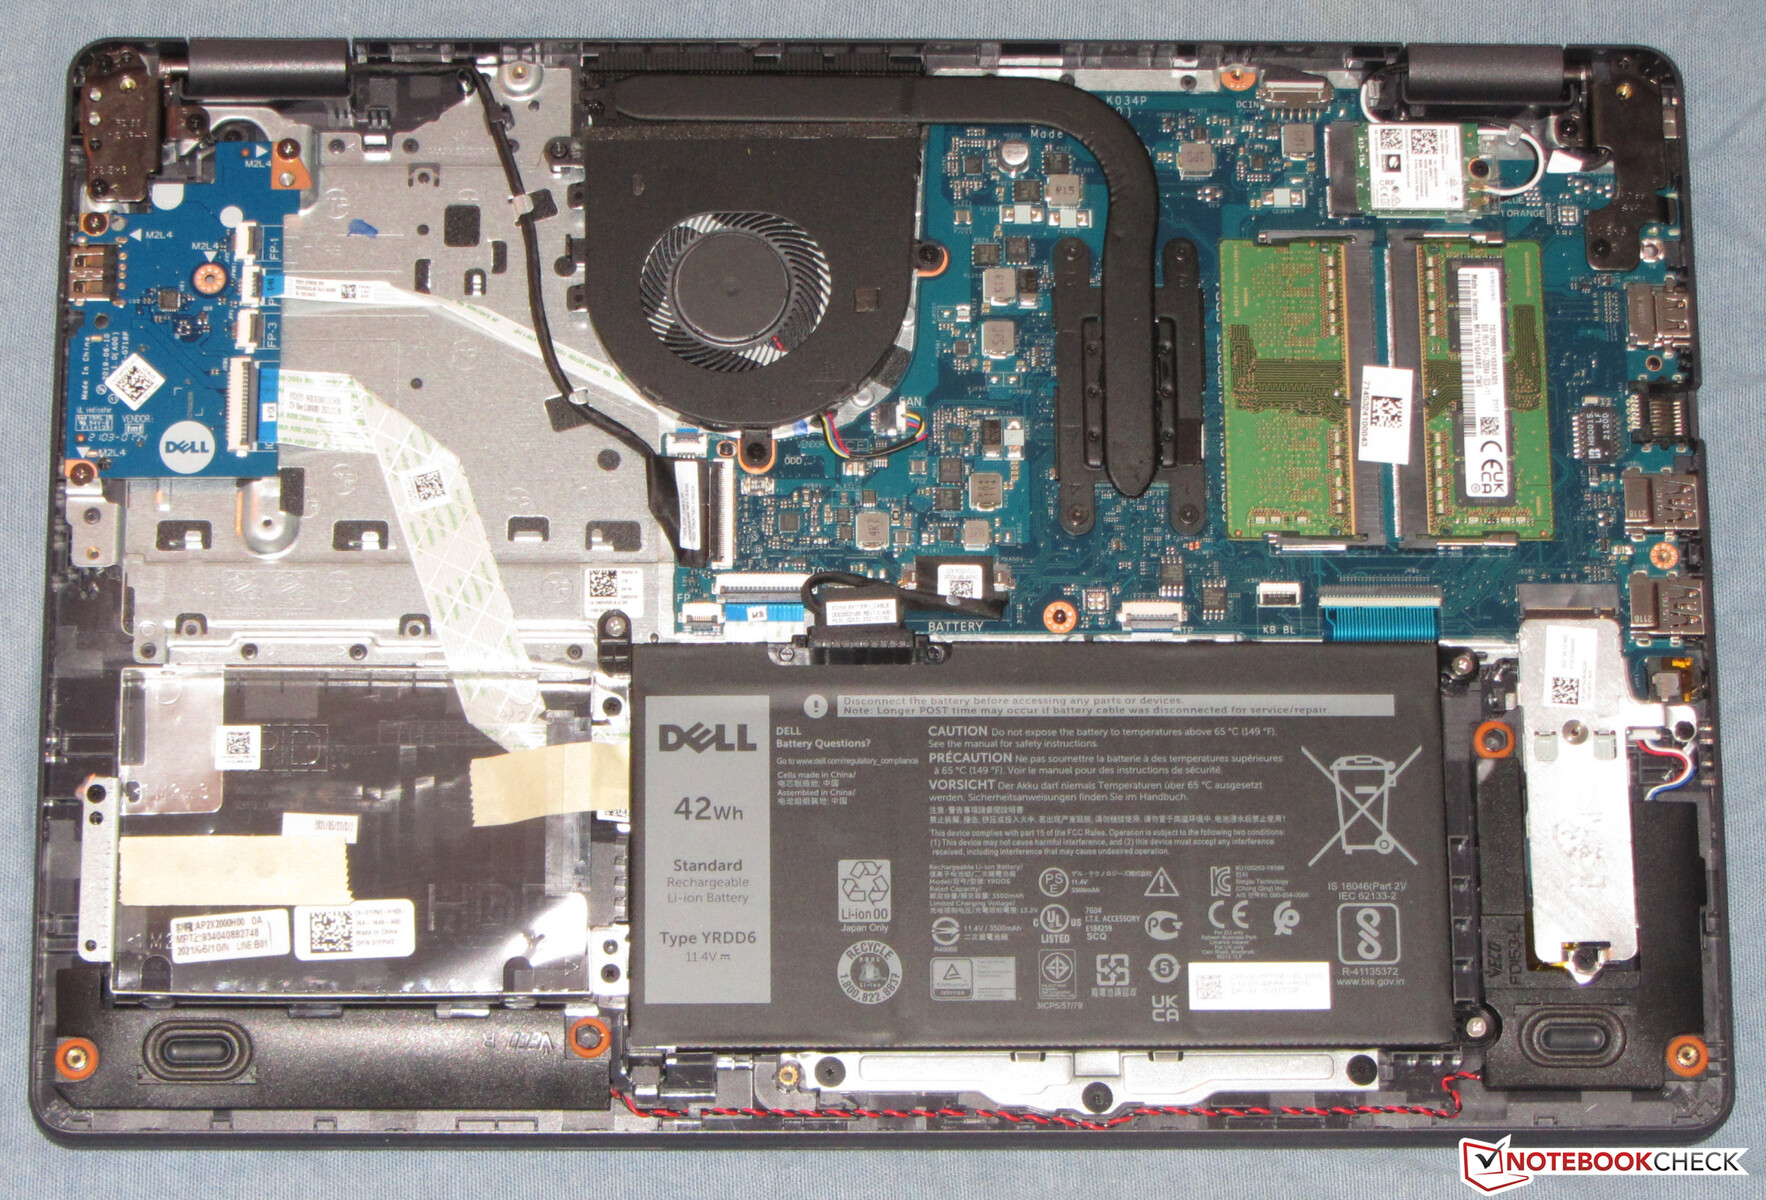
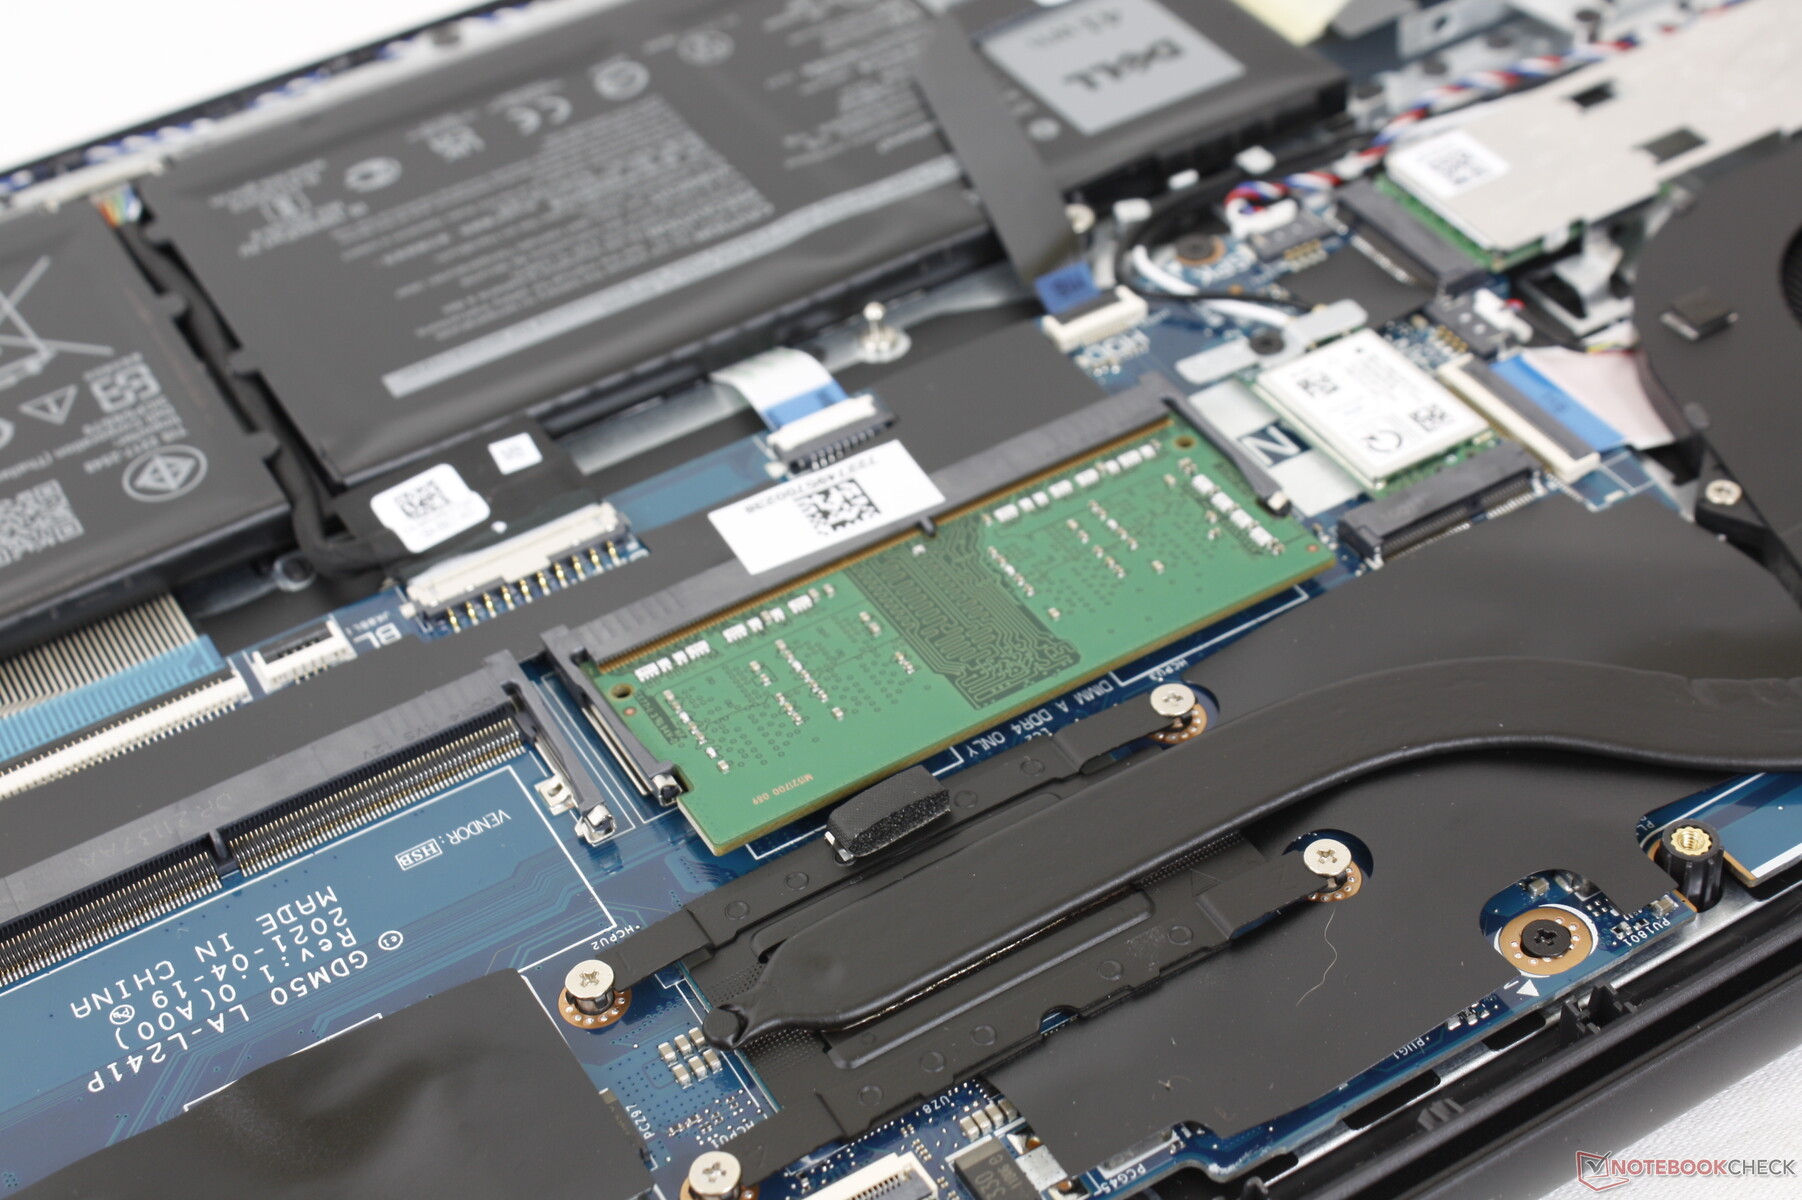
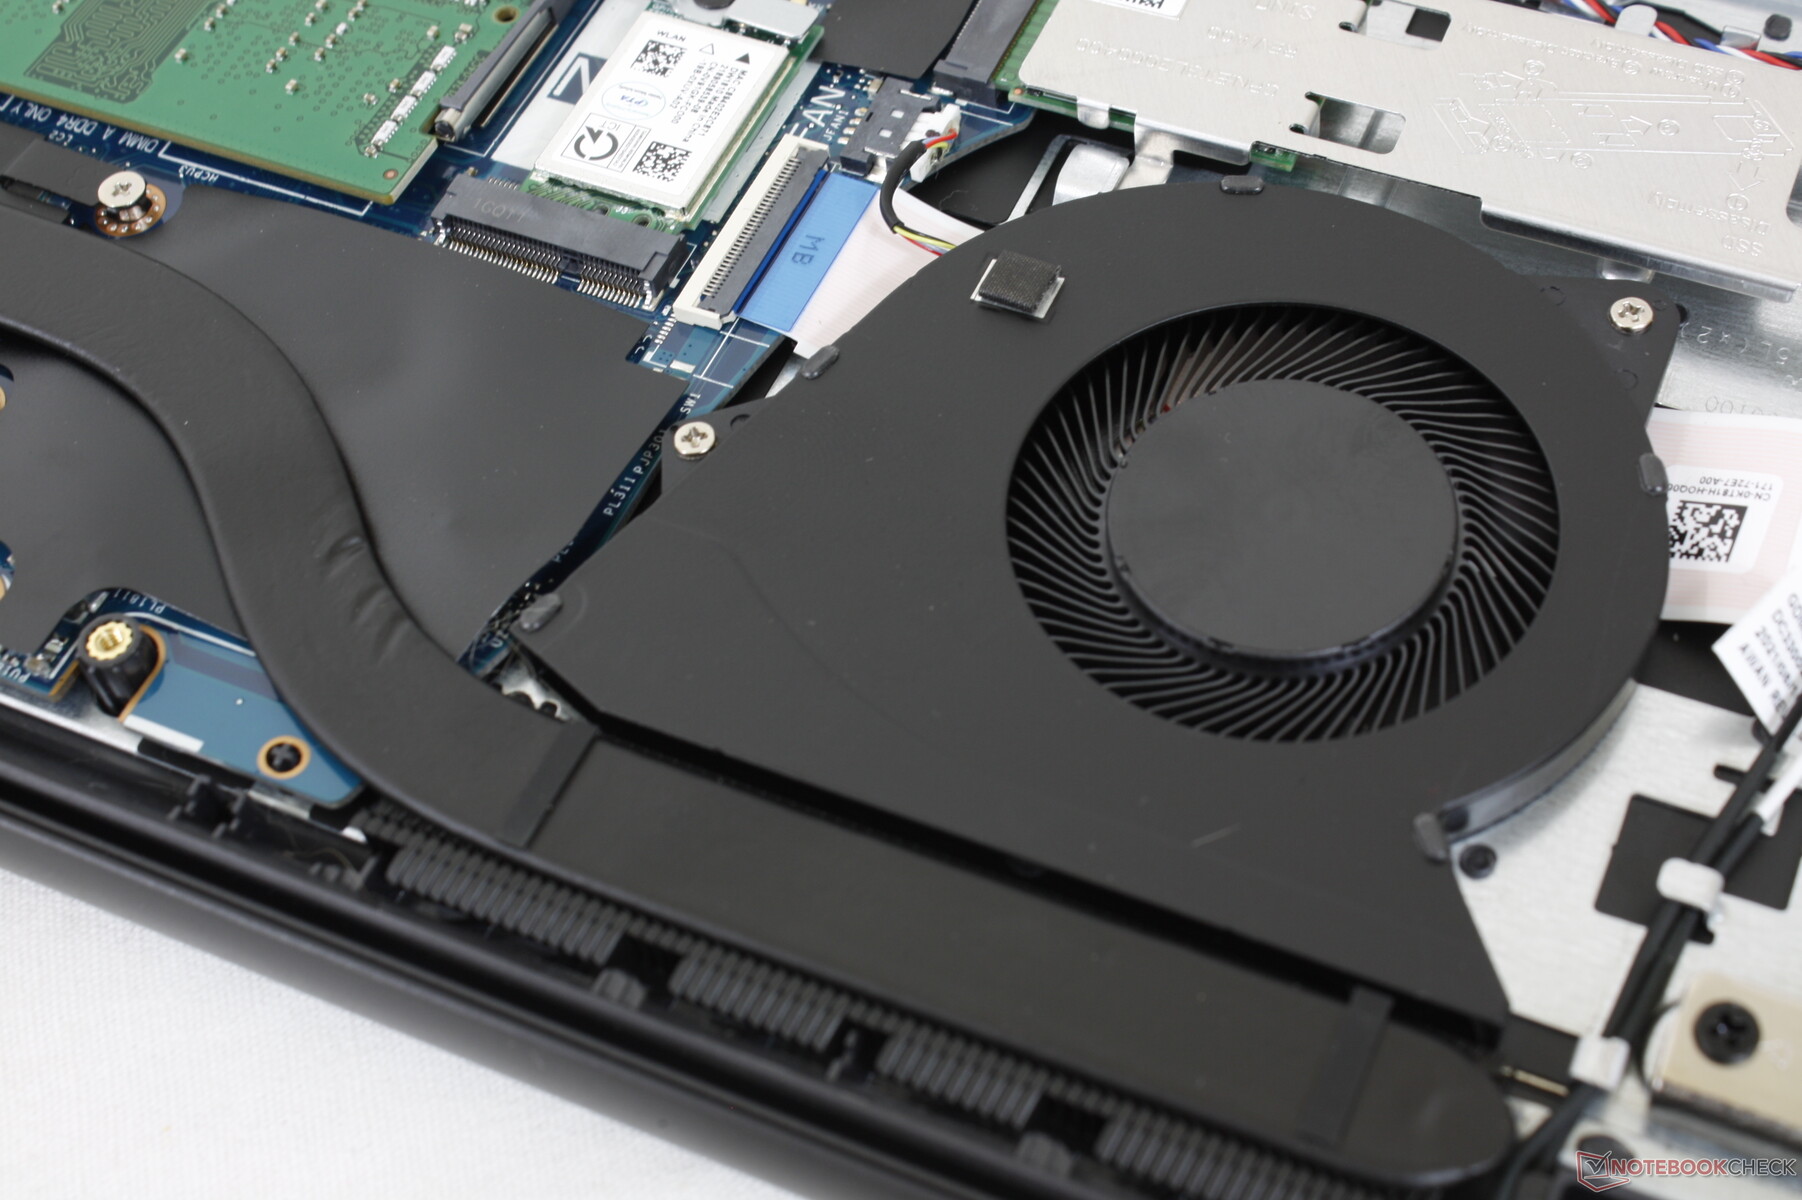
Manutenção
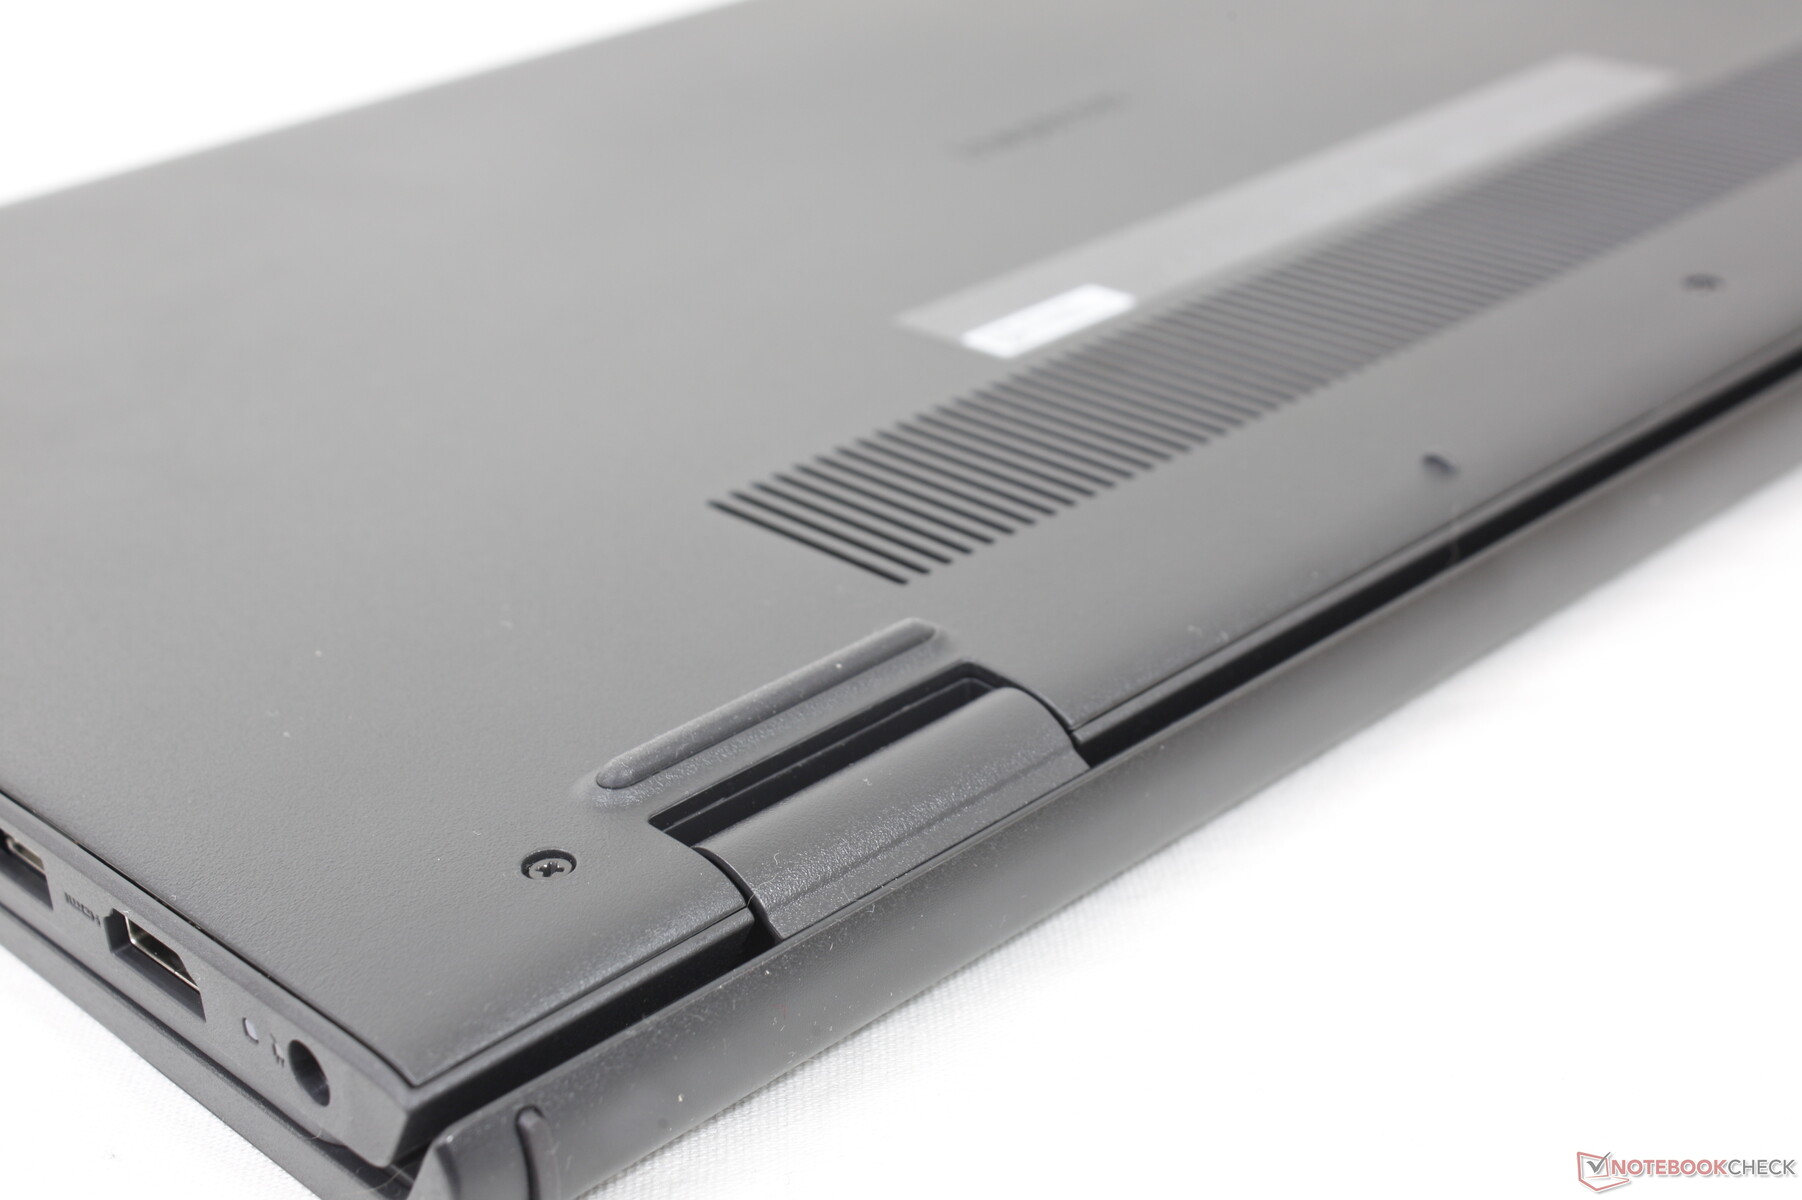
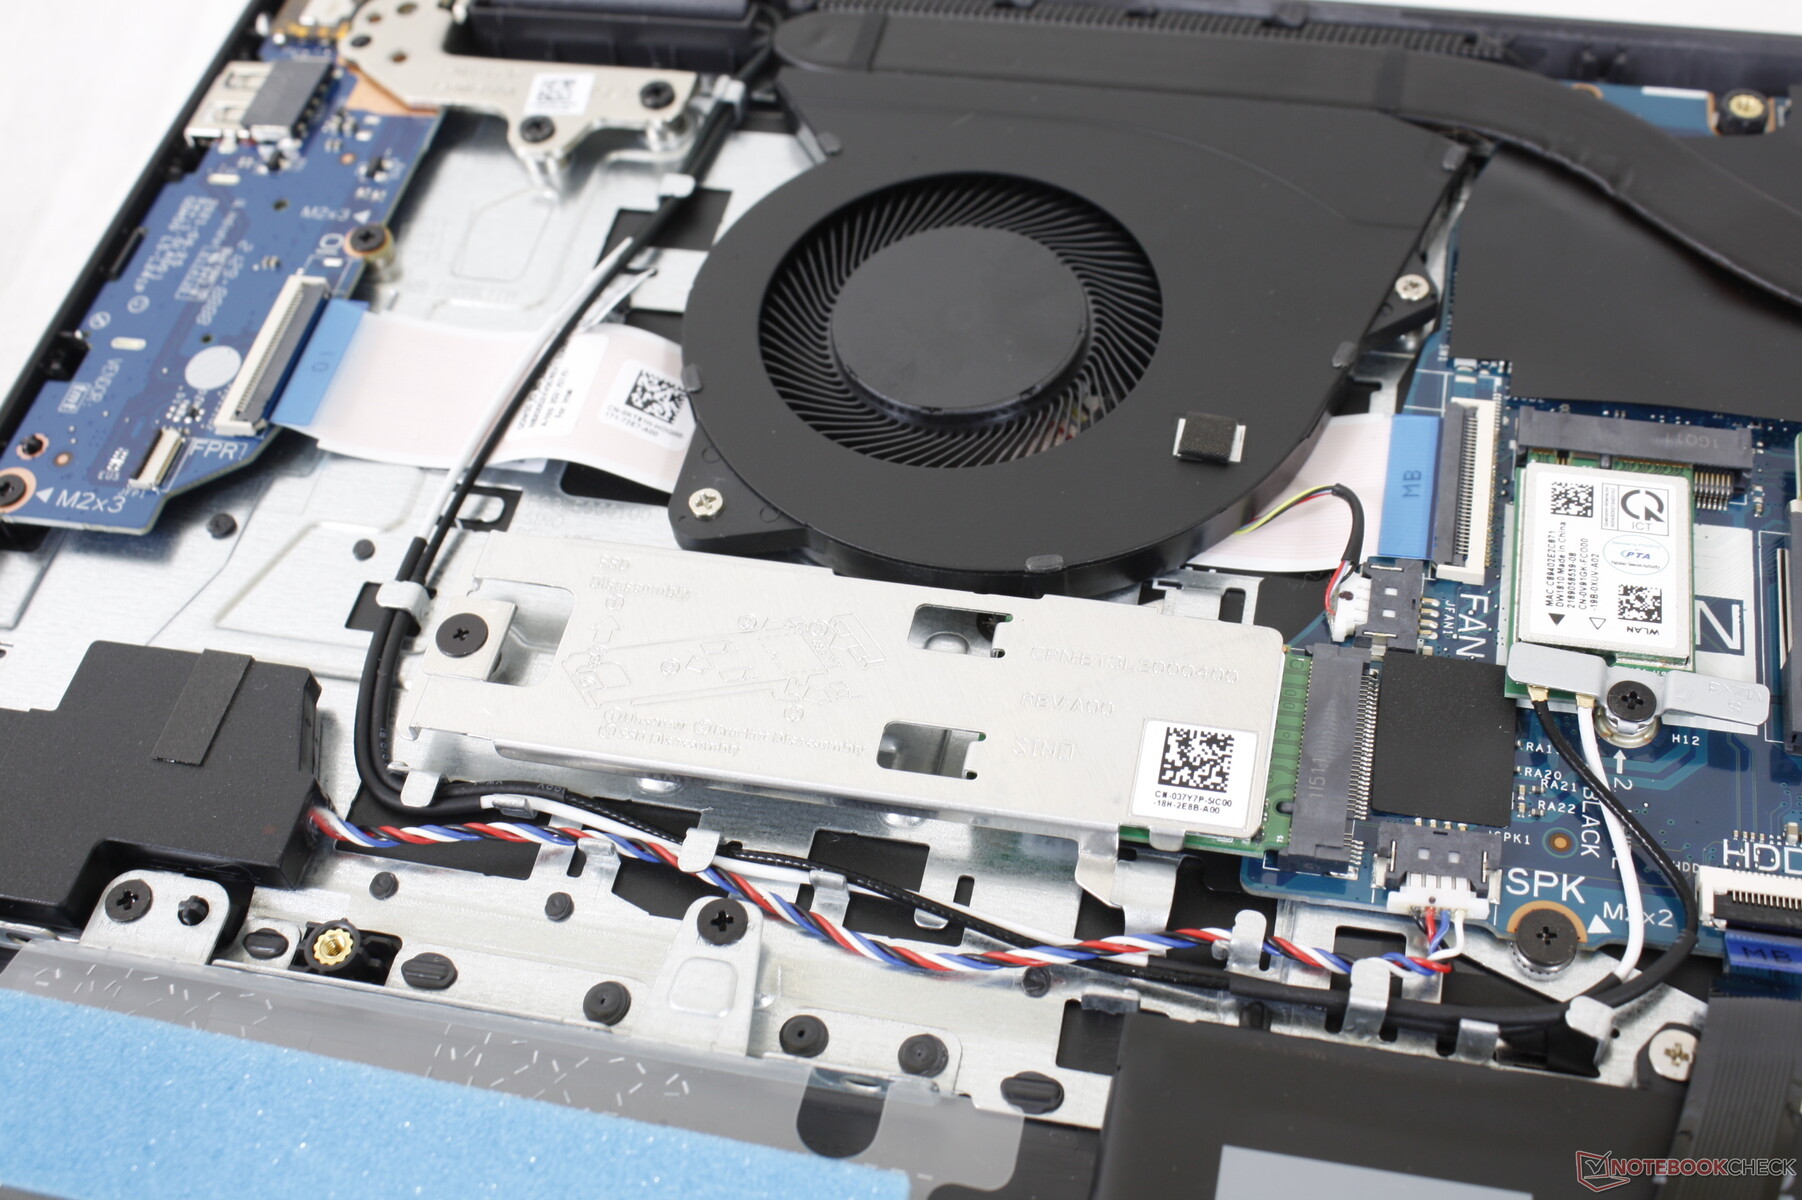
O painel inferior aparece mais facilmente do que o esperado, especialmente para um modelo tão barato. Os usuários têm acesso direto a dois compartimentos de armazenamento, dois slots SODIMM, módulo WLAN, e a maioria dos componentes principais.
Acessórios e Garantia
Não há extras na caixa além do adaptador AC e da papelada. Aplica-se a garantia padrão limitada de um ano do fabricante
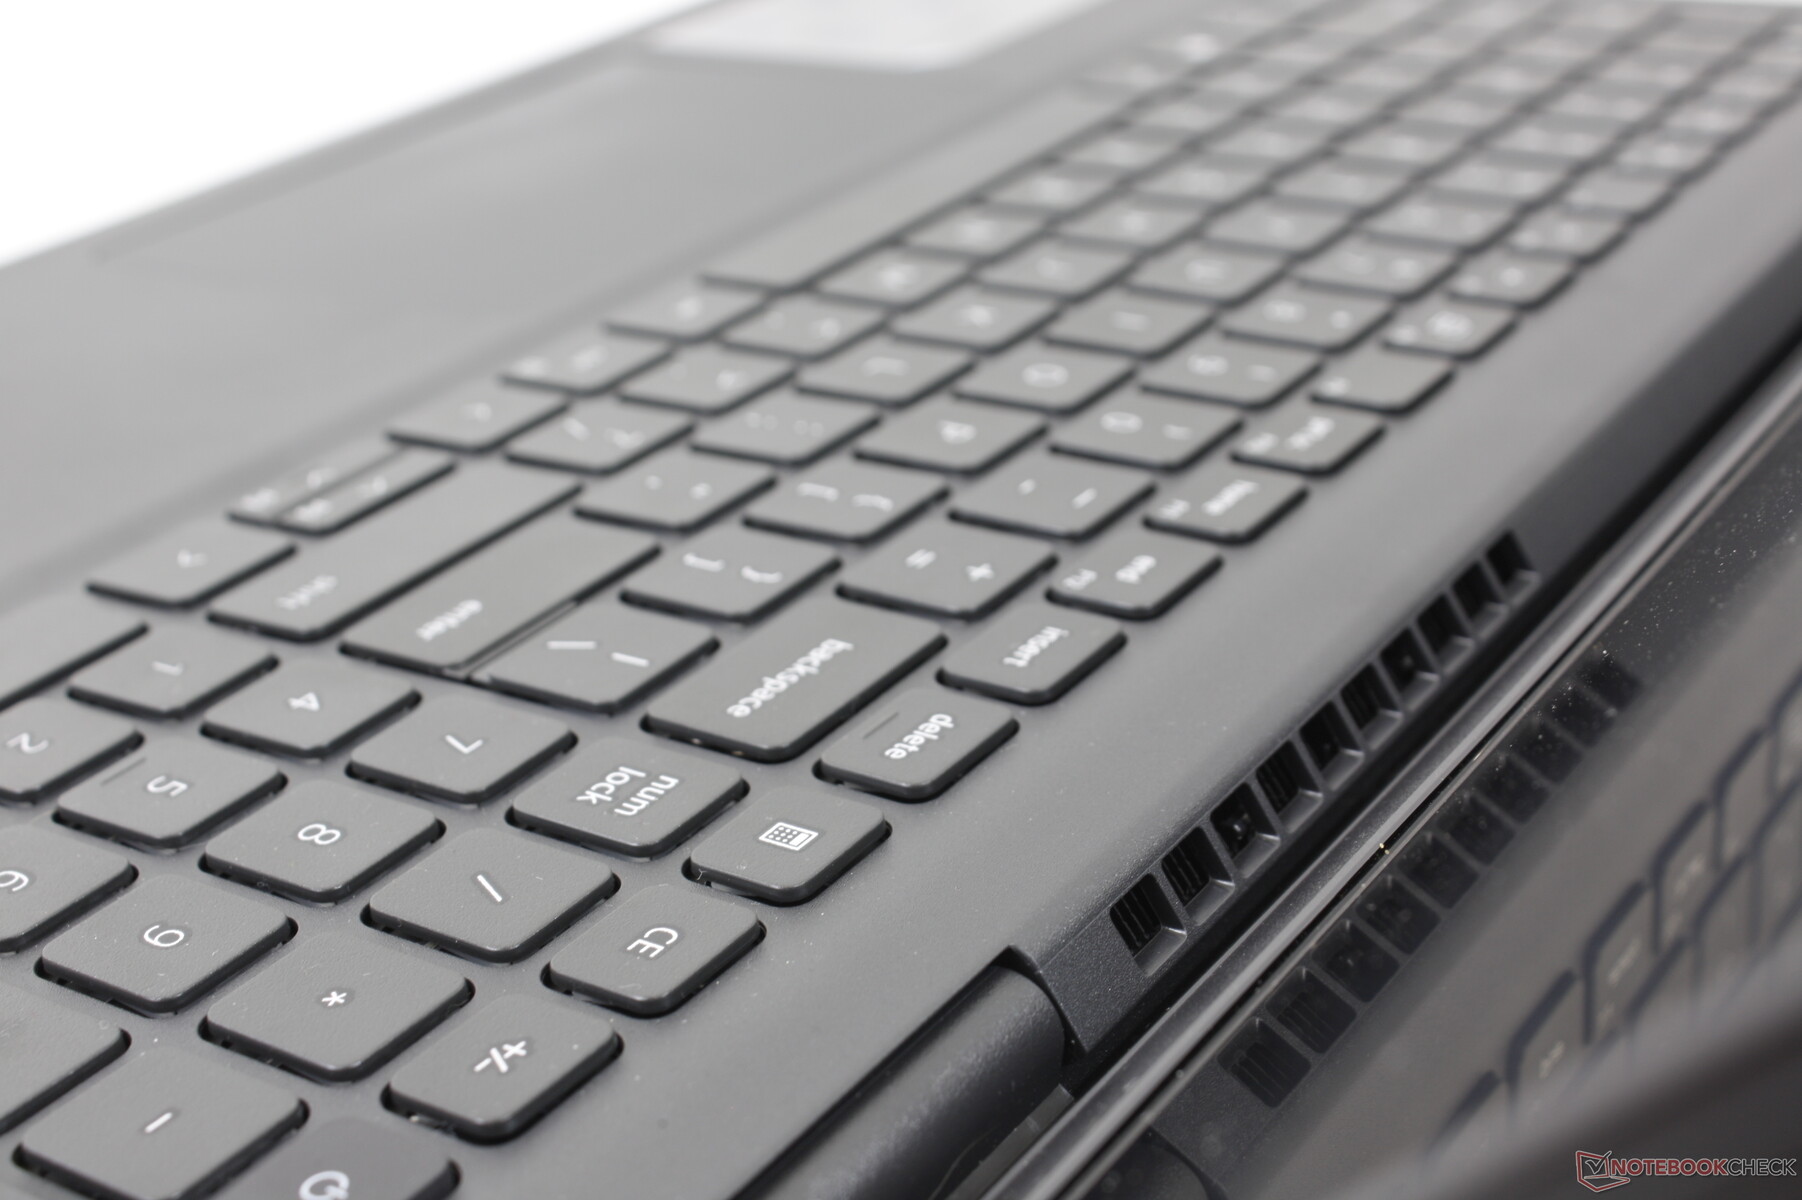
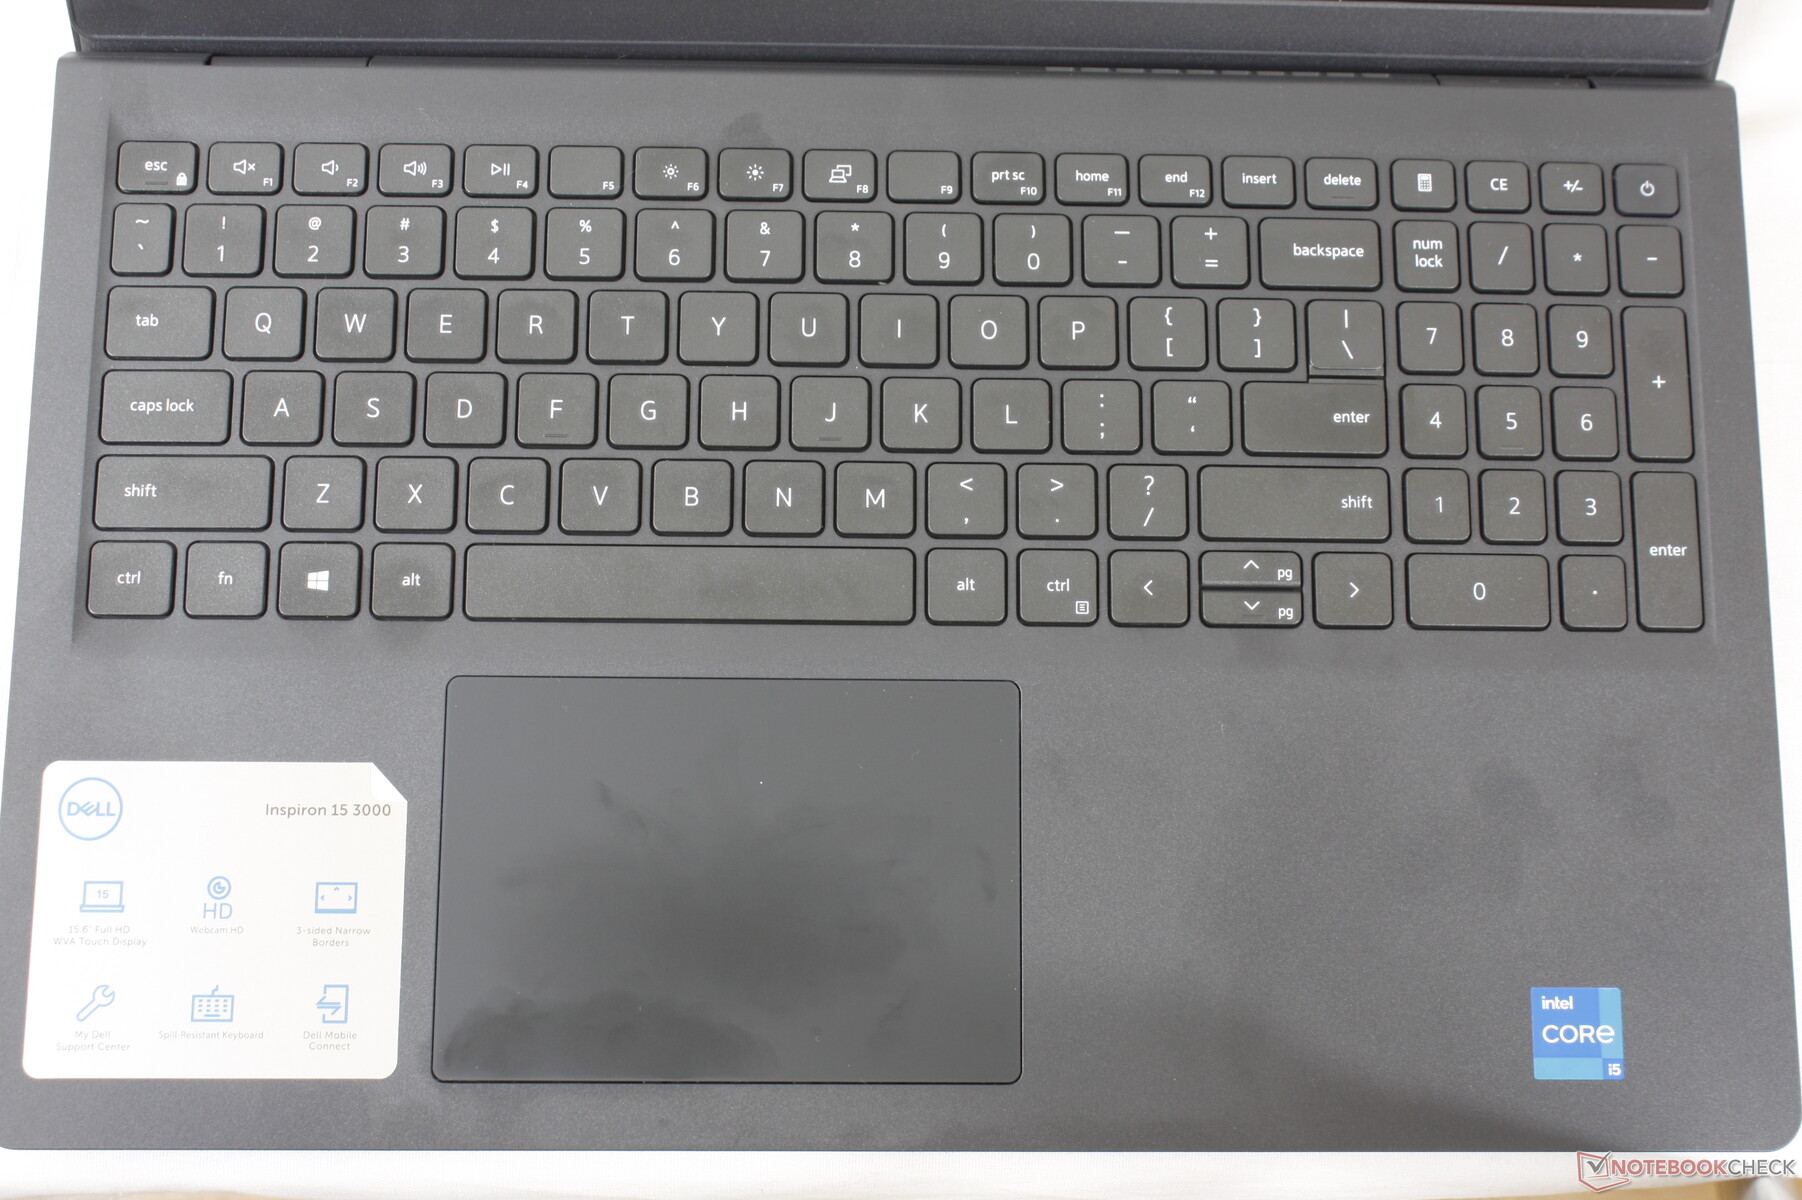
Dispositivos de entrada
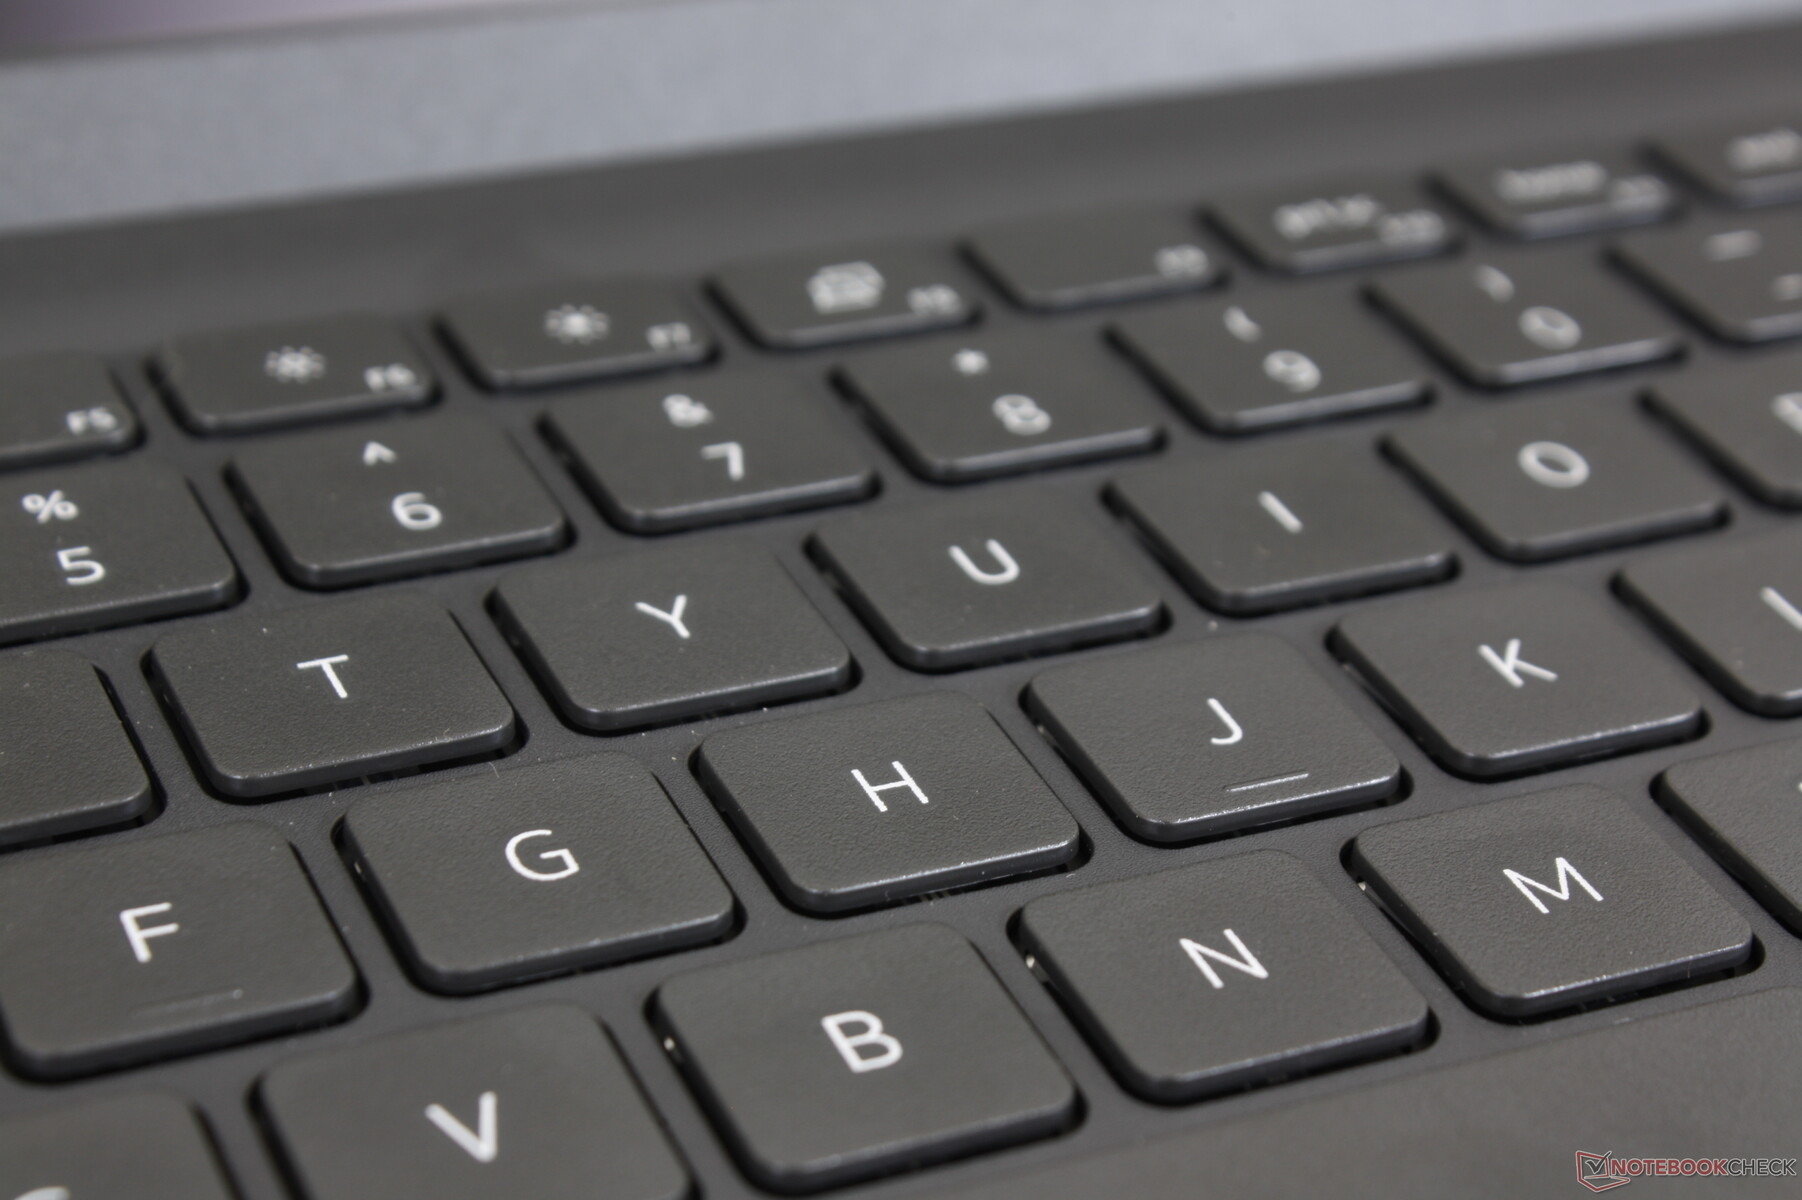
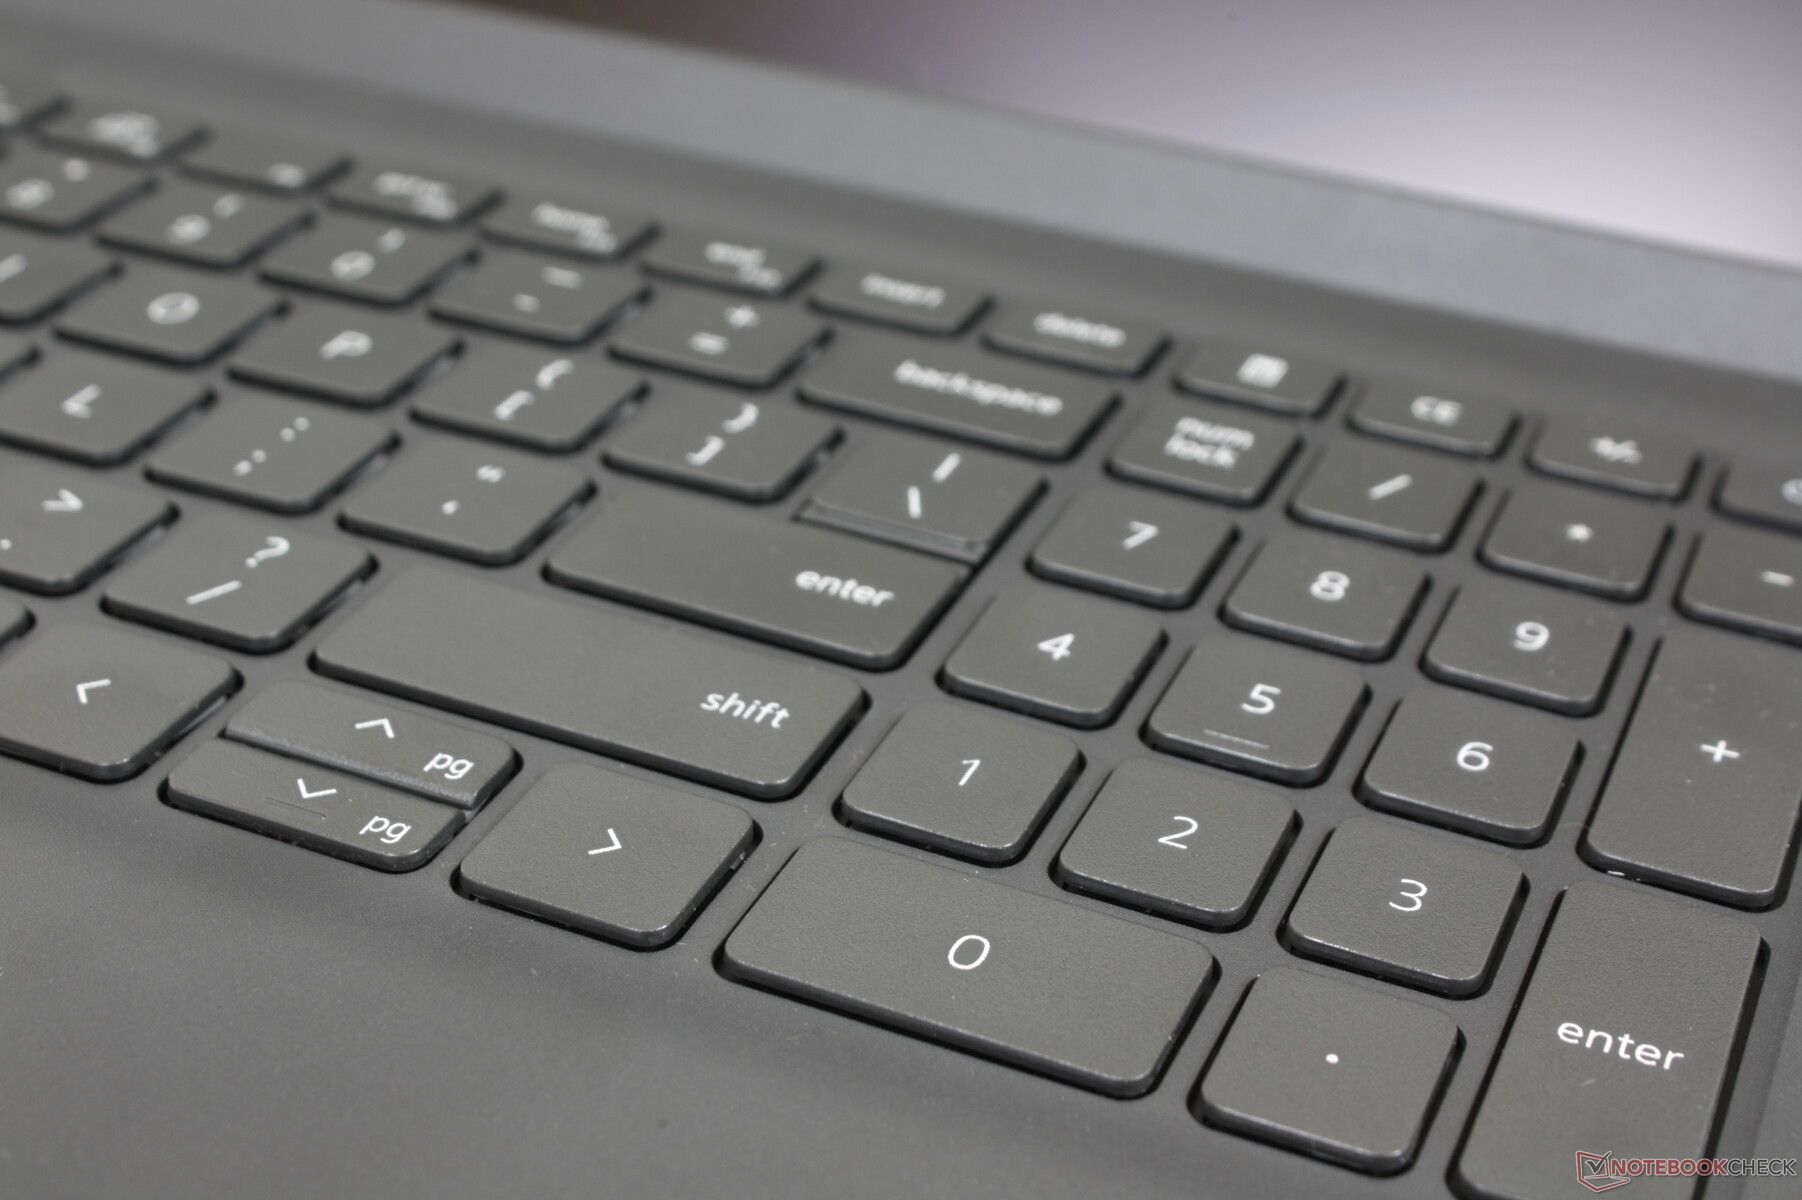
Teclado
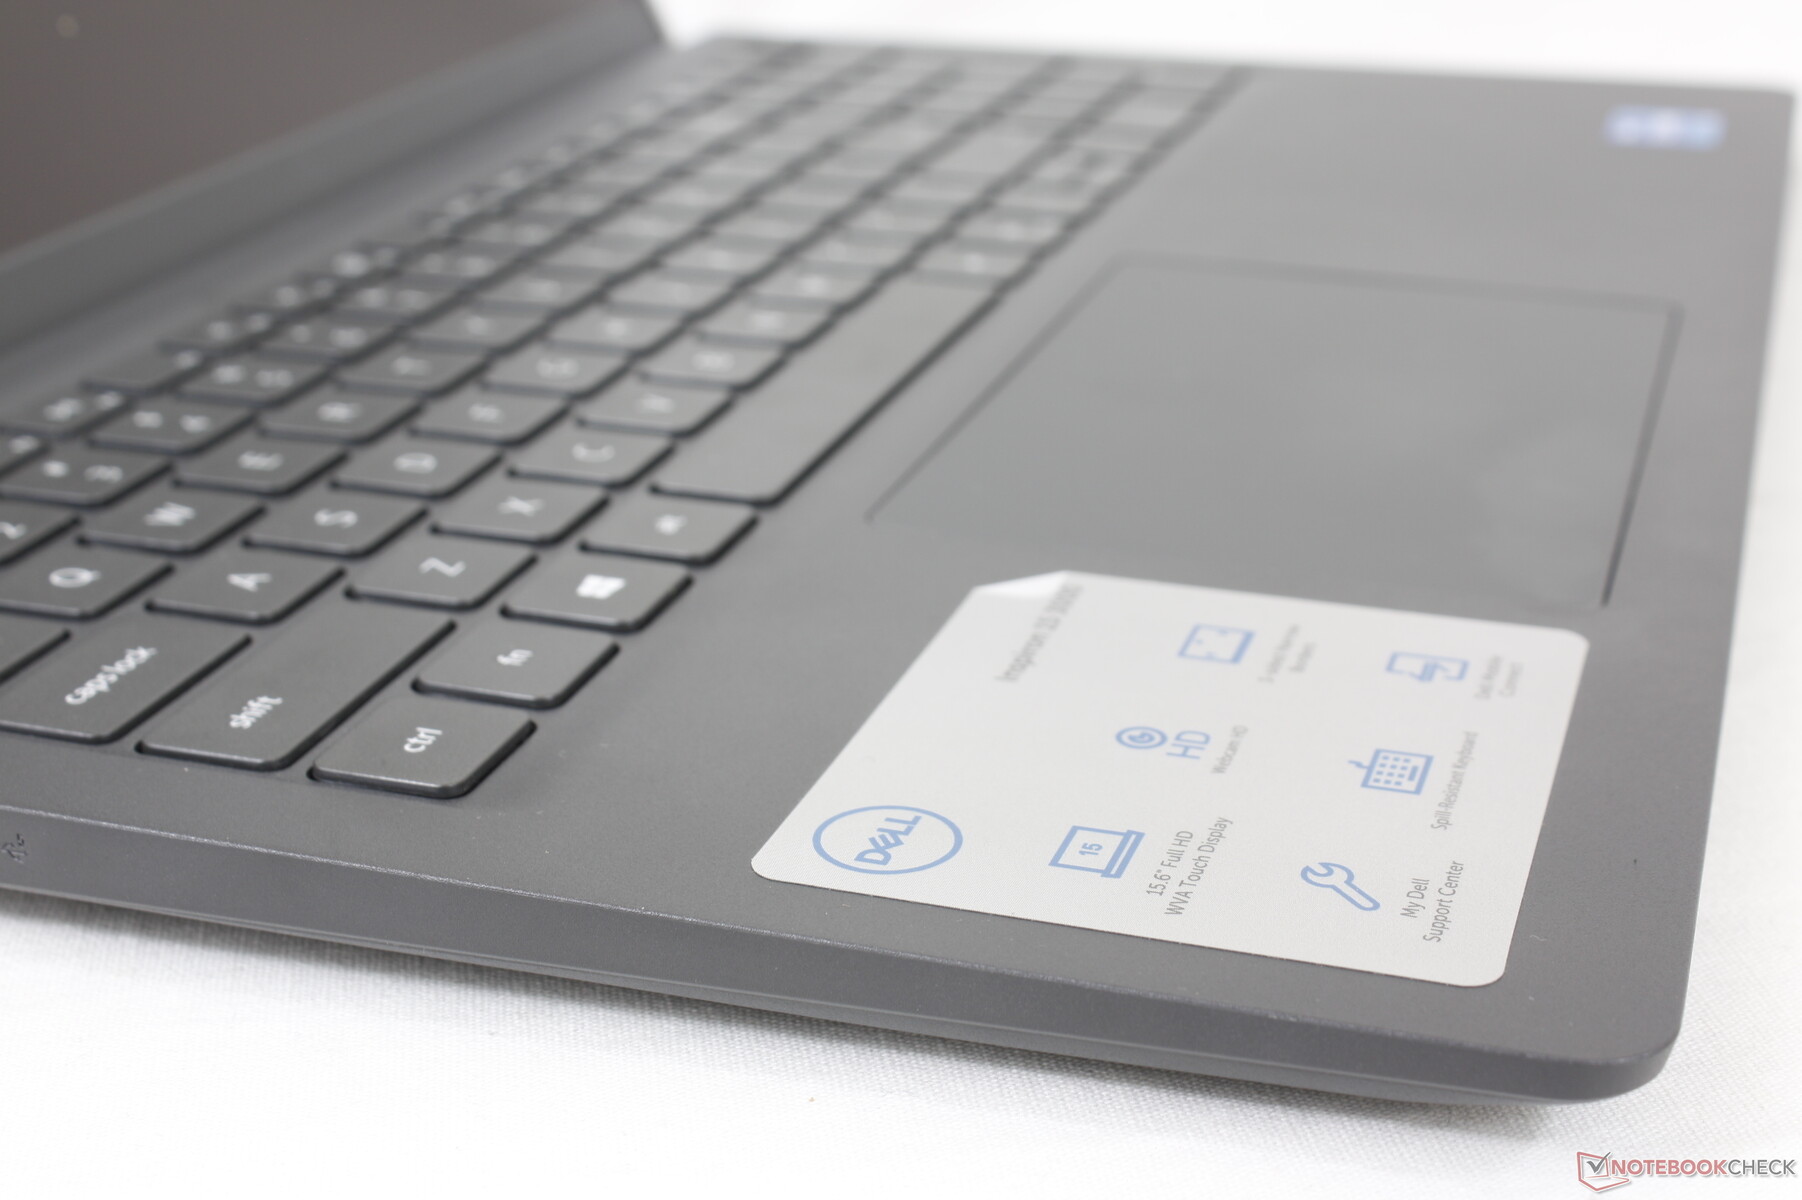
O feedback chave é um pouco mais leve e suave do que o esperado para um toque esponjoso. As chaves Space and Enter em particular se sentem mais fracas do que deveriam quando comparadas às mesmas chaves em um HP Pavilion, Lenovo IdeaPad, ou Asus VivoBook.
Uma luz de fundo do teclado não está disponível.
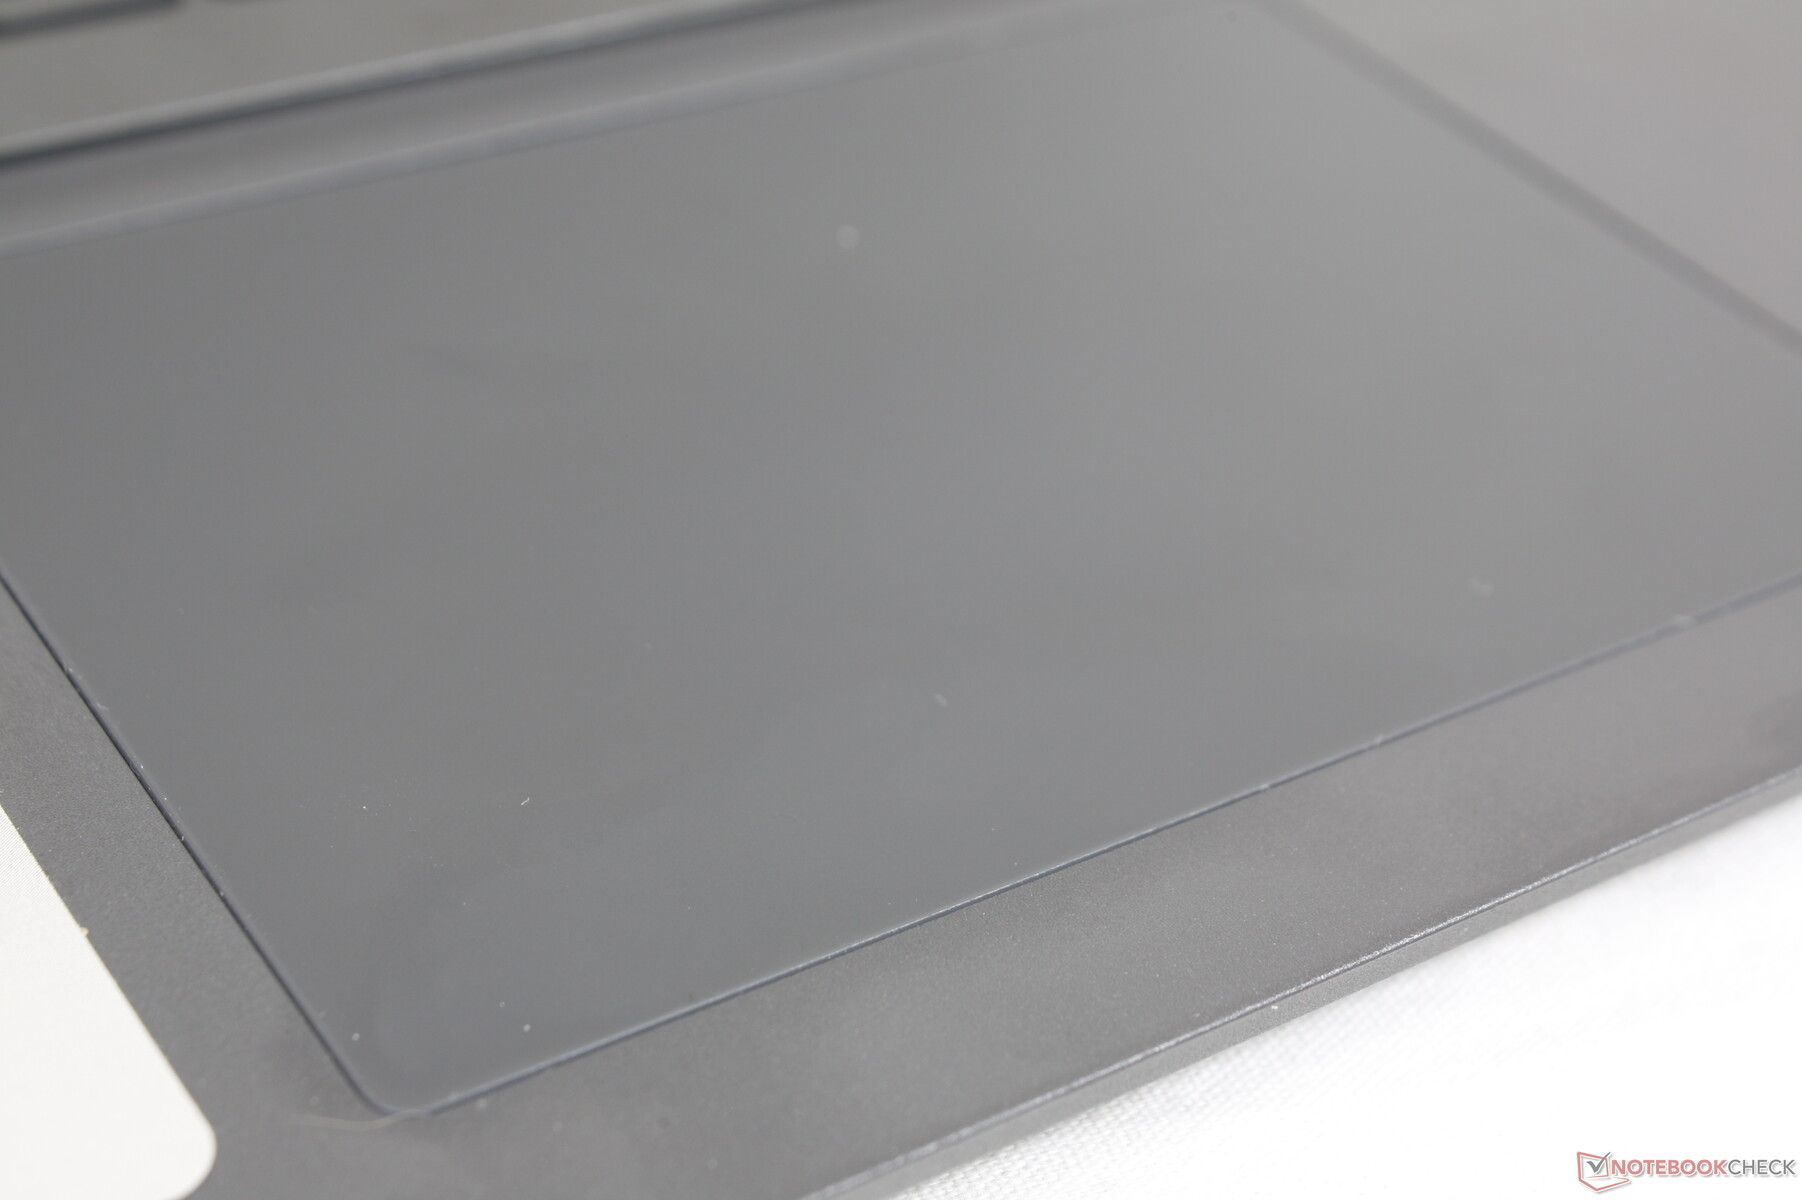
Touchpad
O clickpad é relativamente grande a 11,5 x 8 cm em comparação com 10,5 x 7,3 cm no Asus Vivobook 15 K513EQ ou 11,5 x 7,4 cm na HP 2021 Pavilion 15. Sua superfície é mais pegajosa do que em muitos outros clickpads, particularmente quando desliza a velocidades mais lentas ou médias. É suficientemente confiável para o controle regular do cursor, mas outras ações como clicar ou arrastar e soltar podem ser cansativas sem botões reais ou um mouse USB.
Mostrar
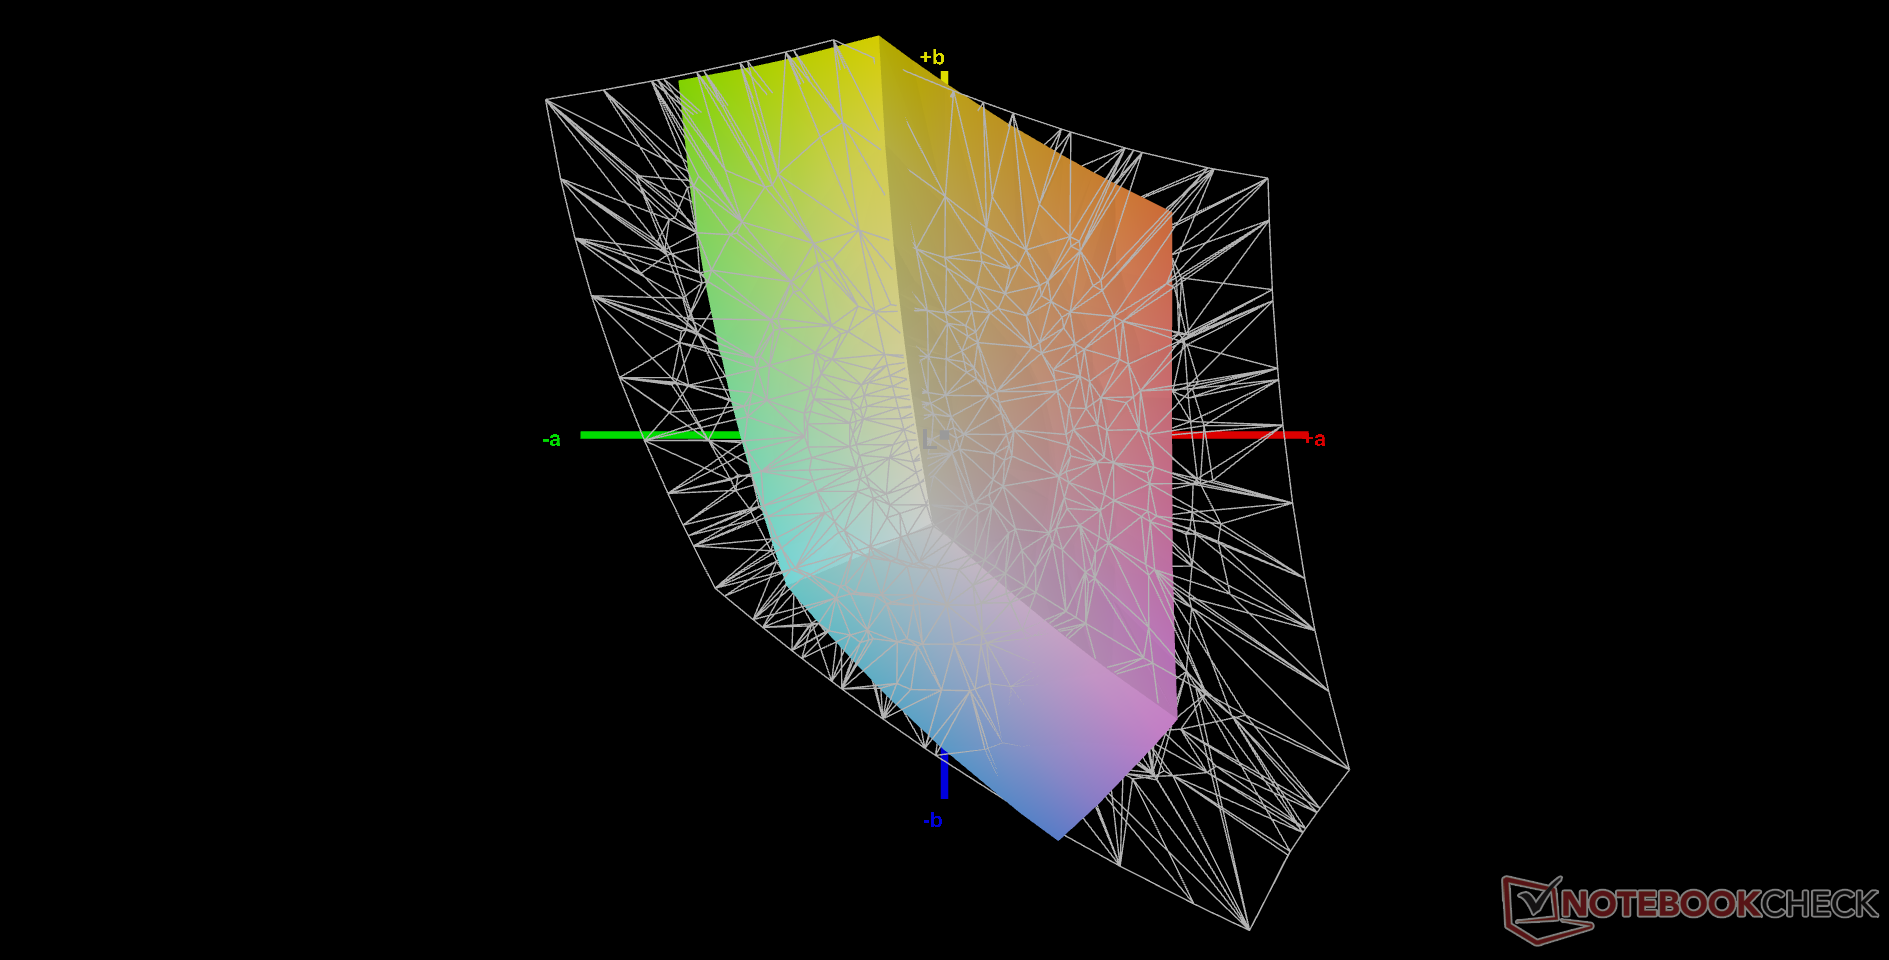
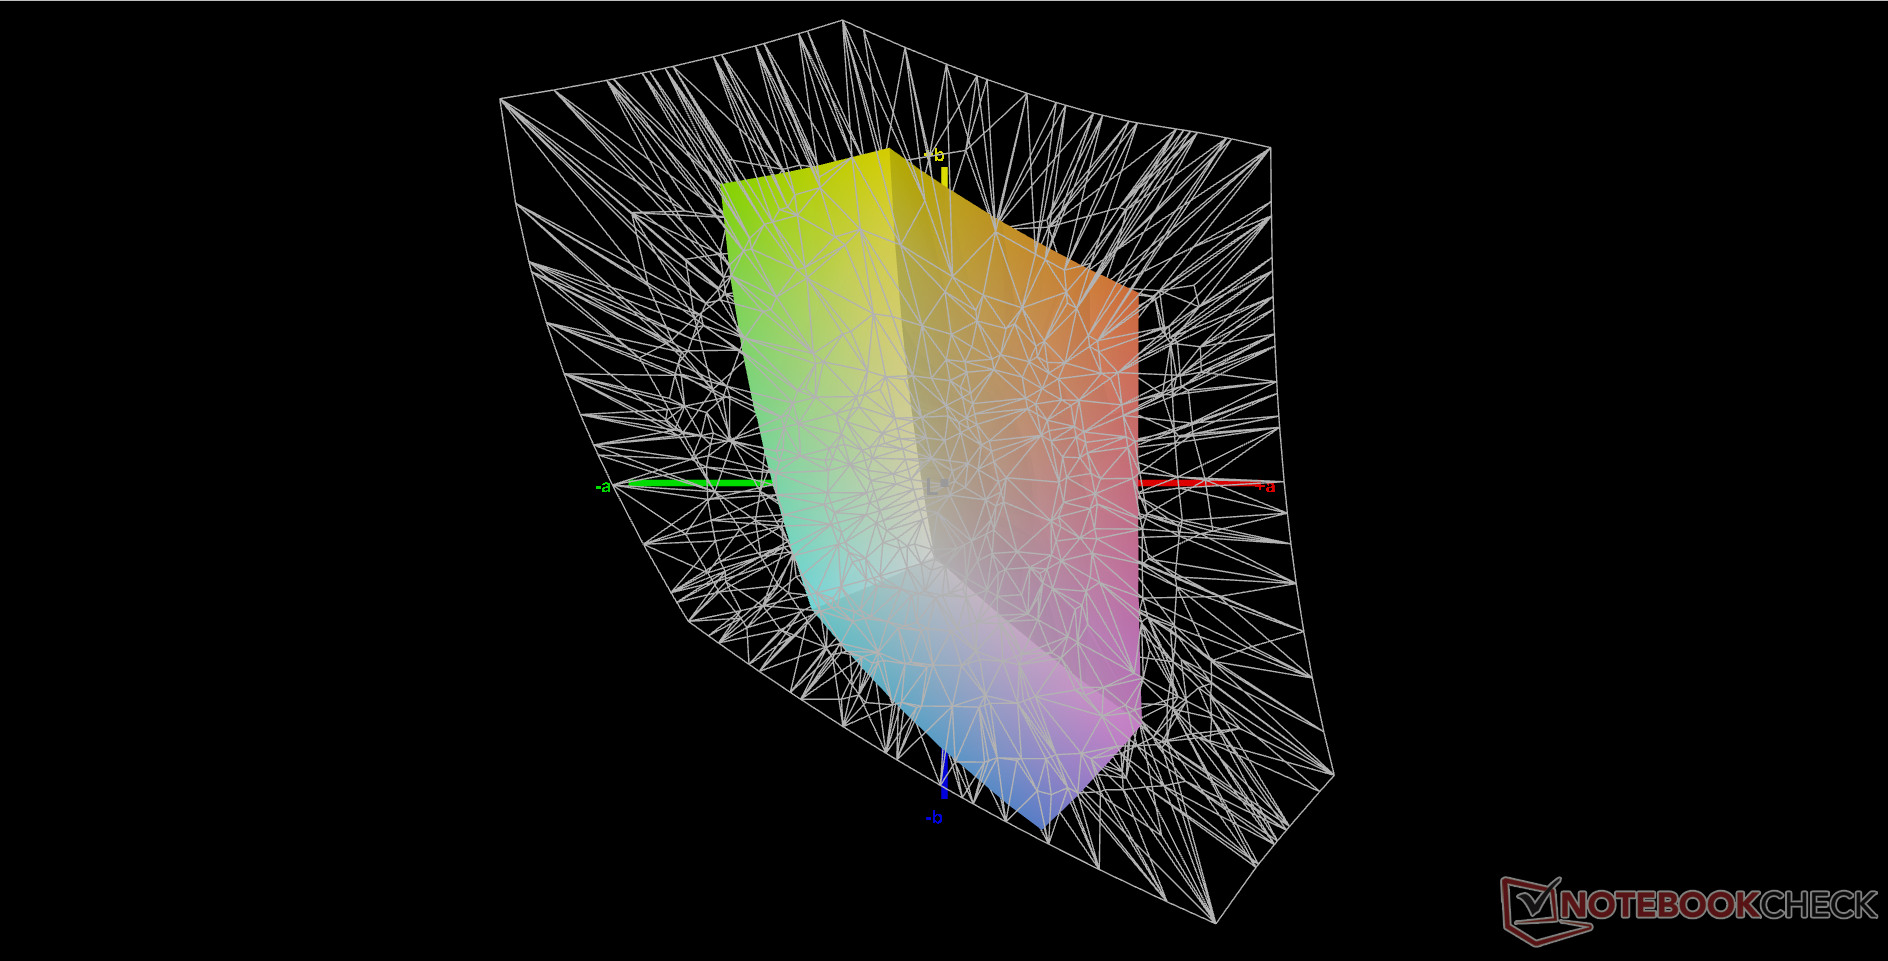
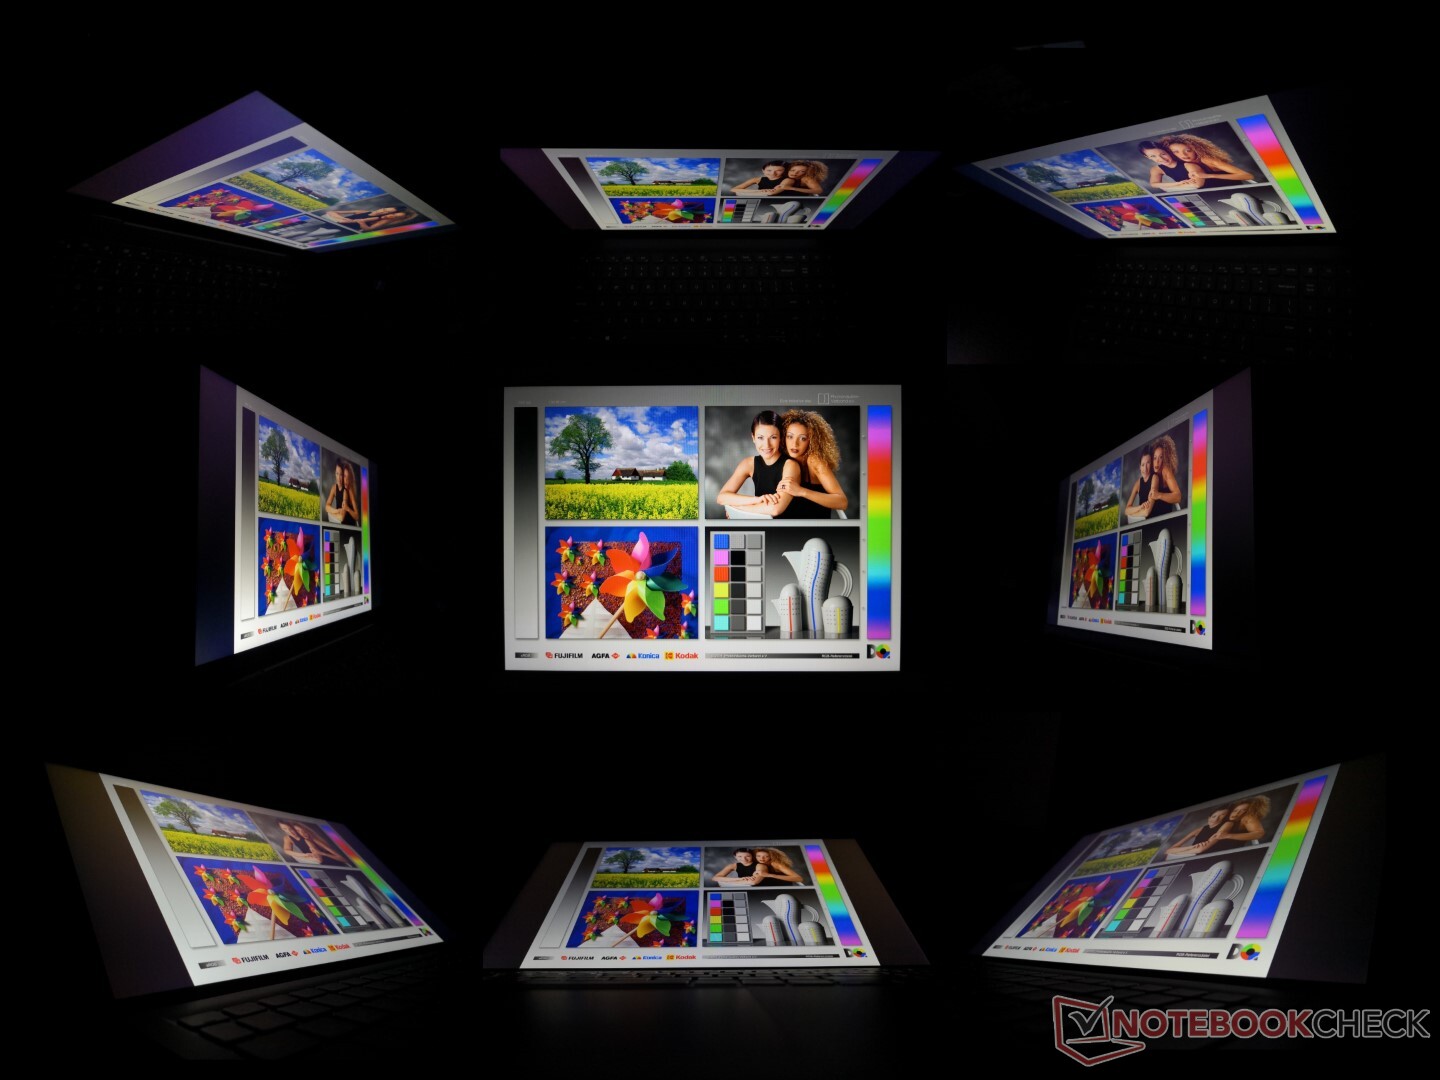
O Inspiron 15 3511 utiliza um painel BOE diferente daquele encontrado no Inspiron 15 3501 mais antigo (BOE NV15T06 vs. BOE NV15N3D). Apesar disso, os atributos principais não sofreram alterações, incluindo o espaço de cor muito estreito. A relação de contraste e os tempos de resposta são na verdade bastante decentes para um laptop de baixo custo, mas a limitada reprodução sRGB em particular é o que acaba por separar esta tela do Inspiron de uma alternativa XPS, Spectre, ou ZenBook mais cara. As cores parecem mais rasas e não tão vívidas, o que é o mesmo para a maioria dos laptops baratos.


| |||||||||||||||||||||||||
iluminação: 87 %
iluminação com acumulador: 206.8 cd/m²
Contraste: 1142:1 (Preto: 0.21 cd/m²)
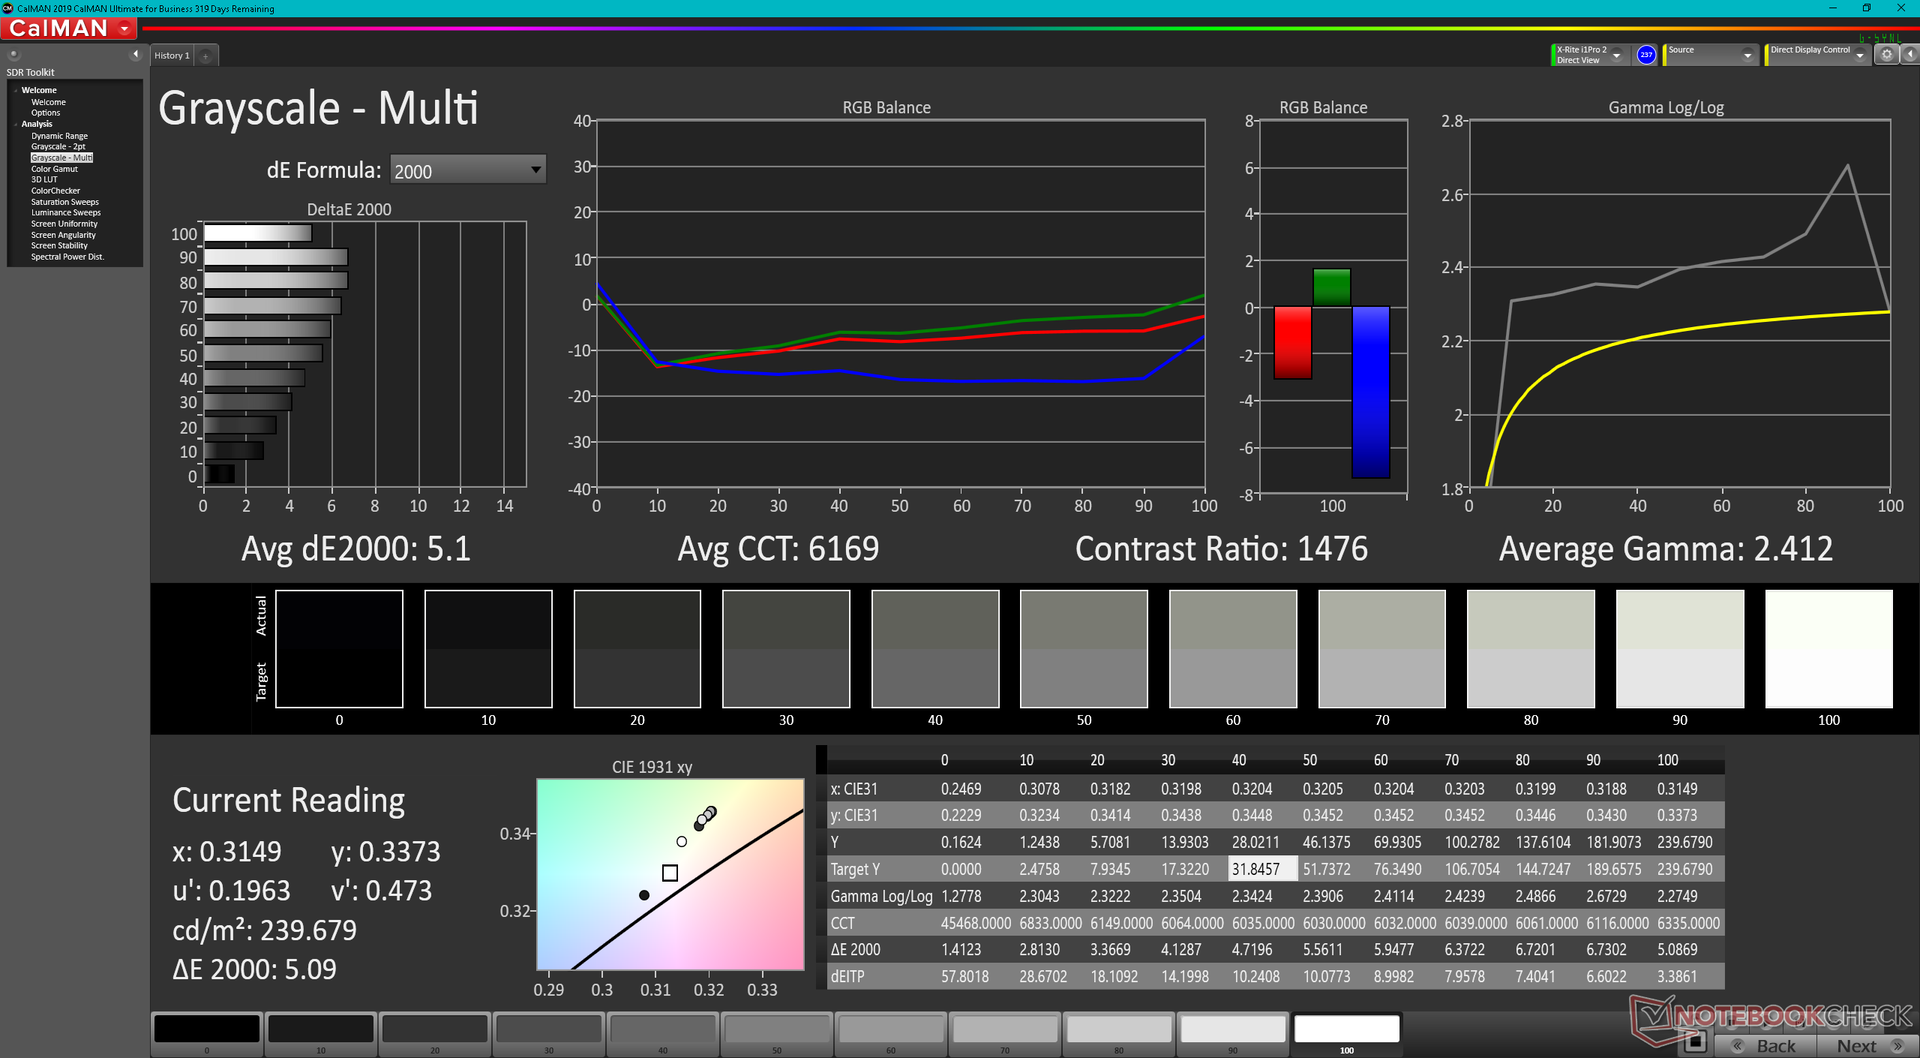
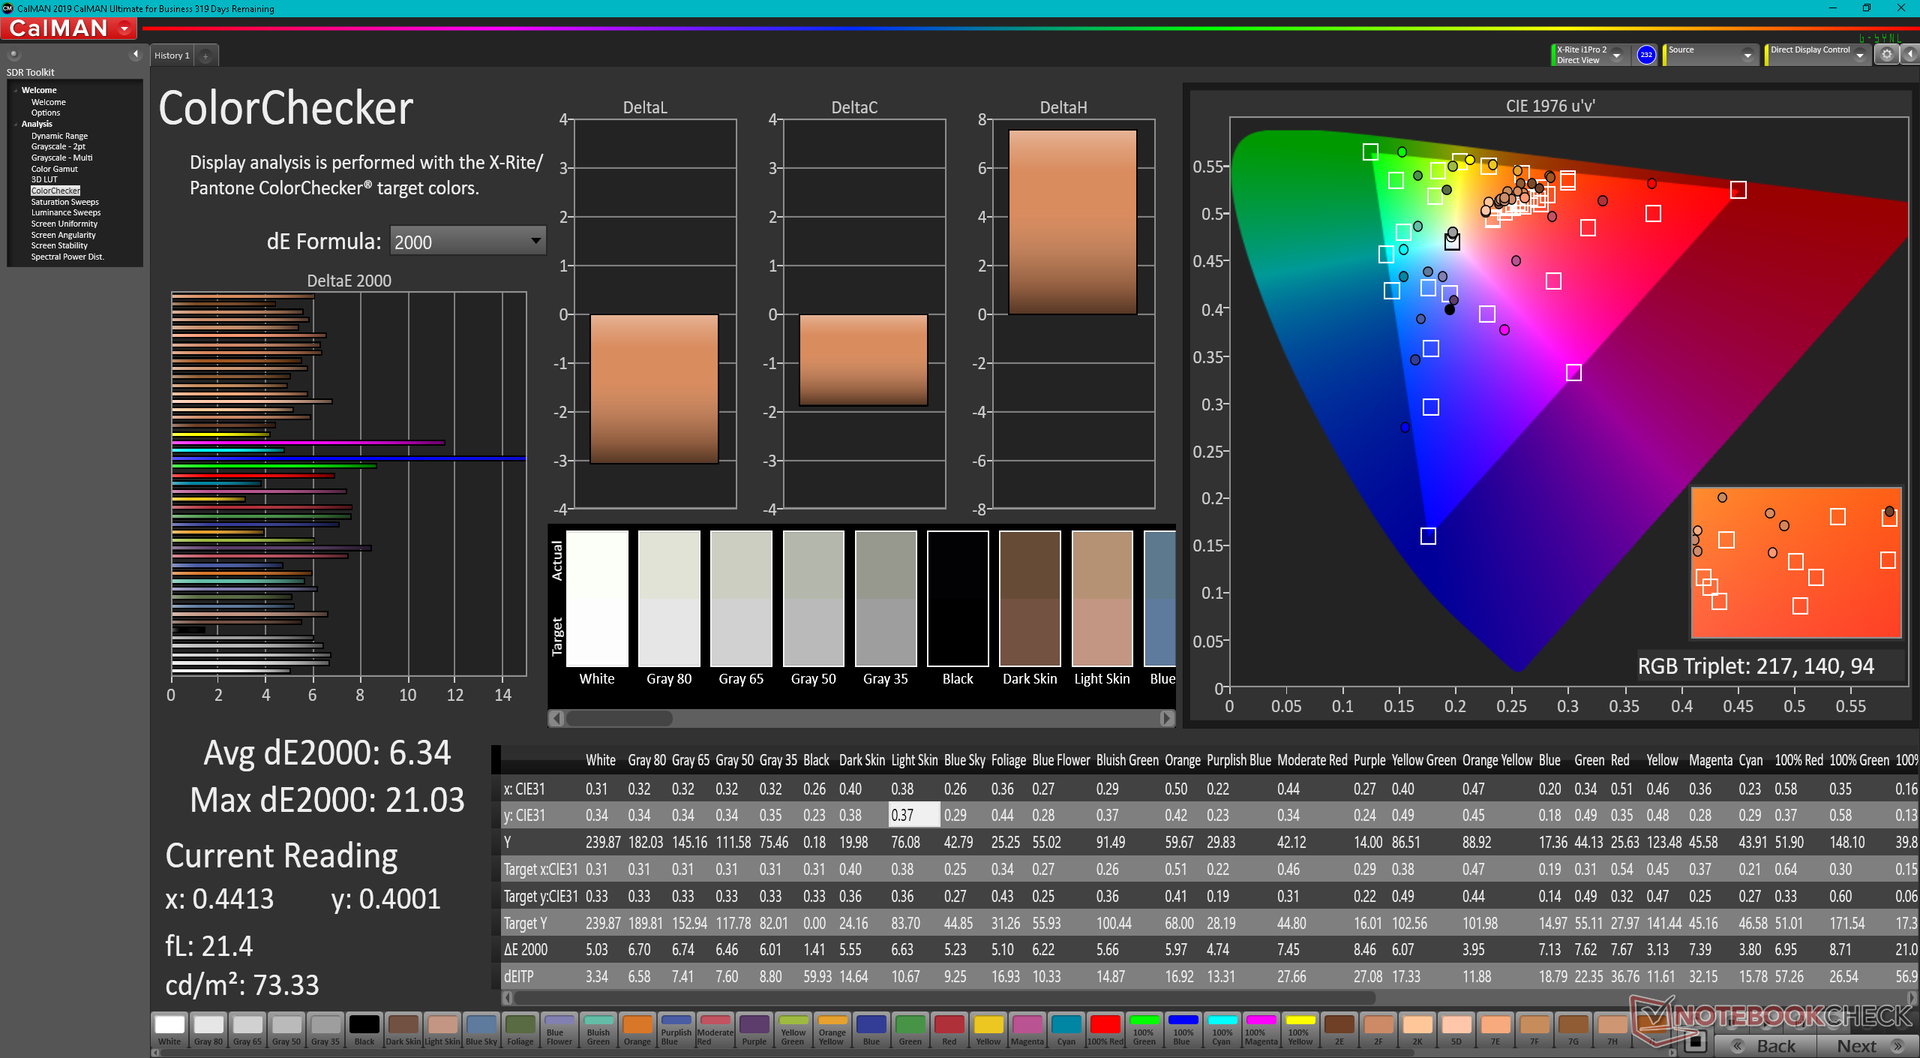
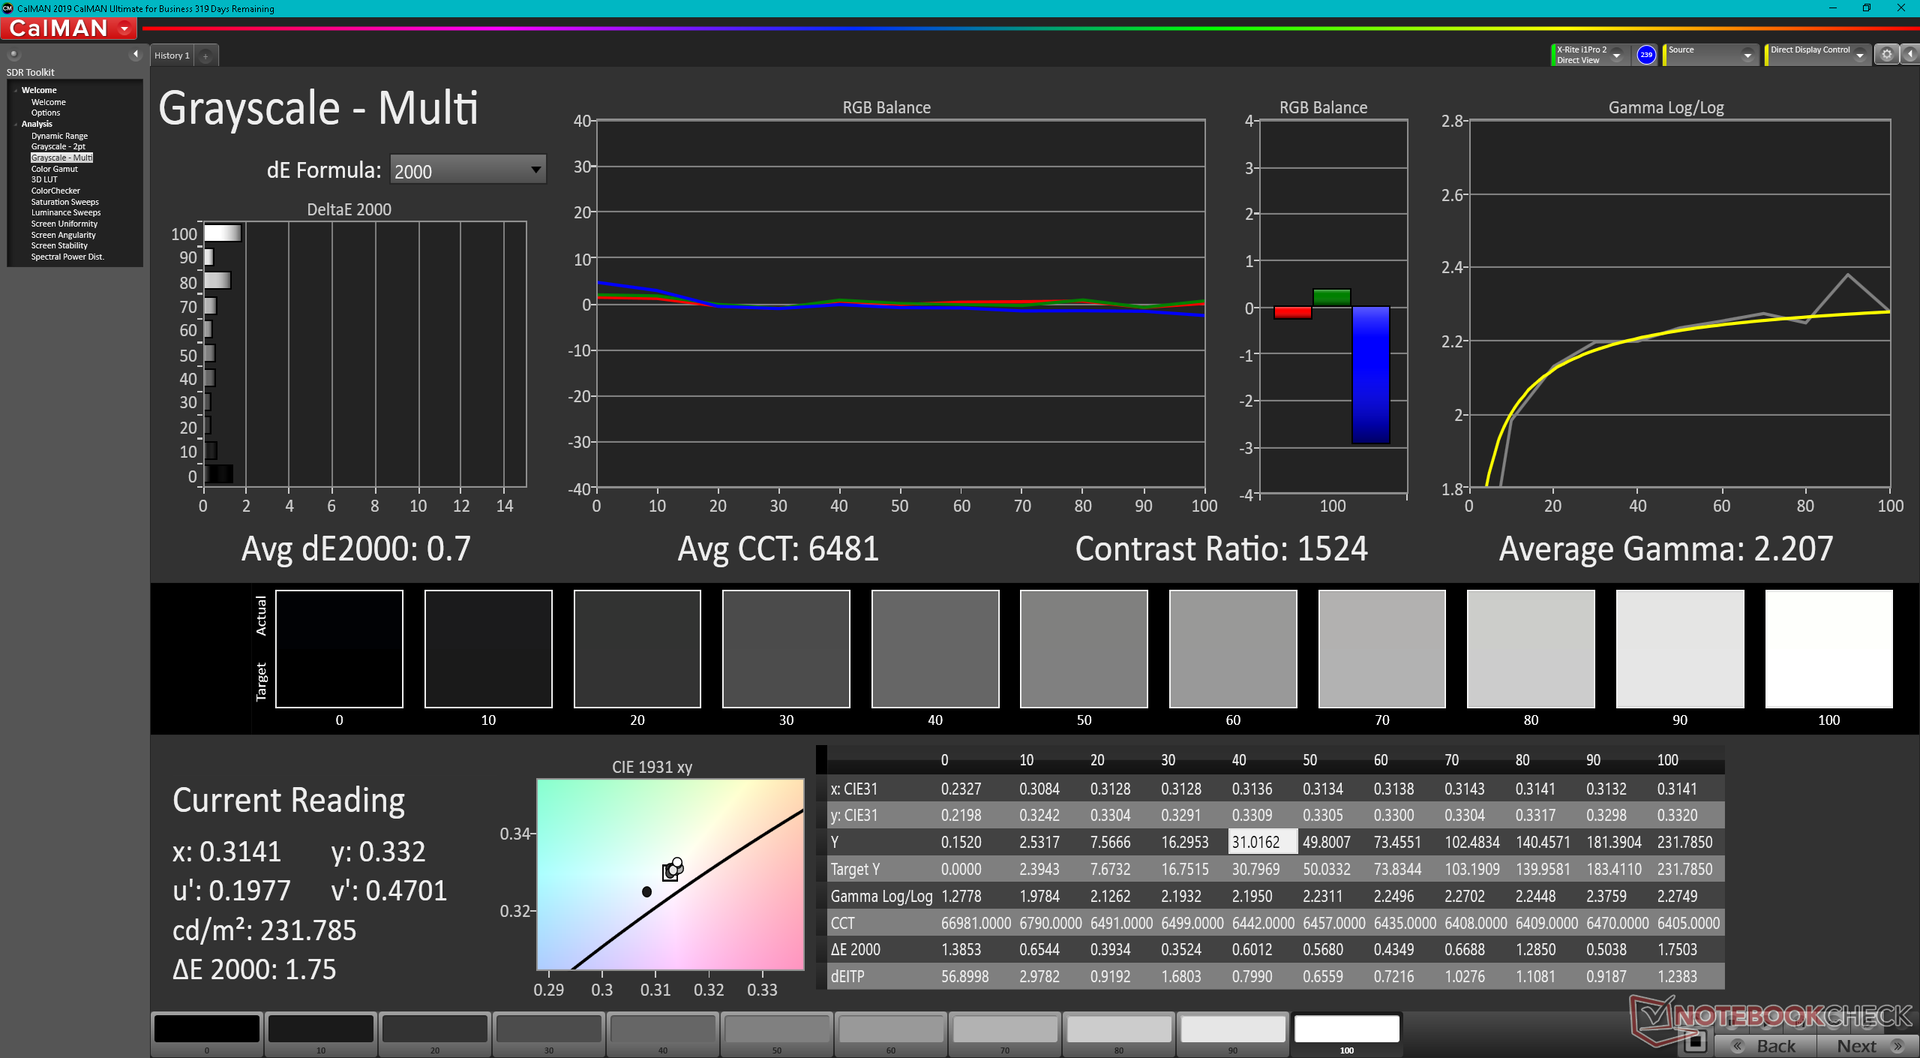
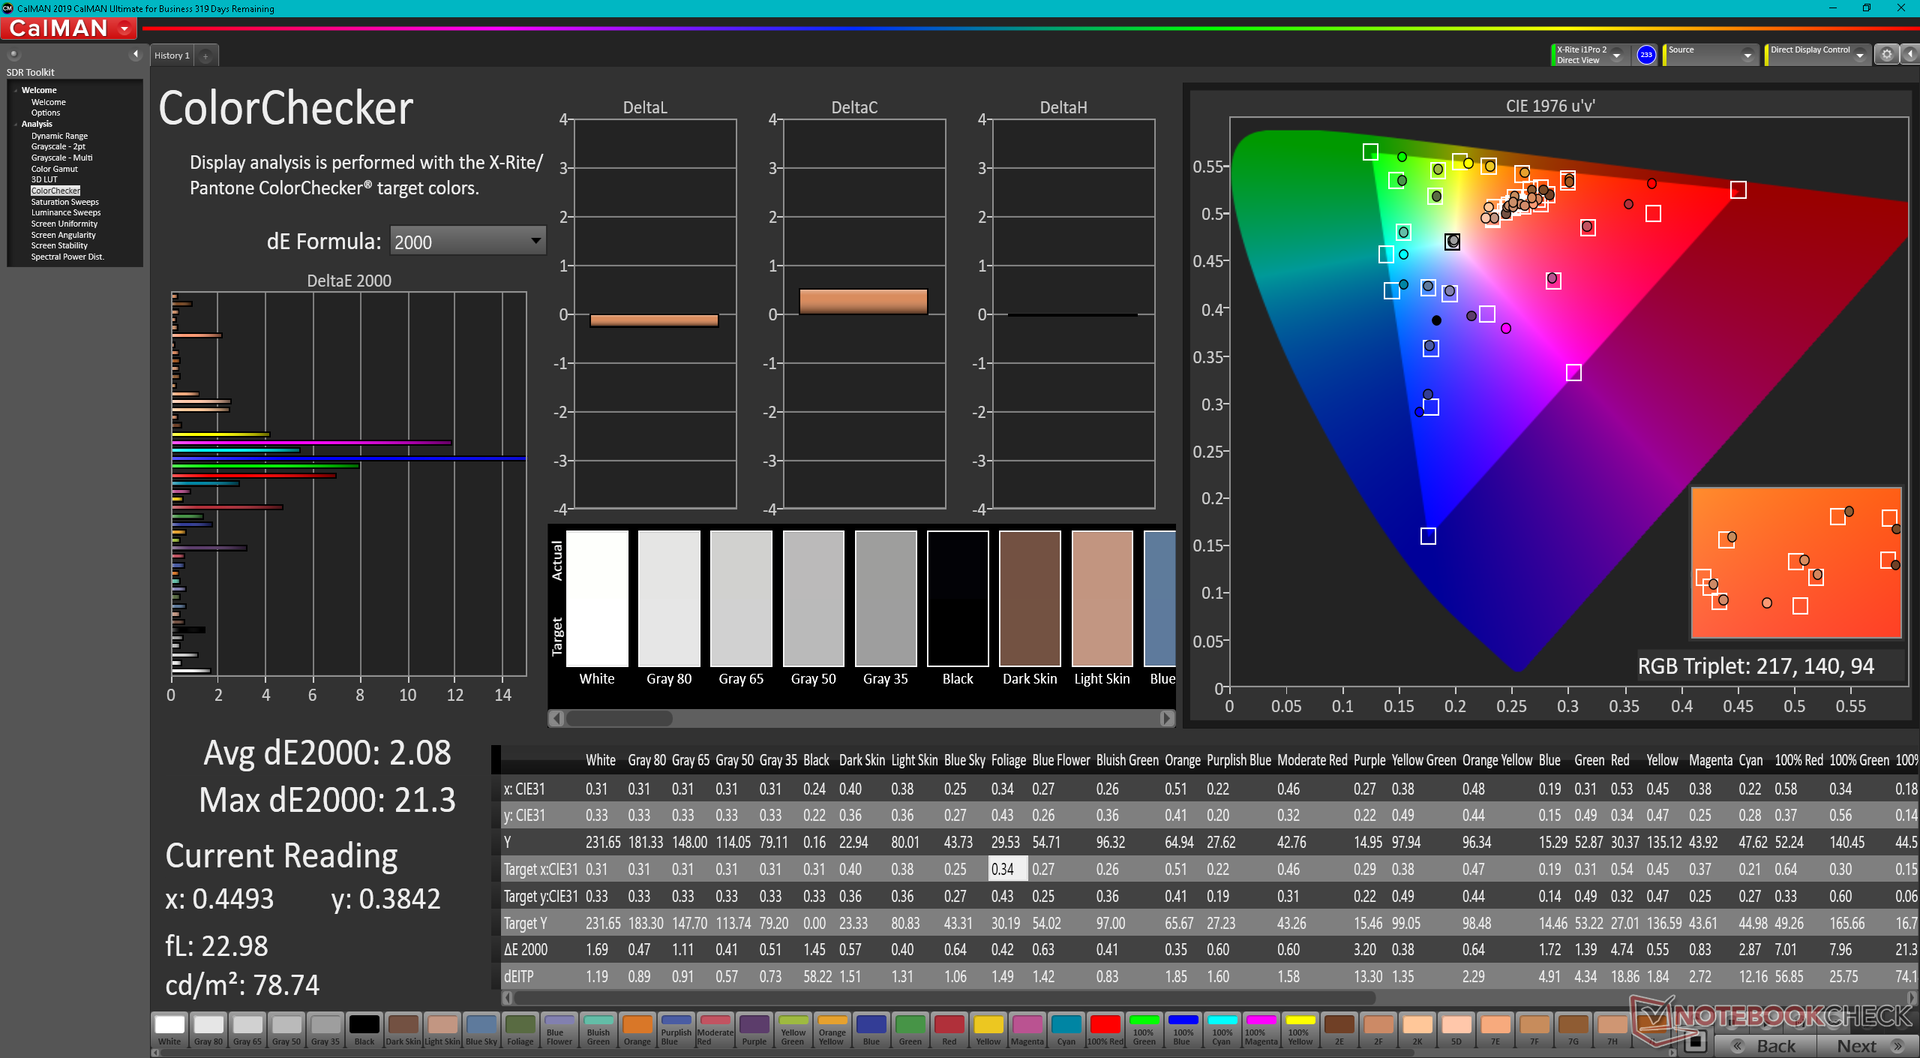
ΔE ColorChecker Calman: 6.34 | ∀{0.5-29.43 Ø4.73}
calibrated: 2.08
ΔE Greyscale Calman: 5.1 | ∀{0.09-98 Ø4.97}
41.5% AdobeRGB 1998 (Argyll 3D)
58.8% sRGB (Argyll 3D)
40.1% Display P3 (Argyll 3D)
Gamma: 2.41
CCT: 6169 K
| Dell Inspiron 15 3000 3511 BOE NV15T06, IPS, 1920x1080, 15.6" | Dell XPS 15 9510 i5 11400H FHD Sharp LQ156N1, IPS, 1920x1200, 15.6" | Asus VivoBook S15 D533UA Chi Mei N156HCA-EAB, IPS, 1920x1080, 15.6" | Dell Inspiron 15 3501 BOE NV15N3D (Dell P/N: N39X1), IPS, 1920x1080, 15.6" | Lenovo IdeaPad 3 15ALC6 BOE CQ NV156FHM-T07, IPS, 1920x1080, 15.6" | HP Pavilion 15-eg Chi Mei CMN1523, IPS, 1920x1080, 15.6" | |
|---|---|---|---|---|---|---|
| Display | 88% | 9% | -1% | -1% | 8% | |
| Display P3 Coverage (%) | 40.1 | 80.9 102% | 43.6 9% | 39.4 -2% | 40 0% | 42.9 7% |
| sRGB Coverage (%) | 58.8 | 100 70% | 65.2 11% | 58.7 0% | 57.7 -2% | 64 9% |
| AdobeRGB 1998 Coverage (%) | 41.5 | 79.1 91% | 45 8% | 40.7 -2% | 41.2 -1% | 44.4 7% |
| Response Times | -80% | 32% | -35% | 2% | 15% | |
| Response Time Grey 50% / Grey 80% * (ms) | 31.6 ? | 62.4 ? -97% | 18 ? 43% | 43 ? -36% | 24.8 ? 22% | 22.8 ? 28% |
| Response Time Black / White * (ms) | 24 ? | 38.8 ? -62% | 19 ? 21% | 32 ? -33% | 28.4 ? -18% | 23.6 ? 2% |
| PWM Frequency (Hz) | 1000 ? | 26320 ? | ||||
| Screen | 56% | -6% | 31% | 9% | 0% | |
| Brightness middle (cd/m²) | 239.9 | 632 163% | 289 20% | 271 13% | 336.4 40% | 294.3 23% |
| Brightness (cd/m²) | 230 | 606 163% | 267 16% | 263 14% | 318 38% | 251 9% |
| Brightness Distribution (%) | 87 | 91 5% | 85 -2% | 92 6% | 84 -3% | 76 -13% |
| Black Level * (cd/m²) | 0.21 | 0.29 -38% | 0.56 -167% | 0.15 29% | 0.24 -14% | 0.26 -24% |
| Contrast (:1) | 1142 | 2179 91% | 516 -55% | 1807 58% | 1402 23% | 1132 -1% |
| Colorchecker dE 2000 * | 6.34 | 3.5 45% | 3.96 38% | 4.83 24% | 6.46 -2% | 4.08 36% |
| Colorchecker dE 2000 max. * | 21.03 | 6.4 70% | 6.76 68% | 7 67% | 19.75 6% | 19.49 7% |
| Colorchecker dE 2000 calibrated * | 2.08 | 2 4% | 2.09 -0% | 3.7 -78% | ||
| Greyscale dE 2000 * | 5.1 | 5 2% | 3.43 33% | 3.36 34% | 5.6 -10% | 3 41% |
| Gamma | 2.41 91% | 2.26 97% | 2.28 96% | 2.56 86% | 2.25 98% | 2.21 100% |
| CCT | 6169 105% | 7033 92% | 7191 90% | 6764 96% | 5934 110% | 6616 98% |
| Color Space (Percent of AdobeRGB 1998) (%) | 42 | |||||
| Color Space (Percent of sRGB) (%) | 65 | |||||
| Média Total (Programa/Configurações) | 21% /
44% | 12% /
3% | -2% /
13% | 3% /
6% | 8% /
4% |
* ... menor é melhor
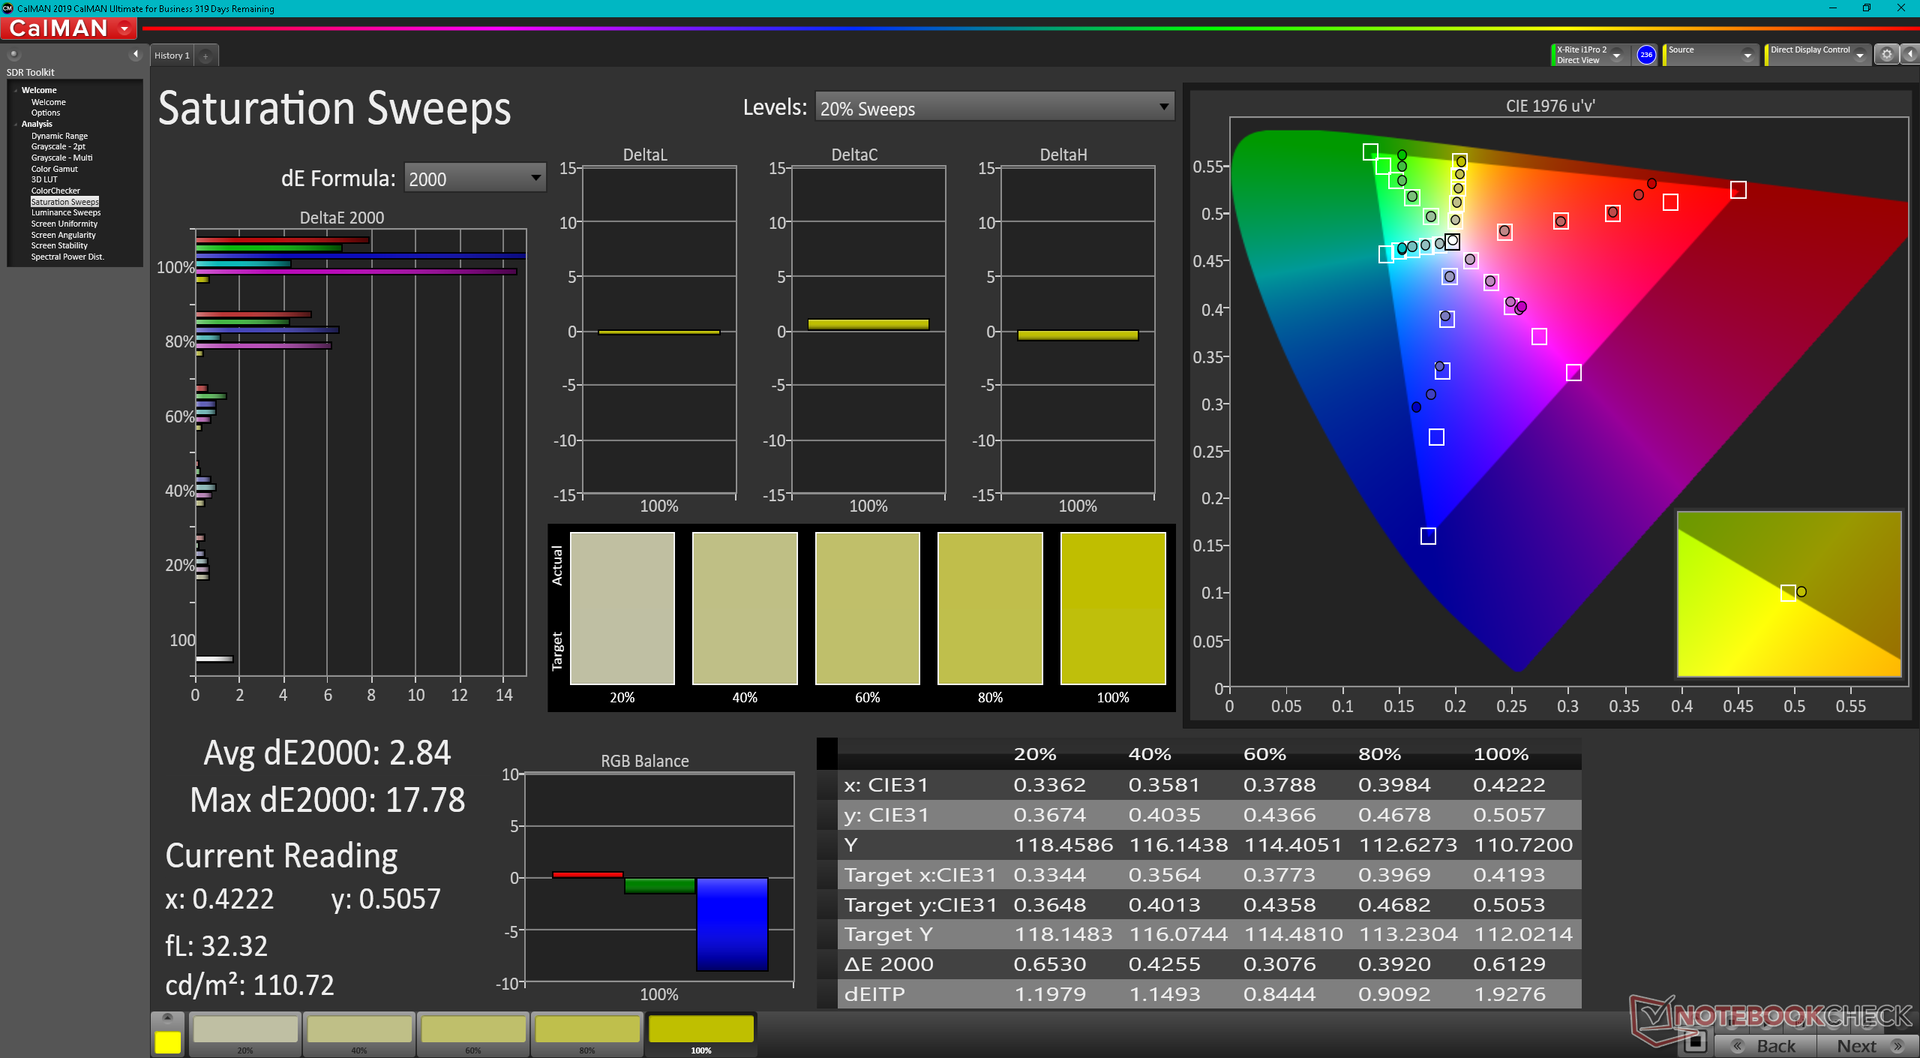
O espaço de cor é limitado a apenas 59 por cento do sRGB em comparação com >90 por cento em alternativas mais caras como o XPS 15. A gama estreita é esperada em laptops de orçamento como o nosso Inspiron 15
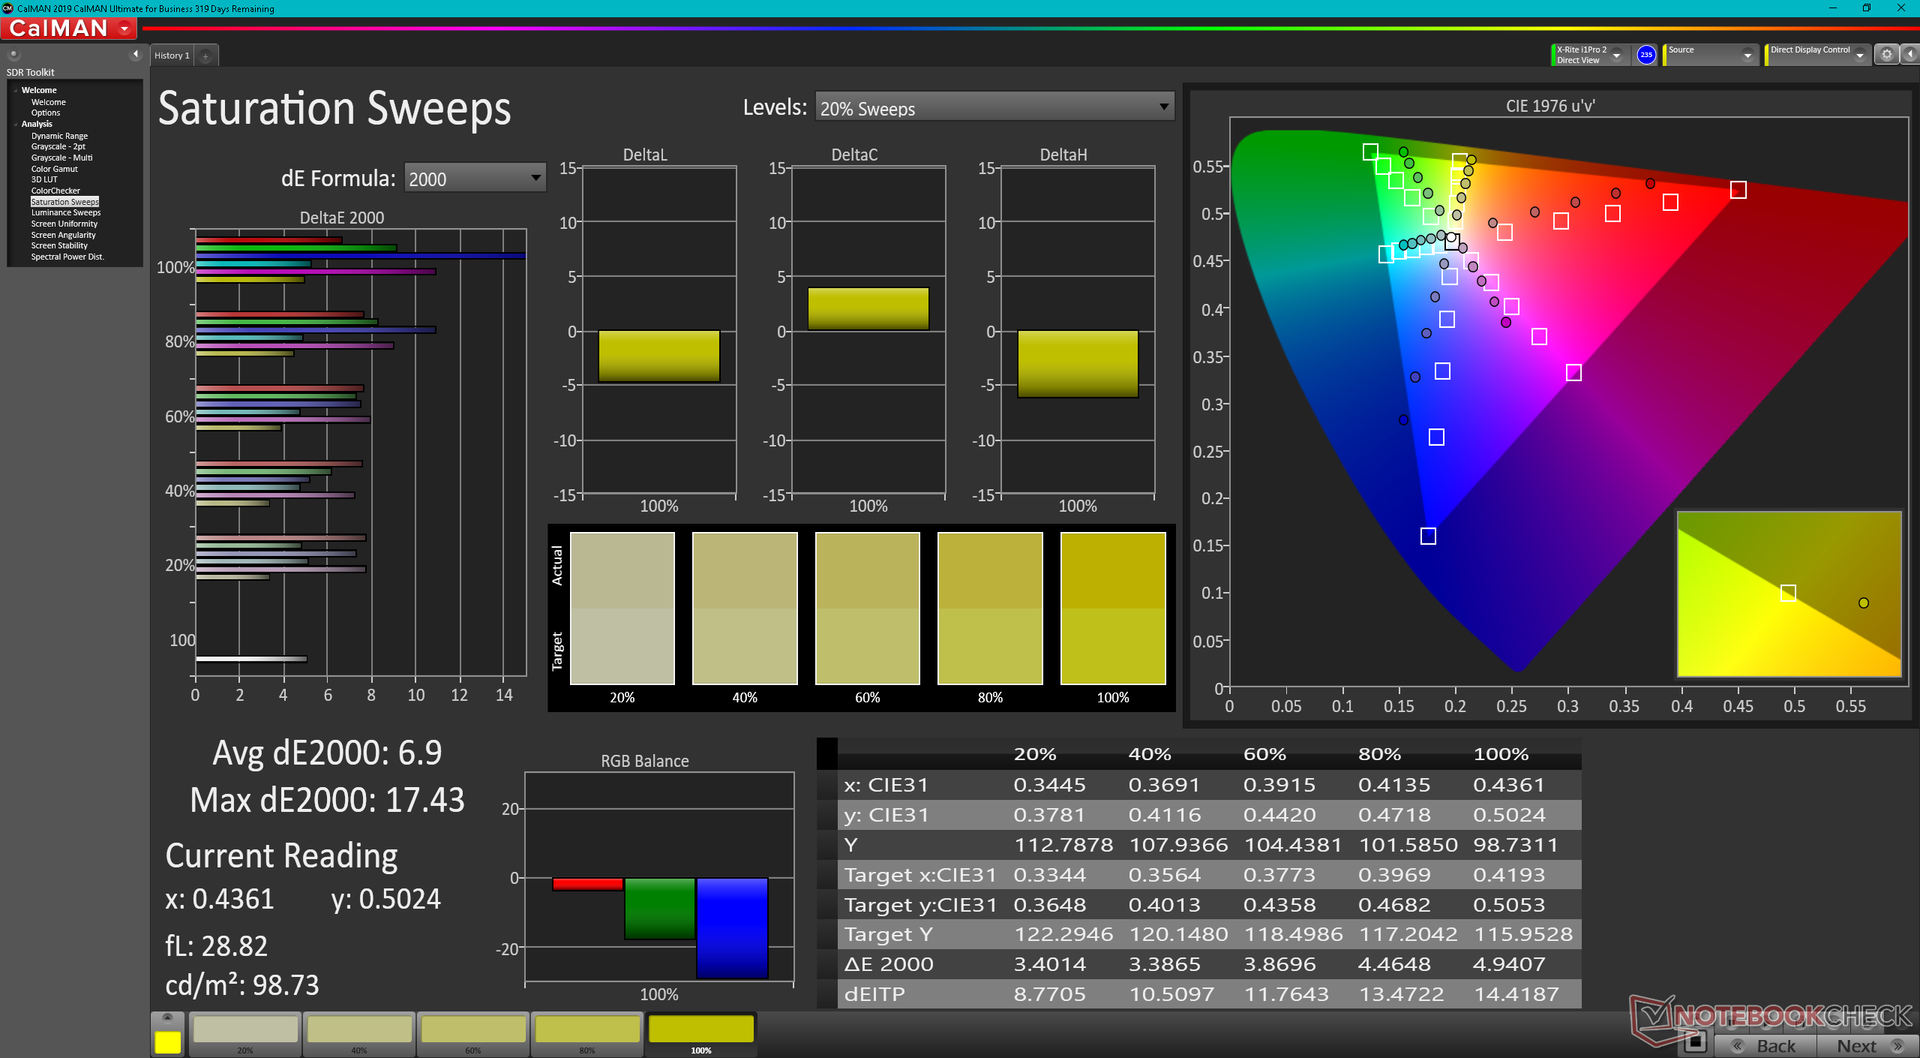
A temperatura de cor é um pouco quente demais para fora da caixa, que nosso colorímetro X-Rite é capaz de endereçar. Uma vez calibrados, os valores médios de escala de cinza e DeltaE de cor cairiam de 5,1 e 6,34 para apenas 0,7 e 2,08, respectivamente. No entanto, a má reprodução de cores mencionada acima significa que o deltaE inevitavelmente aumentará significativamente em níveis de saturação mais elevados
Exibir tempos de resposta
| ↔ Tempo de resposta preto para branco | ||
|---|---|---|
| 24 ms ... ascensão ↗ e queda ↘ combinadas | ↗ 14 ms ascensão | 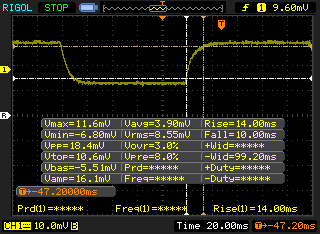 |
| ↘ 10 ms queda | ||
| A tela mostra boas taxas de resposta em nossos testes, mas pode ser muito lenta para jogadores competitivos. Em comparação, todos os dispositivos testados variam de 0.1 (mínimo) a 240 (máximo) ms. » 54 % de todos os dispositivos são melhores. Isso significa que o tempo de resposta medido é pior que a média de todos os dispositivos testados (19.9 ms). | ||
| ↔ Tempo de resposta 50% cinza a 80% cinza | ||
| 31.6 ms ... ascensão ↗ e queda ↘ combinadas | ↗ 17.2 ms ascensão | 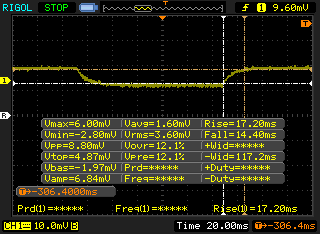 |
| ↘ 14.4 ms queda | ||
| A tela mostra taxas de resposta lentas em nossos testes e será insatisfatória para os jogadores. Em comparação, todos os dispositivos testados variam de 0.165 (mínimo) a 636 (máximo) ms. » 43 % de todos os dispositivos são melhores. Isso significa que o tempo de resposta medido é semelhante à média de todos os dispositivos testados (31.1 ms). | ||
Cintilação da tela / PWM (modulação por largura de pulso)
| Tela tremeluzindo / PWM não detectado | 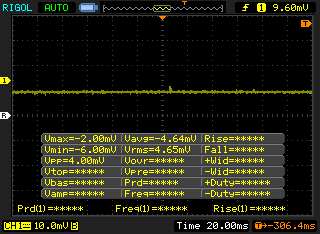 | ||
[pwm_comparison] Em comparação: 52 % de todos os dispositivos testados não usam PWM para escurecer a tela. Se PWM foi detectado, uma média de 7794 (mínimo: 5 - máximo: 343500) Hz foi medida. | |||
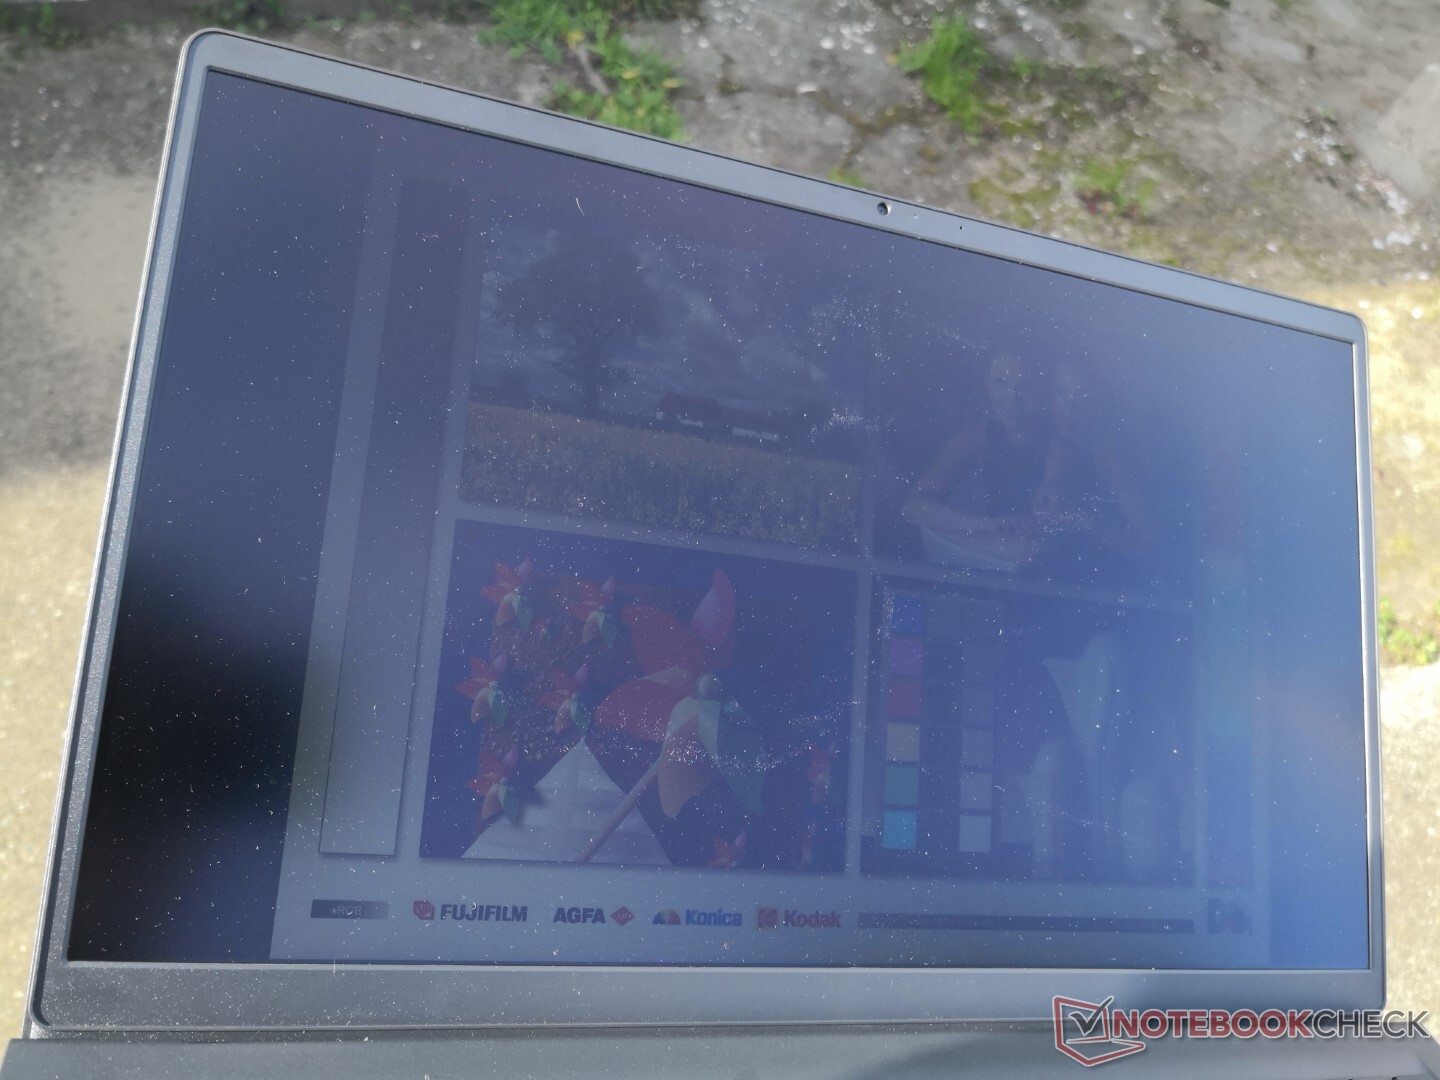
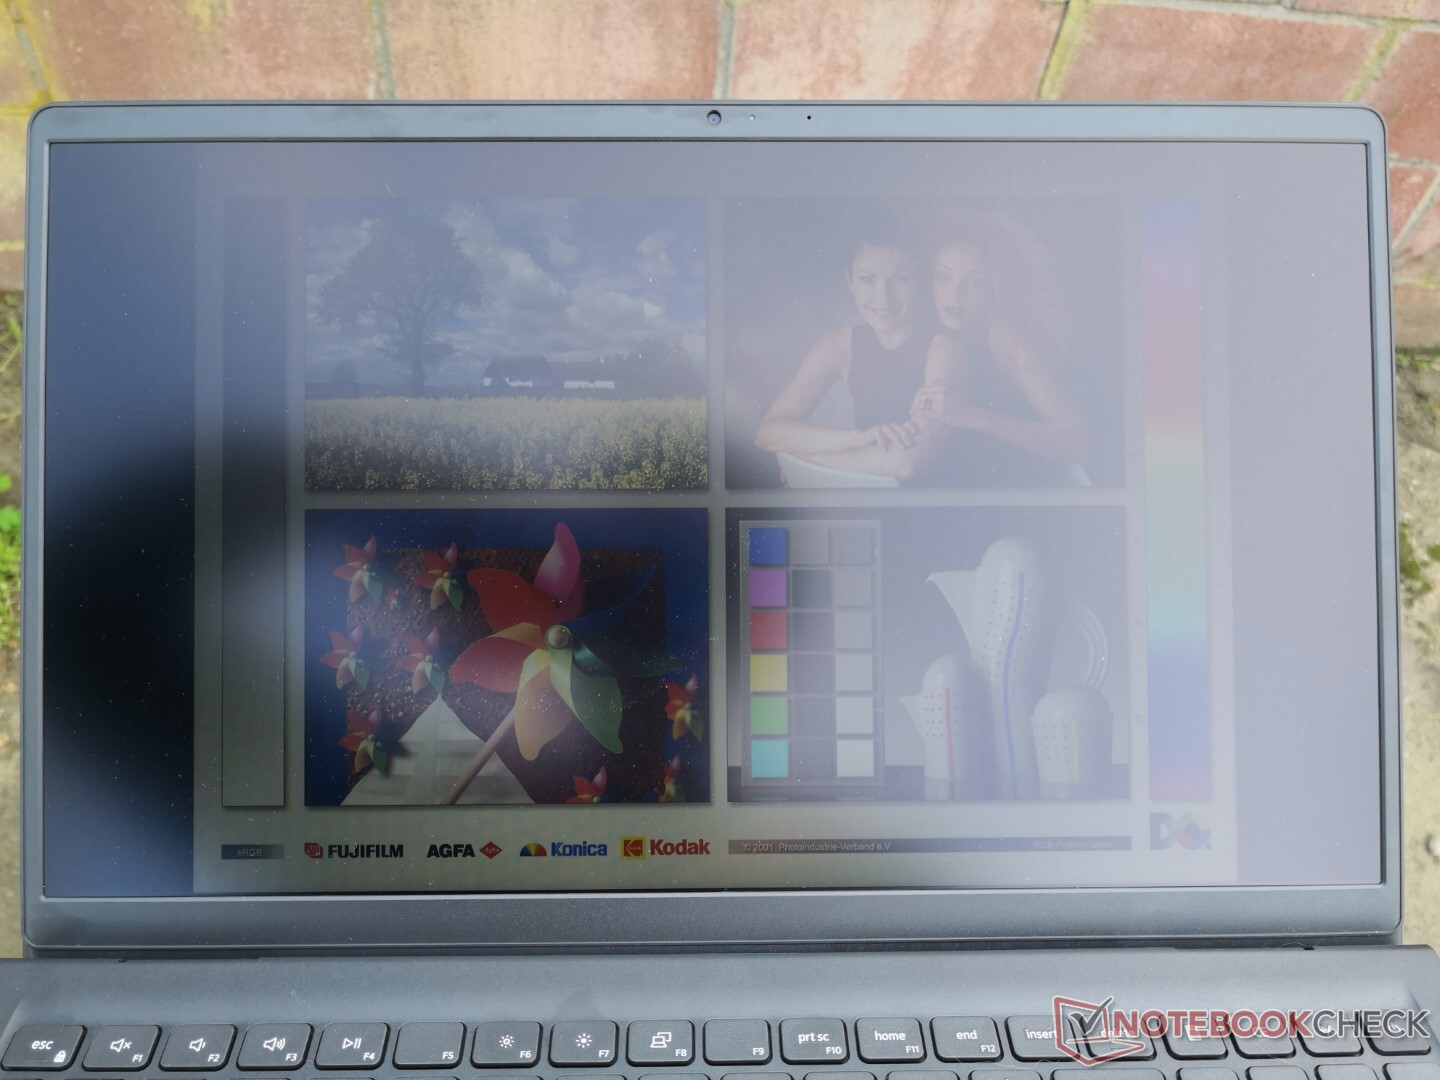
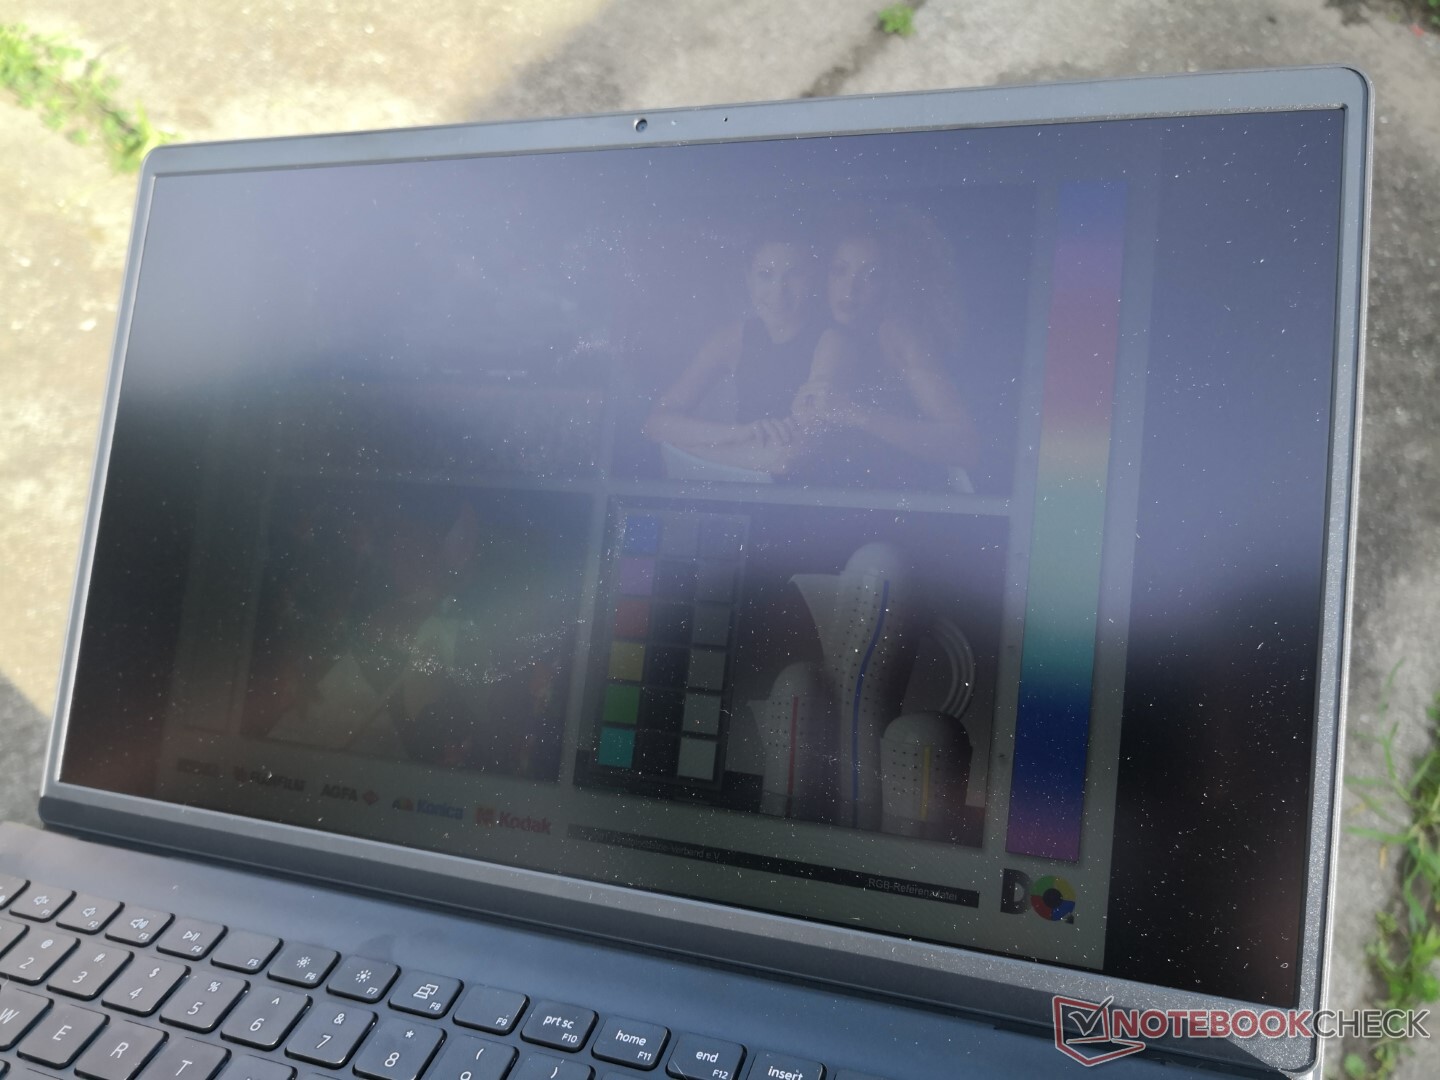
A visibilidade ao ar livre é fraca, mesmo trabalhando sob sombra. O brilho máximo cairia automaticamente de 240 lêndeas para apenas 207 lêndeas quando funcionando com bateria para fazer um display já com pouca luminosidade mesmo se nenhuma tomada CA estiver próxima. Não conseguimos encontrar a configuração apropriada da Dell, Windows ou Intel que seja responsável pelo controle automático da luminosidade da bateria
Desempenho
Condições de teste
Nossa unidade foi definida como Melhor Desempenho via Windows antes de executar qualquer benchmark de desempenho abaixo para obter as melhores pontuações possíveis.
Processador
O desempenho geral da CPU está dentro de apenas alguns pontos percentuais da média do laptop em nosso banco de dados equipado com o mesmo Núcleo i5-1135G7 processador. A sustentabilidade do desempenho também é boa, embora os benefícios iniciais do Turbo Boost sejam muito menores quando comparados a alternativas mais caras, como oAsus ExpertBook B1 B1500CEAE ouHonor MagicBook 15 como mostram nossos resultados do loop do CineBench R15 xT abaixo
Atualização para o Núcleo i7-1165G7 espera-se que aumentem o desempenho de rosca única e rosca múltipla em apenas 5% e 15%, respectivamente. Enquanto isso, a desclassificação para a Núcleo i3-1115G4 espera-se que a opção de multi-posição diminua o desempenho em quase 30 por cento.
Cinebench R15 Multi Loop
Cinebench R23: Multi Core | Single Core
Cinebench R15: CPU Multi 64Bit | CPU Single 64Bit
Blender: v2.79 BMW27 CPU
7-Zip 18.03: 7z b 4 | 7z b 4 -mmt1
Geekbench 5.5: Multi-Core | Single-Core
HWBOT x265 Benchmark v2.2: 4k Preset
LibreOffice : 20 Documents To PDF
R Benchmark 2.5: Overall mean
| Cinebench R23 / Multi Core | |
| Asus VivoBook S15 D533UA | |
| Lenovo ThinkPad L15 G2 AMD | |
| Lenovo IdeaPad 5 15ALC05 | |
| Samsung Galaxy Book Pro 15 NP950XDB-KC5US | |
| Média Intel Core i5-1135G7 (2786 - 6136, n=55) | |
| Dell Inspiron 15 3000 3511 | |
| Cinebench R23 / Single Core | |
| Samsung Galaxy Book Pro 15 NP950XDB-KC5US | |
| Lenovo ThinkPad L15 G2 AMD | |
| Dell Inspiron 15 3000 3511 | |
| Média Intel Core i5-1135G7 (1062 - 1373, n=53) | |
| Asus VivoBook S15 D533UA | |
| Lenovo IdeaPad 5 15ALC05 | |
| HWBOT x265 Benchmark v2.2 / 4k Preset | |
| Asus VivoBook S15 D533UA | |
| Lenovo ThinkPad L15 G2 AMD | |
| Lenovo IdeaPad 5 15ALC05 | |
| HP ProBook 455 G7-175W8EA | |
| Samsung Galaxy Book Pro 15 NP950XDB-KC5US | |
| Média Intel Core i5-1135G7 (3.57 - 7.6, n=57) | |
| Samsung Galaxy Book Flex 15-NP950 | |
| HP Envy x360 15-ee0257ng | |
| Dell Inspiron 15 3000 3511 | |
| HP 250 G7-15S40ES | |
* ... menor é melhor
AIDA64: FP32 Ray-Trace | FPU Julia | CPU SHA3 | CPU Queen | FPU SinJulia | FPU Mandel | CPU AES | CPU ZLib | FP64 Ray-Trace | CPU PhotoWorxx
| Performance rating | |
| Asus VivoBook S15 D533UA | |
| HP Pavilion 15-eg | |
| Média Intel Core i5-1135G7 | |
| Lenovo IdeaPad 3 15ALC6 | |
| Dell Inspiron 15 3501 | |
| Dell Inspiron 15 3000 3511 | |
| Dell XPS 15 9510 i5 11400H FHD -9! | |
| AIDA64 / FP32 Ray-Trace | |
| Asus VivoBook S15 D533UA | |
| Lenovo IdeaPad 3 15ALC6 | |
| Média Intel Core i5-1135G7 (4313 - 7952, n=45) | |
| HP Pavilion 15-eg | |
| Dell Inspiron 15 3501 | |
| Dell Inspiron 15 3000 3511 | |
| AIDA64 / FPU Julia | |
| Asus VivoBook S15 D533UA | |
| Lenovo IdeaPad 3 15ALC6 | |
| HP Pavilion 15-eg | |
| Média Intel Core i5-1135G7 (19402 - 32283, n=45) | |
| Dell Inspiron 15 3501 | |
| Dell Inspiron 15 3000 3511 | |
| AIDA64 / CPU SHA3 | |
| Asus VivoBook S15 D533UA | |
| HP Pavilion 15-eg | |
| Média Intel Core i5-1135G7 (1316 - 2172, n=45) | |
| Dell Inspiron 15 3000 3511 | |
| Dell Inspiron 15 3501 | |
| Lenovo IdeaPad 3 15ALC6 | |
| AIDA64 / CPU Queen | |
| Asus VivoBook S15 D533UA | |
| Lenovo IdeaPad 3 15ALC6 | |
| HP Pavilion 15-eg | |
| Dell Inspiron 15 3501 | |
| Dell Inspiron 15 3000 3511 | |
| Média Intel Core i5-1135G7 (39000 - 46951, n=45) | |
| AIDA64 / FPU SinJulia | |
| Asus VivoBook S15 D533UA | |
| Lenovo IdeaPad 3 15ALC6 | |
| HP Pavilion 15-eg | |
| Dell Inspiron 15 3501 | |
| Média Intel Core i5-1135G7 (3497 - 4445, n=45) | |
| Dell Inspiron 15 3000 3511 | |
| AIDA64 / FPU Mandel | |
| Asus VivoBook S15 D533UA | |
| Lenovo IdeaPad 3 15ALC6 | |
| HP Pavilion 15-eg | |
| Média Intel Core i5-1135G7 (12569 - 19635, n=45) | |
| Dell Inspiron 15 3501 | |
| Dell Inspiron 15 3000 3511 | |
| AIDA64 / CPU AES | |
| HP Pavilion 15-eg | |
| Dell Inspiron 15 3501 | |
| Asus VivoBook S15 D533UA | |
| Dell Inspiron 15 3000 3511 | |
| Média Intel Core i5-1135G7 (28988 - 67977, n=45) | |
| Lenovo IdeaPad 3 15ALC6 | |
| AIDA64 / CPU ZLib | |
| Asus VivoBook S15 D533UA | |
| Lenovo IdeaPad 3 15ALC6 | |
| Dell Inspiron 15 3000 3511 | |
| Dell Inspiron 15 3501 | |
| HP Pavilion 15-eg | |
| Média Intel Core i5-1135G7 (265 - 373, n=51) | |
| Dell XPS 15 9510 i5 11400H FHD | |
| AIDA64 / FP64 Ray-Trace | |
| Asus VivoBook S15 D533UA | |
| Lenovo IdeaPad 3 15ALC6 | |
| Dell Inspiron 15 3501 | |
| HP Pavilion 15-eg | |
| Média Intel Core i5-1135G7 (2226 - 4291, n=45) | |
| Dell Inspiron 15 3000 3511 | |
| AIDA64 / CPU PhotoWorxx | |
| HP Pavilion 15-eg | |
| Média Intel Core i5-1135G7 (9004 - 45366, n=45) | |
| Lenovo IdeaPad 3 15ALC6 | |
| Dell Inspiron 15 3501 | |
| Asus VivoBook S15 D533UA | |
| Dell Inspiron 15 3000 3511 | |
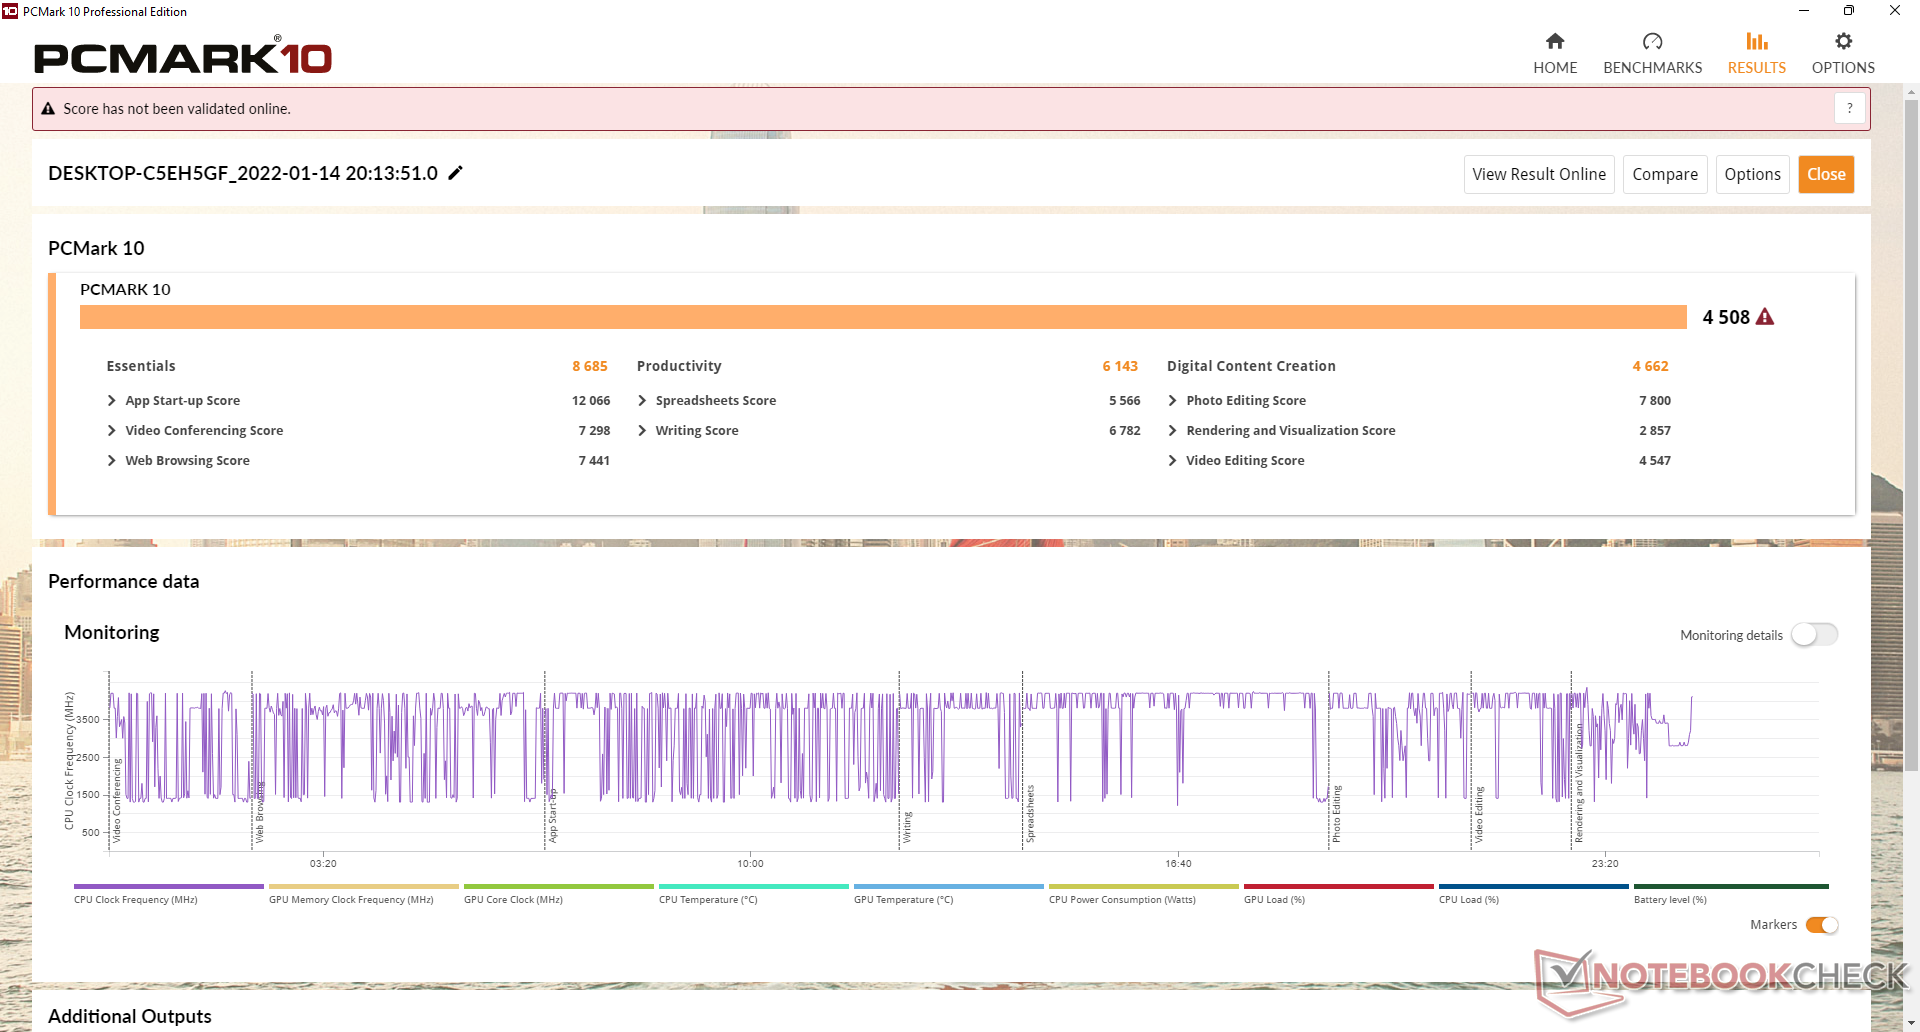
Desempenho do sistema
Os resultados da PCMark estão onde esperamos que sejam relativos a outros laptops com o mesmo processador e gráficos, apesar dos decepcionantes resultados da GPU mencionados abaixo. Assim, o sistema ainda se sente tão rápido como qualquer outro 11º gênero Core-U Ultrabook para cargas de trabalho não exigentes no dia-a-dia do escritório.
| PCMark 10 / Score | |
| HP Pavilion 15-eg | |
| Asus VivoBook S15 D533UA | |
| Lenovo IdeaPad 3 15ALC6 | |
| Dell Inspiron 15 3501 | |
| Média Intel Core i5-1135G7, Intel Iris Xe Graphics G7 80EUs (4026 - 4952, n=53) | |
| Dell Inspiron 15 3000 3511 | |
| Dell XPS 15 9510 i5 11400H FHD | |
| PCMark 10 / Essentials | |
| HP Pavilion 15-eg | |
| Dell Inspiron 15 3501 | |
| Dell XPS 15 9510 i5 11400H FHD | |
| Média Intel Core i5-1135G7, Intel Iris Xe Graphics G7 80EUs (8149 - 9917, n=53) | |
| Asus VivoBook S15 D533UA | |
| Lenovo IdeaPad 3 15ALC6 | |
| Dell Inspiron 15 3000 3511 | |
| PCMark 10 / Productivity | |
| HP Pavilion 15-eg | |
| Asus VivoBook S15 D533UA | |
| Lenovo IdeaPad 3 15ALC6 | |
| Dell Inspiron 15 3501 | |
| Dell XPS 15 9510 i5 11400H FHD | |
| Média Intel Core i5-1135G7, Intel Iris Xe Graphics G7 80EUs (5040 - 6619, n=53) | |
| Dell Inspiron 15 3000 3511 | |
| PCMark 10 / Digital Content Creation | |
| HP Pavilion 15-eg | |
| Asus VivoBook S15 D533UA | |
| Dell Inspiron 15 3501 | |
| Lenovo IdeaPad 3 15ALC6 | |
| Dell Inspiron 15 3000 3511 | |
| Média Intel Core i5-1135G7, Intel Iris Xe Graphics G7 80EUs (3548 - 5255, n=53) | |
| Dell XPS 15 9510 i5 11400H FHD | |
| PCMark 10 Score | 4508 pontos | |
Ajuda | ||
| AIDA64 / Memory Copy | |
| HP Pavilion 15-eg | |
| Média Intel Core i5-1135G7 (17443 - 63889, n=45) | |
| Asus VivoBook S15 D533UA | |
| Lenovo IdeaPad 3 15ALC6 | |
| Dell Inspiron 15 3501 | |
| Dell Inspiron 15 3000 3511 | |
| AIDA64 / Memory Read | |
| HP Pavilion 15-eg | |
| Asus VivoBook S15 D533UA | |
| Média Intel Core i5-1135G7 (19716 - 63705, n=45) | |
| Dell Inspiron 15 3501 | |
| Lenovo IdeaPad 3 15ALC6 | |
| Dell Inspiron 15 3000 3511 | |
| AIDA64 / Memory Write | |
| HP Pavilion 15-eg | |
| Média Intel Core i5-1135G7 (18722 - 66778, n=45) | |
| Asus VivoBook S15 D533UA | |
| Lenovo IdeaPad 3 15ALC6 | |
| Dell Inspiron 15 3501 | |
| Dell Inspiron 15 3000 3511 | |
| AIDA64 / Memory Latency | |
| Dell Inspiron 15 3000 3511 | |
| Lenovo IdeaPad 3 15ALC6 | |
| Asus VivoBook S15 D533UA | |
| Dell Inspiron 15 3501 | |
| Média Intel Core i5-1135G7 (68.3 - 107, n=51) | |
| HP Pavilion 15-eg | |
| Dell XPS 15 9510 i5 11400H FHD | |
* ... menor é melhor
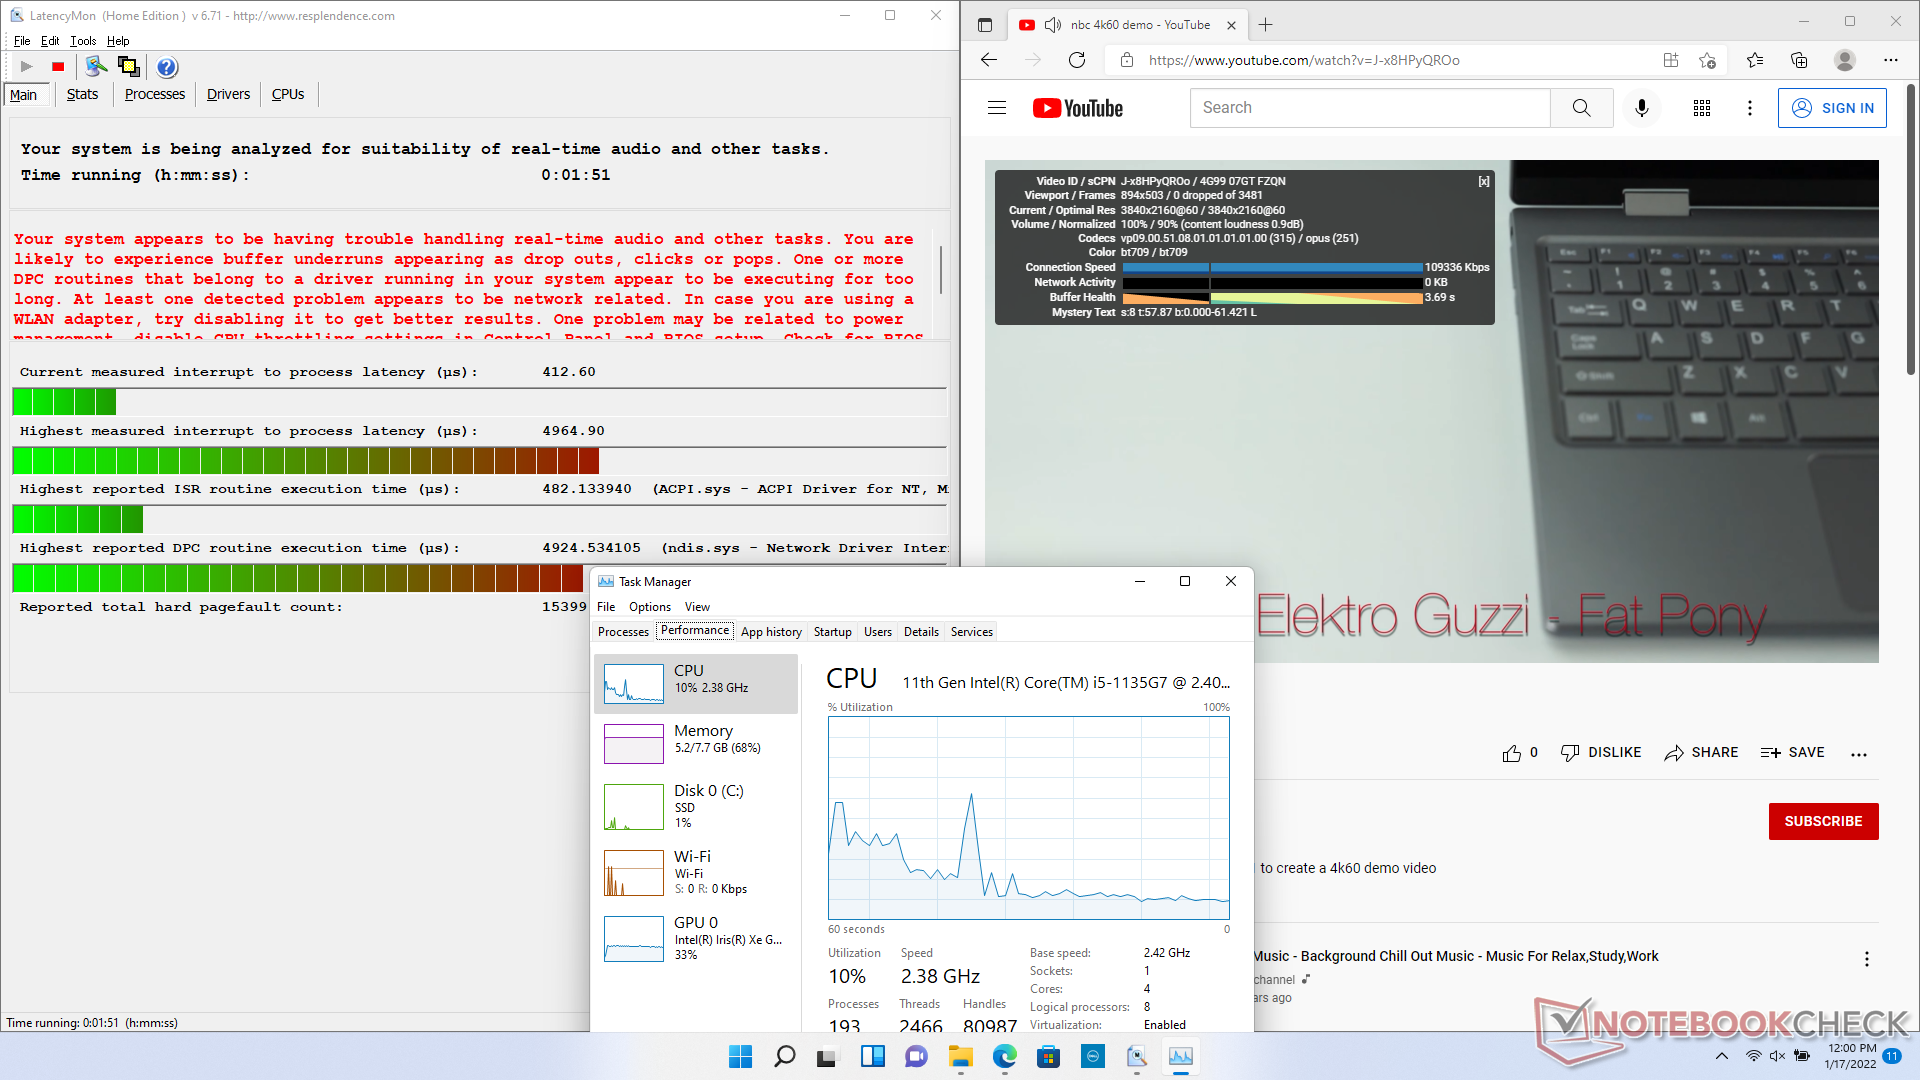
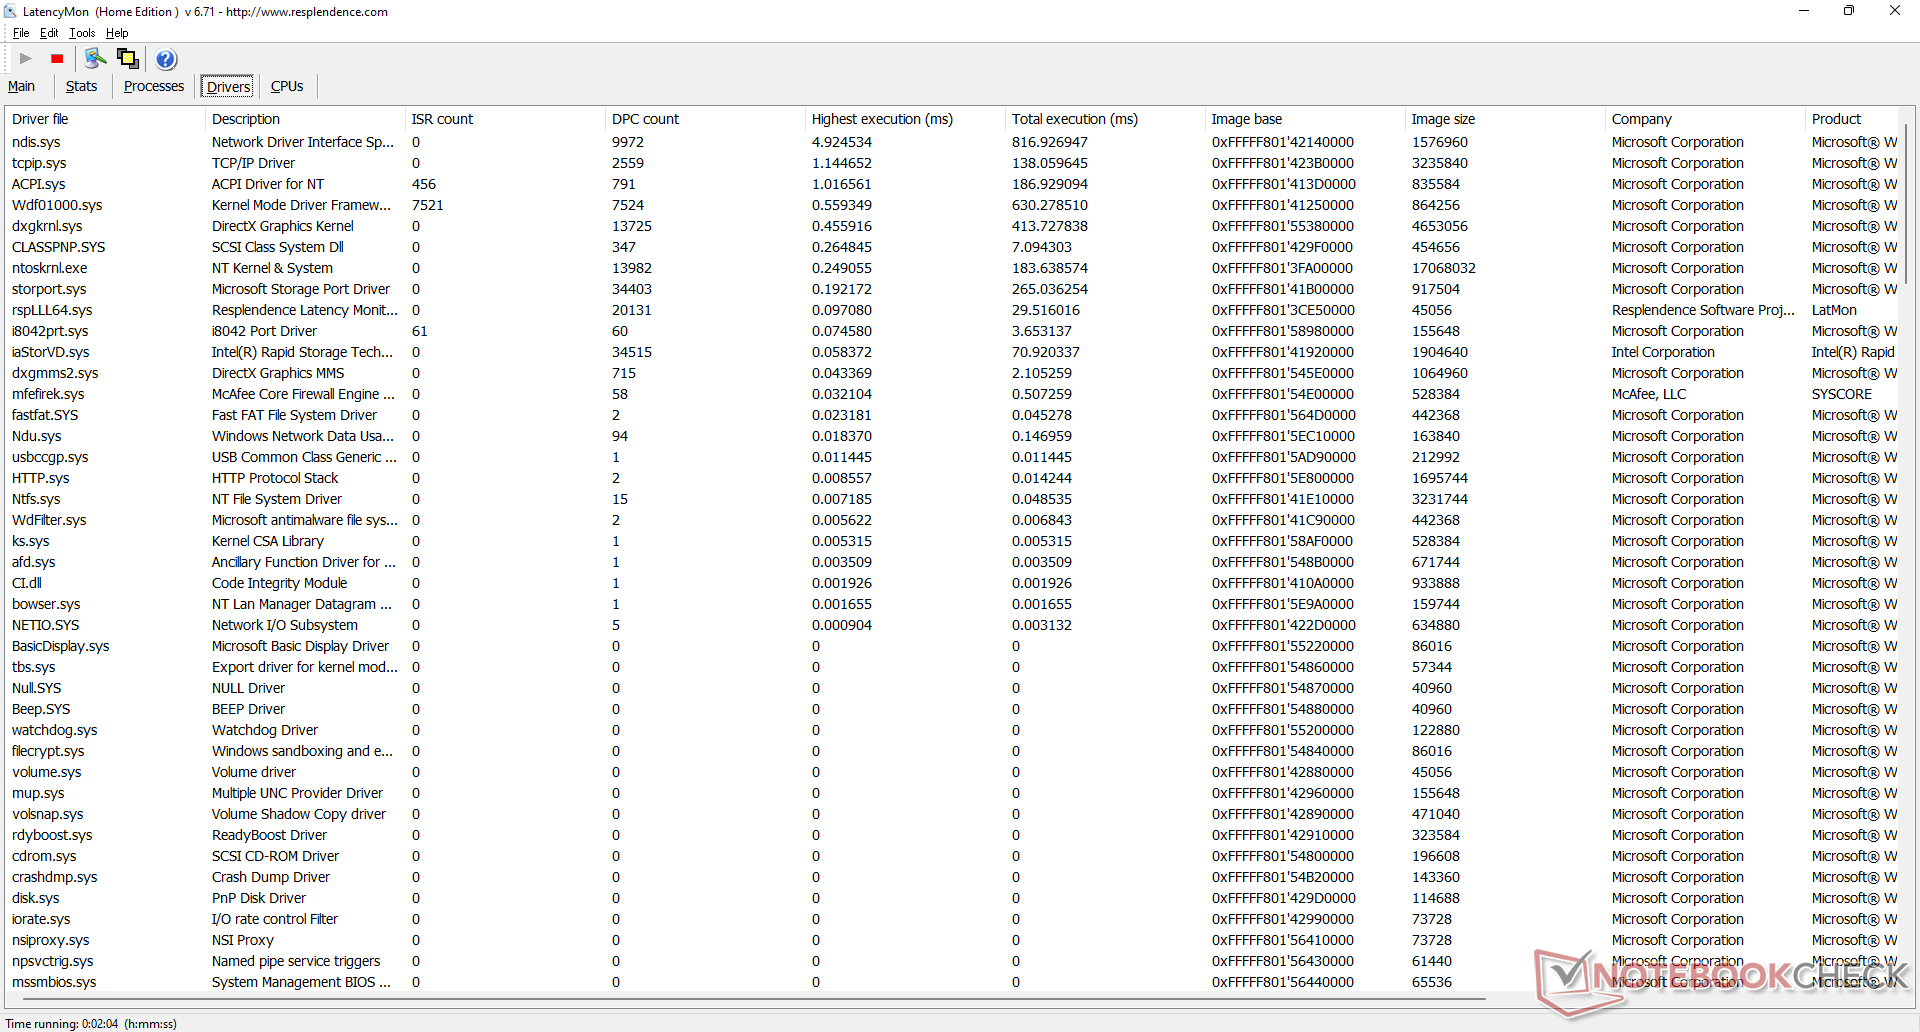
Latência do DPC
LatencyMon mostra os problemas de DPC ao abrir várias abas do navegador em nossa página inicial. a reprodução de vídeo de 4K a 60 FPS é, de outra forma, suave e sem qualquer queda de quadros.
| DPC Latencies / LatencyMon - interrupt to process latency (max), Web, Youtube, Prime95 | |
| Dell Inspiron 15 3000 3511 | |
| HP Pavilion 15-eg | |
| Dell XPS 15 9510 i5 11400H FHD | |
| Dell Inspiron 15 3501 | |
| Lenovo IdeaPad 3 15ALC6 | |
| Asus VivoBook S15 D533UA | |
* ... menor é melhor
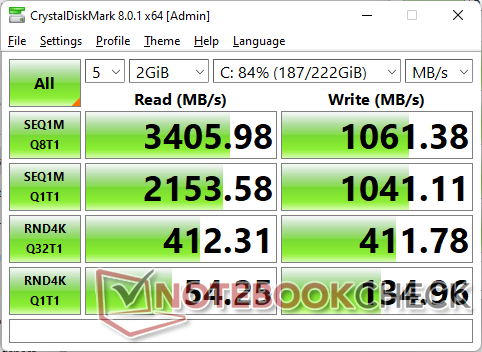
Dispositivos de armazenamento
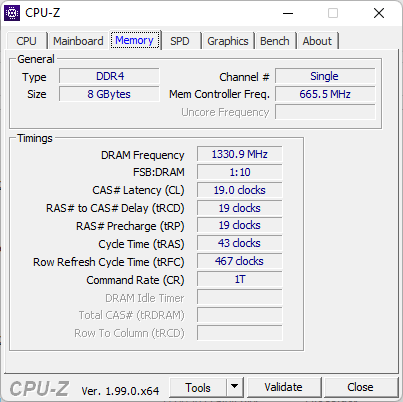
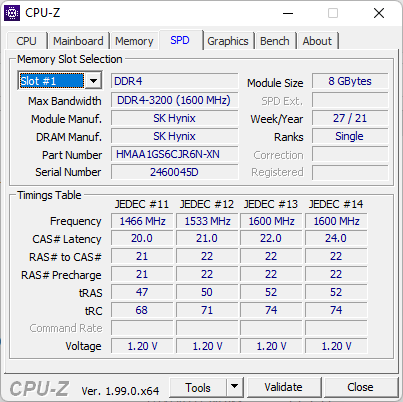
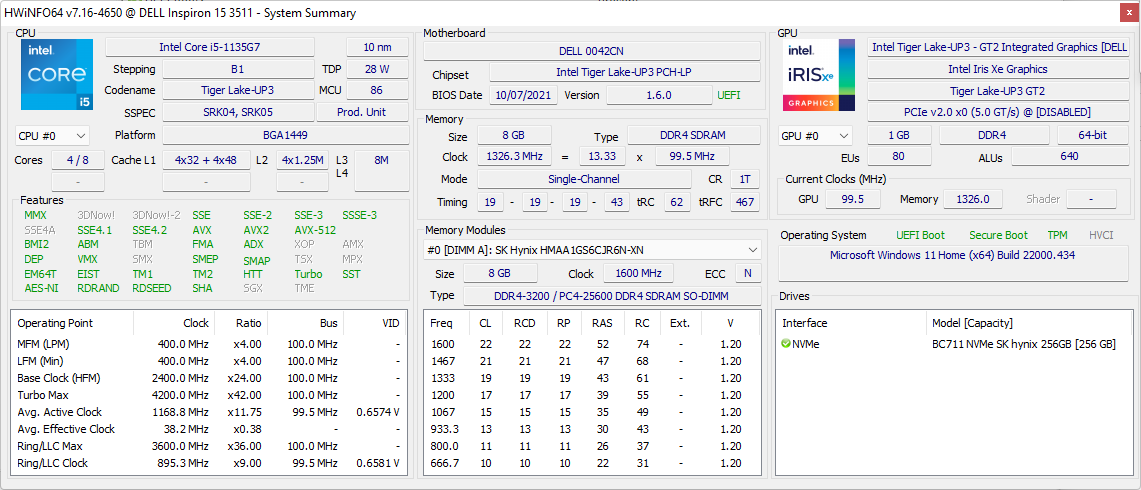
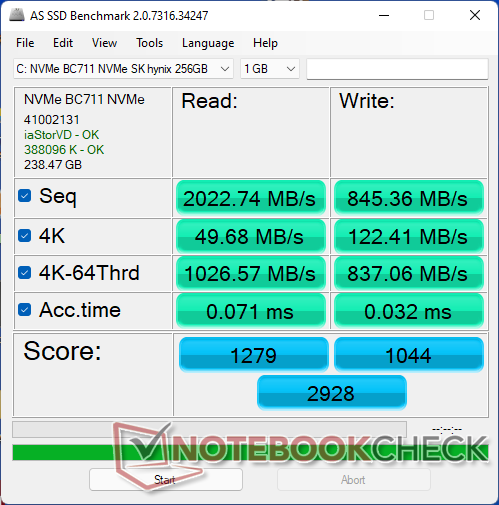
O sistema pode abrigar até dois acionamentos internos. Nossa configuração específica vem com um PCIe3 x4 de 256 GB SK Hynix SK BC711 M.2 2242 NVMe SSD oferecendo taxas sequenciais de leitura e escrita de até ~3300 MB/s e ~1000 MB/s, respectivamente, para ser muito rápido para um laptop de orçamento. O drive é capaz de manter sua taxa máxima de transferência por longos períodos sem qualquer almofada térmica ou resfriamento adicional.

* ... menor é melhor
Disk Throttling: DiskSpd Read Loop, Queue Depth 8
Desempenho da GPU
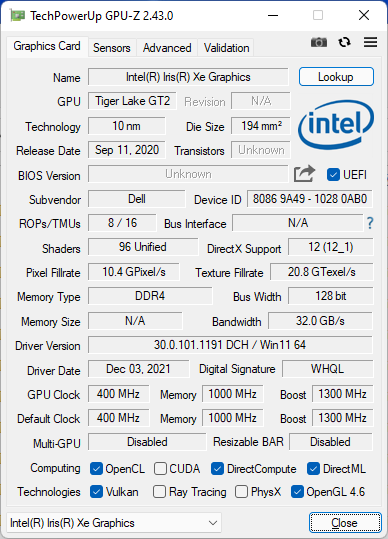
O desempenho gráfico é 30 a 45% mais lento do que a média do laptop em nosso banco de dados equipado com o mesma Iris Xe 80 integrada UE GPU. Os resultados decepcionantes podem ser contribuídos em grande parte para os míseros 8 GB de memória de canal único em comparação com 16 GB ou mais de memória de canal duplo na grande maioria dos modelos mais caros. É altamente recomendável instalar outro bastão de RAM se a maximização do desempenho da GPU for uma prioridade.
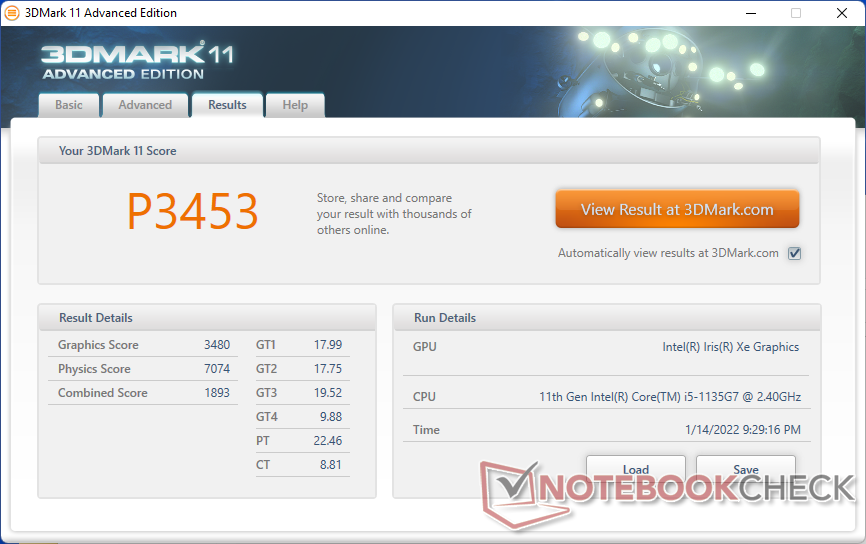
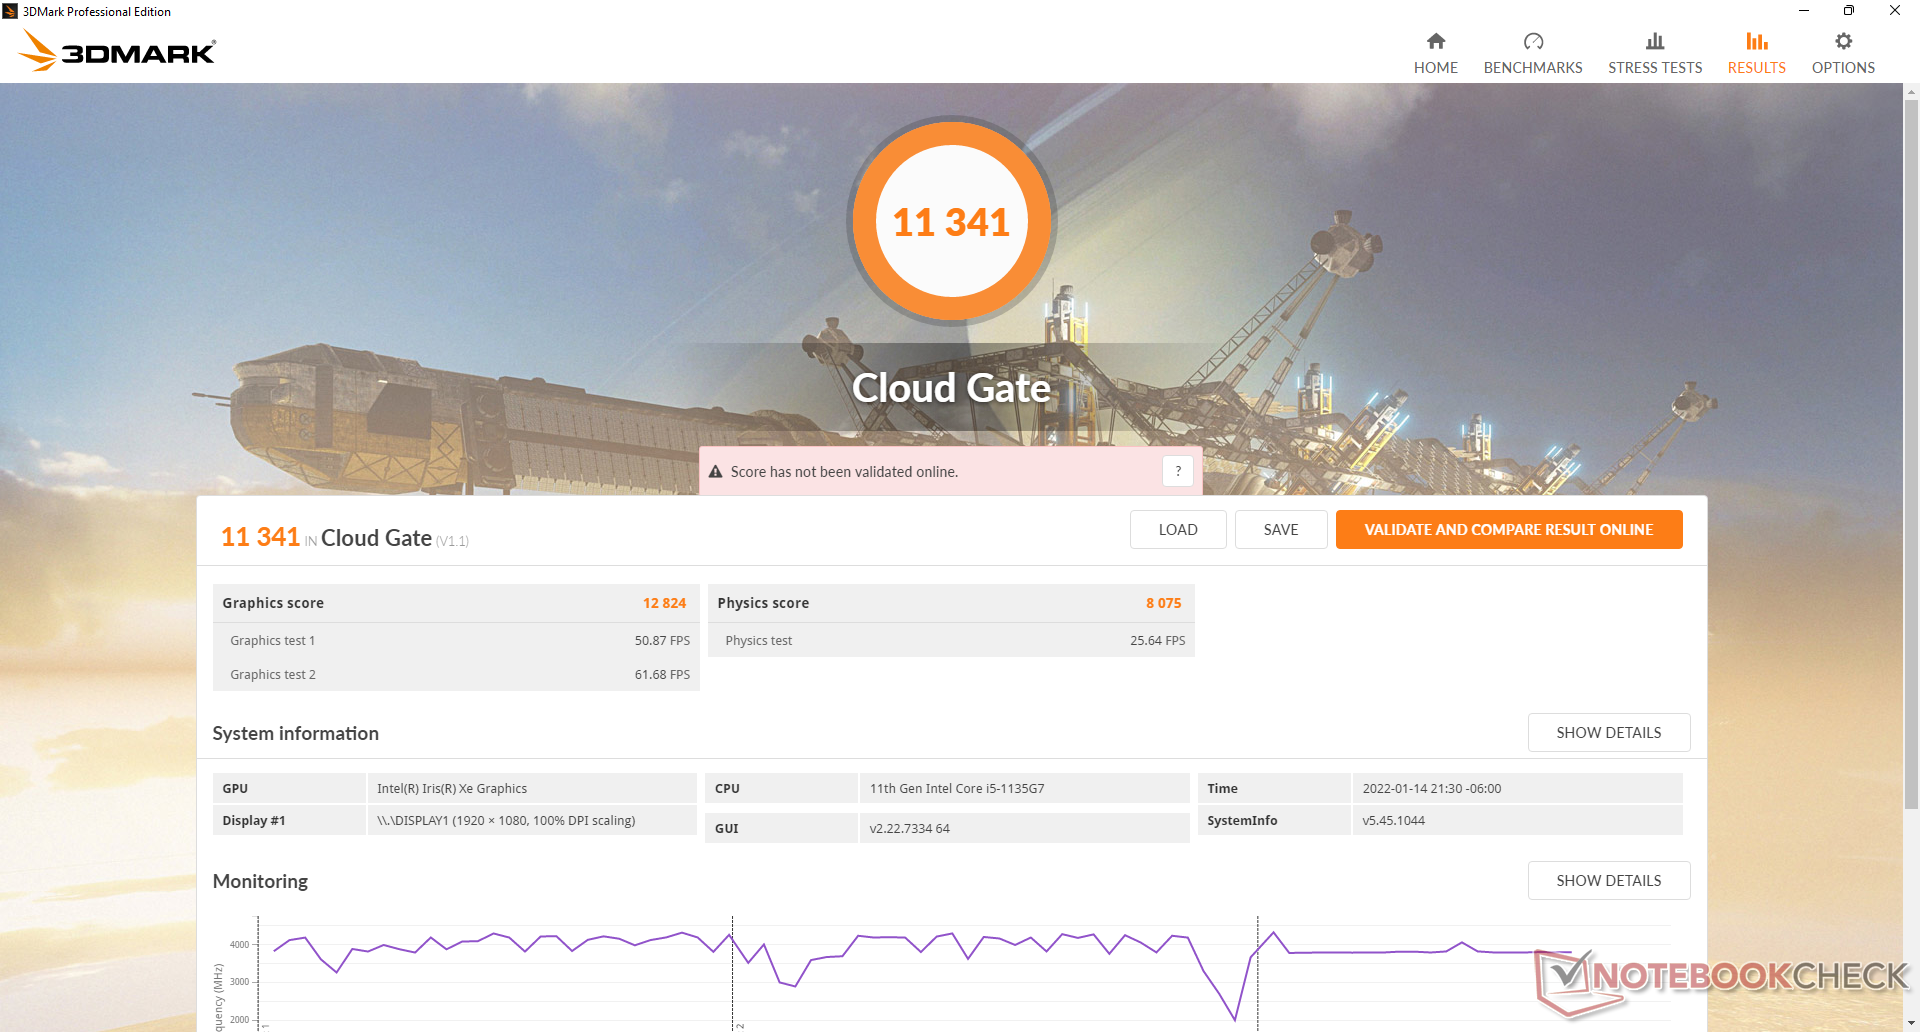
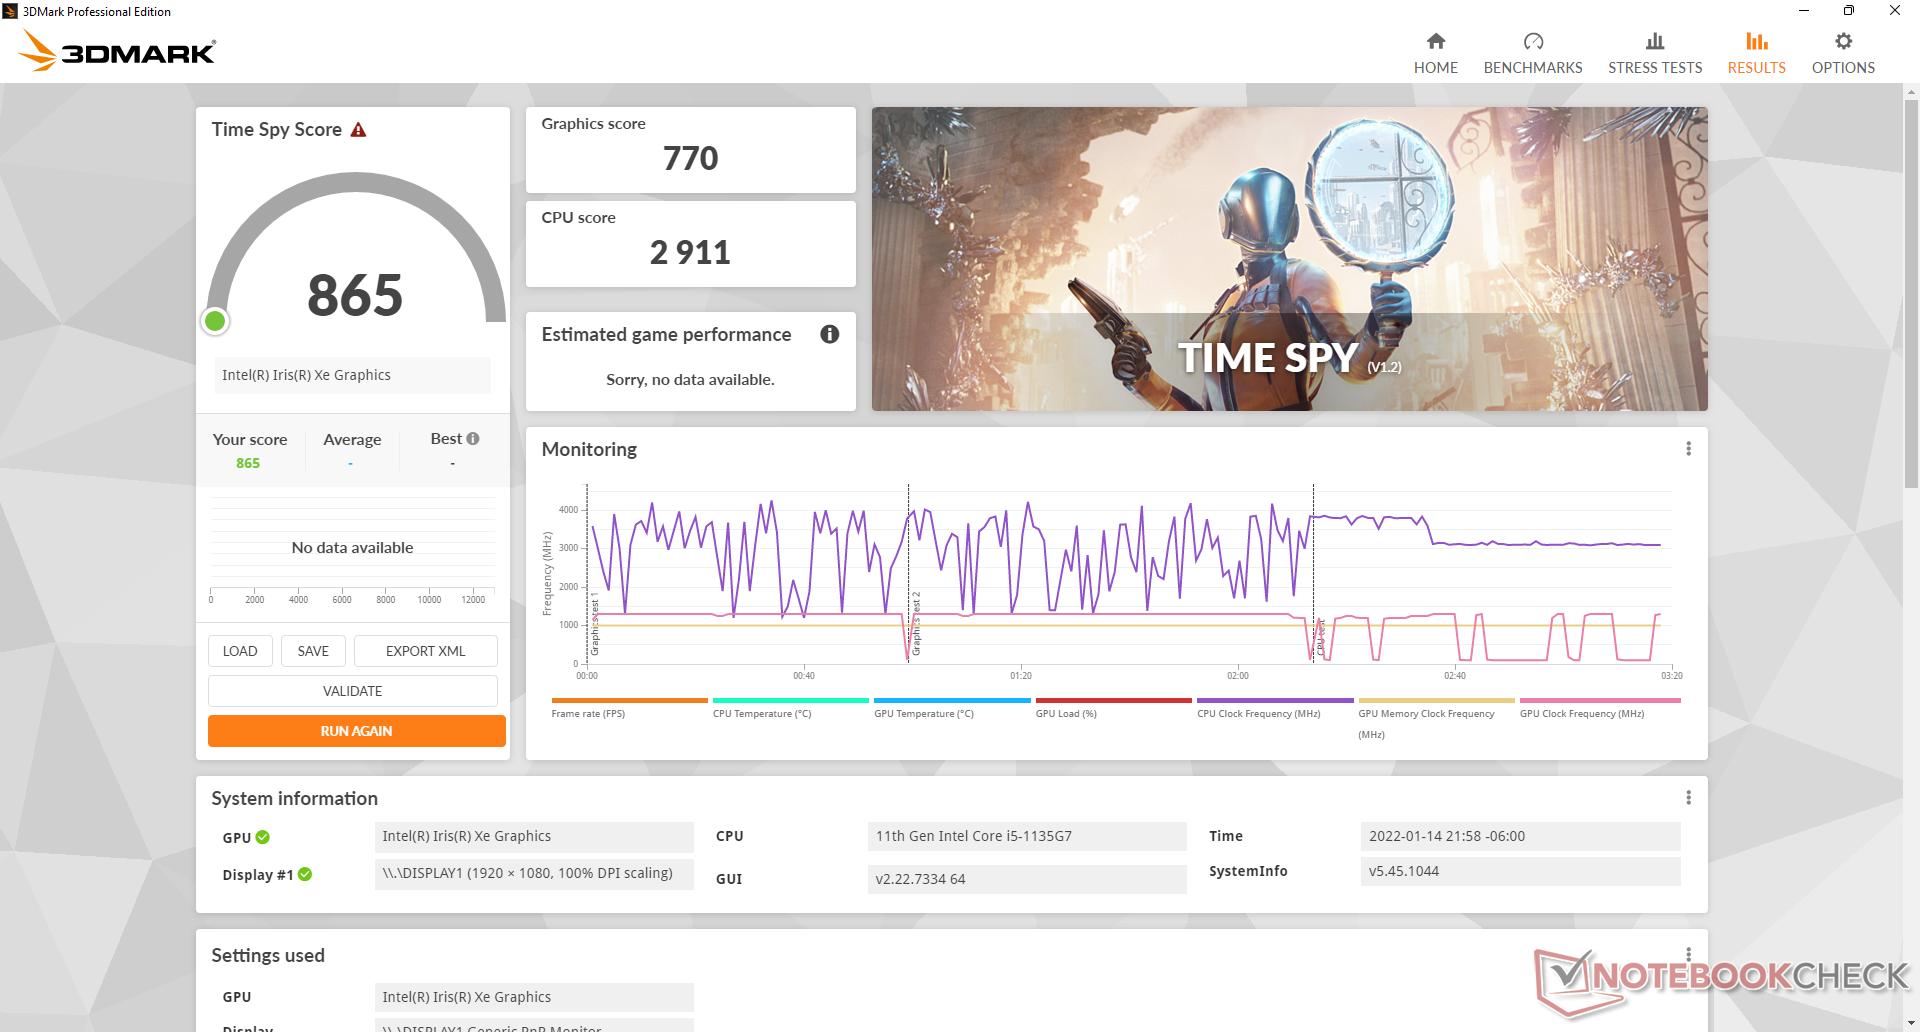
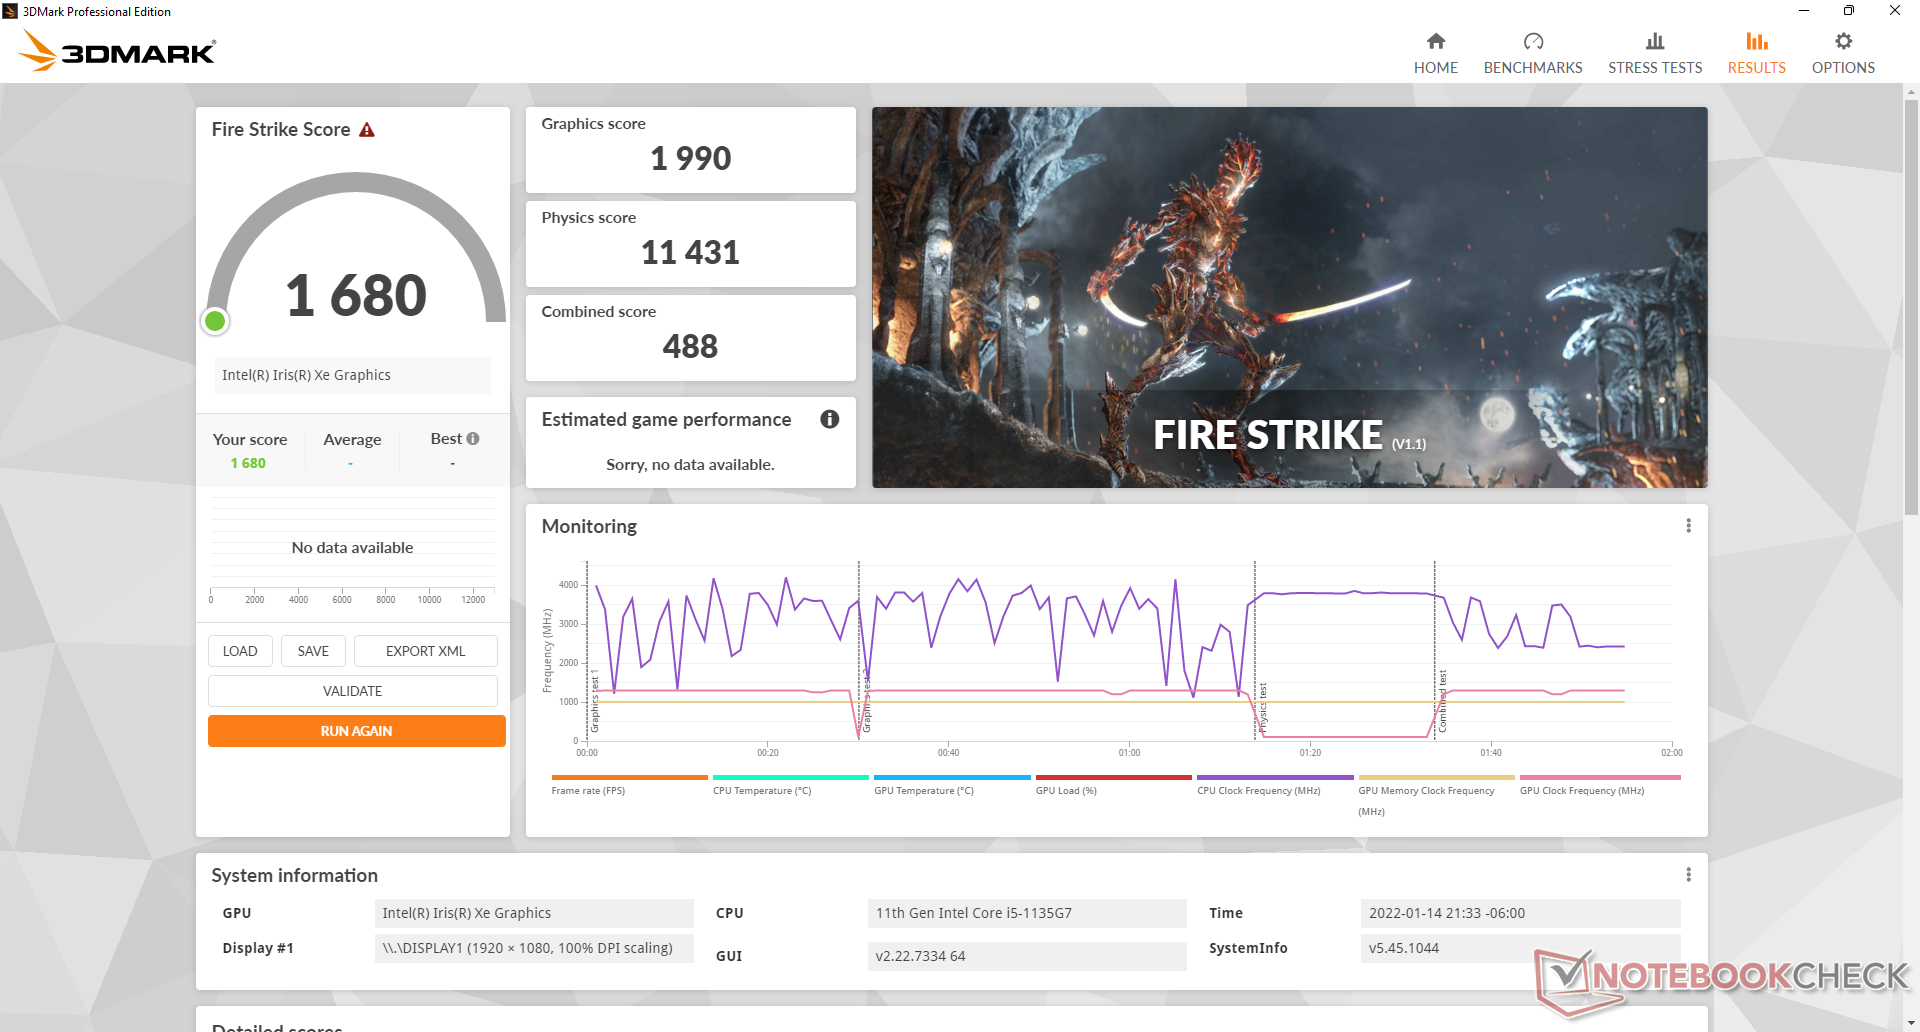
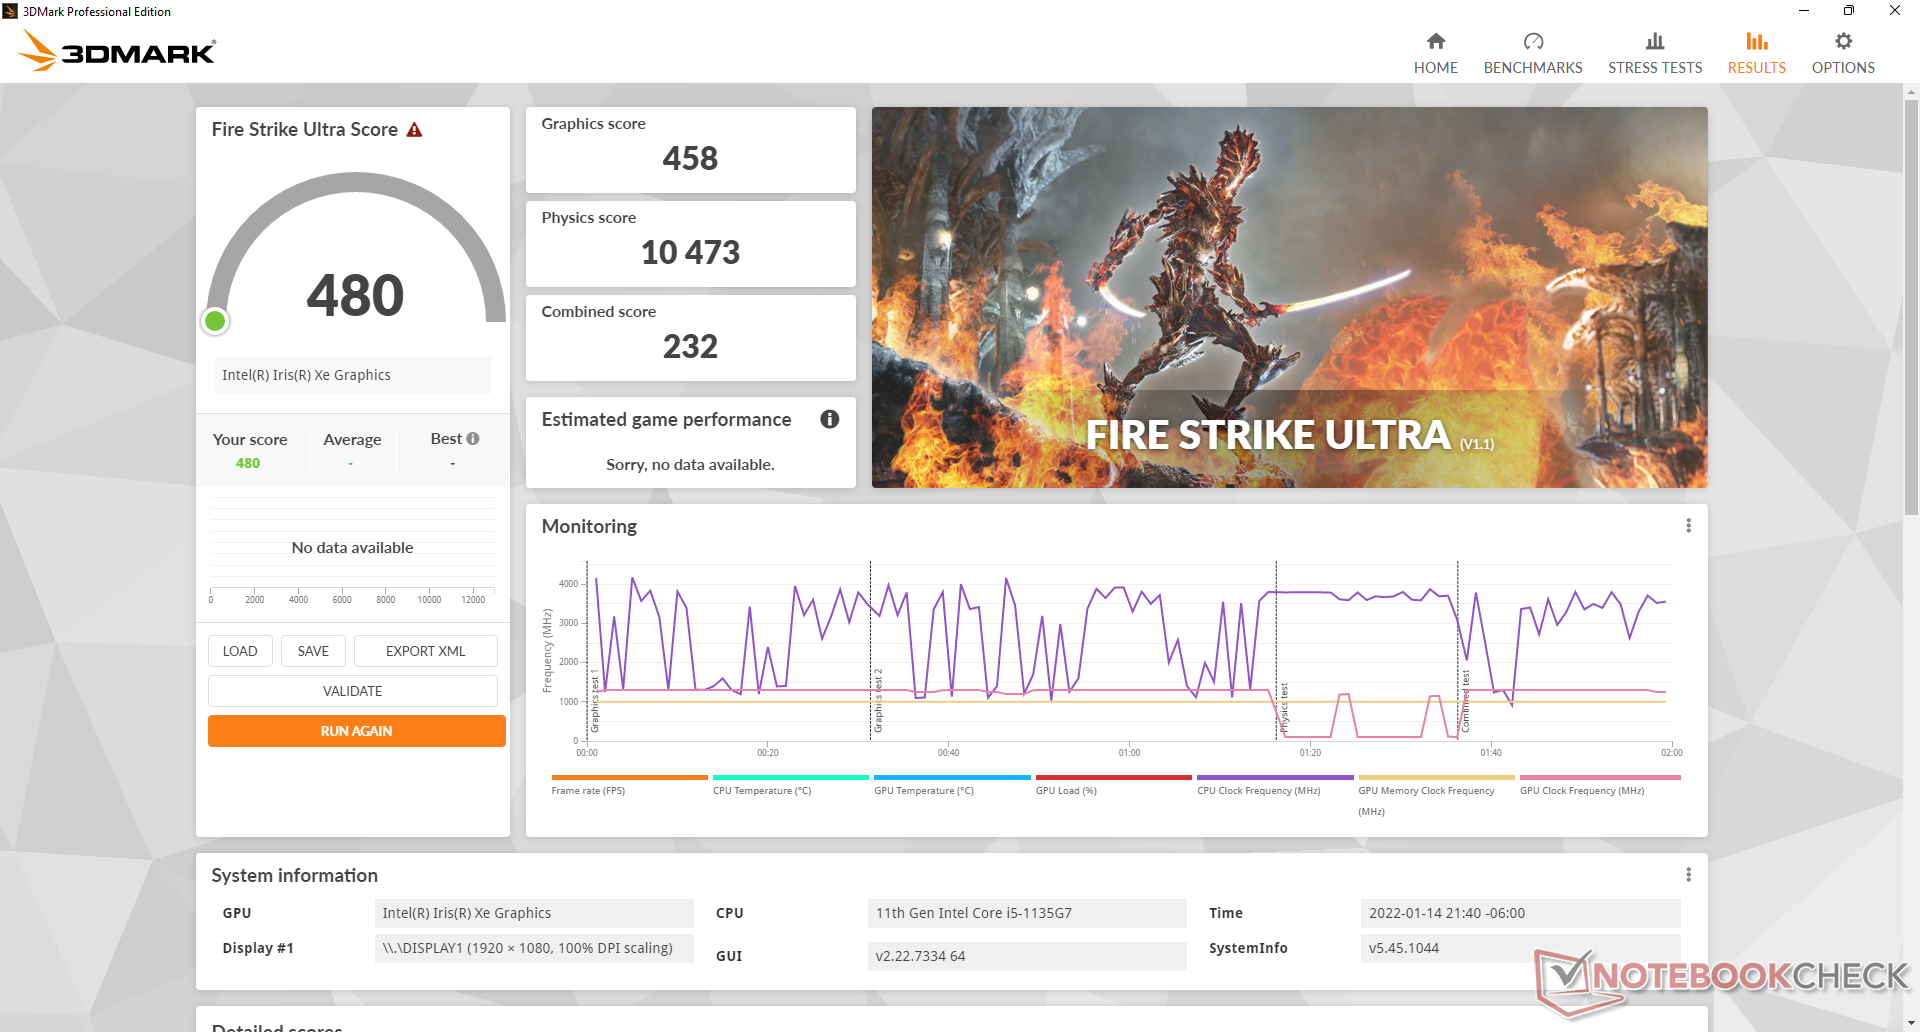
| 3DMark 11 Performance | 3453 pontos | |
| 3DMark Cloud Gate Standard Score | 11341 pontos | |
| 3DMark Fire Strike Score | 1680 pontos | |
| 3DMark Time Spy Score | 865 pontos | |
Ajuda | ||
Witcher 3 FPS Chart
| baixo | média | alto | ultra | |
|---|---|---|---|---|
| GTA V (2015) | 37.2 | 28.9 | 7.81 | 3.07 |
| The Witcher 3 (2015) | 33.5 | 22.6 | 10.9 | 6.8 |
| Dota 2 Reborn (2015) | 74.7 | 49.2 | 23.5 | 22.2 |
| Final Fantasy XV Benchmark (2018) | 16.7 | 8.11 | 6.38 | |
| X-Plane 11.11 (2018) | 18.4 | 15.8 | 15.4 | |
| Far Cry 5 (2018) | 17 | 9 | 8 | 8 |
| Strange Brigade (2018) | 36.7 | 13.6 | 11.9 |
Emissões
Ruído do sistema
O sistema é muito silencioso sob a maioria das cargas do dia-a-dia, tais como navegação na web ou streaming de vídeo. Na verdade, ele é capaz de permanecer quase silencioso por muito mais tempo do que o esperado. O ventilador interno permaneceria ocioso mesmo depois de executar a primeira cena de referência do 3DMark 06, o que não acontece com muita freqüência na maioria dos outros laptops.
A execução de jogos por períodos prolongados faria com que o ventilador se estabilizasse em 31,5 dB(A). Se a CPU ficar ainda mais estressada, o ruído da ventoinha aumentaria para quase 40 dB(A), o que ainda seria mais silencioso do que a maioria das alternativas como o Asus VivoBook S15 ouLenovo IdeaPad 3 15.
Barulho
| Ocioso |
| 23.3 / 23.3 / 23.3 dB |
| Carga |
| 23.3 / 39.2 dB |
 | ||
30 dB silencioso 40 dB(A) audível 50 dB(A) ruidosamente alto |
||
min: | ||
| Dell Inspiron 15 3000 3511 Iris Xe G7 80EUs, i5-1135G7, SK Hynix BC711 HFM256GD3GX013N | Dell XPS 15 9510 i5 11400H FHD UHD Graphics Xe 16EUs, i5-11400H, Micron 2300 512GB MTFDHBA512TDV | Asus VivoBook S15 D533UA Vega 8, R7 5700U, WDC PC SN530 SDBPNPZ-1T00 | Dell Inspiron 15 3501 Iris Xe G7 96EUs, i7-1165G7, Samsung PM991a MZ9LQ512HBLU-00BD1 | Lenovo IdeaPad 3 15ALC6 Vega 6, R3 5300U, Samsung PM991a MZALQ512HBLU | HP Pavilion 15-eg GeForce MX450, i7-1165G7, Samsung PM991 MZVLQ1T0HALB | |
|---|---|---|---|---|---|---|
| Noise | -5% | -28% | -16% | -14% | -20% | |
| desligado / ambiente * (dB) | 23.2 | 24.4 -5% | 26 -12% | 26 -12% | 25.2 -9% | 25.4 -9% |
| Idle Minimum * (dB) | 23.3 | 24.4 -5% | 26 -12% | 26 -12% | 25.8 -11% | 25.6 -10% |
| Idle Average * (dB) | 23.3 | 24.4 -5% | 26 -12% | 26 -12% | 25.8 -11% | 25.6 -10% |
| Idle Maximum * (dB) | 23.3 | 24.4 -5% | 28.8 -24% | 26 -12% | 25.8 -11% | 25.6 -10% |
| Load Average * (dB) | 23.3 | 26.1 -12% | 45 -93% | 35.9 -54% | 32.3 -39% | 39.2 -68% |
| Witcher 3 ultra * (dB) | 31.5 | 33.2 -5% | 32 -2% | 39.1 -24% | ||
| Load Maximum * (dB) | 39.2 | 37.7 4% | 45 -15% | 35.8 9% | 44 -12% | 41.5 -6% |
* ... menor é melhor
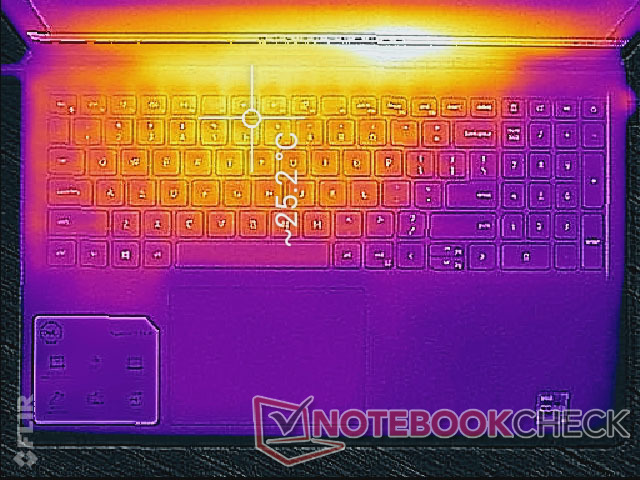
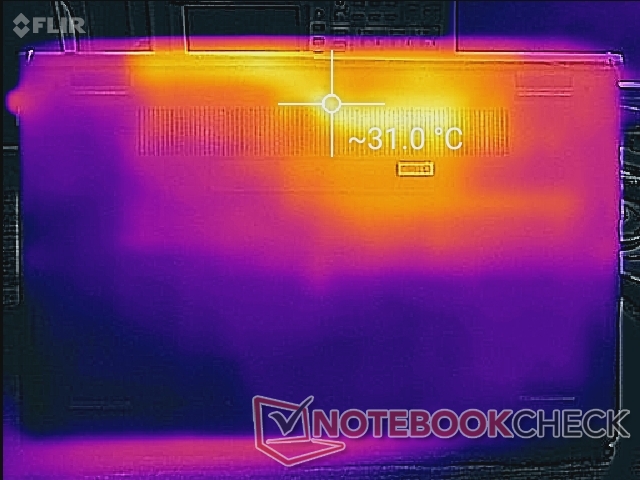
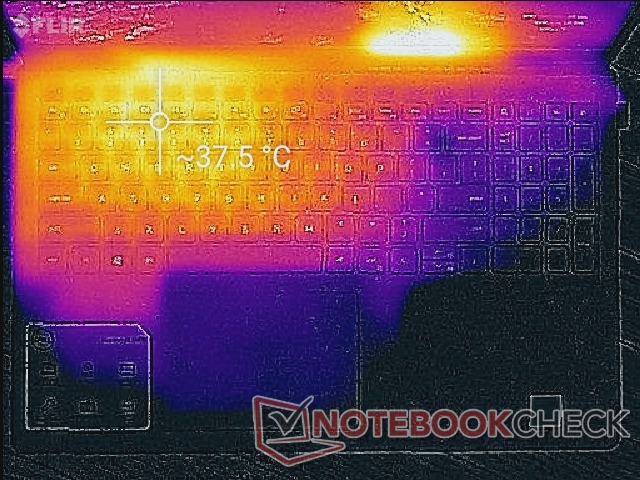
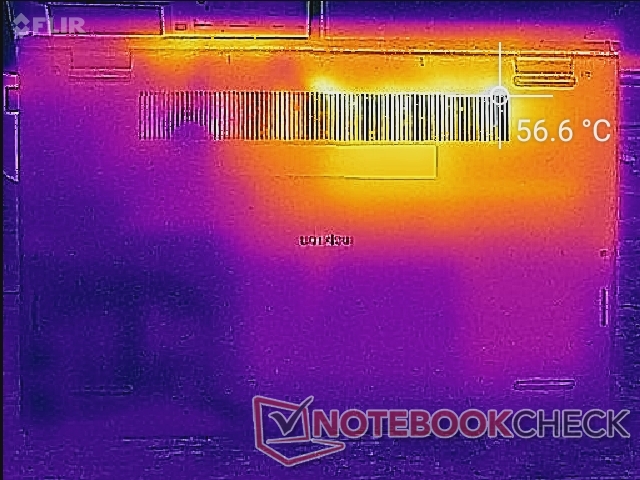
Temperatura
Os pontos quentes são concentrados na parte de trás do sistema onde o processador e sua solução de resfriamento estão posicionados. As temperaturas podem chegar a 38 C e 57 C na parte superior e inferior do laptop, respectivamente, em comparação com apenas 31 C e 43 C na Lenovo IdeaPad 3 15. O apoio de palma e a maior parte do teclado será sempre muito mais frio para um uso confortável, não importando a carga.
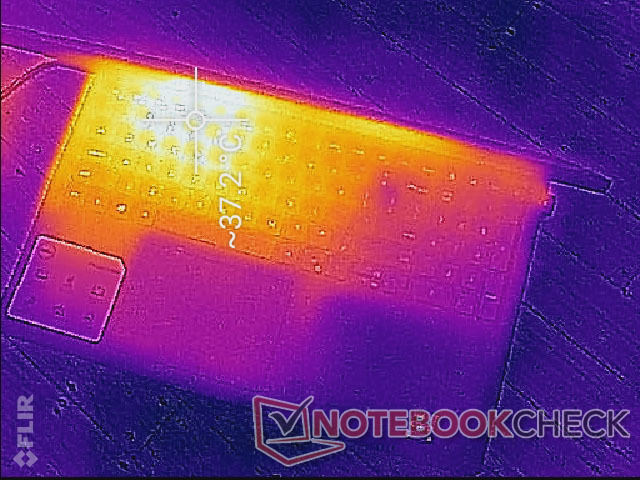
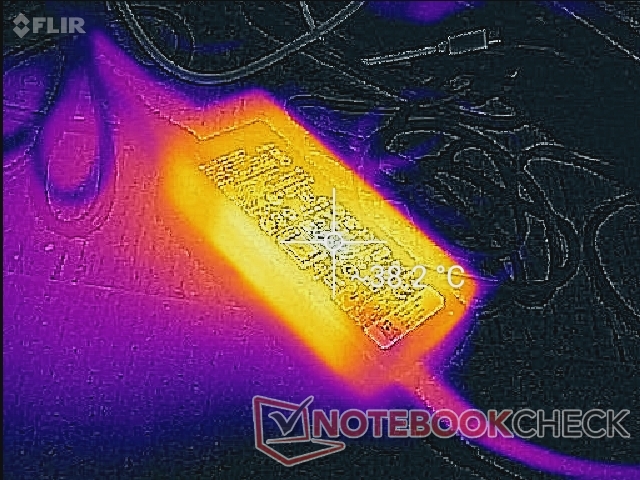
(+) A temperatura máxima no lado superior é 37.8 °C / 100 F, em comparação com a média de 34.3 °C / 94 F , variando de 21.2 a 62.5 °C para a classe Office.
(-) A parte inferior aquece até um máximo de 55.6 °C / 132 F, em comparação com a média de 36.8 °C / 98 F
(+) Em uso inativo, a temperatura média para o lado superior é 21.8 °C / 71 F, em comparação com a média do dispositivo de 29.5 °C / ### class_avg_f### F.
(+) Os apoios para as mãos e o touchpad são mais frios que a temperatura da pele, com um máximo de 20.6 °C / 69.1 F e, portanto, são frios ao toque.
(+) A temperatura média da área do apoio para as mãos de dispositivos semelhantes foi 27.5 °C / 81.5 F (+6.9 °C / 12.4 F).
| Dell Inspiron 15 3000 3511 Intel Core i5-1135G7, Intel Iris Xe Graphics G7 80EUs | Dell XPS 15 9510 i5 11400H FHD Intel Core i5-11400H, Intel UHD Graphics Xe 16EUs | Asus VivoBook S15 D533UA AMD Ryzen 7 5700U, AMD Radeon RX Vega 8 (Ryzen 4000/5000) | Dell Inspiron 15 3501 Intel Core i7-1165G7, Intel Iris Xe Graphics G7 96EUs | Lenovo IdeaPad 3 15ALC6 AMD Ryzen 3 5300U, AMD Radeon RX Vega 6 (Ryzen 4000/5000) | HP Pavilion 15-eg Intel Core i7-1165G7, NVIDIA GeForce MX450 | |
|---|---|---|---|---|---|---|
| Heat | 8% | 0% | 2% | 14% | -2% | |
| Maximum Upper Side * (°C) | 37.8 | 42.8 -13% | 46.1 -22% | 45.6 -21% | 31.2 17% | 44 -16% |
| Maximum Bottom * (°C) | 55.6 | 41.2 26% | 46.6 16% | 41 26% | 43 23% | 53.4 4% |
| Idle Upper Side * (°C) | 26.2 | 25.8 2% | 27.4 -5% | 28.2 -8% | 24.8 5% | 27.4 -5% |
| Idle Bottom * (°C) | 32 | 26.2 18% | 28.2 12% | 29.1 9% | 28.2 12% | 28.8 10% |
* ... menor é melhor
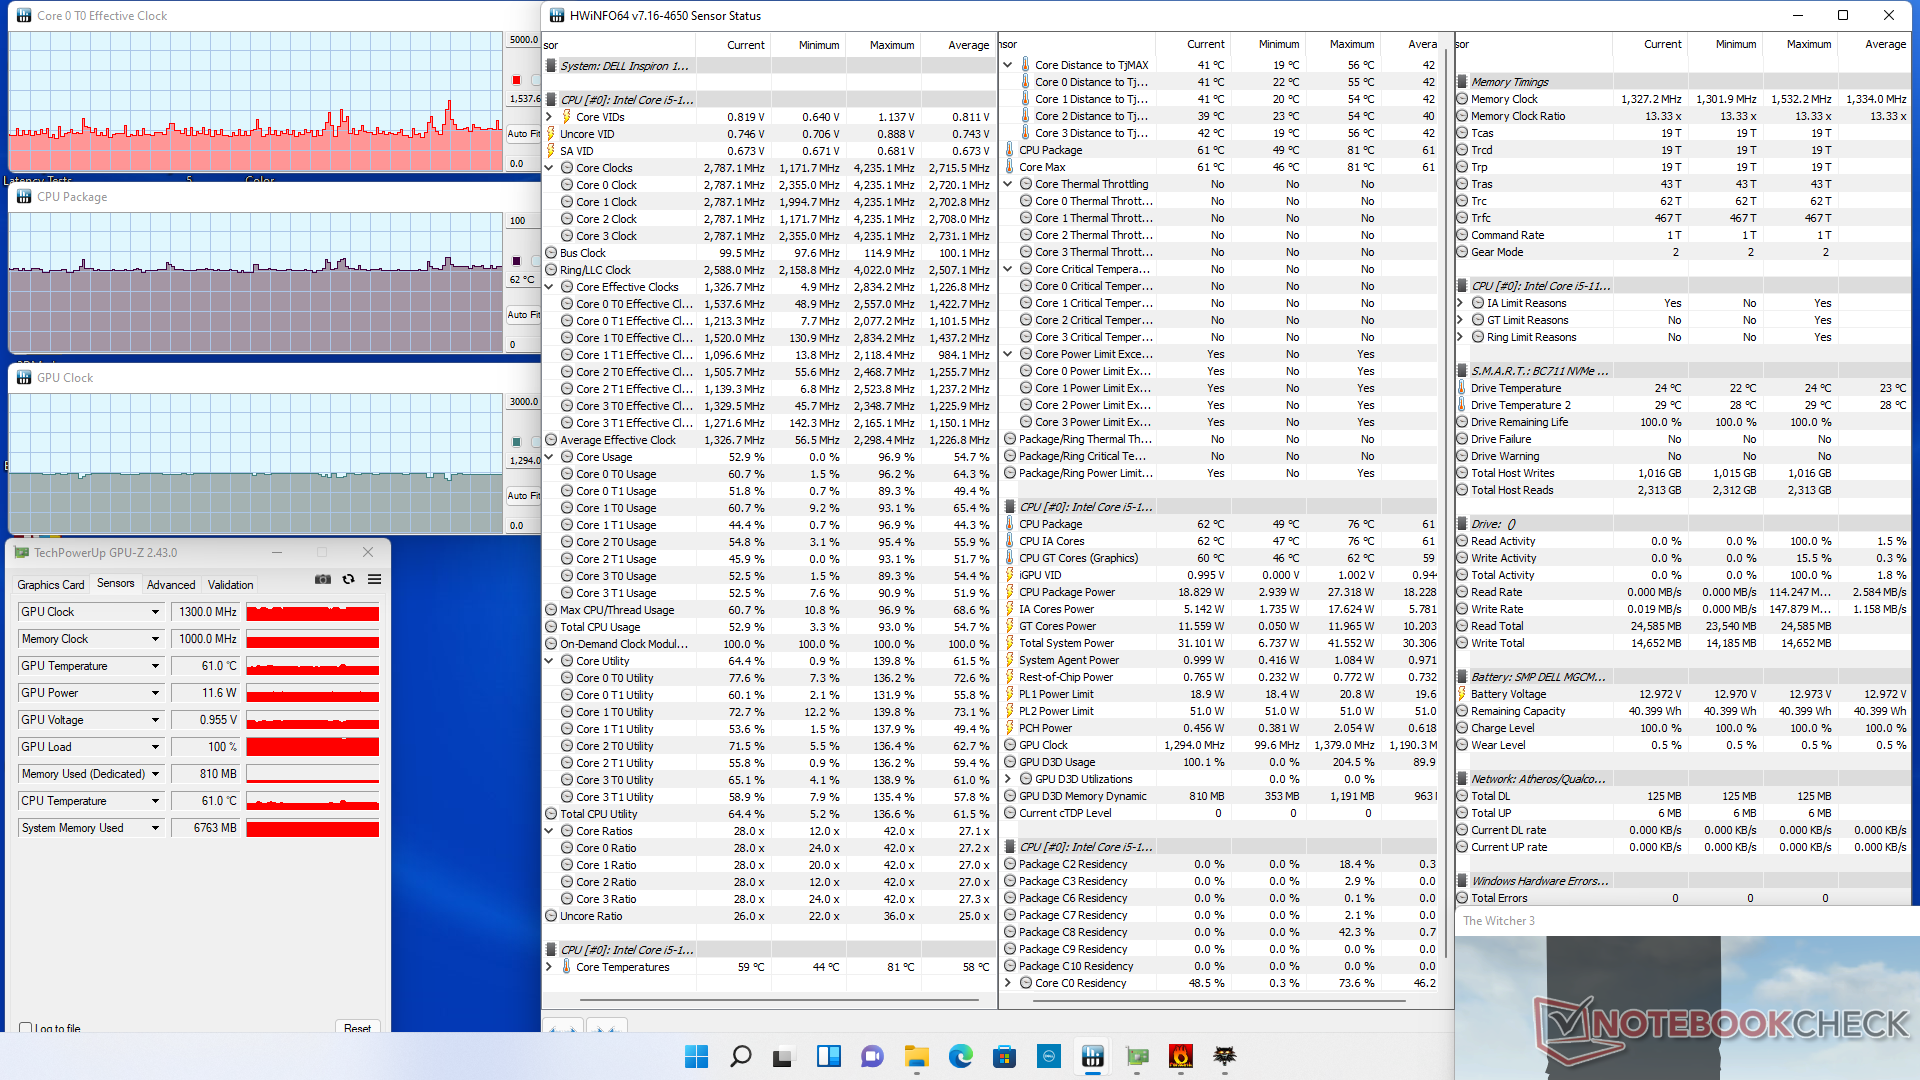
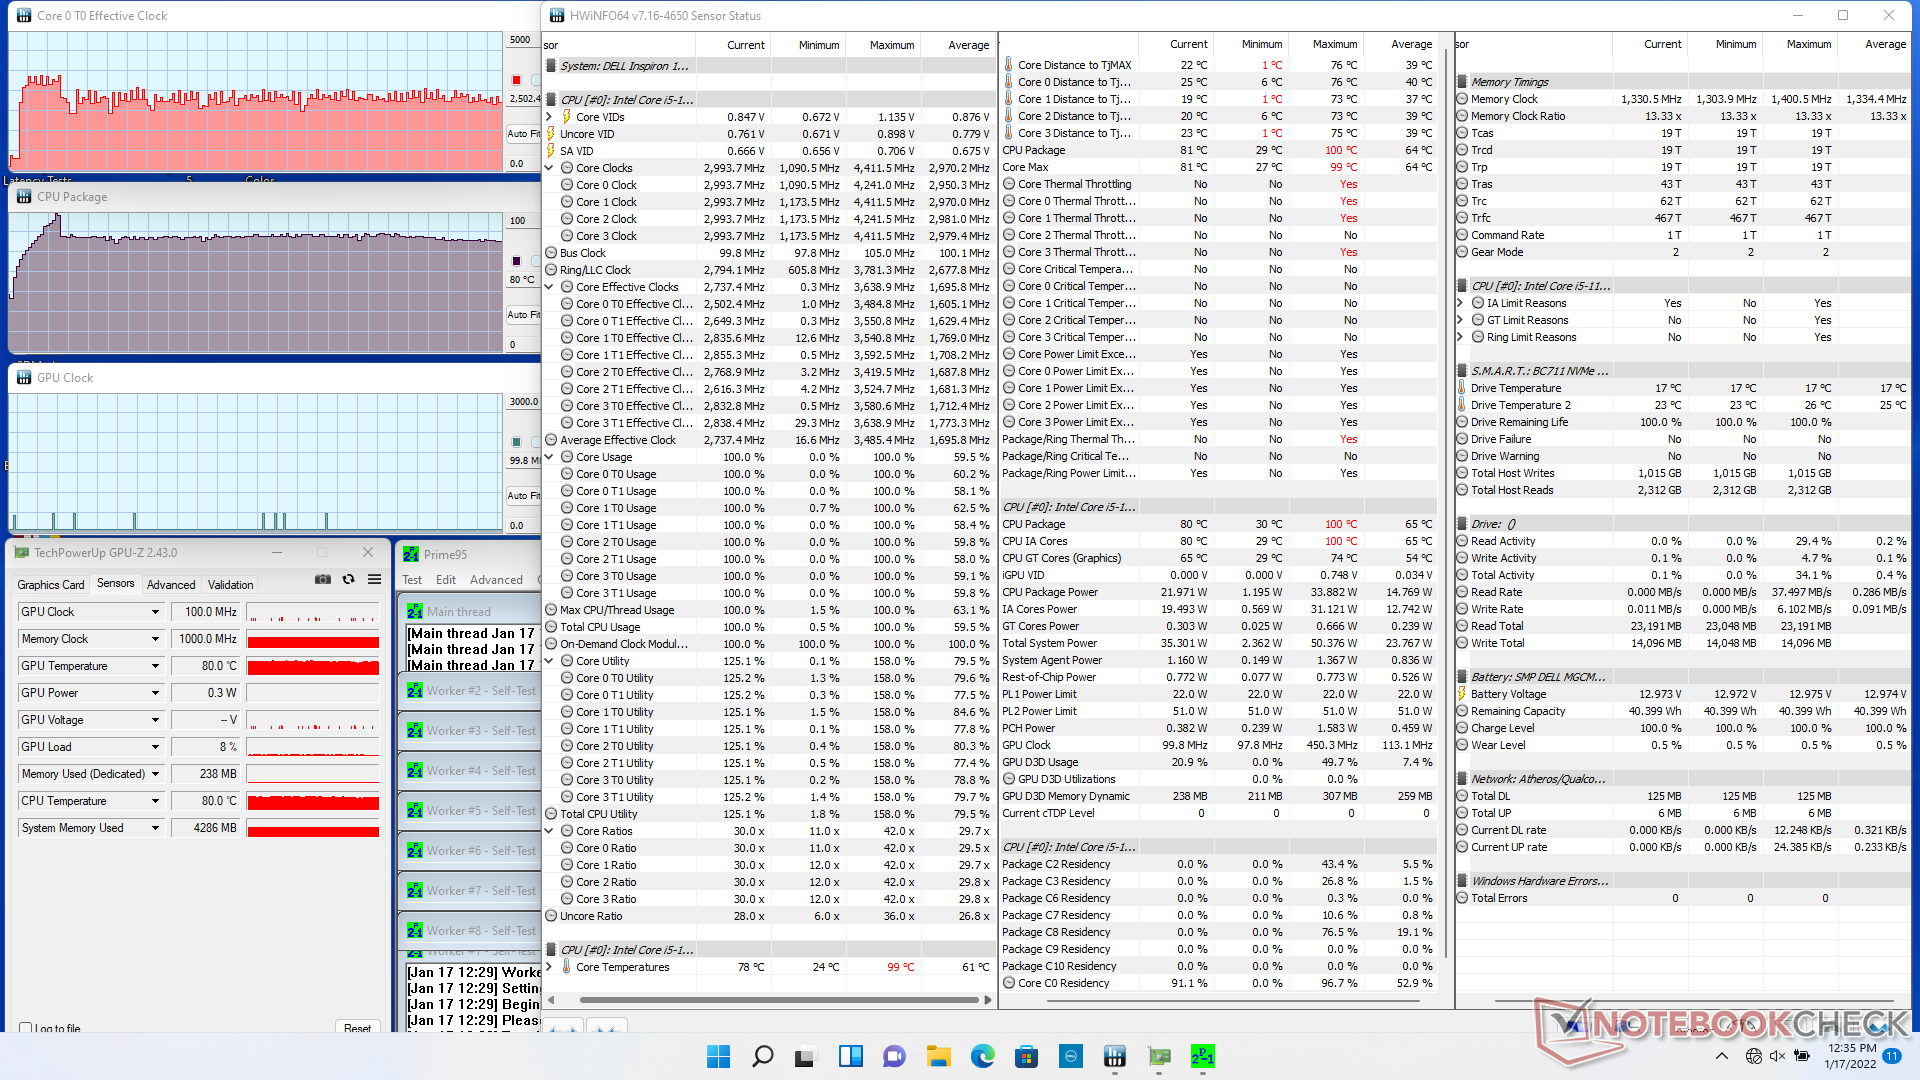
Teste de estresse
A execução do Prime95 faz com que a CPU dispare para 3,5 GHz durante os primeiros segundos até que sua temperatura central atinja 100 C. As taxas de relógio cairiam rapidamente para a faixa de 2,5 a 2,8 GHz a fim de manter uma temperatura mais fria de 80 C. A energia do pacote da CPU atingiria um pico de cerca de 34 W durante o início do teste antes de se estabilizar em 22 W. A execução deste mesmo teste na Core i7 Asus Vivobook 15 K513EQ resultaria, em vez disso, em uma taxa de relógio estável mais alta de 3,1 GHz.
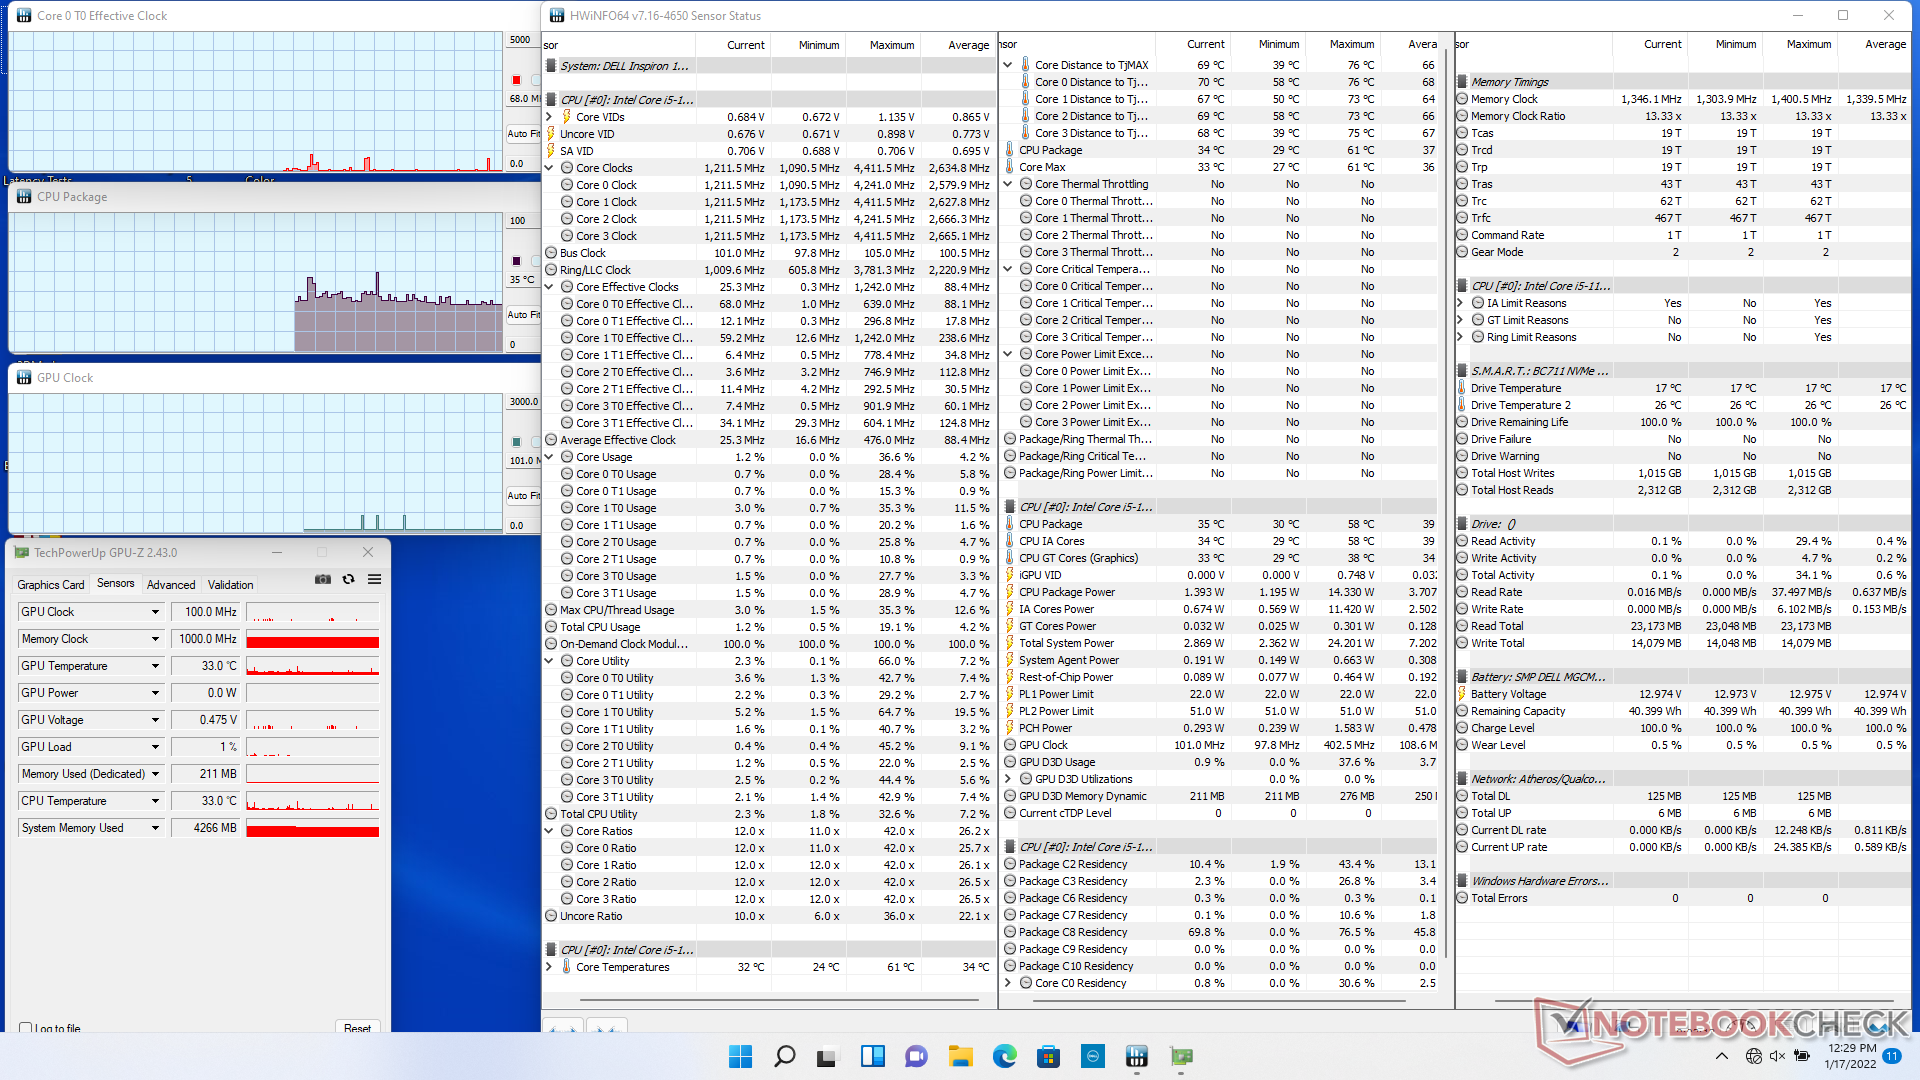
A CPU se estabilizaria em 62 C quando funcionando Witcher 3 para representar cargas pesadas em comparação com 57 C no IdeaPad 3 15ALC6 da Lenovo, movido a AMD.
O funcionamento com energia de bateria não limitará o desempenho. as pontuações do 3DMark 11 permaneceriam essencialmente idênticas entre a energia da bateria e a energia do adaptador AC.
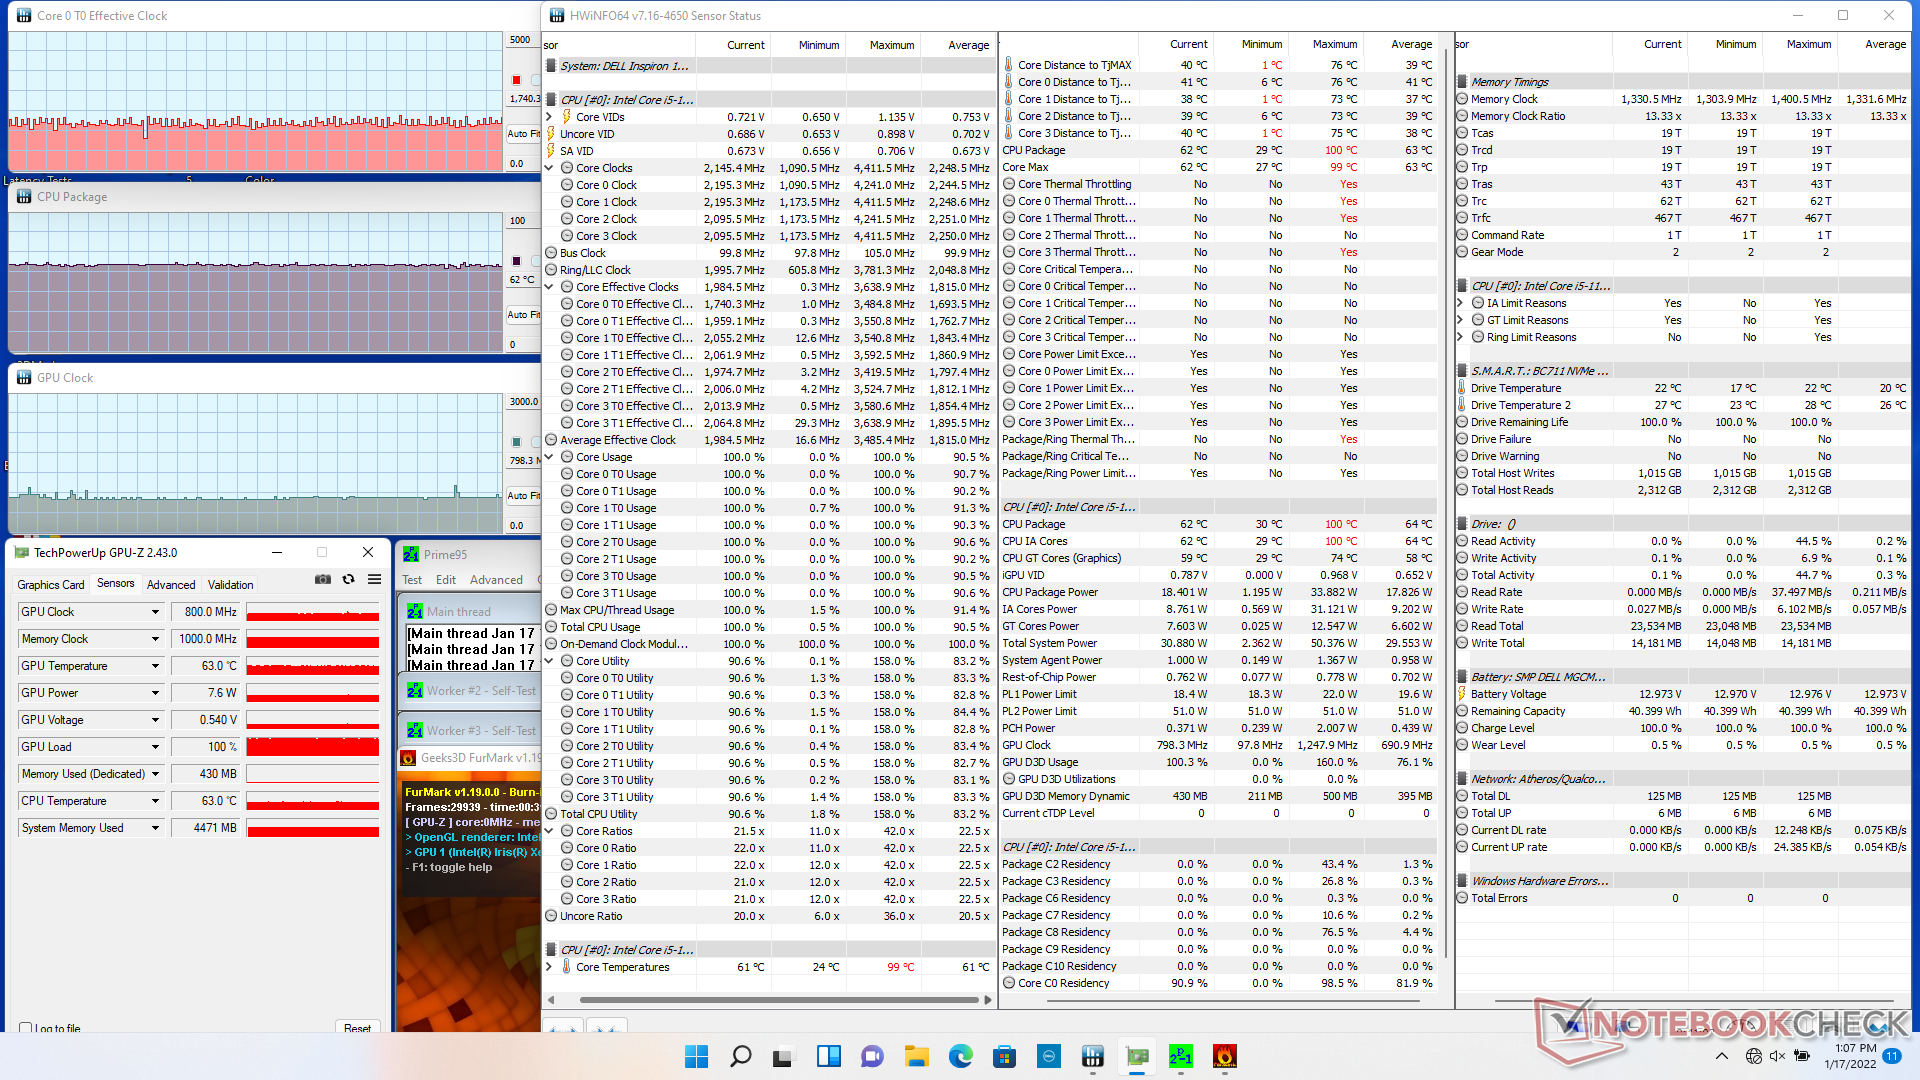
| Relógio de CPU (GHz) | Relógio de GPU (MHz) | Temperatura média da CPU (°C) | |
| System Idle | -- | -- | 35 |
| Prime95 Stress | 2.5 - 2.8 | -- | 80 |
| Prime95 + FurMark Stress | 1.4 - 1.7 | 800 | 62 |
| Witcher 3 Stress | ~1.5 | 1300 | 62 |
Oradores
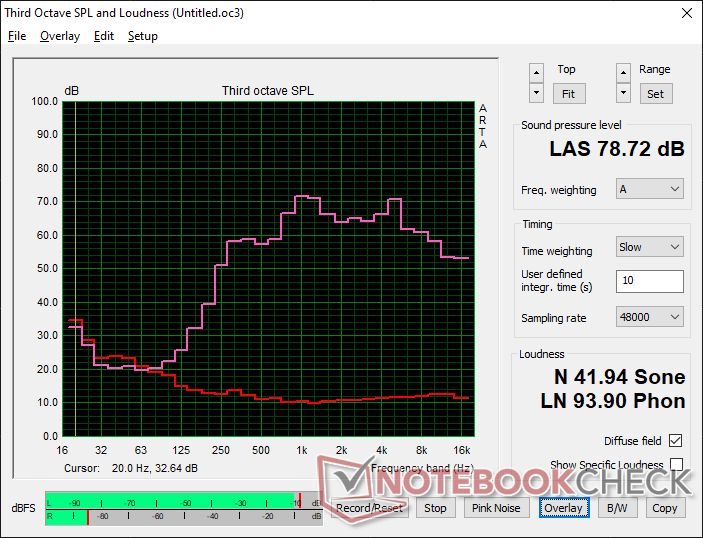
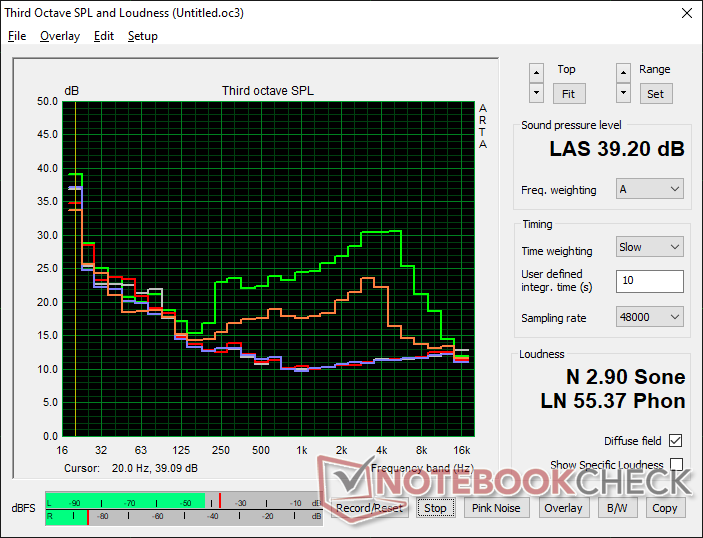
Dell Inspiron 15 3000 3511 análise de áudio
(±) | o volume do alto-falante é médio, mas bom (###valor### dB)
Graves 100 - 315Hz
(-) | quase nenhum baixo - em média 20.8% menor que a mediana
(±) | a linearidade dos graves é média (13.3% delta para a frequência anterior)
Médios 400 - 2.000 Hz
(±) | médios mais altos - em média 5.8% maior que a mediana
(+) | médios são lineares (6.4% delta para frequência anterior)
Altos 2 - 16 kHz
(±) | máximos mais altos - em média 5.2% maior que a mediana
(+) | os máximos são lineares (6.4% delta da frequência anterior)
Geral 100 - 16.000 Hz
(±) | a linearidade do som geral é média (21.6% diferença em relação à mediana)
Comparado com a mesma classe
» 54% de todos os dispositivos testados nesta classe foram melhores, 9% semelhantes, 37% piores
» O melhor teve um delta de 7%, a média foi 21%, o pior foi 53%
Comparado com todos os dispositivos testados
» 61% de todos os dispositivos testados foram melhores, 7% semelhantes, 32% piores
» O melhor teve um delta de 4%, a média foi 24%, o pior foi 134%
Apple MacBook Pro 16 2021 M1 Pro análise de áudio
(+) | os alto-falantes podem tocar relativamente alto (###valor### dB)
Graves 100 - 315Hz
(+) | bons graves - apenas 3.8% longe da mediana
(+) | o baixo é linear (5.2% delta para a frequência anterior)
Médios 400 - 2.000 Hz
(+) | médios equilibrados - apenas 1.3% longe da mediana
(+) | médios são lineares (2.1% delta para frequência anterior)
Altos 2 - 16 kHz
(+) | agudos equilibrados - apenas 1.9% longe da mediana
(+) | os máximos são lineares (2.7% delta da frequência anterior)
Geral 100 - 16.000 Hz
(+) | o som geral é linear (4.6% diferença em relação à mediana)
Comparado com a mesma classe
» 0% de todos os dispositivos testados nesta classe foram melhores, 0% semelhantes, 100% piores
» O melhor teve um delta de 5%, a média foi 17%, o pior foi 45%
Comparado com todos os dispositivos testados
» 0% de todos os dispositivos testados foram melhores, 0% semelhantes, 100% piores
» O melhor teve um delta de 4%, a média foi 24%, o pior foi 134%
Gestão de energia
Consumo de energia
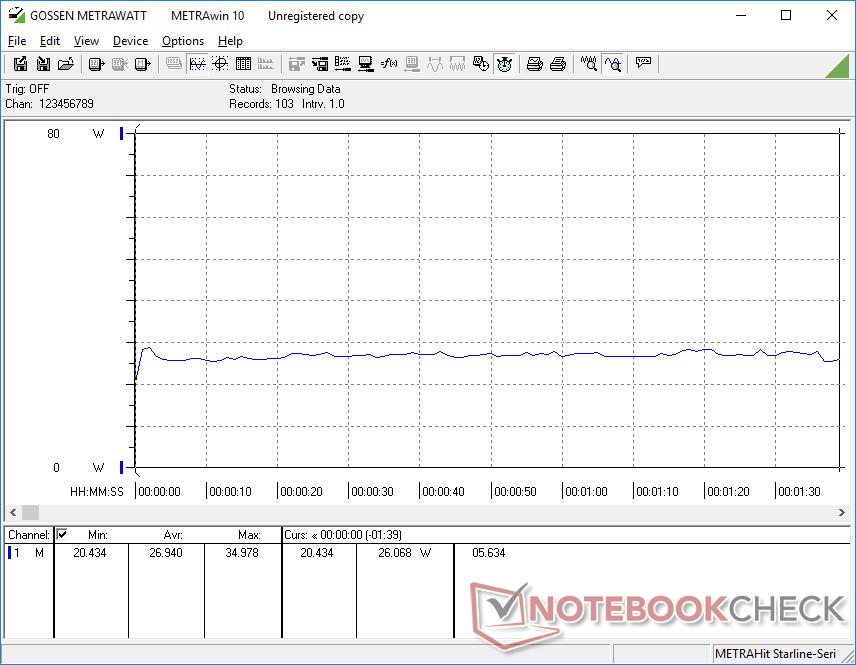
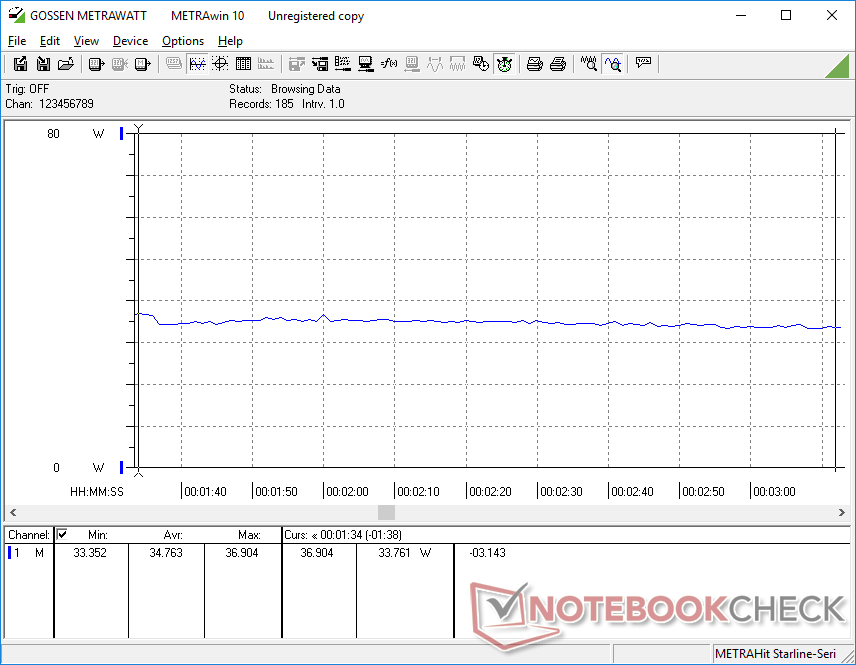
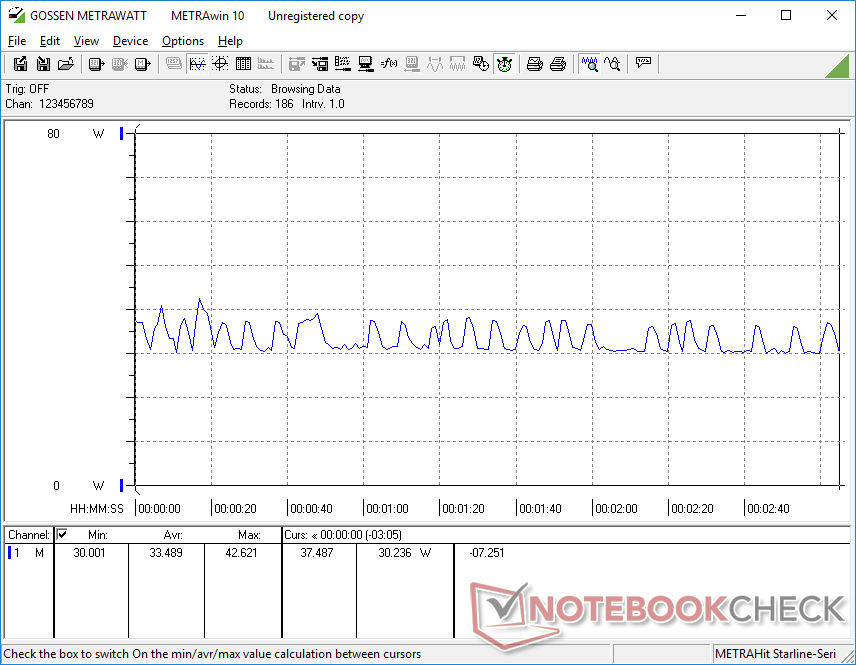
O manuseio em desktops consome entre 3 W e 7 W para ser mais eficiente do que o esperado em relação a outros laptops de 15,6 polegadas rodando em CPUs da série U. Curiosamente, o consumo de energia não é estável quando em funcionamento Witcher 3o sistema ciclaria entre 30 W e 42 W, embora as taxas de estrutura pareçam ser estáveis
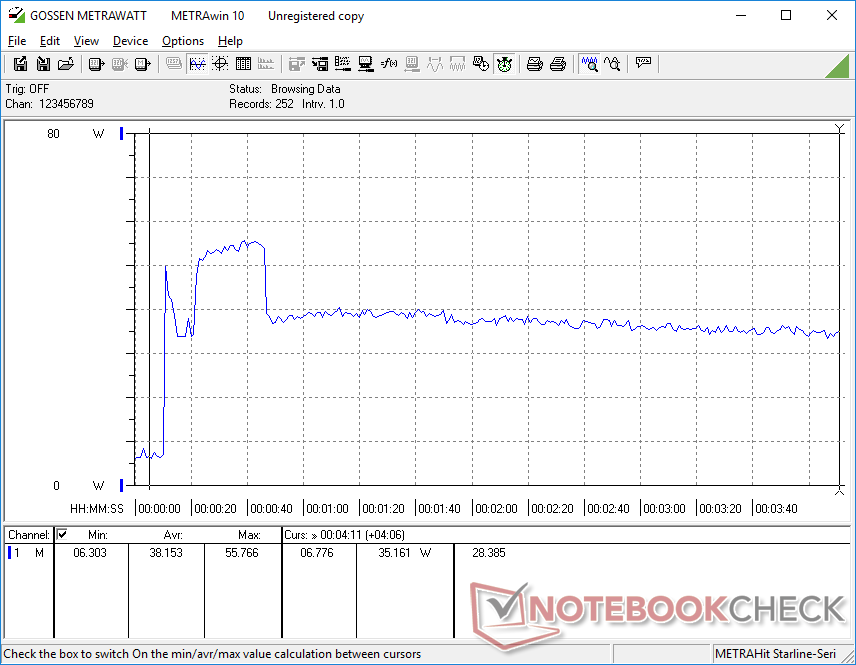
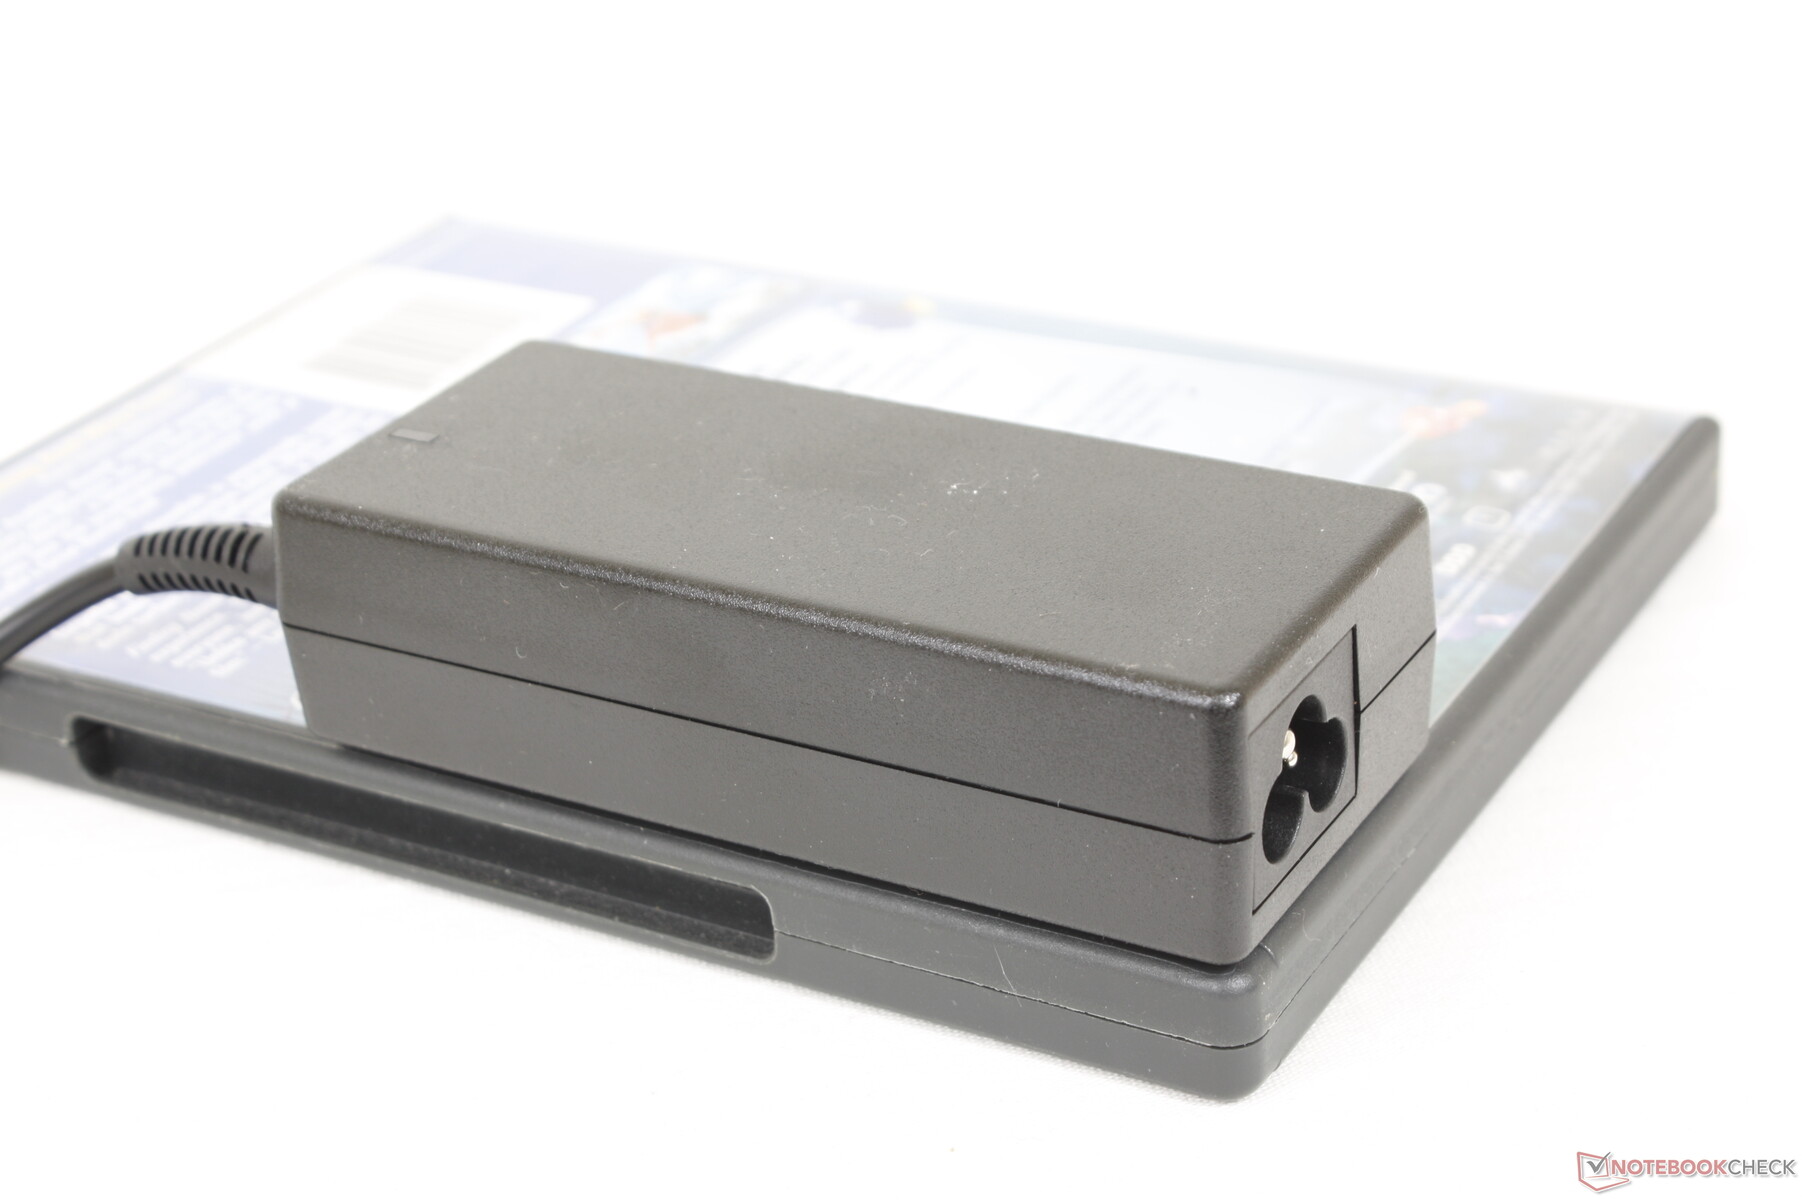
Somos capazes de registrar um consumo máximo de 56 W do pequeno (~10,6 x 4,5 x 2,8 cm) adaptador CA de 65 W ao executar cargas extremas onde a CPU atinge 100% de utilização. Este sorteio é apenas temporário, como mostra nosso gráfico abaixo.
| desligado | |
| Ocioso | |
| Carga |
|
Key:
min: | |
| Dell Inspiron 15 3000 3511 i5-1135G7, Iris Xe G7 80EUs, SK Hynix BC711 HFM256GD3GX013N, IPS, 1920x1080, 15.6" | Dell XPS 15 9510 i5 11400H FHD i5-11400H, UHD Graphics Xe 16EUs, Micron 2300 512GB MTFDHBA512TDV, IPS, 1920x1200, 15.6" | Asus VivoBook S15 D533UA R7 5700U, Vega 8, WDC PC SN530 SDBPNPZ-1T00, IPS, 1920x1080, 15.6" | Dell Inspiron 15 3501 i7-1165G7, Iris Xe G7 96EUs, Samsung PM991a MZ9LQ512HBLU-00BD1, IPS, 1920x1080, 15.6" | Lenovo IdeaPad 3 15ALC6 R3 5300U, Vega 6, Samsung PM991a MZALQ512HBLU, IPS, 1920x1080, 15.6" | HP Pavilion 15-eg i7-1165G7, GeForce MX450, Samsung PM991 MZVLQ1T0HALB, IPS, 1920x1080, 15.6" | |
|---|---|---|---|---|---|---|
| Power Consumption | -38% | -48% | -14% | -20% | -74% | |
| Idle Minimum * (Watt) | 3.1 | 5.3 -71% | 5 -61% | 3.6 -16% | 5.6 -81% | 4.9 -58% |
| Idle Average * (Watt) | 5.6 | 9 -61% | 7.7 -38% | 6.4 -14% | 6 -7% | 7.9 -41% |
| Idle Maximum * (Watt) | 6.4 | 9.7 -52% | 12.2 -91% | 7.9 -23% | 7 -9% | 14.2 -122% |
| Load Average * (Watt) | 26.9 | 30.3 -13% | 41 -52% | 39 -45% | 34.9 -30% | 64.3 -139% |
| Witcher 3 ultra * (Watt) | 33.5 | 30.6 9% | 43 -28% | 37.6 -12% | 32.5 3% | 55.6 -66% |
| Load Maximum * (Watt) | 55.8 | 76.2 -37% | 65 -16% | 41.8 25% | 52.1 7% | 65.4 -17% |
* ... menor é melhor
Power Consumption Witcher 3 / Stresstest
Power Consumption external Monitor
Vida útil da bateria
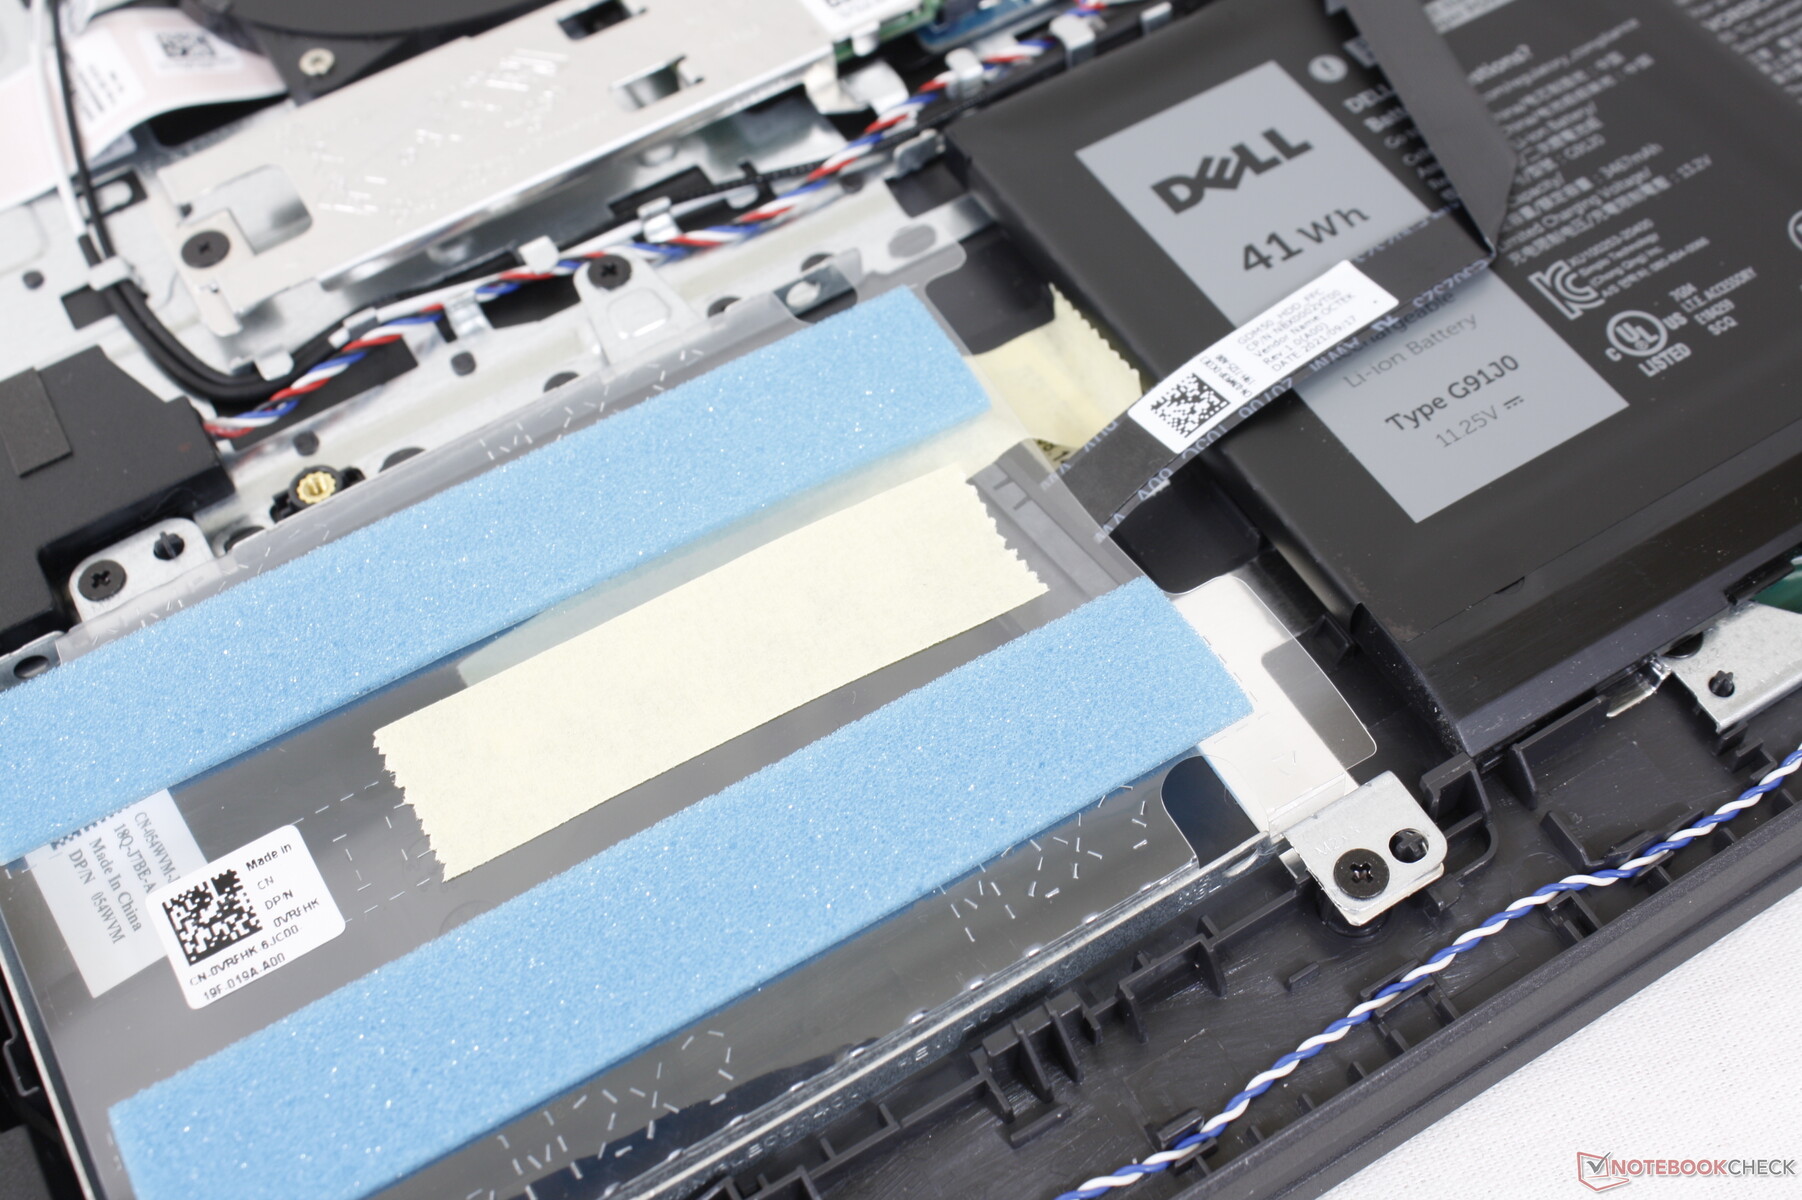
Espere cerca de 6,5 horas de uso da WLAN no mundo real antes de precisar recarregar a bateria interna de 40 Wh. Os resultados são um pouco comparáveis aos da HP Pavilion 15-eg, que também vem com uma bateria de tamanho semelhante.
A recarga de vazio para cheio leva cerca de 2 horas com o adaptador AC incluído.
| Dell Inspiron 15 3000 3511 i5-1135G7, Iris Xe G7 80EUs, 40 Wh | Dell XPS 15 9510 i5 11400H FHD i5-11400H, UHD Graphics Xe 16EUs, 56 Wh | Asus VivoBook S15 D533UA R7 5700U, Vega 8, 50 Wh | Dell Inspiron 15 3501 i7-1165G7, Iris Xe G7 96EUs, 42 Wh | Lenovo IdeaPad 3 15ALC6 R3 5300U, Vega 6, 45 Wh | HP Pavilion 15-eg i7-1165G7, GeForce MX450, 41 Wh | |
|---|---|---|---|---|---|---|
| Duração da bateria | 16% | 41% | 6% | 48% | 4% | |
| Reader / Idle (h) | 12.8 | 20.1 57% | 15 17% | |||
| WiFi v1.3 (h) | 6.4 | 7.4 16% | 9 41% | 6.8 6% | 10.5 64% | 6.6 3% |
| Load (h) | 1.3 | 1.6 23% | 1.2 -8% |
Pro
Contra
Veredicto
Nosso aspecto favorito do Inspiron 15 3511 é a facilidade com que ele pode ser reparado. Modelos baratos tendem a dissuadir as atualizações do usuário final, tornando seus painéis inferiores difíceis de remover ou escondendo os parafusos sob os pés de borracha. O fato de nosso Inspiron abrigar 2x slots SODIMM e 2x compartimentos de armazenamento significa que os proprietários podem simplesmente comprar uma configuração de baixo custo e depois adicionar mais memória RAM ou armazenamento para economizar nos custos. A RAM de canal único em nossa unidade de teste em particular impacta significativamente a performance gráfica do Iris Xe e por isso é altamente recomendado adicionar outro módulo para aumentar a performance da GPU.
O ruído do ventilador, ou a falta dele, é outro aspecto que vale a pena elogiar. O sistema é capaz de permanecer mais silencioso por mais tempo do que a maioria dos outros Ultrabooks, mesmo quando executando cargas mais exigentes. Lembre-se que o modelo está usando as mesmas CPUs Core i5 e Core i7 do 11º gênero que nas lojas da série XPS 13 pelo dobro do preço.
O Inspiron 15 3511 é talvez um dos laptops de orçamento mais fácil de ser reparado e atualizado. O desempenho por dólar é alto, mas você terá que superar o design de chassi menos que estelar.
Quase tudo o mais sobre o sistema é medíocre devido às cores rasas, teclas de teclado esponjosas e a sensação barata do chassi. Tais inconvenientes são geralmente desculpáveis para um modelo de orçamento, mas ainda achamos incrivelmente estranho não ver uma porta USB-C quando quase todos os outros laptops de consumo estão incluindo um nestes dias.
Preço e Disponibilidade
O Inspiron 15 3511 está agora amplamente disponível online e com muitos SKUs para escolher. Dell está vendendo-o diretamente enquanto Newegg, Amazônia, Melhor compra, e Walmart todos têm SKUs selecionados variando de US$ 349 até mais de US$ 1000, se totalmente configurados.
Dell Inspiron 15 3000 3511
- 01/20/2022 v7 (old)
Allen Ngo
Price comparison

