Breve Análise do Huawei MateBook X Pro 2020 – Portátil compacto com problemas de desempenho
Avaliação | Data | Modelo | Peso | Altura | Size | Resolução | Preço |
|---|---|---|---|---|---|---|---|
| 87.4 % v7 (old) | 06/2020 | Huawei MateBook X Pro 2020 i7 i7-10510U, GeForce MX250 | 1.3 kg | 14.6 mm | 13.90" | 3000x2000 | |
| 88 % v7 (old) | 05/2020 | Dell XPS 13 9300 4K UHD i7-1065G7, Iris Plus Graphics G7 (Ice Lake 64 EU) | 1.2 kg | 14.8 mm | 13.40" | 3840x2400 | |
| 83.7 % v7 (old) | 11/2019 | Razer Blade Stealth 13, Core i7-1065G7 i7-1065G7, GeForce GTX 1650 Max-Q | 1.5 kg | 15.3 mm | 13.30" | 3840x2160 | |
| 92.1 % v7 (old) | 06/2020 | Apple MacBook Pro 13 2020 2GHz i5 10th-Gen i5-1038NG7, Iris Plus Graphics G7 (Ice Lake 64 EU) | 1.4 kg | 15.6 mm | 13.30" | 2560x1600 | |
| 87 % v7 (old) | 01/2020 | Lenovo Yoga C940-14IIL 81Q9 i7-1065G7, Iris Plus Graphics G7 (Ice Lake 64 EU) | 1.4 kg | 15.7 mm | 14.00" | 3840x2160 | |
| 86.8 % v6 (old) | 08/2018 | Huawei MateBook X Pro, i7 i5-8550U, GeForce MX150 | 1.3 kg | 14.6 mm | 13.90" | 3000x2000 |


| |||||||||||||||||||||||||
iluminação: 87 %
iluminação com acumulador: 555 cd/m²
Contraste: 1688:1 (Preto: 0.33 cd/m²)
ΔE ColorChecker Calman: 1.4 | ∀{0.5-29.43 Ø4.72}
calibrated: 0.7
ΔE Greyscale Calman: 2 | ∀{0.09-98 Ø4.97}
99.5% sRGB (Argyll 1.6.3 3D)
62.5% AdobeRGB 1998 (Argyll 1.6.3 3D)
68.6% AdobeRGB 1998 (Argyll 3D)
99.4% sRGB (Argyll 3D)
66.6% Display P3 (Argyll 3D)
Gamma: 2.14
CCT: 6689 K
| Huawei MateBook X Pro 2020 i7 JDI LPM139M422A, LTPS, 3000x2000, 13.9" | Dell XPS 13 9300 4K UHD Sharp LQ134R1, IPS, 3840x2400, 13.4" | Razer Blade Stealth 13, Core i7-1065G7 AUO202B, IPS LED, 3840x2160, 13.3" | Apple MacBook Pro 13 2020 2GHz i5 10th-Gen APPA03D, IPS, 2560x1600, 13.3" | Lenovo Yoga C940-14IIL 81Q9 BOE HF NV140QUM-N54, IPS, 3840x2160, 14" | Huawei MateBook X Pro, i7 JDI LPM139M422A, LTPS, 3000x2000, 13.9" | |
|---|---|---|---|---|---|---|
| Display | -5% | -4% | 25% | 16% | -2% | |
| Display P3 Coverage (%) | 66.6 | 64.5 -3% | 64.3 -3% | 98.8 48% | 83.8 26% | 65.8 -1% |
| sRGB Coverage (%) | 99.4 | 91.4 -8% | 95.8 -4% | 99.9 1% | 99.9 1% | 97.7 -2% |
| AdobeRGB 1998 Coverage (%) | 68.6 | 66.6 -3% | 65.7 -4% | 86.4 26% | 83.3 21% | 67.5 -2% |
| Response Times | 17% | -26% | 1% | 11% | 17% | |
| Response Time Grey 50% / Grey 80% * (ms) | 49.6 ? | 41.6 ? 16% | 62 ? -25% | 46 ? 7% | 44.4 ? 10% | 42 ? 15% |
| Response Time Black / White * (ms) | 30.8 ? | 25.6 ? 17% | 39 ? -27% | 32.4 ? -5% | 27.2 ? 12% | 25 ? 19% |
| PWM Frequency (Hz) | 29070 ? | 113600 ? | ||||
| Screen | -71% | -64% | -8% | -102% | -20% | |
| Brightness middle (cd/m²) | 557 | 414 -26% | 353 -37% | 512 -8% | 501.7 -10% | 550 -1% |
| Brightness (cd/m²) | 532 | 401 -25% | 335 -37% | 491 -8% | 501 -6% | 512 -4% |
| Brightness Distribution (%) | 87 | 94 8% | 90 3% | 91 5% | 82 -6% | 88 1% |
| Black Level * (cd/m²) | 0.33 | 0.28 15% | 0.25 24% | 0.32 3% | 0.32 3% | 0.32 3% |
| Contrast (:1) | 1688 | 1479 -12% | 1412 -16% | 1600 -5% | 1568 -7% | 1719 2% |
| Colorchecker dE 2000 * | 1.4 | 3.06 -119% | 4.4 -214% | 1.7 -21% | 5.48 -291% | 2.28 -63% |
| Colorchecker dE 2000 max. * | 2.5 | 6.5 -160% | 7.21 -188% | 3.4 -36% | 10.03 -301% | 4.36 -74% |
| Colorchecker dE 2000 calibrated * | 0.7 | 3.5 -400% | 1.1 -57% | 1 -43% | 2.22 -217% | 0.8 -14% |
| Greyscale dE 2000 * | 2 | 3 -50% | 5.49 -175% | 1.9 5% | 8.1 -305% | 3.27 -64% |
| Gamma | 2.14 103% | 2.42 91% | 2.26 97% | 2.19 100% | 2.07 106% | 2.35 94% |
| CCT | 6689 97% | 6840 95% | 7689 85% | 6817 95% | 6730 97% | 6819 95% |
| Color Space (Percent of AdobeRGB 1998) (%) | 62.5 | 61.1 -2% | 61 -2% | 77.4 24% | 74.1 19% | 62 -1% |
| Color Space (Percent of sRGB) (%) | 99.5 | 91.4 -8% | 96 -4% | 99.9 0% | 100 1% | 98 -2% |
| Média Total (Programa/Configurações) | -20% /
-48% | -31% /
-48% | 6% /
-0% | -25% /
-66% | -2% /
-12% |
* ... menor é melhor
Exibir tempos de resposta
| ↔ Tempo de resposta preto para branco | ||
|---|---|---|
| 30.8 ms ... ascensão ↗ e queda ↘ combinadas | ↗ 14 ms ascensão | 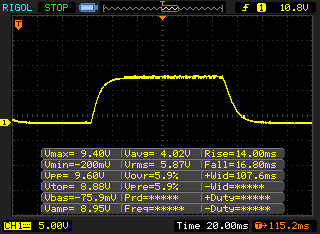 |
| ↘ 16.8 ms queda | ||
| A tela mostra taxas de resposta lentas em nossos testes e será insatisfatória para os jogadores. Em comparação, todos os dispositivos testados variam de 0.1 (mínimo) a 240 (máximo) ms. » 83 % de todos os dispositivos são melhores. Isso significa que o tempo de resposta medido é pior que a média de todos os dispositivos testados (19.8 ms). | ||
| ↔ Tempo de resposta 50% cinza a 80% cinza | ||
| 49.6 ms ... ascensão ↗ e queda ↘ combinadas | ↗ 23.6 ms ascensão | 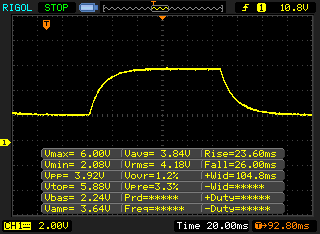 |
| ↘ 26 ms queda | ||
| A tela mostra taxas de resposta lentas em nossos testes e será insatisfatória para os jogadores. Em comparação, todos os dispositivos testados variam de 0.165 (mínimo) a 636 (máximo) ms. » 86 % de todos os dispositivos são melhores. Isso significa que o tempo de resposta medido é pior que a média de todos os dispositivos testados (31 ms). | ||
Cintilação da tela / PWM (modulação por largura de pulso)
| Tela tremeluzindo/PWM detectado | 29070 Hz | ≤ 40 % configuração de brilho | 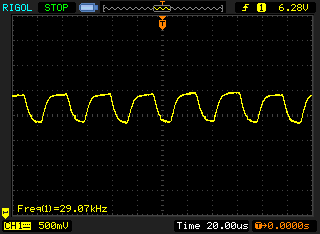 |
A luz de fundo da tela pisca em 29070 Hz (pior caso, por exemplo, utilizando PWM) Cintilação detectada em uma configuração de brilho de 40 % e abaixo. Não deve haver cintilação ou PWM acima desta configuração de brilho. A frequência de 29070 Hz é bastante alta, então a maioria dos usuários sensíveis ao PWM não deve notar nenhuma oscilação. [pwm_comparison] Em comparação: 52 % de todos os dispositivos testados não usam PWM para escurecer a tela. Se PWM foi detectado, uma média de 7763 (mínimo: 5 - máximo: 343500) Hz foi medida. | |||

Cinebench R15: CPU Single 64Bit | CPU Multi 64Bit
Blender: v2.79 BMW27 CPU
7-Zip 18.03: 7z b 4 -mmt1 | 7z b 4
Geekbench 5.5: Single-Core | Multi-Core
HWBOT x265 Benchmark v2.2: 4k Preset
LibreOffice : 20 Documents To PDF
R Benchmark 2.5: Overall mean
| Cinebench R20 / CPU (Single Core) | |
| Média da turma Subnotebook (128 - 832, n=56, últimos 2 anos) | |
| Dell XPS 13 9300 4K UHD | |
| Lenovo Yoga C940-14IIL 81Q9 | |
| Apple MacBook Pro 13 2020 2GHz i5 10th-Gen | |
| Média Intel Core i7-10510U (362 - 497, n=37) | |
| Huawei MateBook X Pro 2020 i7 | |
| Cinebench R20 / CPU (Multi Core) | |
| Média da turma Subnotebook (579 - 8541, n=56, últimos 2 anos) | |
| Apple MacBook Pro 13 2020 2GHz i5 10th-Gen | |
| Lenovo Yoga C940-14IIL 81Q9 | |
| Média Intel Core i7-10510U (1015 - 1897, n=38) | |
| Dell XPS 13 9300 4K UHD | |
| Huawei MateBook X Pro 2020 i7 | |
| Cinebench R15 / CPU Single 64Bit | |
| Média da turma Subnotebook (72.4 - 322, n=56, últimos 2 anos) | |
| Dell XPS 13 9300 4K UHD | |
| Lenovo Yoga C940-14IIL 81Q9 | |
| Média Intel Core i7-10510U (113 - 202, n=42) | |
| Razer Blade Stealth 13, Core i7-1065G7 | |
| Huawei MateBook X Pro 2020 i7 | |
| Apple MacBook Pro 13 2020 2GHz i5 10th-Gen | |
| Huawei MateBook X Pro, i7 | |
| Cinebench R15 / CPU Multi 64Bit | |
| Média da turma Subnotebook (327 - 3345, n=56, últimos 2 anos) | |
| Apple MacBook Pro 13 2020 2GHz i5 10th-Gen | |
| Dell XPS 13 9300 4K UHD | |
| Lenovo Yoga C940-14IIL 81Q9 | |
| Média Intel Core i7-10510U (482 - 856, n=45) | |
| Huawei MateBook X Pro 2020 i7 | |
| Razer Blade Stealth 13, Core i7-1065G7 | |
| Huawei MateBook X Pro, i7 | |
| Blender / v2.79 BMW27 CPU | |
| Huawei MateBook X Pro 2020 i7 | |
| Média Intel Core i7-10510U (628 - 1051, n=31) | |
| Dell XPS 13 9300 4K UHD | |
| Média da turma Subnotebook (159 - 2271, n=57, últimos 2 anos) | |
| Apple MacBook Pro 13 2020 2GHz i5 10th-Gen | |
| 7-Zip 18.03 / 7z b 4 -mmt1 | |
| Média da turma Subnotebook (2643 - 6699, n=58, últimos 2 anos) | |
| Huawei MateBook X Pro 2020 i7 | |
| Média Intel Core i7-10510U (3747 - 4981, n=31) | |
| Dell XPS 13 9300 4K UHD | |
| Apple MacBook Pro 13 2020 2GHz i5 10th-Gen | |
| 7-Zip 18.03 / 7z b 4 | |
| Média da turma Subnotebook (11668 - 77867, n=56, últimos 2 anos) | |
| Dell XPS 13 9300 4K UHD | |
| Apple MacBook Pro 13 2020 2GHz i5 10th-Gen | |
| Média Intel Core i7-10510U (12196 - 21298, n=31) | |
| Huawei MateBook X Pro 2020 i7 | |
| Geekbench 5.5 / Single-Core | |
| Média da turma Subnotebook (726 - 2224, n=47, últimos 2 anos) | |
| Dell XPS 13 9300 4K UHD | |
| Apple MacBook Pro 13 2020 2GHz i5 10th-Gen | |
| Média Intel Core i7-10510U (977 - 1287, n=31) | |
| Huawei MateBook X Pro 2020 i7 | |
| Geekbench 5.5 / Multi-Core | |
| Média da turma Subnotebook (2557 - 17218, n=47, últimos 2 anos) | |
| Dell XPS 13 9300 4K UHD | |
| Apple MacBook Pro 13 2020 2GHz i5 10th-Gen | |
| Média Intel Core i7-10510U (2474 - 4484, n=31) | |
| Huawei MateBook X Pro 2020 i7 | |
| HWBOT x265 Benchmark v2.2 / 4k Preset | |
| Média da turma Subnotebook (0.97 - 25.1, n=56, últimos 2 anos) | |
| Dell XPS 13 9300 4K UHD | |
| Apple MacBook Pro 13 2020 2GHz i5 10th-Gen | |
| Média Intel Core i7-10510U (3.41 - 6.04, n=31) | |
| Huawei MateBook X Pro 2020 i7 | |
| LibreOffice / 20 Documents To PDF | |
| Apple MacBook Pro 13 2020 2GHz i5 10th-Gen | |
| Dell XPS 13 9300 4K UHD | |
| Média Intel Core i7-10510U (50.7 - 77.8, n=27) | |
| Média da turma Subnotebook (39.9 - 220, n=55, últimos 2 anos) | |
| Huawei MateBook X Pro 2020 i7 | |
| R Benchmark 2.5 / Overall mean | |
| Apple MacBook Pro 13 2020 2GHz i5 10th-Gen | |
| Dell XPS 13 9300 4K UHD | |
| Média Intel Core i7-10510U (0.637 - 0.81, n=28) | |
| Huawei MateBook X Pro 2020 i7 | |
| Média da turma Subnotebook (0.4024 - 1.456, n=57, últimos 2 anos) | |
* ... menor é melhor
| PCMark 8 Home Score Accelerated v2 | 3841 pontos | |
| PCMark 8 Creative Score Accelerated v2 | 5617 pontos | |
| PCMark 8 Work Score Accelerated v2 | 4599 pontos | |
| PCMark 10 Score | 3861 pontos | |
Ajuda | ||

| 3DMark 11 Performance | 3963 pontos | |
| 3DMark Ice Storm Standard Score | 40917 pontos | |
| 3DMark Cloud Gate Standard Score | 13104 pontos | |
| 3DMark Fire Strike Score | 2741 pontos | |
| 3DMark Time Spy Score | 980 pontos | |
Ajuda | ||
| baixo | média | alto | ultra | |
|---|---|---|---|---|
| The Witcher 3 (2015) | 52 | 30 | 16.3 | 9 |
| Dota 2 Reborn (2015) | 112 | 92.6 | 59.7 | 52.7 |
| X-Plane 11.11 (2018) | 55.6 | 40.8 | 37.9 | |
| Far Cry 5 (2018) | 38 | 17 | 14 | |
| Shadow of the Tomb Raider (2018) | 38 | 14 |
Barulho
| Ocioso |
| 29.6 / 29.6 / 30.3 dB |
| Carga |
| 38 / 38 dB |
 | ||
30 dB silencioso 40 dB(A) audível 50 dB(A) ruidosamente alto |
||
min: | ||
| Huawei MateBook X Pro 2020 i7 GeForce MX250, i7-10510U, Samsung PM981a MZVLB1T0HBLR | Dell XPS 13 9300 4K UHD Iris Plus Graphics G7 (Ice Lake 64 EU), i7-1065G7, Intel SSDPEMKF512G8 NVMe SSD | Razer Blade Stealth 13, Core i7-1065G7 GeForce GTX 1650 Max-Q, i7-1065G7, Lite-On CA3-8D512 | Apple MacBook Pro 13 2020 2GHz i5 10th-Gen Iris Plus Graphics G7 (Ice Lake 64 EU), i5-1038NG7, Apple SSD SM0512F | Lenovo Yoga C940-14IIL 81Q9 Iris Plus Graphics G7 (Ice Lake 64 EU), i7-1065G7, Samsung PM981a MZVLB1T0HBLR | Huawei MateBook X Pro, i7 GeForce MX150, i5-8550U, Toshiba XG5 KXG50ZNV512G | |
|---|---|---|---|---|---|---|
| Noise | 1% | 1% | 1% | 3% | -3% | |
| desligado / ambiente * (dB) | 29.6 | 29 2% | 30 -1% | 29.6 -0% | 28.5 4% | 30.3 -2% |
| Idle Minimum * (dB) | 29.6 | 29 2% | 30 -1% | 29.6 -0% | 28.5 4% | 30.3 -2% |
| Idle Average * (dB) | 29.6 | 29 2% | 30 -1% | 29.6 -0% | 28.5 4% | 30.3 -2% |
| Idle Maximum * (dB) | 30.3 | 29 4% | 30 1% | 29.6 2% | 29 4% | 31.3 -3% |
| Load Average * (dB) | 38 | 33.5 12% | 33.9 11% | 34.4 9% | 33 13% | 39.3 -3% |
| Witcher 3 ultra * (dB) | 38 | 40.5 -7% | 38.1 -0% | 36.1 5% | 40.7 -7% | |
| Load Maximum * (dB) | 38 | 40.5 -7% | 38.1 -0% | 42.1 -11% | 39.5 -4% | 41.2 -8% |
* ... menor é melhor
(±) A temperatura máxima no lado superior é 44.7 °C / 112 F, em comparação com a média de 35.9 °C / 97 F , variando de 21.4 a 59 °C para a classe Subnotebook.
(±) A parte inferior aquece até um máximo de 42.6 °C / 109 F, em comparação com a média de 39.2 °C / 103 F
(+) Em uso inativo, a temperatura média para o lado superior é 26.5 °C / 80 F, em comparação com a média do dispositivo de 30.8 °C / ### class_avg_f### F.
(-) Jogando The Witcher 3, a temperatura média para o lado superior é 41.7 °C / 107 F, em comparação com a média do dispositivo de 30.8 °C / ## #class_avg_f### F.
(+) Os apoios para as mãos e o touchpad estão atingindo a temperatura máxima da pele (34.8 °C / 94.6 F) e, portanto, não estão quentes.
(-) A temperatura média da área do apoio para as mãos de dispositivos semelhantes foi 28.2 °C / 82.8 F (-6.6 °C / -11.8 F).
Huawei MateBook X Pro 2020 i7 análise de áudio
(±) | o volume do alto-falante é médio, mas bom (###valor### dB)
Graves 100 - 315Hz
(±) | graves reduzidos - em média 12.8% menor que a mediana
(±) | a linearidade dos graves é média (9.7% delta para a frequência anterior)
Médios 400 - 2.000 Hz
(±) | médios mais altos - em média 6.1% maior que a mediana
(+) | médios são lineares (4.8% delta para frequência anterior)
Altos 2 - 16 kHz
(±) | máximos mais altos - em média 5.2% maior que a mediana
(+) | os máximos são lineares (5.9% delta da frequência anterior)
Geral 100 - 16.000 Hz
(±) | a linearidade do som geral é média (20.2% diferença em relação à mediana)
Comparado com a mesma classe
» 64% de todos os dispositivos testados nesta classe foram melhores, 9% semelhantes, 27% piores
» O melhor teve um delta de 5%, a média foi 18%, o pior foi 53%
Comparado com todos os dispositivos testados
» 52% de todos os dispositivos testados foram melhores, 8% semelhantes, 39% piores
» O melhor teve um delta de 4%, a média foi 23%, o pior foi 134%
Lenovo Yoga C940-14IIL 81Q9 análise de áudio
(+) | os alto-falantes podem tocar relativamente alto (###valor### dB)
Graves 100 - 315Hz
(±) | graves reduzidos - em média 11.2% menor que a mediana
(±) | a linearidade dos graves é média (10.9% delta para a frequência anterior)
Médios 400 - 2.000 Hz
(+) | médios equilibrados - apenas 2.2% longe da mediana
(+) | médios são lineares (3.2% delta para frequência anterior)
Altos 2 - 16 kHz
(±) | máximos reduzidos - em média 6% menor que a mediana
(±) | a linearidade dos máximos é média (8.9% delta para frequência anterior)
Geral 100 - 16.000 Hz
(+) | o som geral é linear (14.9% diferença em relação à mediana)
Comparado com a mesma classe
» 24% de todos os dispositivos testados nesta classe foram melhores, 5% semelhantes, 72% piores
» O melhor teve um delta de 6%, a média foi 20%, o pior foi 57%
Comparado com todos os dispositivos testados
» 20% de todos os dispositivos testados foram melhores, 4% semelhantes, 76% piores
» O melhor teve um delta de 4%, a média foi 23%, o pior foi 134%
| desligado | |
| Ocioso | |
| Carga |
|
Key:
min: | |
| Huawei MateBook X Pro 2020 i7 i7-10510U, GeForce MX250, Samsung PM981a MZVLB1T0HBLR, LTPS, 3000x2000, 13.9" | Dell XPS 13 9300 4K UHD i7-1065G7, Iris Plus Graphics G7 (Ice Lake 64 EU), Intel SSDPEMKF512G8 NVMe SSD, IPS, 3840x2400, 13.4" | Razer Blade Stealth 13, Core i7-1065G7 i7-1065G7, GeForce GTX 1650 Max-Q, Lite-On CA3-8D512, IPS LED, 3840x2160, 13.3" | Apple MacBook Pro 13 2020 2GHz i5 10th-Gen i5-1038NG7, Iris Plus Graphics G7 (Ice Lake 64 EU), Apple SSD SM0512F, IPS, 2560x1600, 13.3" | Lenovo Yoga C940-14IIL 81Q9 i7-1065G7, Iris Plus Graphics G7 (Ice Lake 64 EU), Samsung PM981a MZVLB1T0HBLR, IPS, 3840x2160, 14" | Huawei MateBook X Pro, i7 i5-8550U, GeForce MX150, Toshiba XG5 KXG50ZNV512G, LTPS, 3000x2000, 13.9" | Média NVIDIA GeForce MX250 | Média da turma Subnotebook | |
|---|---|---|---|---|---|---|---|---|
| Power Consumption | 8% | -50% | 4% | -9% | 14% | 1% | 18% | |
| Idle Minimum * (Watt) | 4.3 | 5.3 -23% | 10.7 -149% | 3.8 12% | 5.6 -30% | 4.7 -9% | 4.1 ? 5% | 3.78 ? 12% |
| Idle Average * (Watt) | 8.5 | 7.8 8% | 13.6 -60% | 8.6 -1% | 10.5 -24% | 8.7 -2% | 7.91 ? 7% | 6.57 ? 23% |
| Idle Maximum * (Watt) | 12 | 9.8 18% | 15.7 -31% | 10.3 14% | 12 -0% | 9.8 18% | 10.4 ? 13% | 7.94 ? 34% |
| Load Average * (Watt) | 54.8 | 46 16% | 60 -9% | 52.1 5% | 53.3 3% | 39.4 28% | 58.6 ? -7% | 41.9 ? 24% |
| Witcher 3 ultra * (Watt) | 47.1 | 43 9% | 64 -36% | 48.2 -2% | 46.9 -0% | |||
| Load Maximum * (Watt) | 61.5 | 48.3 21% | 71 -15% | 65.2 -6% | 64.6 -5% | 40.4 34% | 68.9 ? -12% | 64.4 ? -5% |
* ... menor é melhor
| Huawei MateBook X Pro 2020 i7 i7-10510U, GeForce MX250, 57.4 Wh | Dell XPS 13 9300 4K UHD i7-1065G7, Iris Plus Graphics G7 (Ice Lake 64 EU), 52 Wh | Razer Blade Stealth 13, Core i7-1065G7 i7-1065G7, GeForce GTX 1650 Max-Q, 53.1 Wh | Apple MacBook Pro 13 2020 2GHz i5 10th-Gen i5-1038NG7, Iris Plus Graphics G7 (Ice Lake 64 EU), 58 Wh | Lenovo Yoga C940-14IIL 81Q9 i7-1065G7, Iris Plus Graphics G7 (Ice Lake 64 EU), 60 Wh | Huawei MateBook X Pro, i7 i5-8550U, GeForce MX150, 57 Wh | Média da turma Subnotebook | |
|---|---|---|---|---|---|---|---|
| Duração da bateria | 10% | -38% | 7% | -30% | -6% | 15% | |
| H.264 (h) | 11.9 | 6.3 -47% | 11.5 -3% | 15.4 ? 29% | |||
| WiFi v1.3 (h) | 10.4 | 11.4 10% | 5.5 -47% | 12.1 16% | 7.3 -30% | 8.4 -19% | 14 ? 35% |
| Load (h) | 2.4 | 1.9 -21% | 2.6 8% | 1.969 ? -18% |
Pro
Contra
Veredicto – O desempenho pobre impede uma melhor pontuação
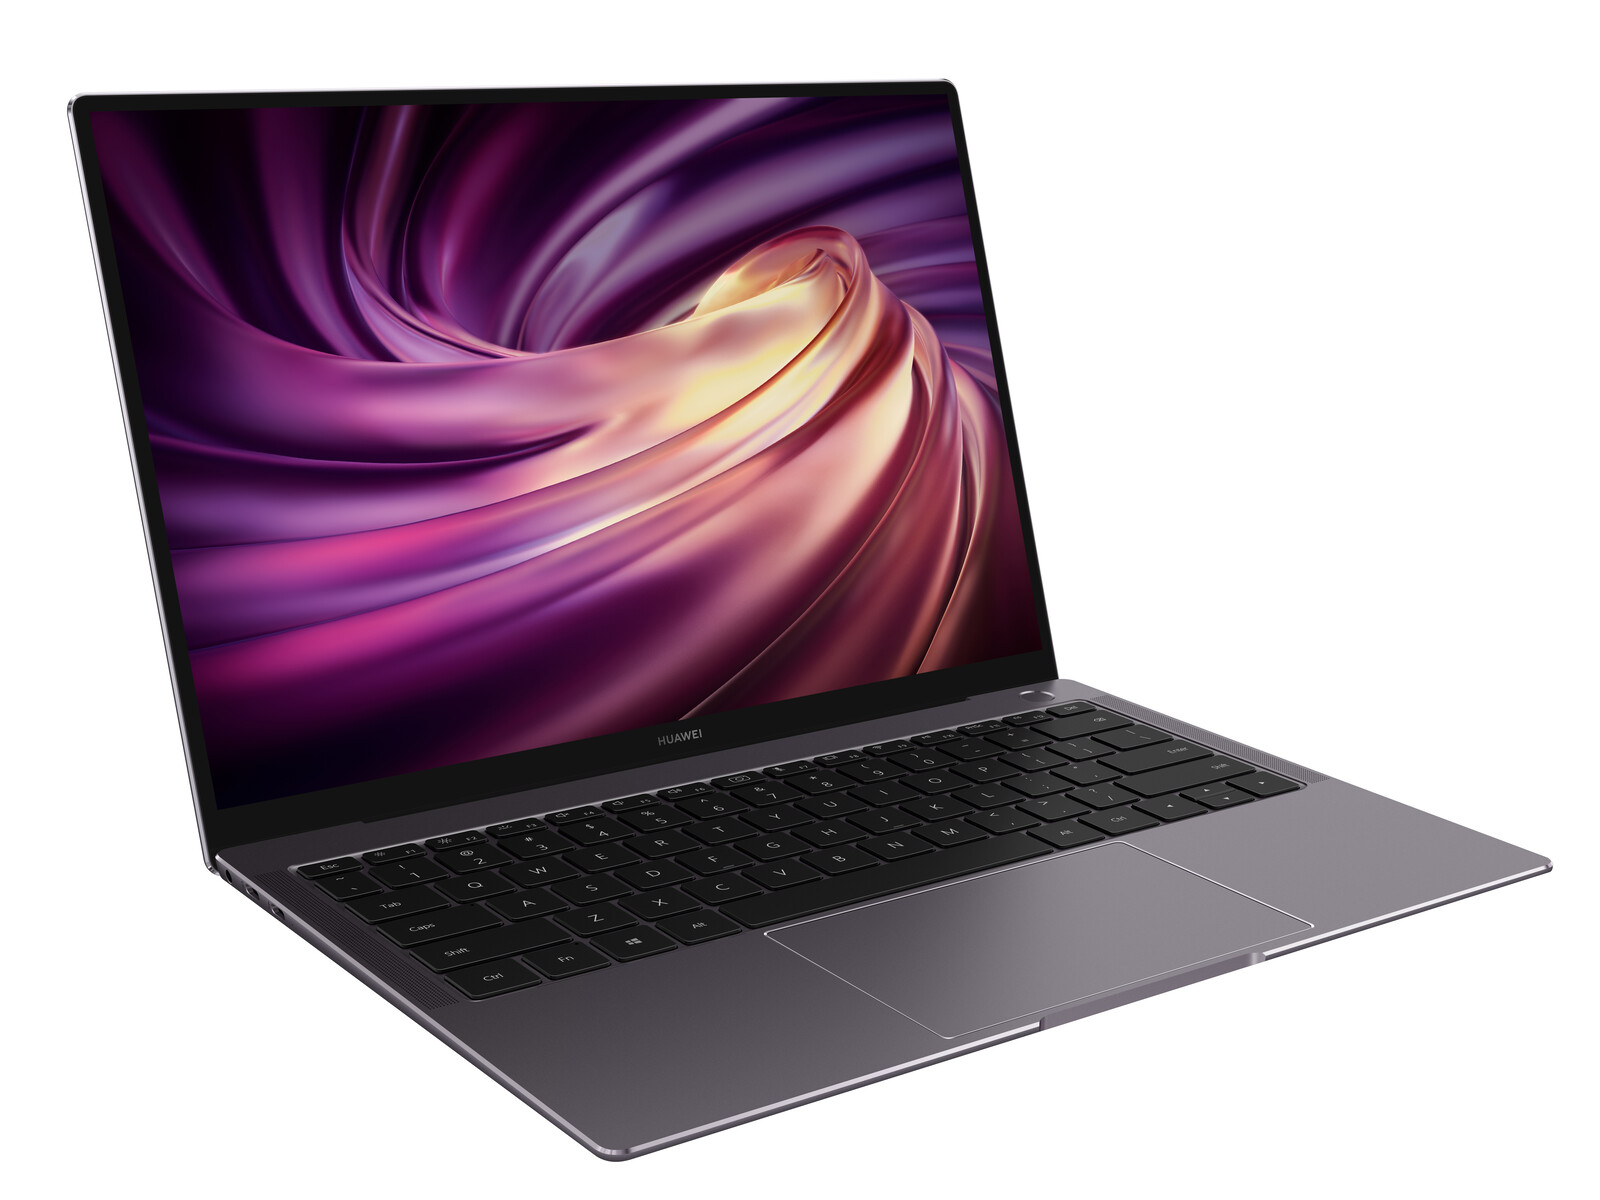
Depois de analisar a revisão de 2020 do MateBook X Pro ficamos com a impressão de que a Huawei simplesmente transplantou novos e melhores componentes de em um design já existente sem pensar muito na otimização e ajustes finos. Não temos outra explicação do porquê a CPU se desempenhou ainda pior que no seu antecessor de dois anos atrás, e porque a GPU permaneceu abaixo de suas capacidades. Comparando o dispositivo com GPUs integrados modernos que cominar um processador ULV com uma GPU dedicada de nível de entrada se tornou um ponto de controvérsia, e optar por uma CPU Ice Lake da Intel com sua GPU G7 integrada teria sido uma escolha muito melhor. Isso não somente teria eliminado alguns componentes, também teria melhorado e otimizado o resfriamento muito mais facilmente. Embora o desempenho ainda seja adequado para um subportátil compacto você deve considerar que os concorrentes do MateBook X Pro conseguem alcançar o mesmo nível de desempenho sem gráficos dedicados.
As boas notícias são que esses são os únicos pontos negativos que temos Em todos os outros aspectos, o subportátil da Huawei deixou uma boa impressão, começando com a bela e bem feita carcaça de alumínio de alta qualidade, a tela de alta resolução (embora sua usabilidade em exteriores tenha sido um pouco limitada por causa de sua superfície muito refletiva), e a duração mais que adequada da bateria.
Apesar do fato de que o desempenho de sua CPU tenha sido um pouco pobre o MateBook X Pro continua sendo um subportátil decente. Você pode optar com confiança pelo modelo Core i5 mais barato. Suas diversas qualidades incluem, entre outras coisas, a bela carcaça e a excelente tela.
A 1.600 Euros (~$1.806) o MateBook X Pro não é uma barganha, e simplesmente não podemos entender porque e como a Huawei não notou os problemas de desempenho durante seu desenvolvimento No entanto, a experiência na vida real envolve mais do que apenas desempenho, e considerando tudo o dispositivo merece nossa recomendação. Porém, você pode riscar o processador Core i7 da sua lista de desejos com confiança pois não consegue melhorar o desempenho.
Huawei MateBook X Pro 2020 i7
- 06/03/2020 v7 (old)
Andreas Osthoff
Price comparison
