Breve Análise do Razer Blade Stealth (GTX 1650 Max-Q): Desempenho da Tela 4K, duração da bateria e CPU decepcionantes
Avaliação | Data | Modelo | Peso | Altura | Size | Resolução | Preço |
|---|---|---|---|---|---|---|---|
| 83.7 % v7 (old) | 11/2019 | Razer Blade Stealth 13, Core i7-1065G7 i7-1065G7, GeForce GTX 1650 Max-Q | 1.5 kg | 15.3 mm | 13.30" | 3840x2160 | |
| 86.3 % v7 (old) | 10/2019 | Dell XPS 13 7390 2-in-1 Core i7 i7-1065G7, Iris Plus Graphics G7 (Ice Lake 64 EU) | 1.3 kg | 13 mm | 13.40" | 1920x1200 | |
| 88.2 % v7 (old) | 10/2019 | Lenovo Yoga C940-14IIL i7-1065G7, Iris Plus Graphics G7 (Ice Lake 64 EU) | 1.4 kg | 14.95 mm | 14.00" | 1920x1080 | |
| 86.3 % v7 (old) | 10/2019 | Razer Blade Stealth i7-1065G7 Iris Plus i7-1065G7, Iris Plus Graphics G7 (Ice Lake 64 EU) | 1.4 kg | 15.3 mm | 13.30" | 1920x1080 |

| |||||||||||||||||||||||||
iluminação: 90 %
iluminação com acumulador: 353 cd/m²
Contraste: 1412:1 (Preto: 0.25 cd/m²)
ΔE ColorChecker Calman: 4.4 | ∀{0.5-29.43 Ø4.73}
calibrated: 1.1
ΔE Greyscale Calman: 5.49 | ∀{0.09-98 Ø4.97}
96% sRGB (Argyll 1.6.3 3D)
61% AdobeRGB 1998 (Argyll 1.6.3 3D)
65.7% AdobeRGB 1998 (Argyll 3D)
95.8% sRGB (Argyll 3D)
64.3% Display P3 (Argyll 3D)
Gamma: 2.26
CCT: 7689 K
| Razer Blade Stealth 13, Core i7-1065G7 AUO202B, IPS LED, 3840x2160, 13.3" | Dell XPS 13 7390 2-in-1 Core i7 Sharp LQ134N1, IPS, 1920x1200, 13.4" | Lenovo Yoga C940-14IIL LP140WF9-SPE2, IPS LED, 1920x1080, 14" | Razer Blade Stealth i7-1065G7 Iris Plus Sharp LQ133M1JW41, IPS, 1920x1080, 13.3" | |
|---|---|---|---|---|
| Display | 7% | 2% | 2% | |
| Display P3 Coverage (%) | 64.3 | 69.9 9% | 66 3% | 66.2 3% |
| sRGB Coverage (%) | 95.8 | 99.2 4% | 97.9 2% | 97.2 1% |
| AdobeRGB 1998 Coverage (%) | 65.7 | 71.5 9% | 67.3 2% | 67.1 2% |
| Response Times | 24% | 22% | 21% | |
| Response Time Grey 50% / Grey 80% * (ms) | 62 ? | 47.6 ? 23% | 49.6 ? 20% | 45.2 ? 27% |
| Response Time Black / White * (ms) | 39 ? | 29.2 ? 25% | 30 ? 23% | 33.2 ? 15% |
| PWM Frequency (Hz) | 2500 ? | 22730 ? | ||
| Screen | 17% | 17% | 20% | |
| Brightness middle (cd/m²) | 353 | 549.8 56% | 384 9% | 422.6 20% |
| Brightness (cd/m²) | 335 | 520 55% | 363 8% | 404 21% |
| Brightness Distribution (%) | 90 | 86 -4% | 90 0% | 87 -3% |
| Black Level * (cd/m²) | 0.25 | 0.39 -56% | 0.17 32% | 0.35 -40% |
| Contrast (:1) | 1412 | 1410 0% | 2259 60% | 1207 -15% |
| Colorchecker dE 2000 * | 4.4 | 2.12 52% | 3.5 20% | 1.02 77% |
| Colorchecker dE 2000 max. * | 7.21 | 3.66 49% | 5.5 24% | 3.06 58% |
| Colorchecker dE 2000 calibrated * | 1.1 | 1.37 -25% | 1 9% | 0.95 14% |
| Greyscale dE 2000 * | 5.49 | 2.6 53% | 4.6 16% | 1 82% |
| Gamma | 2.26 97% | 2.3 96% | 2.32 95% | 2.21 100% |
| CCT | 7689 85% | 6884 94% | 6884 94% | 6502 100% |
| Color Space (Percent of AdobeRGB 1998) (%) | 61 | 65.4 7% | 62 2% | 62.1 2% |
| Color Space (Percent of sRGB) (%) | 96 | 99.7 4% | 97.7 2% | 97.1 1% |
| Média Total (Programa/Configurações) | 16% /
16% | 14% /
15% | 14% /
17% |
* ... menor é melhor
Exibir tempos de resposta
| ↔ Tempo de resposta preto para branco | ||
|---|---|---|
| 39 ms ... ascensão ↗ e queda ↘ combinadas | ↗ 24 ms ascensão | 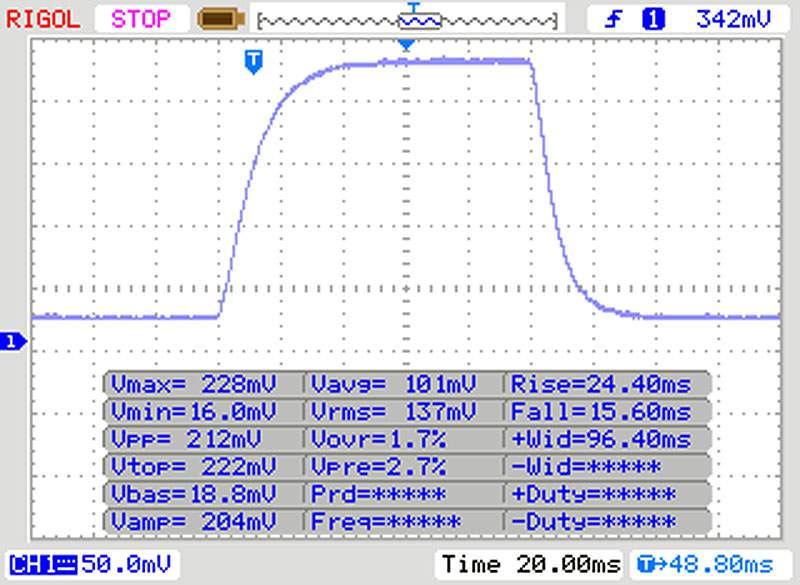 |
| ↘ 15 ms queda | ||
| A tela mostra taxas de resposta lentas em nossos testes e será insatisfatória para os jogadores. Em comparação, todos os dispositivos testados variam de 0.1 (mínimo) a 240 (máximo) ms. » 97 % de todos os dispositivos são melhores. Isso significa que o tempo de resposta medido é pior que a média de todos os dispositivos testados (19.9 ms). | ||
| ↔ Tempo de resposta 50% cinza a 80% cinza | ||
| 62 ms ... ascensão ↗ e queda ↘ combinadas | ↗ 30 ms ascensão | 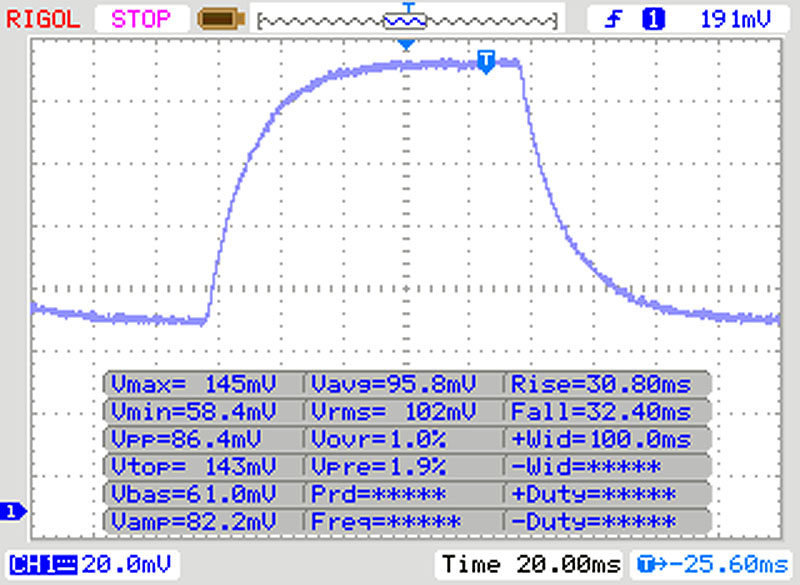 |
| ↘ 32 ms queda | ||
| A tela mostra taxas de resposta lentas em nossos testes e será insatisfatória para os jogadores. Em comparação, todos os dispositivos testados variam de 0.165 (mínimo) a 636 (máximo) ms. » 97 % de todos os dispositivos são melhores. Isso significa que o tempo de resposta medido é pior que a média de todos os dispositivos testados (31.1 ms). | ||
Cintilação da tela / PWM (modulação por largura de pulso)
| Tela tremeluzindo / PWM não detectado | 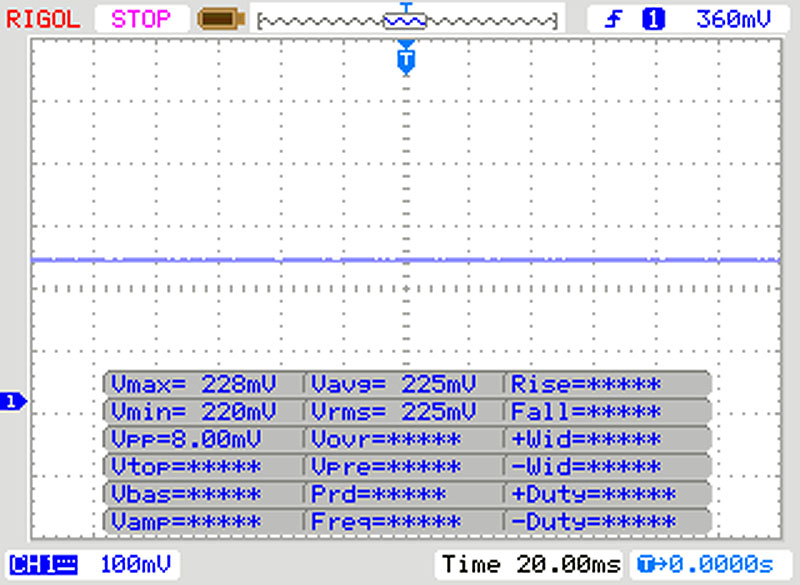 | ||
[pwm_comparison] Em comparação: 52 % de todos os dispositivos testados não usam PWM para escurecer a tela. Se PWM foi detectado, uma média de 7798 (mínimo: 5 - máximo: 343500) Hz foi medida. | |||
| PCMark 8 Home Score Accelerated v2 | 3029 pontos | |
| PCMark 8 Work Score Accelerated v2 | 4099 pontos | |
| PCMark 10 Score | 4484 pontos | |
Ajuda | ||
| Razer Blade Stealth 13, Core i7-1065G7 Lite-On CA3-8D512 | Dell XPS 13 7390 2-in-1 Core i7 Toshiba BG4 KBG40ZPZ512G | Lenovo Yoga C940-14IIL Samsung SSD PM981 MZVLB512HAJQ | Razer Blade Stealth i7-1065G7 Iris Plus Samsung SSD PM981 MZVLB256HAHQ | Média Lite-On CA3-8D512 | |
|---|---|---|---|---|---|
| CrystalDiskMark 5.2 / 6 | -22% | 1% | -10% | 0% | |
| Write 4K (MB/s) | 153 | 106.7 -30% | 128.4 -16% | 176.8 16% | 153 ? 0% |
| Read 4K (MB/s) | 59.5 | 49.94 -16% | 46.37 -22% | 48.38 -19% | 59.5 ? 0% |
| Write Seq (MB/s) | 1608 | 1223 -24% | 1863 16% | 1332 -17% | 1608 ? 0% |
| Read Seq (MB/s) | 2293 | 1801 -21% | 2340 2% | 1644 -28% | 2293 ? 0% |
| Write 4K Q32T1 (MB/s) | 497 | 325.3 -35% | 451.1 -9% | 440.6 -11% | 497 ? 0% |
| Read 4K Q32T1 (MB/s) | 544 | 551 1% | 415.3 -24% | 559 3% | 544 ? 0% |
| Write Seq Q32T1 (MB/s) | 1640 | 1224 -25% | 2985 82% | 1104 -33% | 1640 ? 0% |
| Read Seq Q32T1 (MB/s) | 3158 | 2350 -26% | 2565 -19% | 3481 10% | 3158 ? 0% |

| 3DMark 11 Performance | 9381 pontos | |
| 3DMark Time Spy Score | 2859 pontos | |
Ajuda | ||
| The Witcher 3 - 1920x1080 High Graphics & Postprocessing (Nvidia HairWorks Off) | |
| Dell XPS 15 7590 9980HK GTX 1650 | |
| Média NVIDIA GeForce GTX 1650 Max-Q (41.5 - 65.1, n=11) | |
| Média da turma Subnotebook (25.6 - 64, n=14, últimos 2 anos) | |
| Razer Blade Stealth 13, Core i7-1065G7 | |
| Razer Blade Stealth i7-1065G7 Iris Plus | |
| baixo | média | alto | ultra | 4K | |
|---|---|---|---|---|---|
| BioShock Infinite (2013) | 230.7 | 186.6 | 169.3 | 70.3 | |
| The Witcher 3 (2015) | 137.5 | 84.9 | 46.3 | 27.5 | 17.5 |
| Rise of the Tomb Raider (2016) | 134.6 | 93 | 50.9 | 41.7 | 18.3 |
Barulho
| Ocioso |
| 30 / 30 / 30 dB |
| Carga |
| 33.9 / 38.1 dB |
 | ||
30 dB silencioso 40 dB(A) audível 50 dB(A) ruidosamente alto |
||
min: | ||
(-) A temperatura máxima no lado superior é 46.9 °C / 116 F, em comparação com a média de 35.9 °C / 97 F , variando de 21.4 a 59 °C para a classe Subnotebook.
(-) A parte inferior aquece até um máximo de 46.3 °C / 115 F, em comparação com a média de 39.2 °C / 103 F
(±) Em uso inativo, a temperatura média para o lado superior é 32 °C / 90 F, em comparação com a média do dispositivo de 30.8 °C / ### class_avg_f### F.
(±) Jogando The Witcher 3, a temperatura média para o lado superior é 35.7 °C / 96 F, em comparação com a média do dispositivo de 30.8 °C / ## #class_avg_f### F.
(+) Os apoios para as mãos e o touchpad estão atingindo a temperatura máxima da pele (35.3 °C / 95.5 F) e, portanto, não estão quentes.
(-) A temperatura média da área do apoio para as mãos de dispositivos semelhantes foi 28.2 °C / 82.8 F (-7.1 °C / -12.7 F).
Razer Blade Stealth 13, Core i7-1065G7 análise de áudio
(-) | alto-falantes não muito altos (###valor### dB)
Graves 100 - 315Hz
(±) | graves reduzidos - em média 14.1% menor que a mediana
(±) | a linearidade dos graves é média (13.6% delta para a frequência anterior)
Médios 400 - 2.000 Hz
(±) | médios mais altos - em média 6.2% maior que a mediana
(±) | a linearidade dos médios é média (7.2% delta para frequência anterior)
Altos 2 - 16 kHz
(+) | agudos equilibrados - apenas 1.5% longe da mediana
(+) | os máximos são lineares (5% delta da frequência anterior)
Geral 100 - 16.000 Hz
(±) | a linearidade do som geral é média (18.2% diferença em relação à mediana)
Comparado com a mesma classe
» 52% de todos os dispositivos testados nesta classe foram melhores, 7% semelhantes, 41% piores
» O melhor teve um delta de 5%, a média foi 18%, o pior foi 53%
Comparado com todos os dispositivos testados
» 39% de todos os dispositivos testados foram melhores, 8% semelhantes, 53% piores
» O melhor teve um delta de 4%, a média foi 24%, o pior foi 134%
Dell XPS 13 7390 2-in-1 Core i7 análise de áudio
(±) | o volume do alto-falante é médio, mas bom (###valor### dB)
Graves 100 - 315Hz
(±) | graves reduzidos - em média 7.8% menor que a mediana
(±) | a linearidade dos graves é média (12.5% delta para a frequência anterior)
Médios 400 - 2.000 Hz
(+) | médios equilibrados - apenas 4.5% longe da mediana
(+) | médios são lineares (6.2% delta para frequência anterior)
Altos 2 - 16 kHz
(+) | agudos equilibrados - apenas 3.4% longe da mediana
(±) | a linearidade dos máximos é média (10.5% delta para frequência anterior)
Geral 100 - 16.000 Hz
(+) | o som geral é linear (14.8% diferença em relação à mediana)
Comparado com a mesma classe
» 23% de todos os dispositivos testados nesta classe foram melhores, 4% semelhantes, 72% piores
» O melhor teve um delta de 6%, a média foi 20%, o pior foi 57%
Comparado com todos os dispositivos testados
» 20% de todos os dispositivos testados foram melhores, 4% semelhantes, 76% piores
» O melhor teve um delta de 4%, a média foi 24%, o pior foi 134%
Lenovo Yoga C940-14IIL análise de áudio
(±) | o volume do alto-falante é médio, mas bom (###valor### dB)
Graves 100 - 315Hz
(±) | graves reduzidos - em média 6% menor que a mediana
(±) | a linearidade dos graves é média (9.9% delta para a frequência anterior)
Médios 400 - 2.000 Hz
(+) | médios equilibrados - apenas 3.9% longe da mediana
(+) | médios são lineares (3.6% delta para frequência anterior)
Altos 2 - 16 kHz
(±) | máximos reduzidos - em média 7.6% menor que a mediana
(+) | os máximos são lineares (6.1% delta da frequência anterior)
Geral 100 - 16.000 Hz
(±) | a linearidade do som geral é média (16.9% diferença em relação à mediana)
Comparado com a mesma classe
» 31% de todos os dispositivos testados nesta classe foram melhores, 7% semelhantes, 61% piores
» O melhor teve um delta de 6%, a média foi 20%, o pior foi 57%
Comparado com todos os dispositivos testados
» 30% de todos os dispositivos testados foram melhores, 8% semelhantes, 62% piores
» O melhor teve um delta de 4%, a média foi 24%, o pior foi 134%
| desligado | |
| Ocioso | |
| Carga |
|
Key:
min: | |
| Razer Blade Stealth 13, Core i7-1065G7 i7-1065G7, GeForce GTX 1650 Max-Q, Lite-On CA3-8D512, IPS LED, 3840x2160, 13.3" | Dell XPS 13 7390 2-in-1 Core i7 i7-1065G7, Iris Plus Graphics G7 (Ice Lake 64 EU), Toshiba BG4 KBG40ZPZ512G, IPS, 1920x1200, 13.4" | Lenovo Yoga C940-14IIL i7-1065G7, Iris Plus Graphics G7 (Ice Lake 64 EU), Samsung SSD PM981 MZVLB512HAJQ, IPS LED, 1920x1080, 14" | Razer Blade Stealth i7-1065G7 Iris Plus i7-1065G7, Iris Plus Graphics G7 (Ice Lake 64 EU), Samsung SSD PM981 MZVLB256HAHQ, IPS, 1920x1080, 13.3" | Média NVIDIA GeForce GTX 1650 Max-Q | Média da turma Subnotebook | |
|---|---|---|---|---|---|---|
| Power Consumption | 47% | 39% | 34% | -8% | 41% | |
| Idle Minimum * (Watt) | 10.7 | 2.6 76% | 3.2 70% | 5.9 45% | 7.75 ? 28% | 3.79 ? 65% |
| Idle Average * (Watt) | 13.6 | 5.3 61% | 7 49% | 8.1 40% | 11.8 ? 13% | 6.57 ? 52% |
| Idle Maximum * (Watt) | 15.7 | 7 55% | 8.9 43% | 11.2 29% | 16.6 ? -6% | 7.94 ? 49% |
| Load Average * (Watt) | 60 | 43.1 28% | 47.6 21% | 44.3 26% | 75.2 ? -25% | 41.8 ? 30% |
| Witcher 3 ultra * (Watt) | 64 | 43.1 33% | 41.9 35% | |||
| Load Maximum * (Watt) | 71 | 49 31% | 63.1 11% | 50.2 29% | 105.5 ? -49% | 64.1 ? 10% |
* ... menor é melhor
| Razer Blade Stealth 13, Core i7-1065G7 i7-1065G7, GeForce GTX 1650 Max-Q, 53.1 Wh | Dell XPS 13 7390 2-in-1 Core i7 i7-1065G7, Iris Plus Graphics G7 (Ice Lake 64 EU), 51 Wh | Lenovo Yoga C940-14IIL i7-1065G7, Iris Plus Graphics G7 (Ice Lake 64 EU), 60 Wh | Razer Blade Stealth i7-1065G7 Iris Plus i7-1065G7, Iris Plus Graphics G7 (Ice Lake 64 EU), 53.1 Wh | Média da turma Subnotebook | |
|---|---|---|---|---|---|
| Duração da bateria | 64% | 54% | 76% | 138% | |
| Reader / Idle (h) | 8.3 | 28.6 ? 245% | |||
| H.264 (h) | 6.3 | 13.2 110% | 15.6 ? 148% | ||
| WiFi v1.3 (h) | 5.5 | 9 64% | 10.6 93% | 9.7 76% | 14 ? 155% |
| Load (h) | 1.9 | 1.1 -42% | 1.946 ? 2% |
Pro
Contra
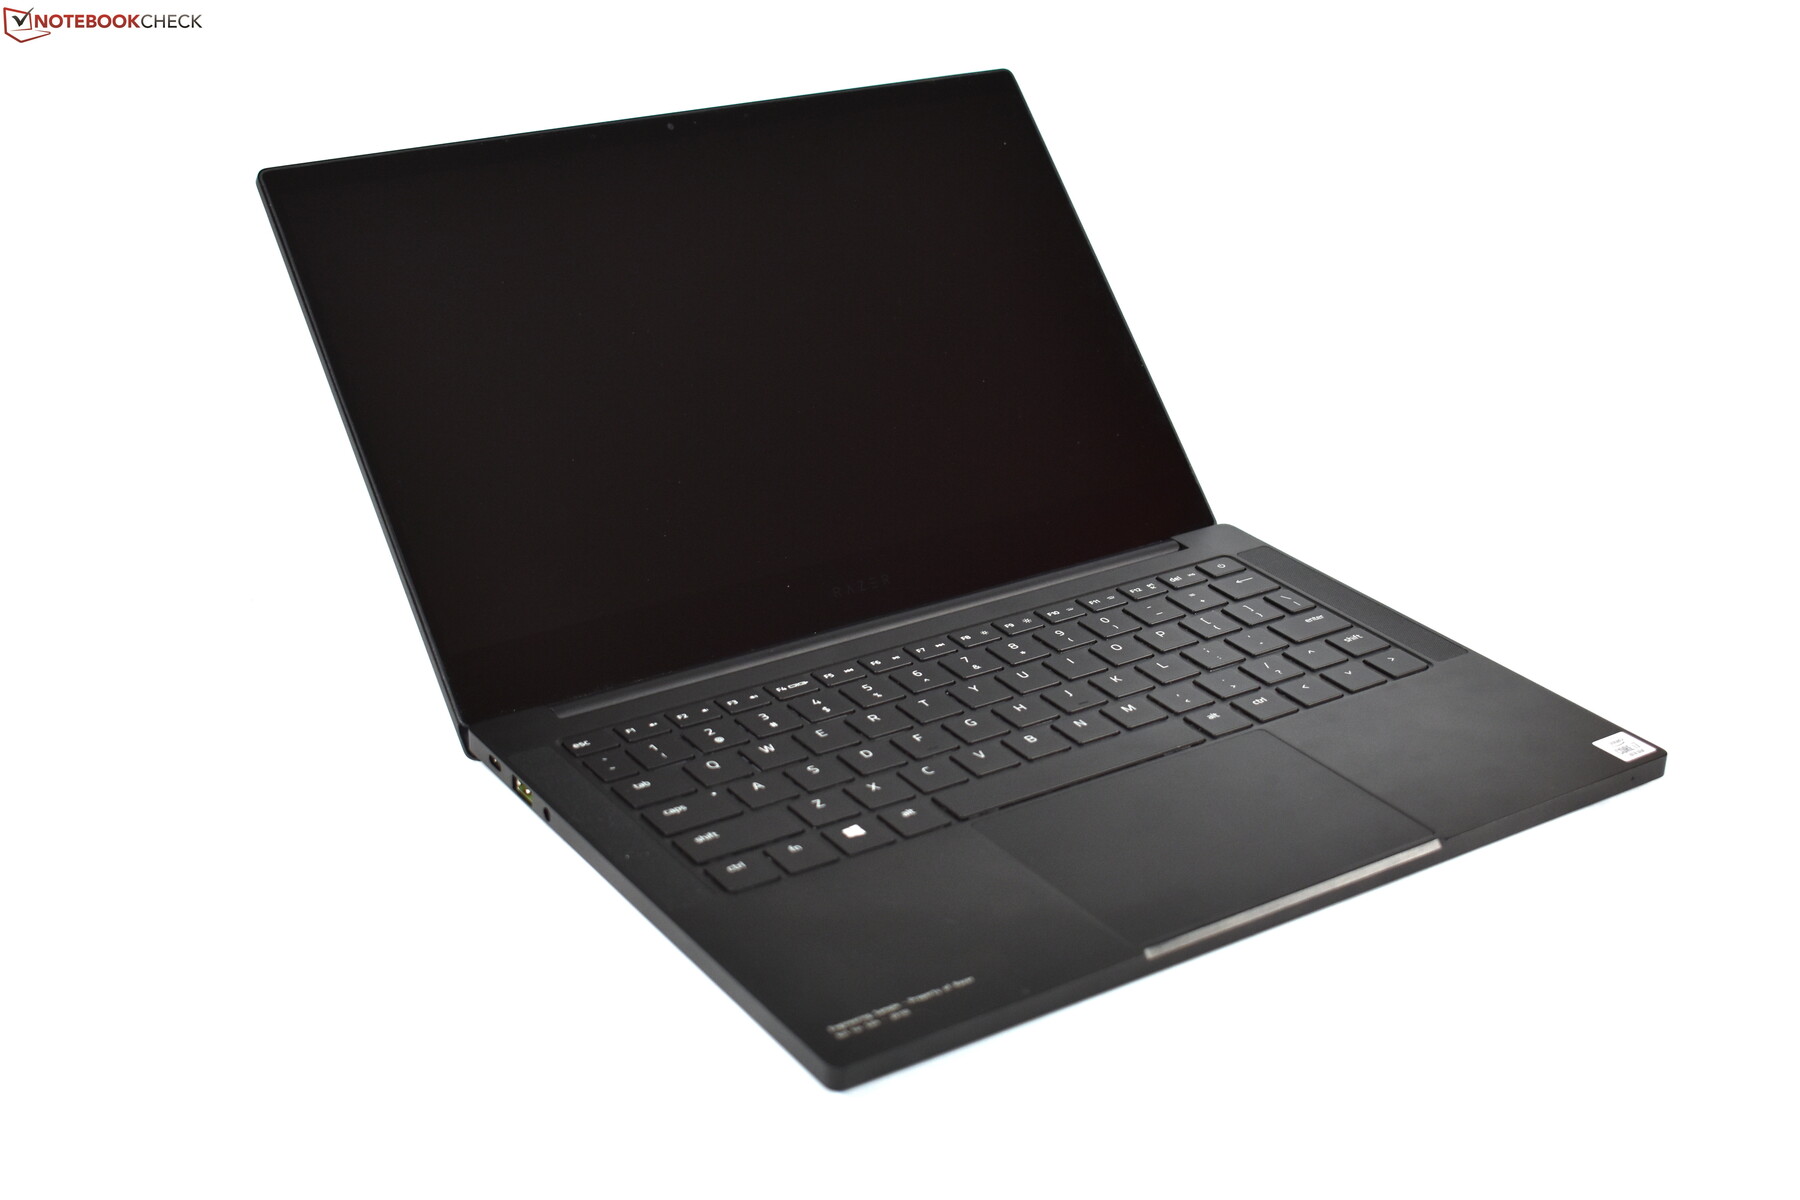
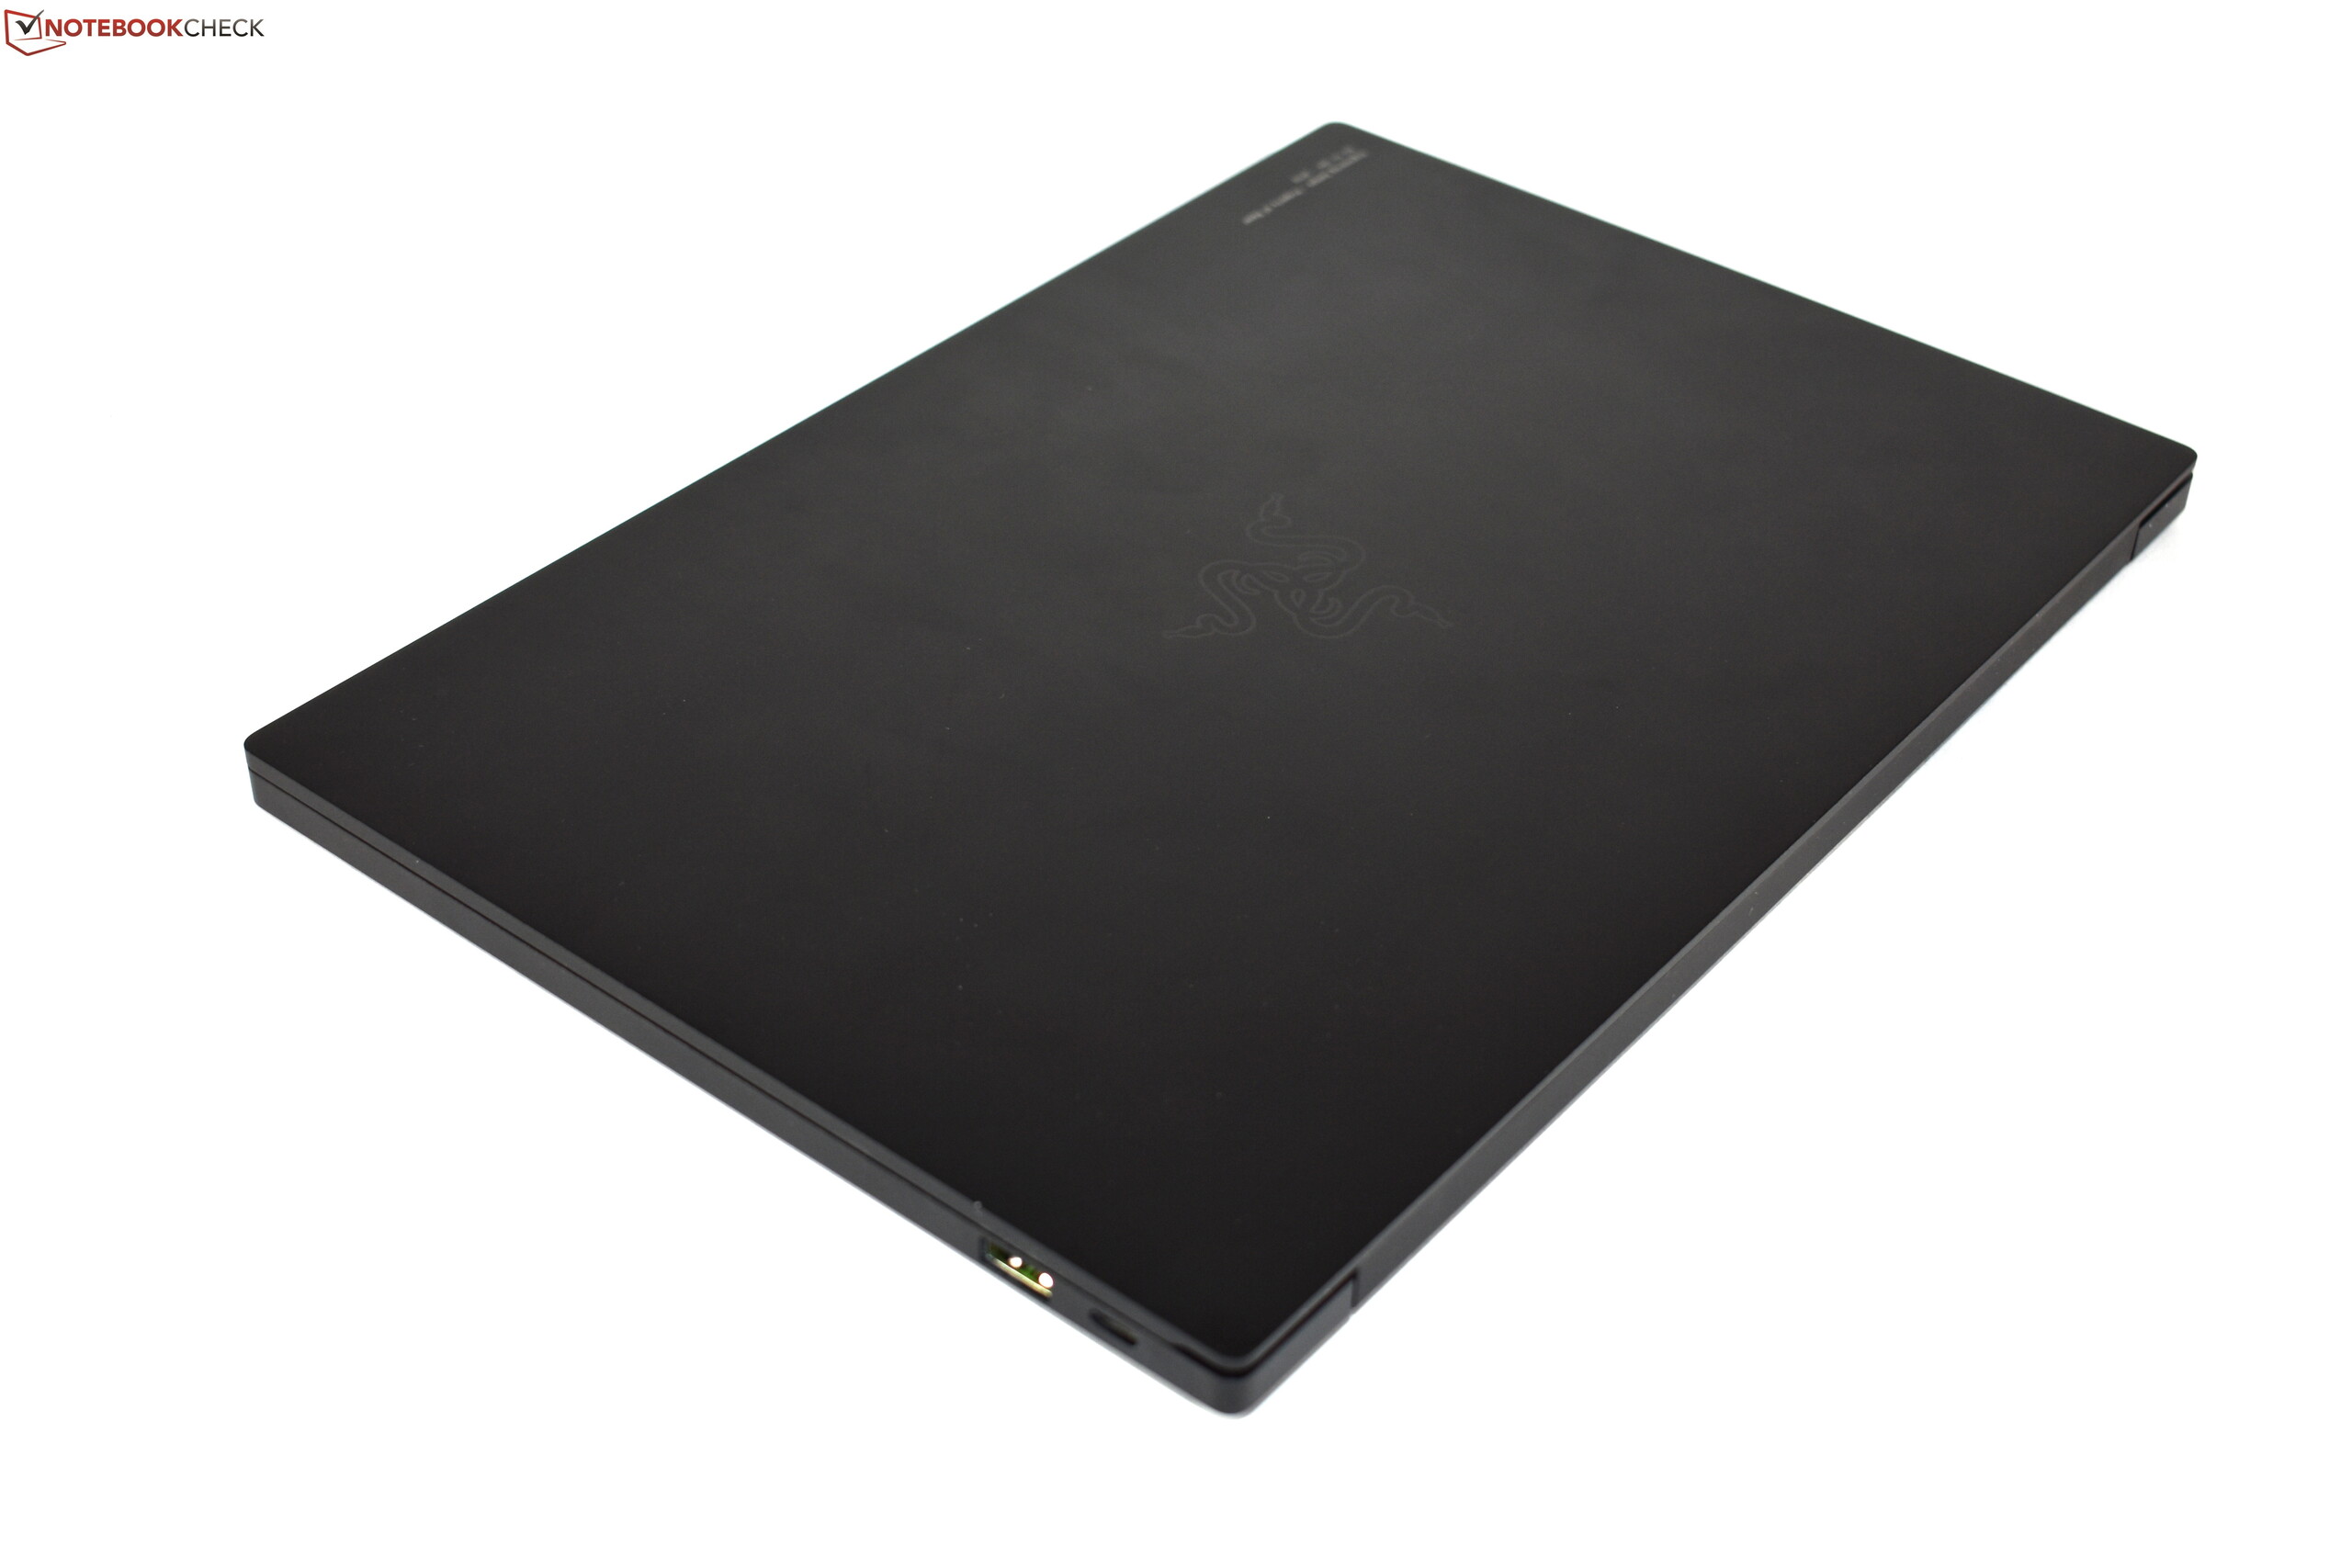
O Razer Blade Stealth consegue alcançar o equilíbrio: Não é apenas ultracompacto; o ultrabook Razer também é muito poderoso. Porém, isso só é válido para o desempenho da GPU - não estamos satisfeitos com o desempenho da CPU do modelo com a Nvidia GeForce GTX 1650 Max-Q.
Obviamente, limitar o desempenho da CPU foi uma escolha consciente da Razer. A limitação de 15 W deve manter o calor e o ruído baixos, o que a Razer consegue fazer. Mesmo assim: Não é compreensível que a CPU esteja bloqueada em 15 W, mesmo que a GPU não esteja ativa.
Outra diferença importante deste modelo em comparação com o iGPU Razer Blade Stealth é a tela 4K UHD. Infelizmente, sua qualidade é decepcionante para nós. Não é um painel ruim, mas comparado ao painel FHD do iGPU Razer Blade, ele não oferece outras vantagens além da resolução mais alta e da superfície táctil. Em algumas áreas, o oposto é verdadeiro: A tela FHD mais acessível é visivelmente mais brilhante que a tela 4K. A tela de alta resolução também cria outra desvantagem, pois o modelo 4K tem um consumo de energia muito maior. O resultado é uma duração da bateria pobre, o que é muito ruim para um portátil tão pequeno. Por último, mas não menos importante, temos que reclamar da curta garantia padrão de um ano.
Apesar das especificações premium em geral: Este modelo específico do Razer Blade Stealth não é recomendável. A maior razão para isso é a decepcionante tela 4K.
É por isso que não podemos recomendar o Razer Blade Stealth 13 - mas apenas o modelo com a tela 4K. Em vez disso, os consumidores interessados devem procurar o modelo FHD que apresenta a GPU GeForce GTX. Essa variante é mais acessível e combina as melhores qualidades do Razer Blade Stealth com o desempenho da GPU dedicada. Com a tela de resolução mais baixa, a duração da bateria também deve ser melhor.
Razer Blade Stealth 13, Core i7-1065G7
- 11/11/2019 v7 (old)
Benjamin Herzig
Price comparison
