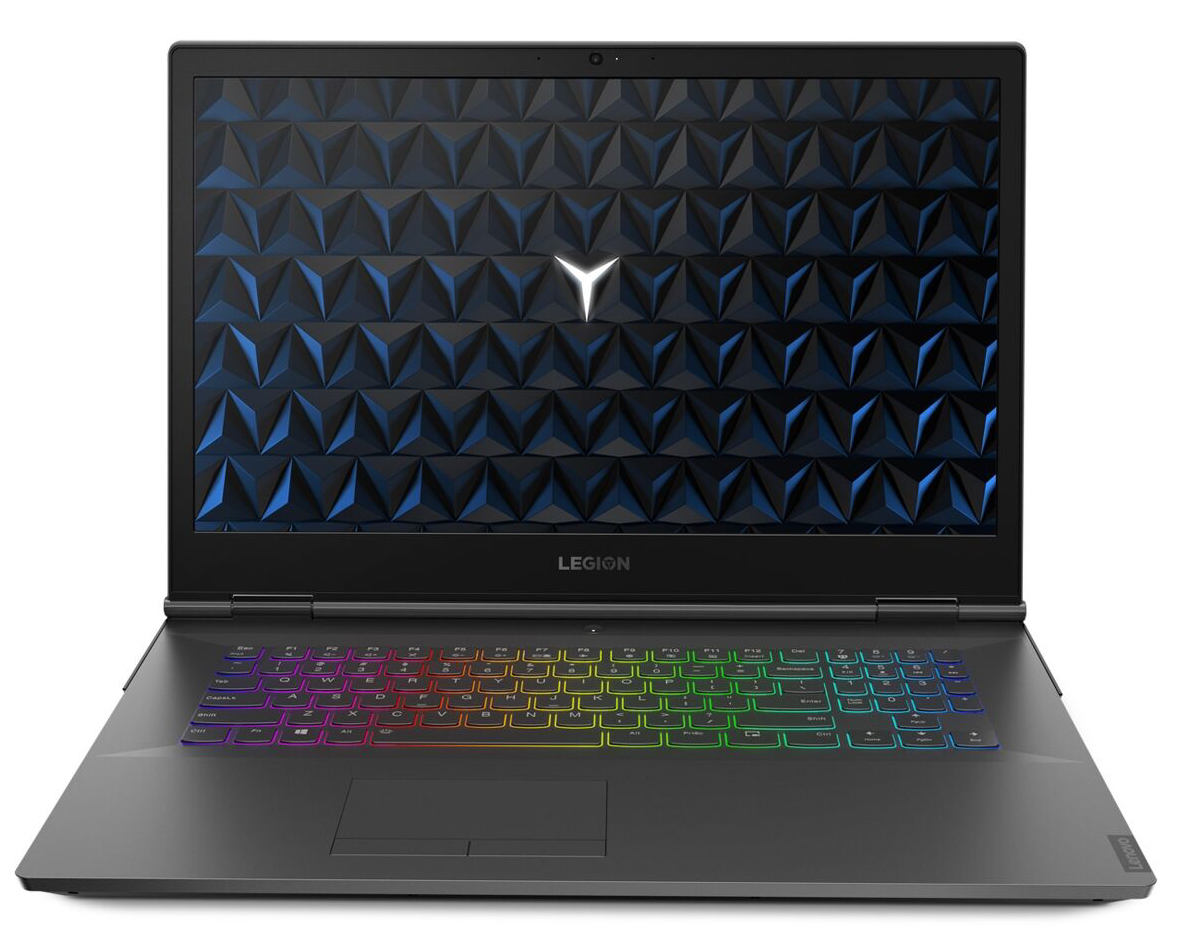
Breve Análise do Lenovo Legion Y740-17IRH: O bólido para jogos obtém notas altas por sua excelente entrega de desempenho e baixas emissões de calor
Avaliação | Data | Modelo | Peso | Altura | Size | Resolução | Preço |
|---|---|---|---|---|---|---|---|
| 83.2 % v7 (old) | 10/2019 | Lenovo Legion Y740-17IRH i7-9750H, GeForce RTX 2060 Mobile | 3 kg | 23 mm | 17.30" | 1920x1080 | |
| 85.6 % v6 (old) | 03/2019 | Lenovo Legion Y740-17ICH i7-8750H, GeForce RTX 2080 Max-Q | 2.8 kg | 23 mm | 17.30" | 1920x1080 | |
| 86 % v7 (old) | 09/2019 | Asus Strix Hero III G731GV i7-9750H, GeForce RTX 2060 Mobile | 2.9 kg | 26.2 mm | 17.30" | 1920x1080 | |
| 82.9 % v7 (old) | 10/2019 | MSI GL75 9SEK-056US i7-9750H, GeForce RTX 2060 Mobile | 2.5 kg | 28 mm | 17.30" | 1920x1080 | |
| 86.7 % v6 (old) | 07/2019 | Schenker XMG Core 17 i7-9750H, GeForce GTX 1660 Ti Mobile | 2.5 kg | 30 mm | 17.30" | 1920x1080 | |
| 85.3 % v6 (old) | 06/2019 | Dell G7 17 7790 i7-8750H, GeForce RTX 2070 Max-Q | 3.2 kg | 25 mm | 17.30" | 1920x1080 | |
| 81.6 % v7 (old) | 07/2019 | HP Pavilion Gaming 17-cd0085cl i7-9750H, GeForce GTX 1660 Ti Max-Q | 2.8 kg | 25 mm | 17.30" | 1920x1080 |

| |||||||||||||||||||||||||
iluminação: 87 %
iluminação com acumulador: 282 cd/m²
Contraste: 1044:1 (Preto: 0.27 cd/m²)
ΔE ColorChecker Calman: 3.18 | ∀{0.5-29.43 Ø4.72}
calibrated: 0.95
ΔE Greyscale Calman: 4.1 | ∀{0.09-98 Ø4.97}
96% sRGB (Argyll 1.6.3 3D)
61% AdobeRGB 1998 (Argyll 1.6.3 3D)
65.8% AdobeRGB 1998 (Argyll 3D)
96% sRGB (Argyll 3D)
64.8% Display P3 (Argyll 3D)
Gamma: 2.55
CCT: 7260 K
| Lenovo Legion Y740-17IRH LG Philips LP173WFG-SPD2 (LGD05E0), IPS, 1920x1080 | Lenovo Legion Y740-17ICH AU Optronics B173HAN03.2, IPS, 1920x1080 | Asus Strix Hero III G731GV AU Optronics AUO B173HAN04.0, IPS, 1920x1080 | MSI GL75 9SEK-056US AU Optronics AUO479D (B173HAN04.7), IPS, 1920x1080 | Schenker XMG Core 17 LG Philips LP173WFG-SPB1 (LGD0615), IPS, 1920x1080 | Dell G7 17 7790 AU Optronics AUO409D, B173HAN, IPS, 1920x1080 | HP Pavilion Gaming 17-cd0085cl BOE0825, IPS, 1920x1080 | |
|---|---|---|---|---|---|---|---|
| Display | -3% | -5% | -36% | -0% | -5% | -3% | |
| Display P3 Coverage (%) | 64.8 | 64 -1% | 62.9 -3% | 41.12 -37% | 64.4 -1% | 61.9 -4% | 63.3 -2% |
| sRGB Coverage (%) | 96 | 90.4 -6% | 87.2 -9% | 61.1 -36% | 95.6 0% | 89.6 -7% | 90.2 -6% |
| AdobeRGB 1998 Coverage (%) | 65.8 | 64.8 -2% | 63.8 -3% | 42.49 -35% | 65.6 0% | 63.2 -4% | 64.3 -2% |
| Response Times | -10% | 24% | -97% | 9% | -12% | -95% | |
| Response Time Grey 50% / Grey 80% * (ms) | 14.8 ? | 15.6 ? -5% | 6.8 ? 54% | 26 ? -76% | 14.4 ? 3% | 17.2 ? -16% | 31.6 ? -114% |
| Response Time Black / White * (ms) | 11.2 ? | 12.8 ? -14% | 12 ? -7% | 24.4 ? -118% | 9.6 ? 14% | 12 ? -7% | 19.6 ? -75% |
| PWM Frequency (Hz) | |||||||
| Screen | -36% | -19% | -47% | 3% | -22% | -24% | |
| Brightness middle (cd/m²) | 282 | 299.1 6% | 312.3 11% | 259.1 -8% | 329 17% | 308.6 9% | 299.6 6% |
| Brightness (cd/m²) | 261 | 273 5% | 297 14% | 261 0% | 286 10% | 299 15% | 285 9% |
| Brightness Distribution (%) | 87 | 81 -7% | 91 5% | 93 7% | 79 -9% | 92 6% | 86 -1% |
| Black Level * (cd/m²) | 0.27 | 0.27 -0% | 0.21 22% | 0.25 7% | 0.3 -11% | 0.29 -7% | 0.33 -22% |
| Contrast (:1) | 1044 | 1108 6% | 1487 42% | 1036 -1% | 1097 5% | 1064 2% | 908 -13% |
| Colorchecker dE 2000 * | 3.18 | 5.07 -59% | 3.6 -13% | 4.23 -33% | 2.52 21% | 4.26 -34% | 3.68 -16% |
| Colorchecker dE 2000 max. * | 8.39 | 10.55 -26% | 6.74 20% | 23.39 -179% | 6.9 18% | 7.83 7% | 8.05 4% |
| Colorchecker dE 2000 calibrated * | 0.95 | 3.31 -248% | 3.95 -316% | 3.9 -311% | 1.31 -38% | 2.93 -208% | 3.15 -232% |
| Greyscale dE 2000 * | 4.1 | 6.8 -66% | 3.1 24% | 1.3 68% | 2.98 27% | 5 -22% | 3.8 7% |
| Gamma | 2.55 86% | 2.46 89% | 2.26 97% | 2.076 106% | 2.38 92% | 2.07 106% | 2.12 104% |
| CCT | 7260 90% | 7805 83% | 7002 93% | 6542 99% | 6738 96% | 7488 87% | 7240 90% |
| Color Space (Percent of AdobeRGB 1998) (%) | 61 | 58.5 -4% | 56.6 -7% | 39 -36% | 60 -2% | 57.8 -5% | 58.1 -5% |
| Color Space (Percent of sRGB) (%) | 96 | 89.9 -6% | 86.6 -10% | 61 -36% | 95 -1% | 89.2 -7% | 89.8 -6% |
| Média Total (Programa/Configurações) | -16% /
-27% | 0% /
-11% | -60% /
-52% | 4% /
3% | -13% /
-18% | -41% /
-29% |
* ... menor é melhor
Exibir tempos de resposta
| ↔ Tempo de resposta preto para branco | ||
|---|---|---|
| 11.2 ms ... ascensão ↗ e queda ↘ combinadas | ↗ 6 ms ascensão | 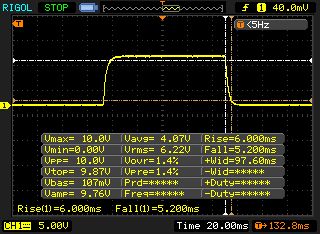 |
| ↘ 5.2 ms queda | ||
| A tela mostra boas taxas de resposta em nossos testes, mas pode ser muito lenta para jogadores competitivos. Em comparação, todos os dispositivos testados variam de 0.1 (mínimo) a 240 (máximo) ms. » 30 % de todos os dispositivos são melhores. Isso significa que o tempo de resposta medido é melhor que a média de todos os dispositivos testados (19.8 ms). | ||
| ↔ Tempo de resposta 50% cinza a 80% cinza | ||
| 14.8 ms ... ascensão ↗ e queda ↘ combinadas | ↗ 7.6 ms ascensão | 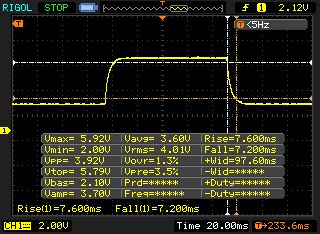 |
| ↘ 7.2 ms queda | ||
| A tela mostra boas taxas de resposta em nossos testes, mas pode ser muito lenta para jogadores competitivos. Em comparação, todos os dispositivos testados variam de 0.165 (mínimo) a 636 (máximo) ms. » 29 % de todos os dispositivos são melhores. Isso significa que o tempo de resposta medido é melhor que a média de todos os dispositivos testados (31 ms). | ||
Cintilação da tela / PWM (modulação por largura de pulso)
| Tela tremeluzindo / PWM não detectado | 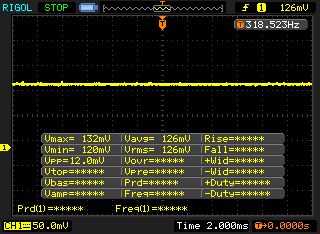 | ||
[pwm_comparison] Em comparação: 52 % de todos os dispositivos testados não usam PWM para escurecer a tela. Se PWM foi detectado, uma média de 7753 (mínimo: 5 - máximo: 343500) Hz foi medida. | |||
| Cinebench R10 | |
| Rendering Single 32Bit | |
| Média da turma Gaming (7457 - 11779, n=8, últimos 2 anos) | |
| Lenovo Legion Y740-17IRH | |
| Schenker XMG Core 17 | |
| Rendering Multiple CPUs 32Bit | |
| Média da turma Gaming (42932 - 81339, n=8, últimos 2 anos) | |
| Lenovo Legion Y740-17IRH | |
| Schenker XMG Core 17 | |
| Geekbench 3 | |
| 32 Bit Multi-Core Score | |
| Lenovo Legion Y740-17IRH | |
| Schenker XMG Core 17 | |
| 32 Bit Single-Core Score | |
| Schenker XMG Core 17 | |
| Lenovo Legion Y740-17IRH | |
| Geekbench 4.4 | |
| 64 Bit Multi-Core Score | |
| Média da turma Gaming (89200 - 97490, n=2, últimos 2 anos) | |
| Lenovo Legion Y740-17IRH | |
| Schenker XMG Core 17 | |
| 64 Bit Single-Core Score | |
| Média da turma Gaming (9335 - 9492, n=2, últimos 2 anos) | |
| Schenker XMG Core 17 | |
| Lenovo Legion Y740-17IRH | |
| Geekbench 5.0 | |
| 5.0 Multi-Core | |
| Média da turma Gaming (21768 - 23588, n=2, últimos 2 anos) | |
| Lenovo Legion Y740-17IRH | |
| 5.0 Single-Core | |
| Média da turma Gaming (2237 - 2270, n=2, últimos 2 anos) | |
| Lenovo Legion Y740-17IRH | |
| Mozilla Kraken 1.1 - Total | |
| Asus Strix Hero III G731GV (Edge 44.17763.1.0) | |
| Lenovo Legion Y740-17ICH (Edge 44.17763.1.0) | |
| MSI GL75 9SEK-056US (Microsoft Edge 44.17763.1.0) | |
| Lenovo Legion Y740-17IRH (Edge 44) | |
| Schenker XMG Core 17 (Edge 44) | |
| HP Pavilion Gaming 17-cd0085cl (Edge 44.17763.1.0) | |
| Média da turma Gaming (391 - 590, n=102, últimos 2 anos) | |
| Octane V2 - Total Score | |
| Média da turma Gaming (93292 - 139447, n=27, últimos 2 anos) | |
| HP Pavilion Gaming 17-cd0085cl (Edge 44.17763.1.0) | |
| Schenker XMG Core 17 (Edge 44) | |
| Lenovo Legion Y740-17IRH (Edge 44) | |
| MSI GL75 9SEK-056US (Microsoft Edge 44.17763.1.0) | |
| Lenovo Legion Y740-17ICH (Edge 44.17763.1.0) | |
| Asus Strix Hero III G731GV (Edge 44.17763.1.0) | |
| JetStream 1.1 - 1.1 Total | |
| Média da turma Gaming (549 - 647, n=3, últimos 2 anos) | |
| Schenker XMG Core 17 (Edge 44) | |
| HP Pavilion Gaming 17-cd0085cl (Edge 44.17763.1.0) | |
| MSI GL75 9SEK-056US (Microsoft Edge 44.17763.1.0) | |
| Lenovo Legion Y740-17IRH (Edge 44) | |
| Lenovo Legion Y740-17ICH (Edge 44.17763.1.0) | |
| Asus Strix Hero III G731GV (Edge 44.17763.1.0) | |
* ... menor é melhor
| PCMark 8 Home Score Accelerated v2 | 4993 pontos | |
| PCMark 8 Creative Score Accelerated v2 | 6080 pontos | |
| PCMark 8 Work Score Accelerated v2 | 5931 pontos | |
| PCMark 10 Score | 5894 pontos | |
Ajuda | ||

| Lenovo Legion Y740-17IRH WDC PC SN520 SDAPMUW-128G | Lenovo Legion Y740-17ICH Samsung SSD PM981 MZVLB256HAHQ | Asus Strix Hero III G731GV Intel SSD 660p SSDPEKNW512G8 | MSI GL75 9SEK-056US WDC PC SN520 SDAPNUW-512G | Schenker XMG Core 17 Samsung SSD 970 EVO Plus 500GB | Dell G7 17 7790 Toshiba BG3 KBG30ZMS256G | HP Pavilion Gaming 17-cd0085cl Samsung SSD PM981 MZVLB256HAHQ | |
|---|---|---|---|---|---|---|---|
| CrystalDiskMark 5.2 / 6 | 86% | 52% | 57% | 104% | -25% | 106% | |
| Write 4K (MB/s) | 102.7 | 99.8 -3% | 129.3 26% | 149.1 45% | 99.3 -3% | 78.6 -23% | 135.3 32% |
| Read 4K (MB/s) | 29.12 | 40.81 40% | 54.4 87% | 48.58 67% | 38.47 32% | 31.89 10% | 63.7 119% |
| Write Seq (MB/s) | 362.2 | 1385 282% | 978 170% | 1449 300% | 230.4 -36% | 1337 269% | |
| Read Seq (MB/s) | 1010 | 2089 107% | 1447 43% | 1237 22% | 925 -8% | 1617 60% | |
| Write 4K Q32T1 (MB/s) | 298.1 | 380 27% | 476.8 60% | 462 55% | 364.4 22% | 159.1 -47% | 568 91% |
| Read 4K Q32T1 (MB/s) | 349.6 | 445.5 27% | 338.1 -3% | 606 73% | 421.9 21% | 315.6 -10% | 645 84% |
| Write Seq Q32T1 (MB/s) | 788 | 1380 75% | 982 25% | 1454 85% | 3276 316% | 230.7 -71% | 1428 81% |
| Read Seq Q32T1 (MB/s) | 1490 | 3471 133% | 1622 9% | 1724 16% | 3338 124% | 1323 -11% | 3184 114% |
| 3DMark 06 Standard Score | 40086 pontos | |
| 3DMark 11 Performance | 17637 pontos | |
| 3DMark Ice Storm Standard Score | 163805 pontos | |
| 3DMark Cloud Gate Standard Score | 35897 pontos | |
| 3DMark Fire Strike Score | 14256 pontos | |
| 3DMark Time Spy Score | 6118 pontos | |
Ajuda | ||
| The Witcher 3 - 1920x1080 Ultra Graphics & Postprocessing (HBAO+) | |
| Média da turma Gaming (95 - 240, n=7, últimos 2 anos) | |
| Lenovo Legion Y740-17ICH | |
| Dell G7 17 7790 | |
| Lenovo Legion Y740-17IRH | |
| MSI GL75 9SEK-056US | |
| Asus Strix Hero III G731GV | |
| Schenker XMG Core 17 | |
| HP Pavilion Gaming 17-cd0085cl | |
| BioShock Infinite - 1920x1080 Ultra Preset, DX11 (DDOF) | |
| Lenovo Legion Y740-17ICH | |
| Lenovo Legion Y740-17IRH | |
| Asus Strix Hero III G731GV | |
| Schenker XMG Core 17 | |
| Dell G7 17 7790 | |
| HP Pavilion Gaming 17-cd0085cl | |
| Far Cry New Dawn - 1920x1080 Ultra Preset | |
| Lenovo Legion Y740-17IRH | |
| Schenker XMG Core 17 | |
| Far Cry 5 - 1920x1080 Ultra Preset AA:T | |
| Média da turma Gaming (70 - 151, n=8, últimos 2 anos) | |
| Lenovo Legion Y740-17IRH | |
| Schenker XMG Core 17 | |
| Metro Exodus - 1920x1080 Ultra Quality AF:16x | |
| Lenovo Legion Y740-17IRH | |
| Total War: Three Kingdoms - 1920x1080 Ultra (incl textures) | |
| Lenovo Legion Y740-17IRH | |
| baixo | média | alto | ultra | |
|---|---|---|---|---|
| BioShock Infinite (2013) | 357 | 293.1 | 294.9 | 148.2 |
| The Witcher 3 (2015) | 282.4 | 198.4 | 114.6 | 58.4 |
| Far Cry 5 (2018) | 125 | 96 | 92 | 87 |
| Shadow of the Tomb Raider (2018) | 120 | 96 | 88 | 78 |
| Far Cry New Dawn (2019) | 124 | 96 | 93 | 83 |
| Metro Exodus (2019) | 136 | 73.8 | 56.3 | 46 |
| Total War: Three Kingdoms (2019) | 249.8 | 113 | 73.4 | 53.7 |
| Control (2019) | 215.9 | 77.6 | 57.4 | |
| Borderlands 3 (2019) | 119.9 | 93.7 | 67.6 | 52 |
| Ghost Recon Breakpoint (2019) | 120 | 84 | 79 | 57 |
Barulho
| Ocioso |
| 33 / 34 / 35 dB |
| HDD |
| 34 dB |
| Carga |
| 48 / 49 dB |
 | ||
30 dB silencioso 40 dB(A) audível 50 dB(A) ruidosamente alto |
||
min: | ||
| Lenovo Legion Y740-17IRH i7-9750H, GeForce RTX 2060 Mobile | Lenovo Legion Y740-17ICH i7-8750H, GeForce RTX 2080 Max-Q | Asus Strix Hero III G731GV i7-9750H, GeForce RTX 2060 Mobile | MSI GL75 9SEK-056US i7-9750H, GeForce RTX 2060 Mobile | Schenker XMG Core 17 i7-9750H, GeForce GTX 1660 Ti Mobile | Dell G7 17 7790 i7-8750H, GeForce RTX 2070 Max-Q | HP Pavilion Gaming 17-cd0085cl i7-9750H, GeForce GTX 1660 Ti Max-Q | |
|---|---|---|---|---|---|---|---|
| Noise | 11% | 3% | 4% | 1% | 10% | 15% | |
| desligado / ambiente * (dB) | 30 | 28.3 6% | 28.2 6% | 28.1 6% | 30 -0% | 28.2 6% | 28.2 6% |
| Idle Minimum * (dB) | 33 | 31.5 5% | 29.5 11% | 30.9 6% | 30 9% | 28.6 13% | 30.1 9% |
| Idle Average * (dB) | 34 | 31.6 7% | 30.3 11% | 30.9 9% | 32 6% | 28.6 16% | 30.1 11% |
| Idle Maximum * (dB) | 35 | 31.6 10% | 31.9 9% | 31 11% | 35 -0% | 28.6 18% | 30.1 14% |
| Load Average * (dB) | 48 | 32.3 33% | 50.4 -5% | 39 19% | 47 2% | 31.8 34% | 34.2 29% |
| Witcher 3 ultra * (dB) | 46 | 43 7% | 50.1 -9% | 53.5 -16% | 48 -4% | 50.6 -10% | 34.2 26% |
| Load Maximum * (dB) | 49 | 45.5 7% | 50.1 -2% | 53.5 -9% | 51 -4% | 50.8 -4% | 43.8 11% |
* ... menor é melhor
(±) A temperatura máxima no lado superior é 43 °C / 109 F, em comparação com a média de 40.4 °C / 105 F , variando de 21.2 a 68.8 °C para a classe Gaming.
(-) A parte inferior aquece até um máximo de 46 °C / 115 F, em comparação com a média de 43.2 °C / 110 F
(+) Em uso inativo, a temperatura média para o lado superior é 28.9 °C / 84 F, em comparação com a média do dispositivo de 33.9 °C / ### class_avg_f### F.
(±) Jogando The Witcher 3, a temperatura média para o lado superior é 36.3 °C / 97 F, em comparação com a média do dispositivo de 33.9 °C / ## #class_avg_f### F.
(+) Os apoios para as mãos e o touchpad são mais frios que a temperatura da pele, com um máximo de 31 °C / 87.8 F e, portanto, são frios ao toque.
(-) A temperatura média da área do apoio para as mãos de dispositivos semelhantes foi 28.8 °C / 83.8 F (-2.2 °C / -4 F).
| Lenovo Legion Y740-17IRH i7-9750H, GeForce RTX 2060 Mobile | Lenovo Legion Y740-17ICH i7-8750H, GeForce RTX 2080 Max-Q | Asus Strix Hero III G731GV i7-9750H, GeForce RTX 2060 Mobile | MSI GL75 9SEK-056US i7-9750H, GeForce RTX 2060 Mobile | Schenker XMG Core 17 i7-9750H, GeForce GTX 1660 Ti Mobile | Dell G7 17 7790 i7-8750H, GeForce RTX 2070 Max-Q | HP Pavilion Gaming 17-cd0085cl i7-9750H, GeForce GTX 1660 Ti Max-Q | |
|---|---|---|---|---|---|---|---|
| Heat | 4% | -6% | -19% | -6% | -11% | -8% | |
| Maximum Upper Side * (°C) | 43 | 38.6 10% | 47.2 -10% | 49.4 -15% | 47 -9% | 46.6 -8% | 42.6 1% |
| Maximum Bottom * (°C) | 46 | 43.6 5% | 51 -11% | 50.6 -10% | 50 -9% | 57 -24% | 49 -7% |
| Idle Upper Side * (°C) | 31 | 30.2 3% | 30.2 3% | 39 -26% | 34 -10% | 34.4 -11% | 34 -10% |
| Idle Bottom * (°C) | 34 | 35 -3% | 35.4 -4% | 42 -24% | 32 6% | 34.6 -2% | 39.4 -16% |
* ... menor é melhor
Lenovo Legion Y740-17IRH análise de áudio
(±) | o volume do alto-falante é médio, mas bom (###valor### dB)
Graves 100 - 315Hz
(±) | graves reduzidos - em média 9.8% menor que a mediana
(±) | a linearidade dos graves é média (13.2% delta para a frequência anterior)
Médios 400 - 2.000 Hz
(+) | médios equilibrados - apenas 2.6% longe da mediana
(+) | médios são lineares (4.8% delta para frequência anterior)
Altos 2 - 16 kHz
(+) | agudos equilibrados - apenas 1.2% longe da mediana
(+) | os máximos são lineares (2.7% delta da frequência anterior)
Geral 100 - 16.000 Hz
(+) | o som geral é linear (10.6% diferença em relação à mediana)
Comparado com a mesma classe
» 7% de todos os dispositivos testados nesta classe foram melhores, 2% semelhantes, 92% piores
» O melhor teve um delta de 6%, a média foi 18%, o pior foi 132%
Comparado com todos os dispositivos testados
» 6% de todos os dispositivos testados foram melhores, 1% semelhantes, 93% piores
» O melhor teve um delta de 4%, a média foi 23%, o pior foi 134%
Asus Strix Hero III G731GV análise de áudio
(±) | o volume do alto-falante é médio, mas bom (###valor### dB)
Graves 100 - 315Hz
(±) | graves reduzidos - em média 6.6% menor que a mediana
(±) | a linearidade dos graves é média (11.8% delta para a frequência anterior)
Médios 400 - 2.000 Hz
(+) | médios equilibrados - apenas 2.8% longe da mediana
(+) | médios são lineares (6.7% delta para frequência anterior)
Altos 2 - 16 kHz
(+) | agudos equilibrados - apenas 1.8% longe da mediana
(+) | os máximos são lineares (5.4% delta da frequência anterior)
Geral 100 - 16.000 Hz
(+) | o som geral é linear (13.4% diferença em relação à mediana)
Comparado com a mesma classe
» 19% de todos os dispositivos testados nesta classe foram melhores, 7% semelhantes, 74% piores
» O melhor teve um delta de 6%, a média foi 18%, o pior foi 132%
Comparado com todos os dispositivos testados
» 14% de todos os dispositivos testados foram melhores, 4% semelhantes, 83% piores
» O melhor teve um delta de 4%, a média foi 23%, o pior foi 134%
| desligado | |
| Ocioso | |
| Carga |
|
Key:
min: | |
| Lenovo Legion Y740-17IRH i7-9750H, GeForce RTX 2060 Mobile | Lenovo Legion Y740-17ICH i7-8750H, GeForce RTX 2080 Max-Q | Asus Strix Hero III G731GV i7-9750H, GeForce RTX 2060 Mobile | MSI GL75 9SEK-056US i7-9750H, GeForce RTX 2060 Mobile | Schenker XMG Core 17 i7-9750H, GeForce GTX 1660 Ti Mobile | Dell G7 17 7790 i7-8750H, GeForce RTX 2070 Max-Q | HP Pavilion Gaming 17-cd0085cl i7-9750H, GeForce GTX 1660 Ti Max-Q | |
|---|---|---|---|---|---|---|---|
| Power Consumption | -7% | -12% | 15% | 20% | 11% | 34% | |
| Idle Minimum * (Watt) | 20 | 20.2 -1% | 16.2 19% | 10.7 47% | 10 50% | 9.5 52% | 5.4 73% |
| Idle Average * (Watt) | 21 | 27.2 -30% | 24.8 -18% | 15.2 28% | 13 38% | 16.2 23% | 9.2 56% |
| Idle Maximum * (Watt) | 26 | 28.7 -10% | 28.6 -10% | 17.8 32% | 21 19% | 23.8 8% | 13 50% |
| Load Average * (Watt) | 97 | 90.8 6% | 127.6 -32% | 88.2 9% | 89 8% | 101.7 -5% | 85.9 11% |
| Witcher 3 ultra * (Watt) | 139 | 152.1 -9% | 147.1 -6% | 147.8 -6% | 128 8% | 155 -12% | 107.9 22% |
| Load Maximum * (Watt) | 168 | 165.4 2% | 212.7 -27% | 206.5 -23% | 177 -5% | 172.2 -2% | 182.2 -8% |
* ... menor é melhor
| Lenovo Legion Y740-17IRH i7-9750H, GeForce RTX 2060 Mobile, 76 Wh | Lenovo Legion Y740-17ICH i7-8750H, GeForce RTX 2080 Max-Q, 76 Wh | Asus Strix Hero III G731GV i7-9750H, GeForce RTX 2060 Mobile, 66 Wh | MSI GL75 9SEK-056US i7-9750H, GeForce RTX 2060 Mobile, 51 Wh | Schenker XMG Core 17 i7-9750H, GeForce GTX 1660 Ti Mobile, 46.74 Wh | Dell G7 17 7790 i7-8750H, GeForce RTX 2070 Max-Q, 60 Wh | HP Pavilion Gaming 17-cd0085cl i7-9750H, GeForce GTX 1660 Ti Max-Q, 52.5 Wh | |
|---|---|---|---|---|---|---|---|
| Duração da bateria | -26% | 5% | 1% | 17% | 32% | 31% | |
| Reader / Idle (h) | 6.9 | 7.9 14% | 8.1 17% | 8.5 23% | 11.6 68% | ||
| H.264 (h) | 4.3 | 5.3 23% | |||||
| WiFi v1.3 (h) | 4.3 | 3.2 -26% | 4.5 5% | 4.2 -2% | 4.7 9% | 3.9 -9% | 5.7 33% |
| Load (h) | 1.1 | 1 -9% | 1.3 18% | 2 82% | 1 -9% |
Pro
Contra
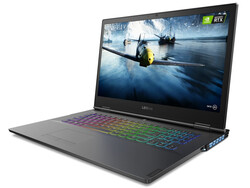
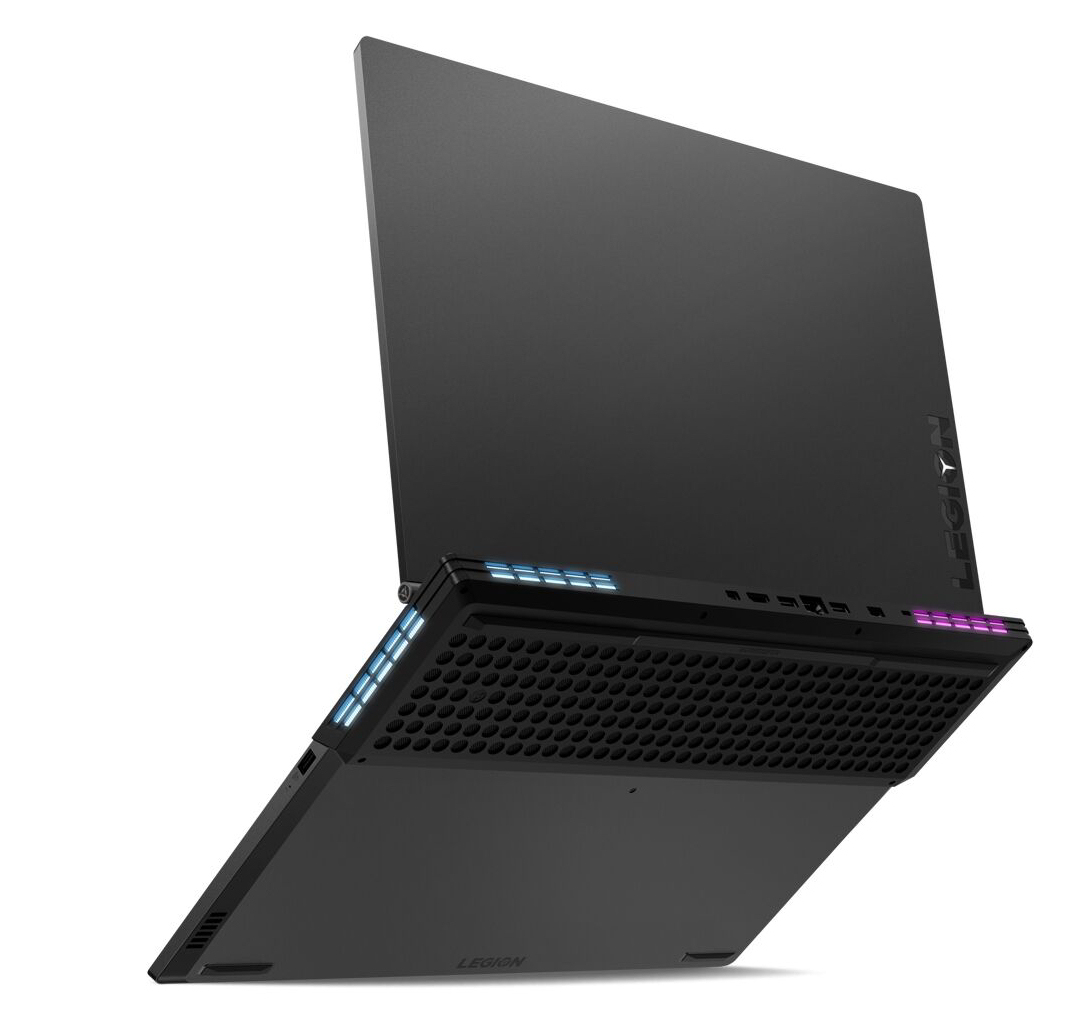
A Lenovo criou um portátil para jogos de 17,3 polegadas que consegue rodar todos os jogos atuais sem problemas em sua tela tela Full HD mate, graças a um processador Core i7-8750H e uma GPU GeForce GTX 2060. Os jogos podem ser jogados com configurações altas ou máximas. Outo ponto excelente: O dispositivo atinge apenas temperaturas moderadas.
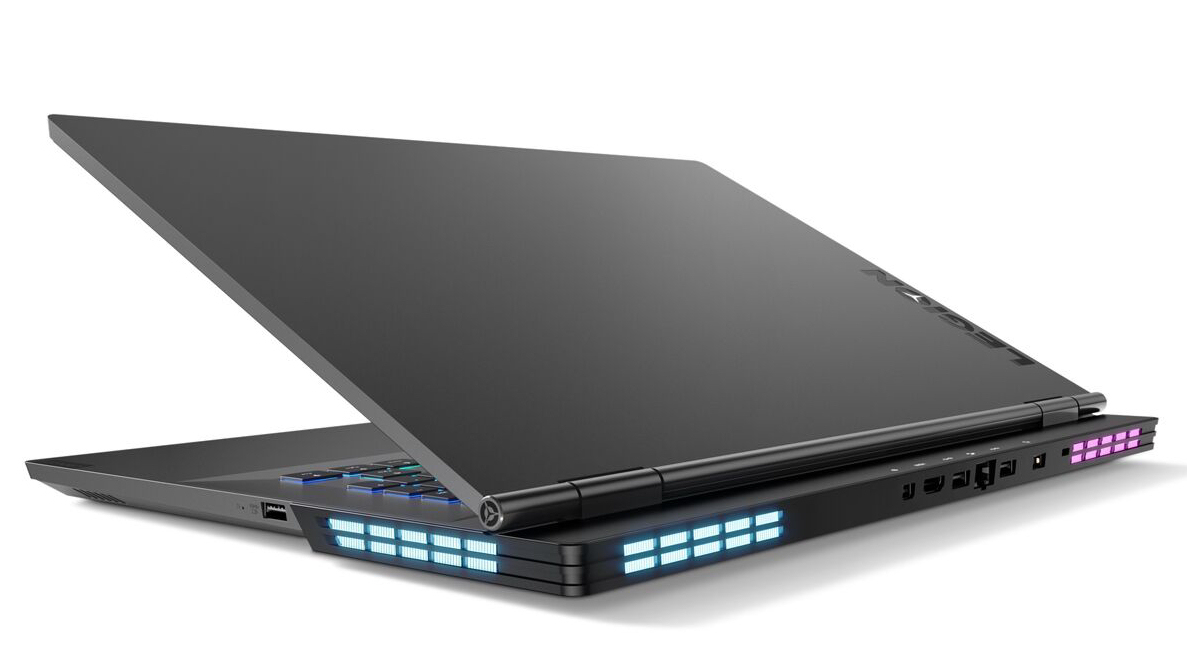
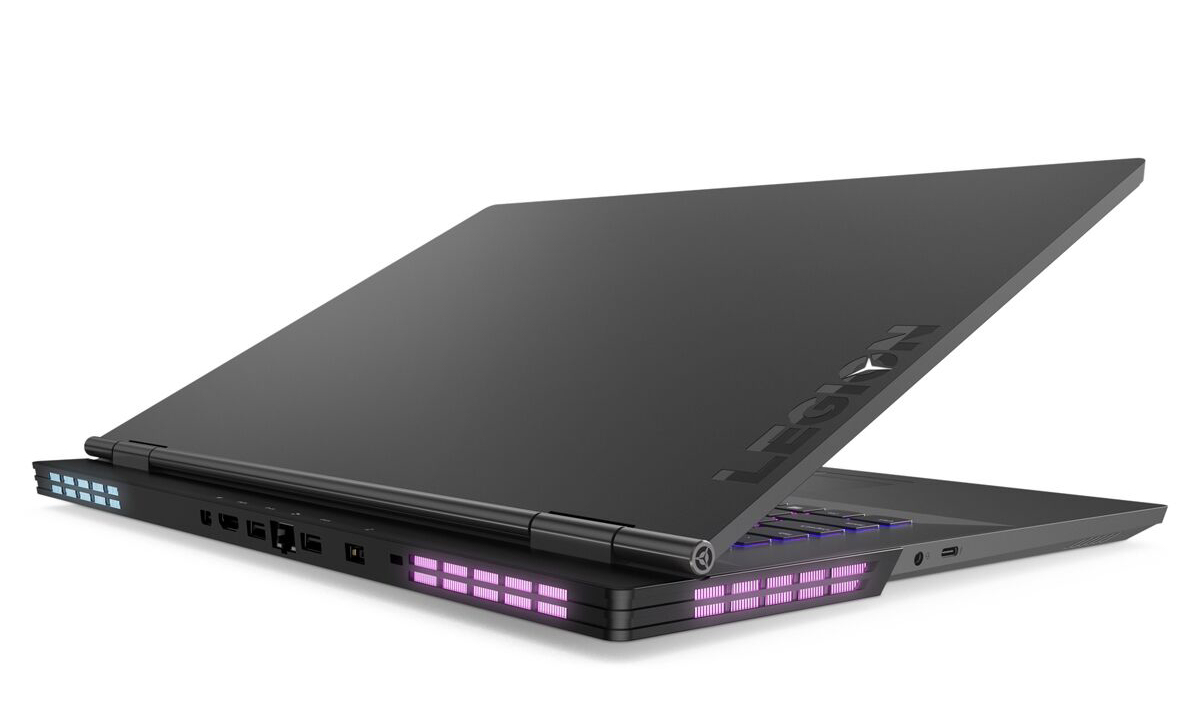
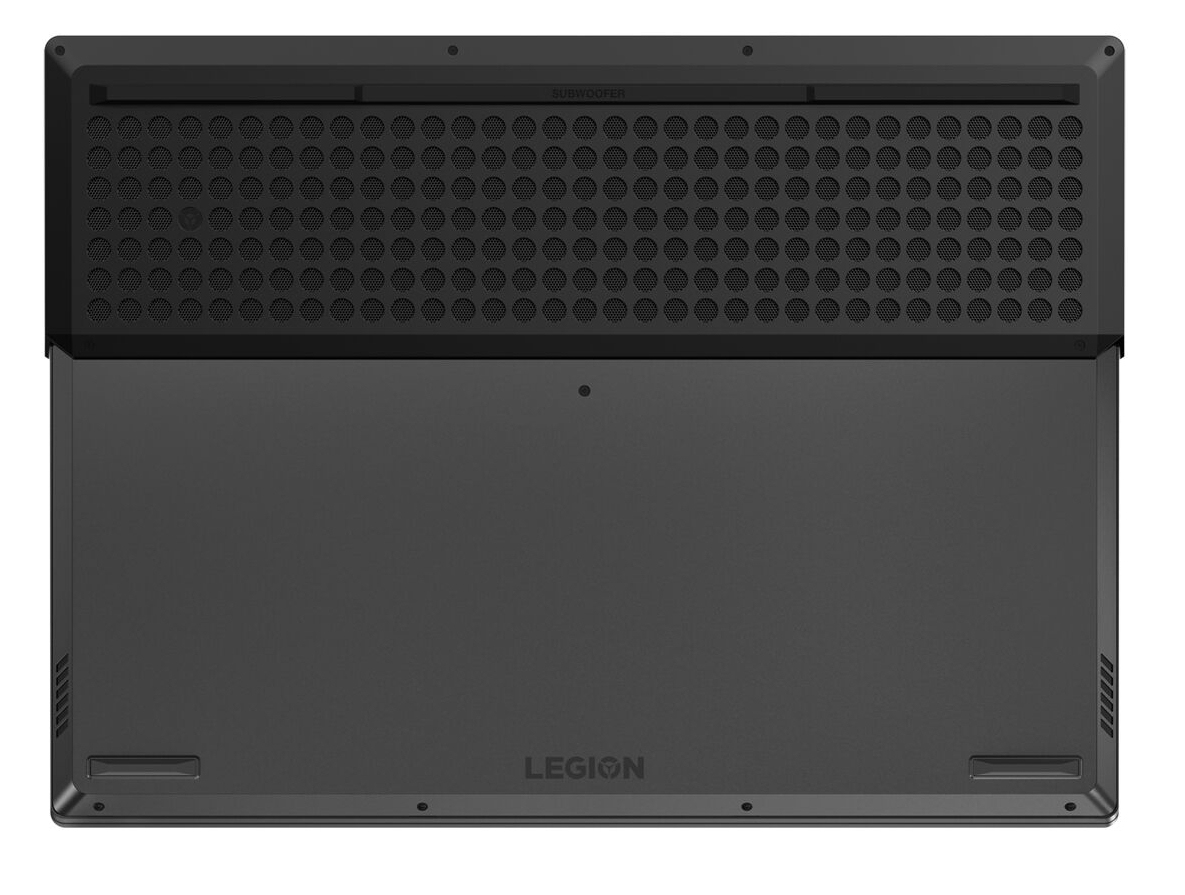
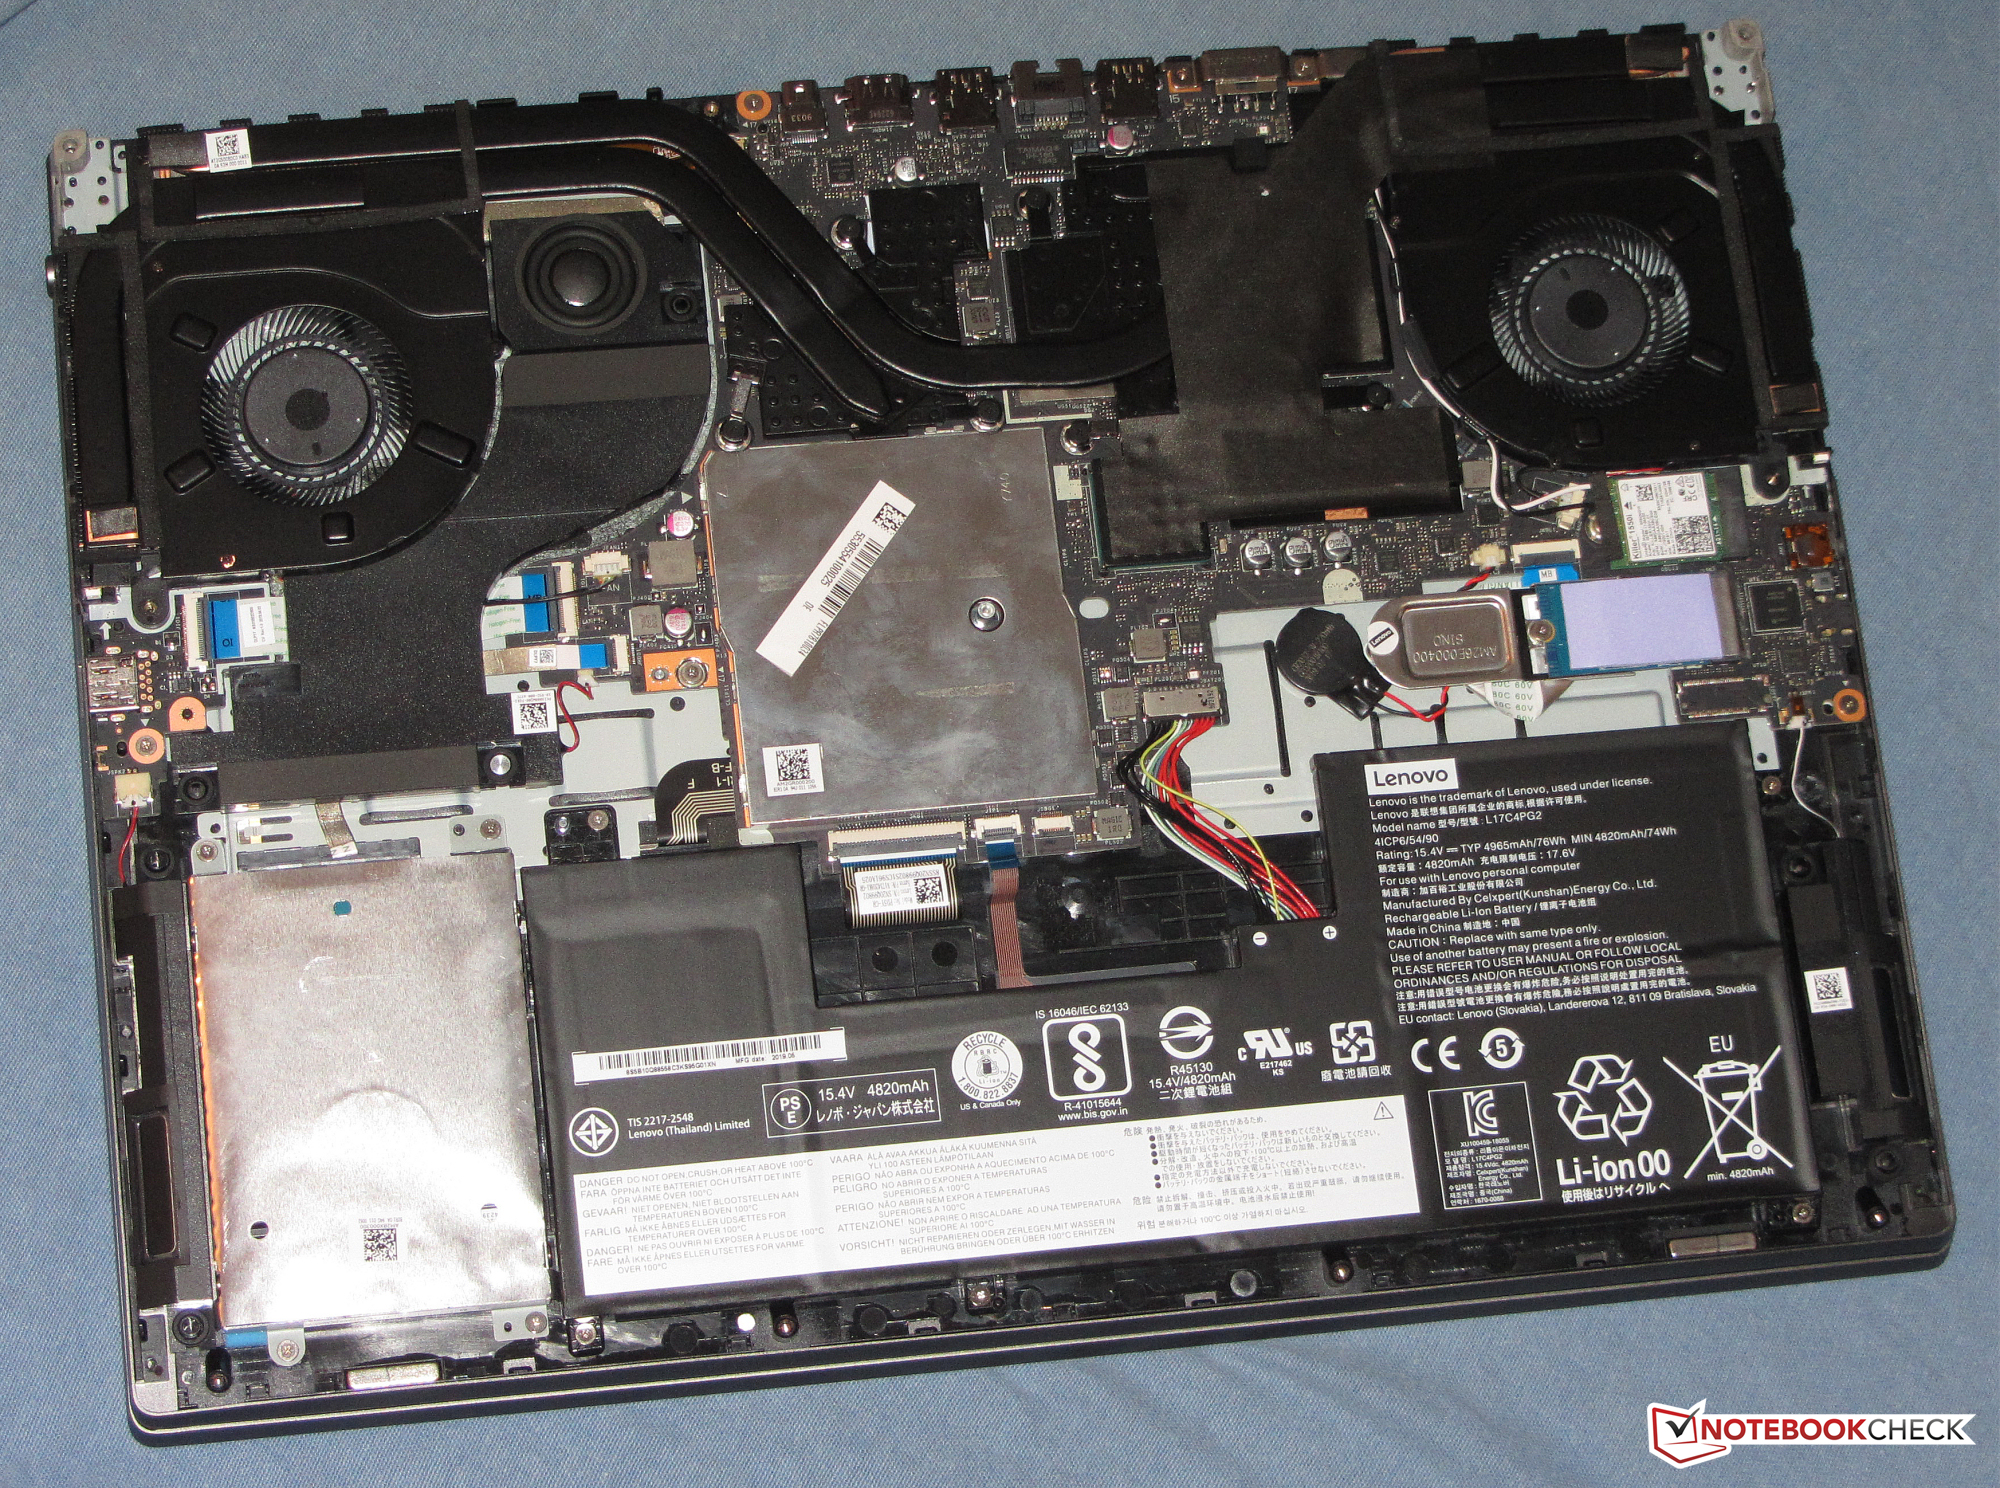
Um SSD NVMe garante um sistema rápido. Além do SSD, o dispositivo está equipado com um disco rígido de 1 TB. Ambos os dispositivos de armazenamento podem ser trocados pelo usuário, embora isso exija a remoção da parte inferior da unidade base.
O Legion Y740-17IRHg nos deu uma boa impressão geral e não parece ter nenhuma fraqueza séria.
A tela IPS de 144 Hz oferece tempos de resposta curtos, ângulos de visão estáveis, uma boa relação de contraste e uma ótima reprodução de cores. Além disso, o dispositivo suporta a tecnologia G-Sync. O brilho máximo da tela é relativamente baixo - esperávamos maior luminosidade de um dispositivo nesta faixa de preços.
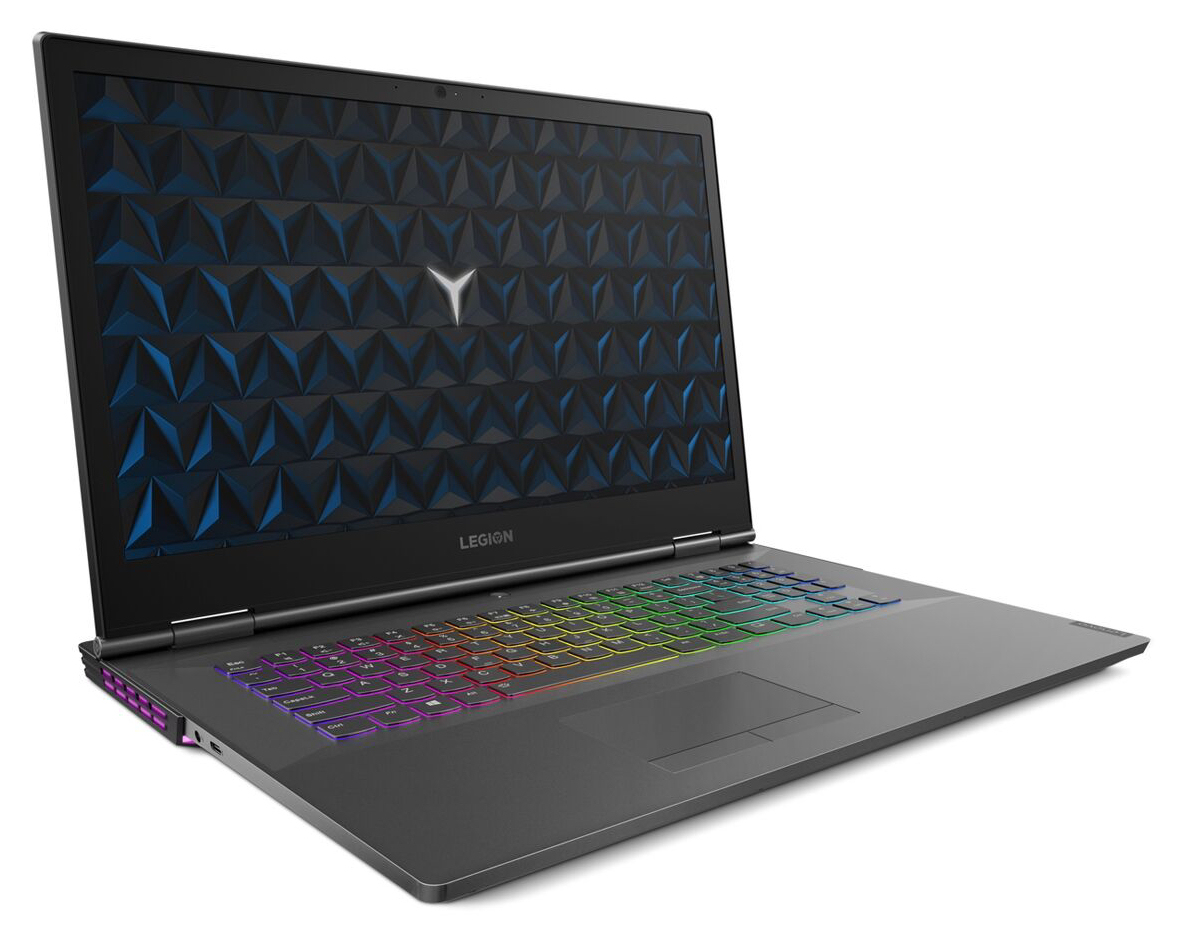
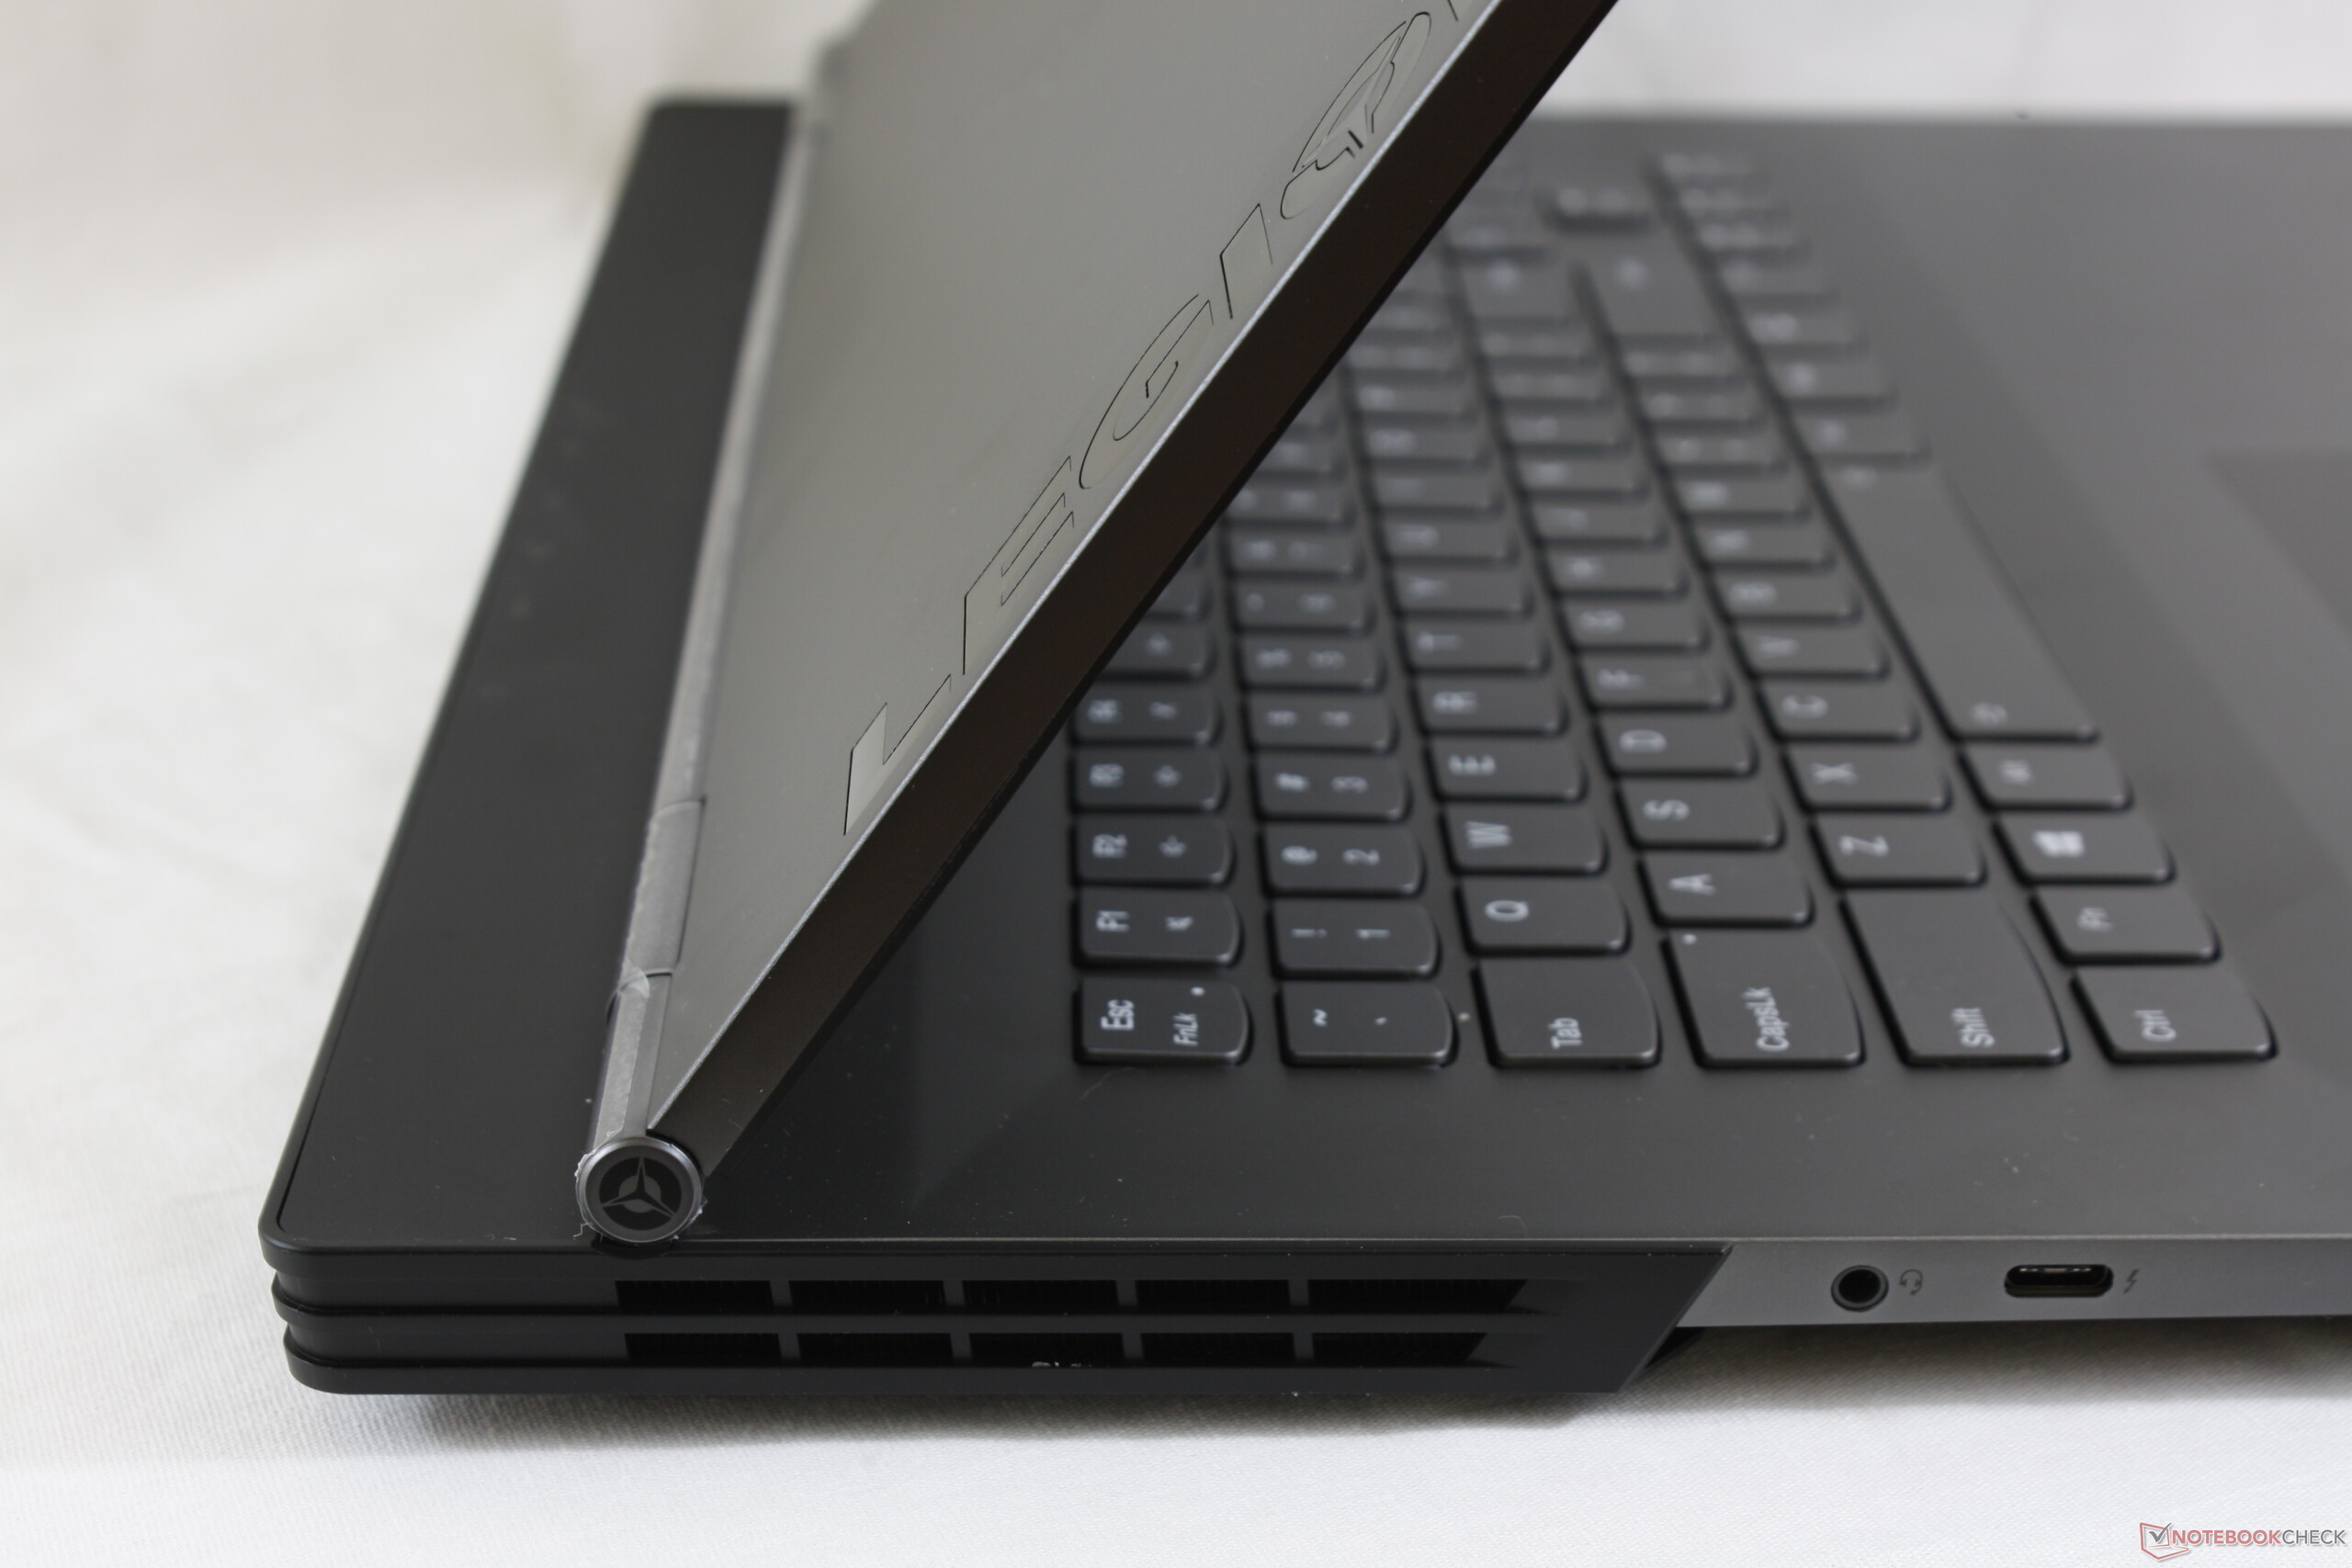
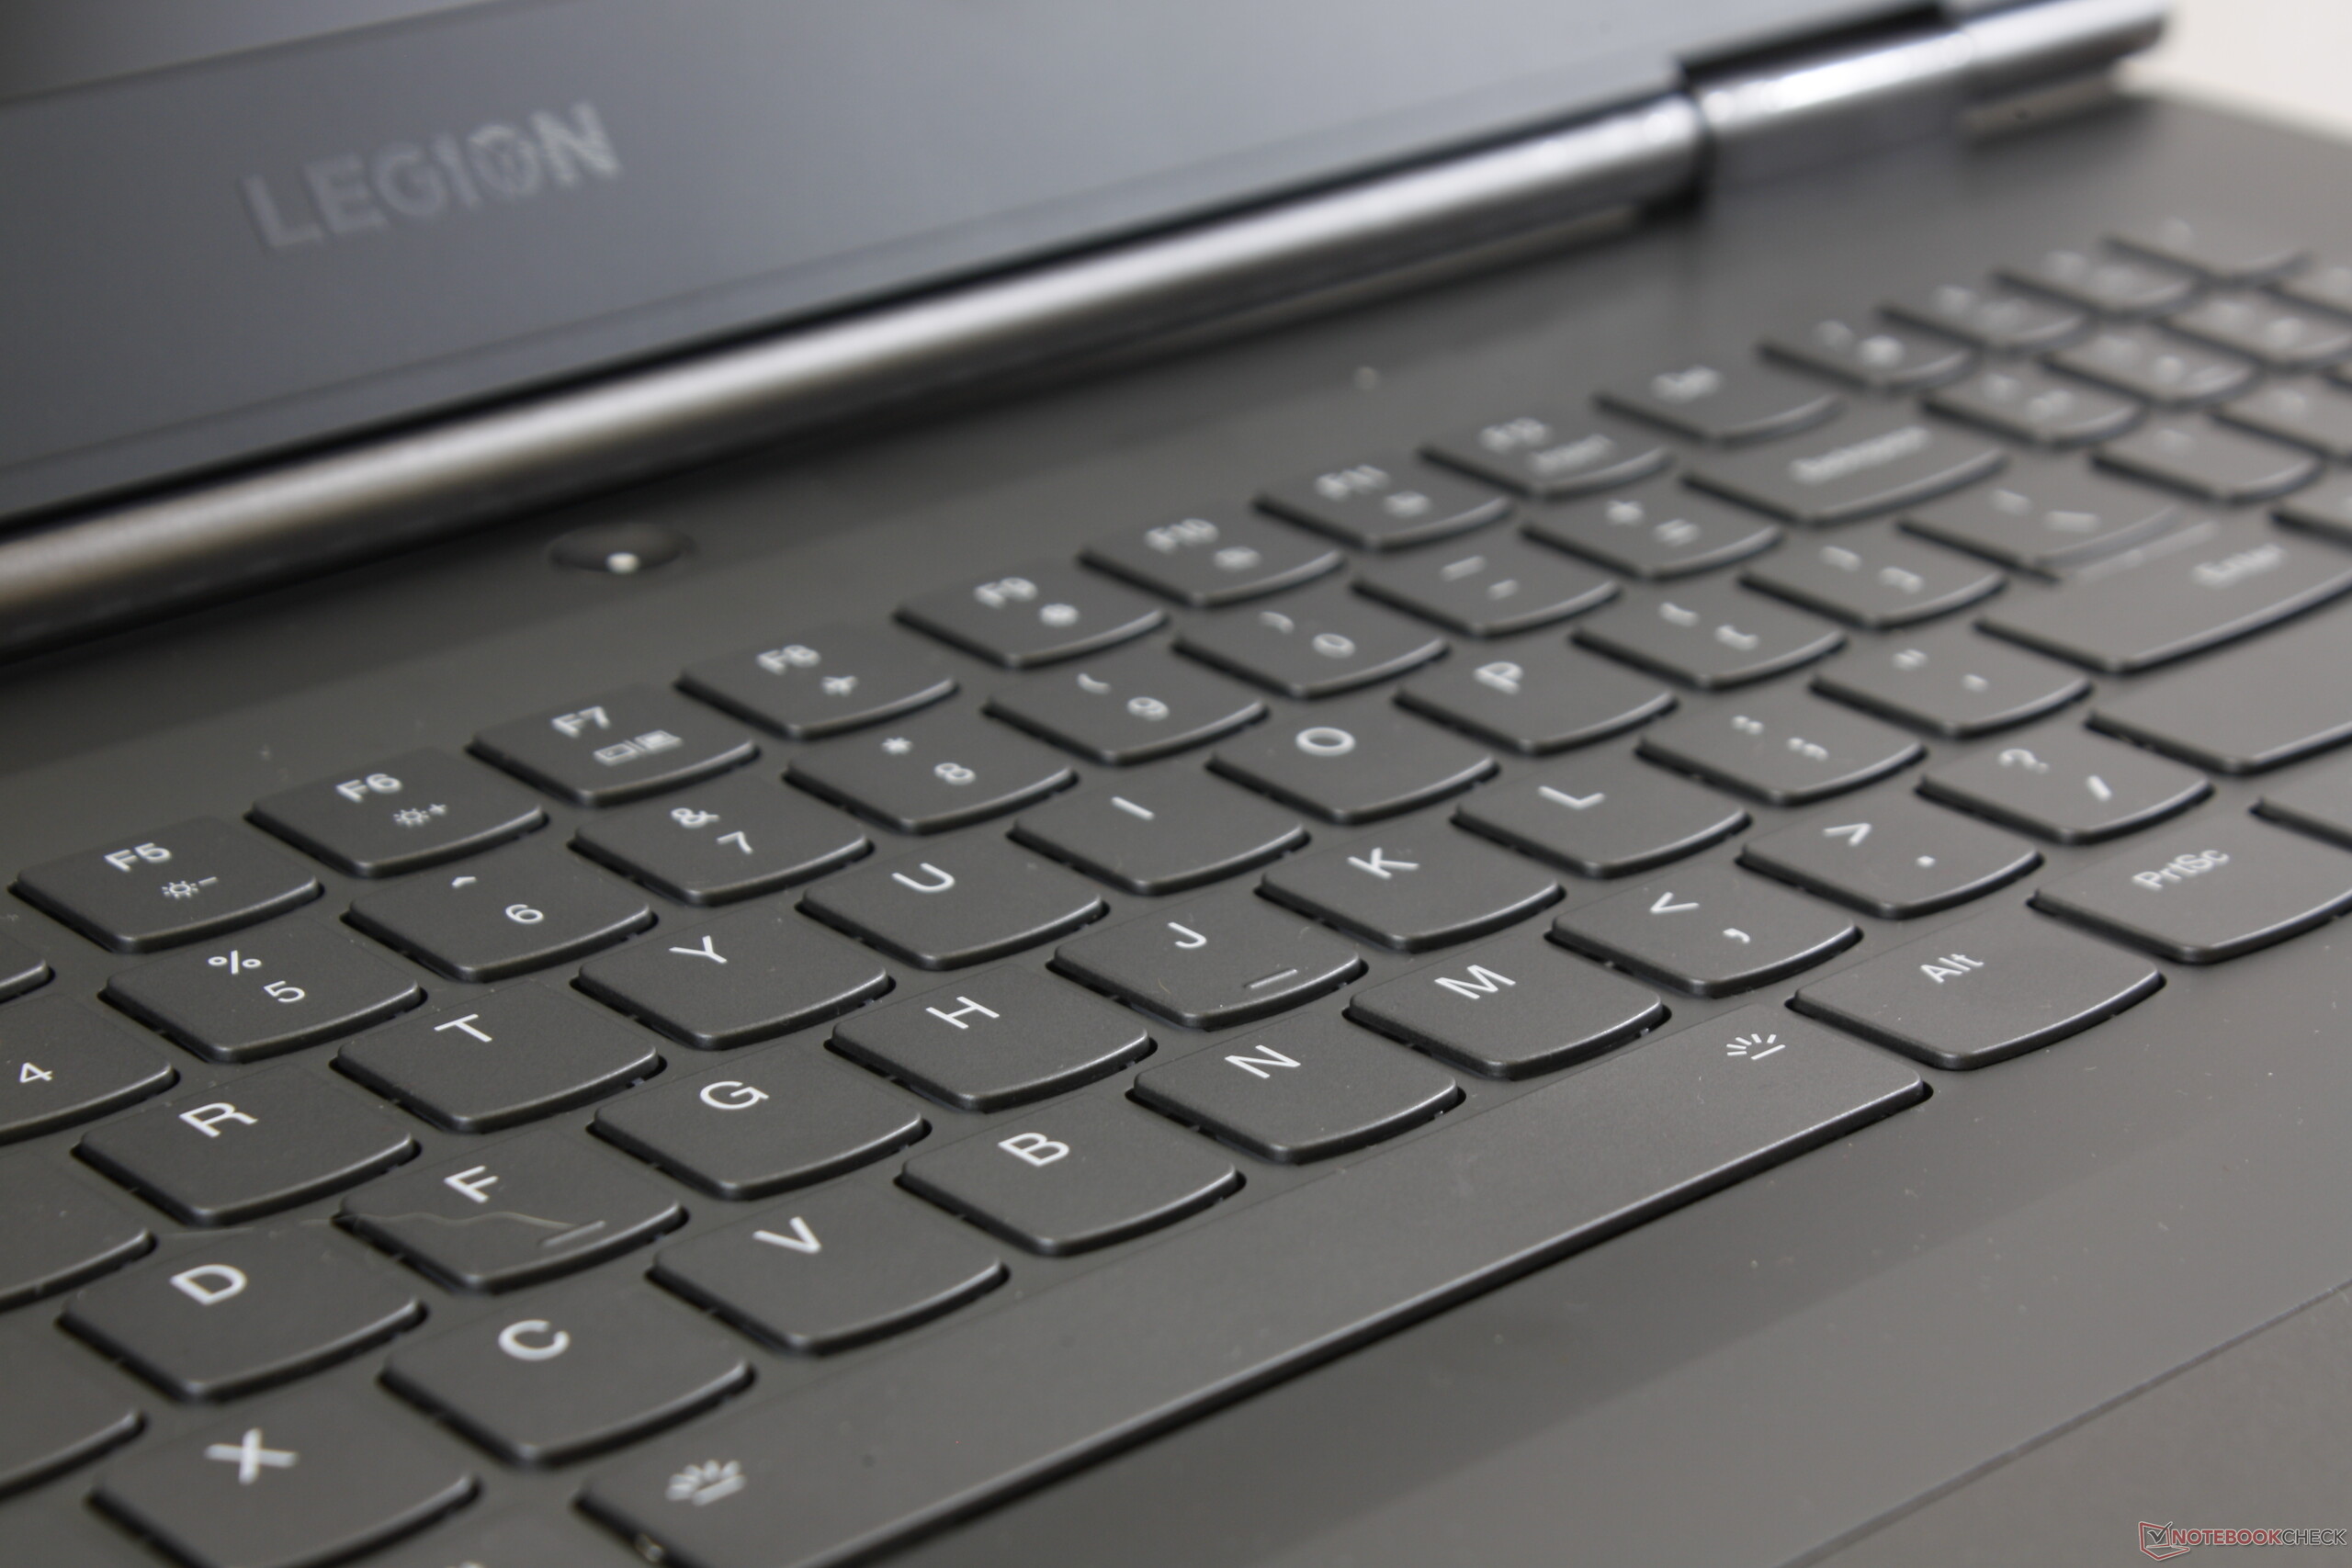
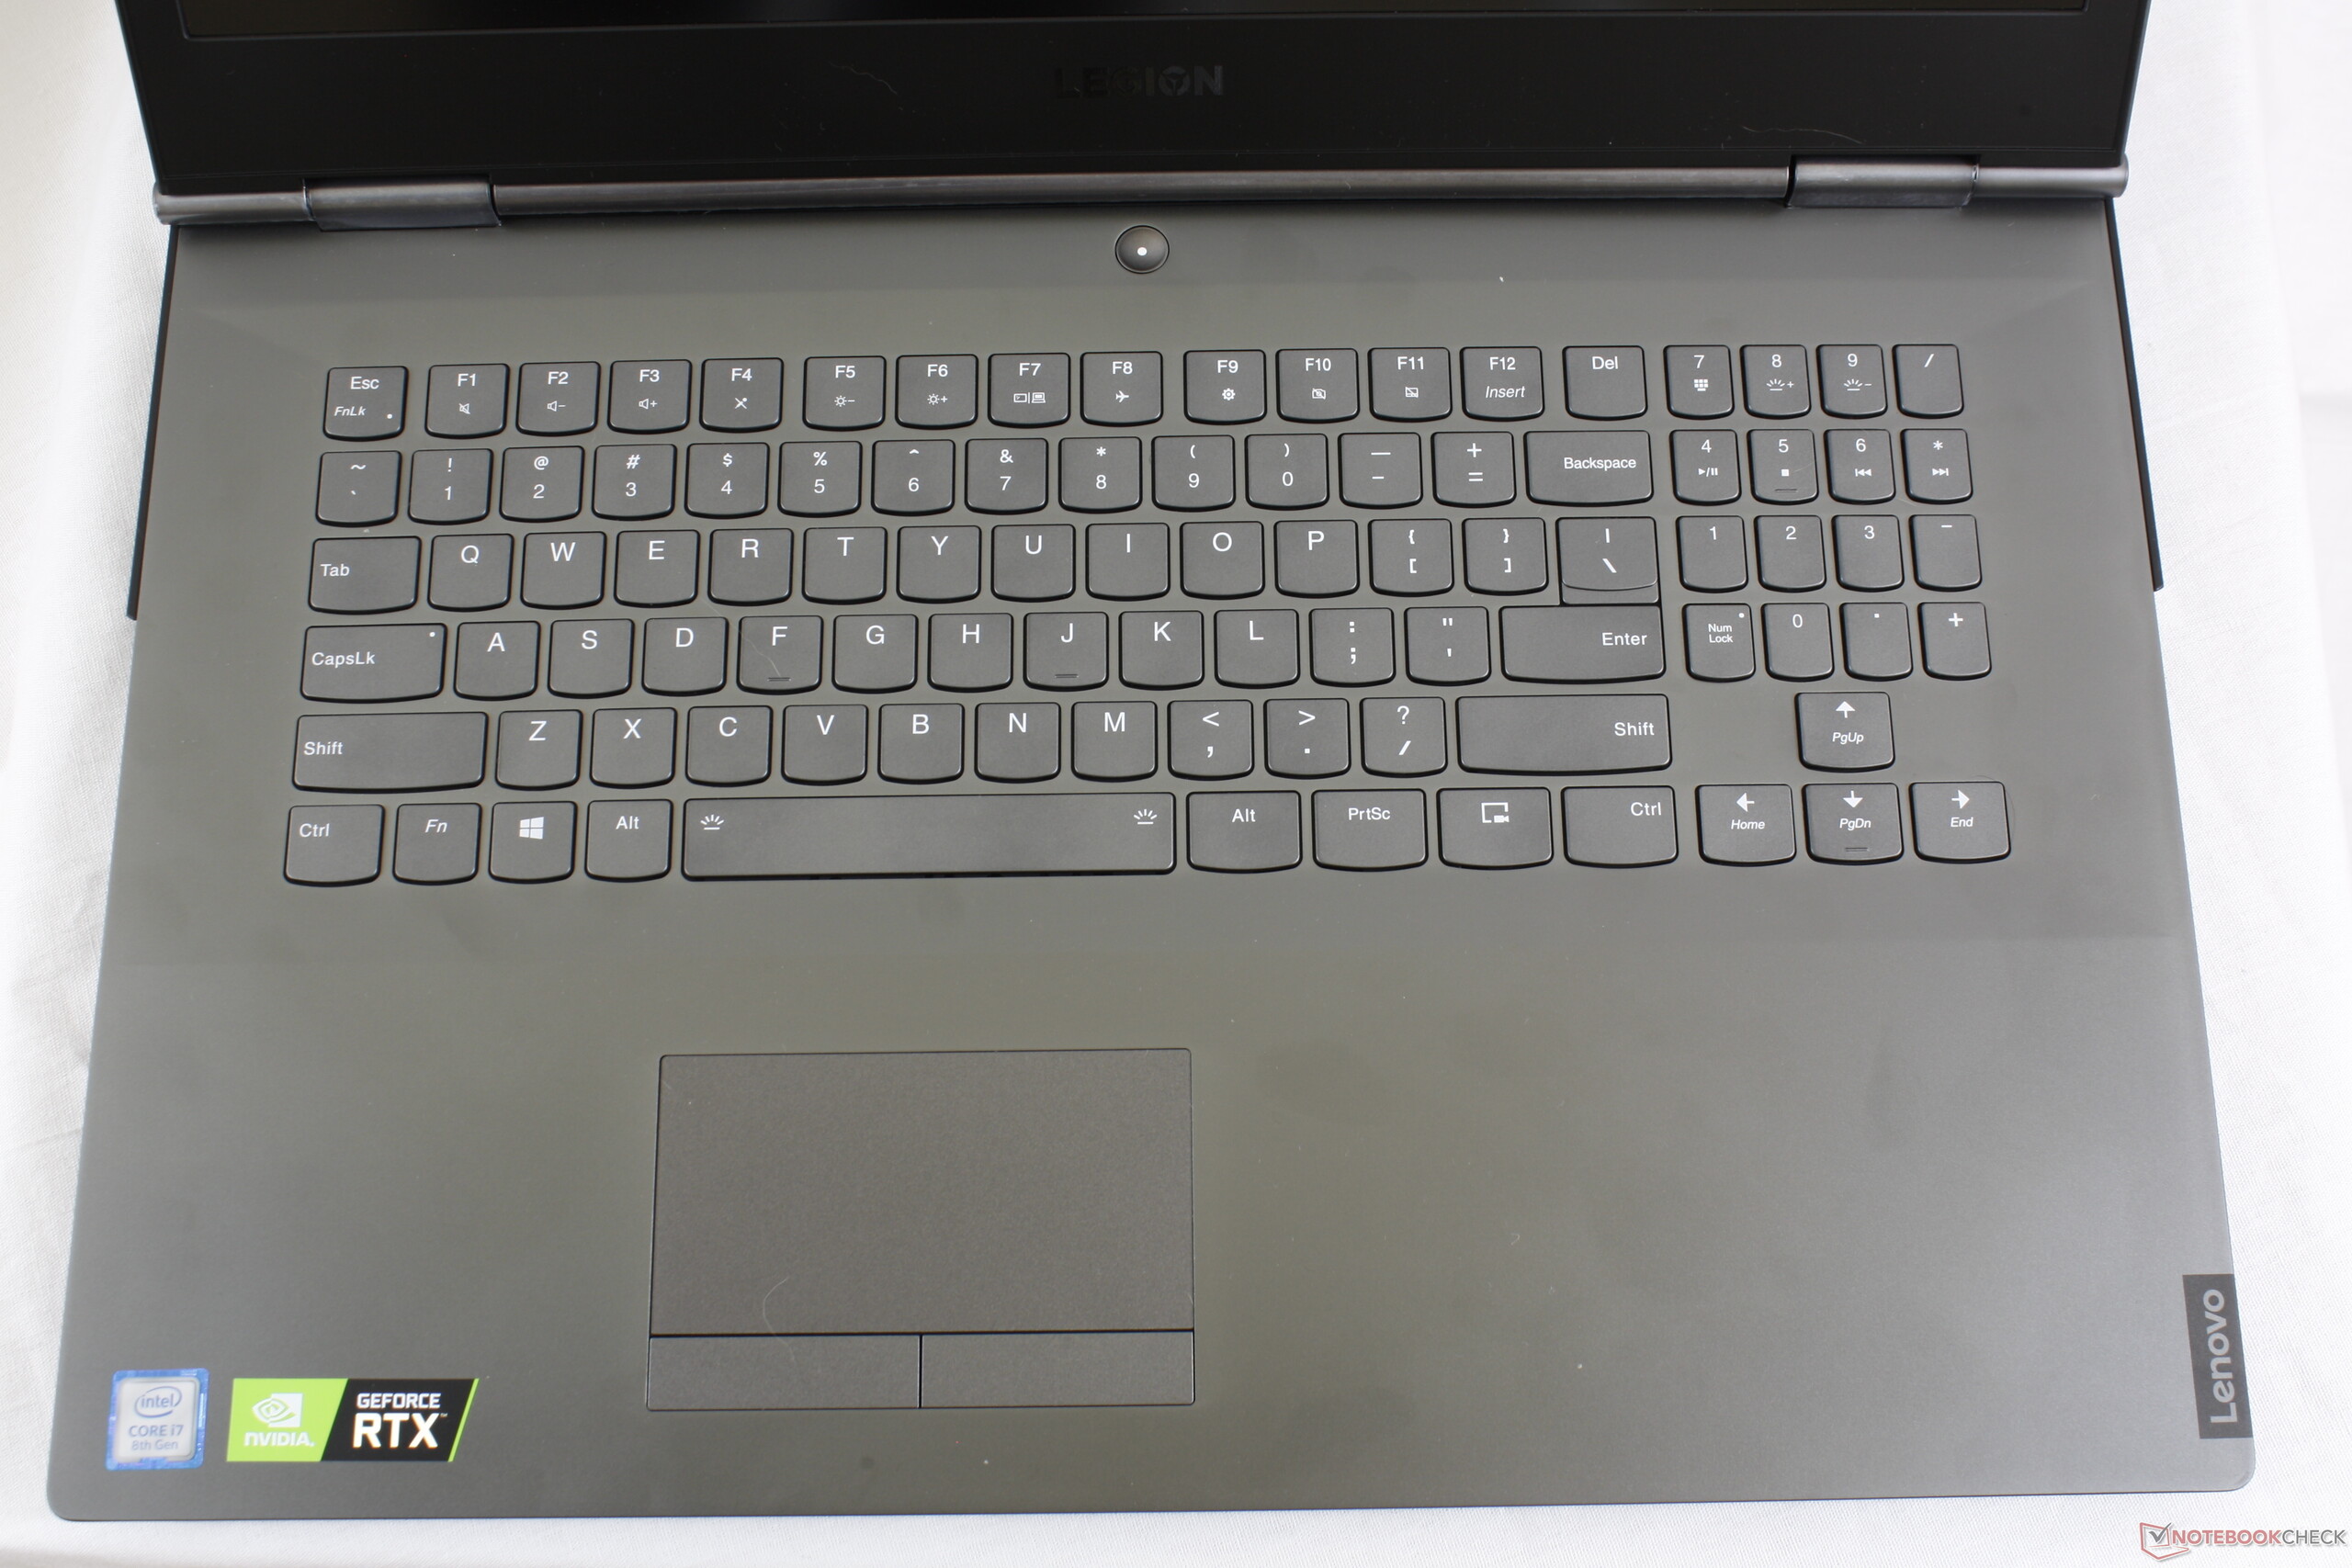
O teclado incluído (com iluminação RGB) provou ser adequado para o uso diário. No entanto, a duração da bateria não é particularmente impressionante - embora isso possa ser alterado. Ao ativar a GPU integrada, os usuários podem melhorar a duração da bateria, aumentando o tempo de duração Wi-Fi de 4:16 para 6:11.
Lenovo Legion Y740-17IRH
- 05/14/2020 v7 (old)
Sascha Mölck
Price comparison
