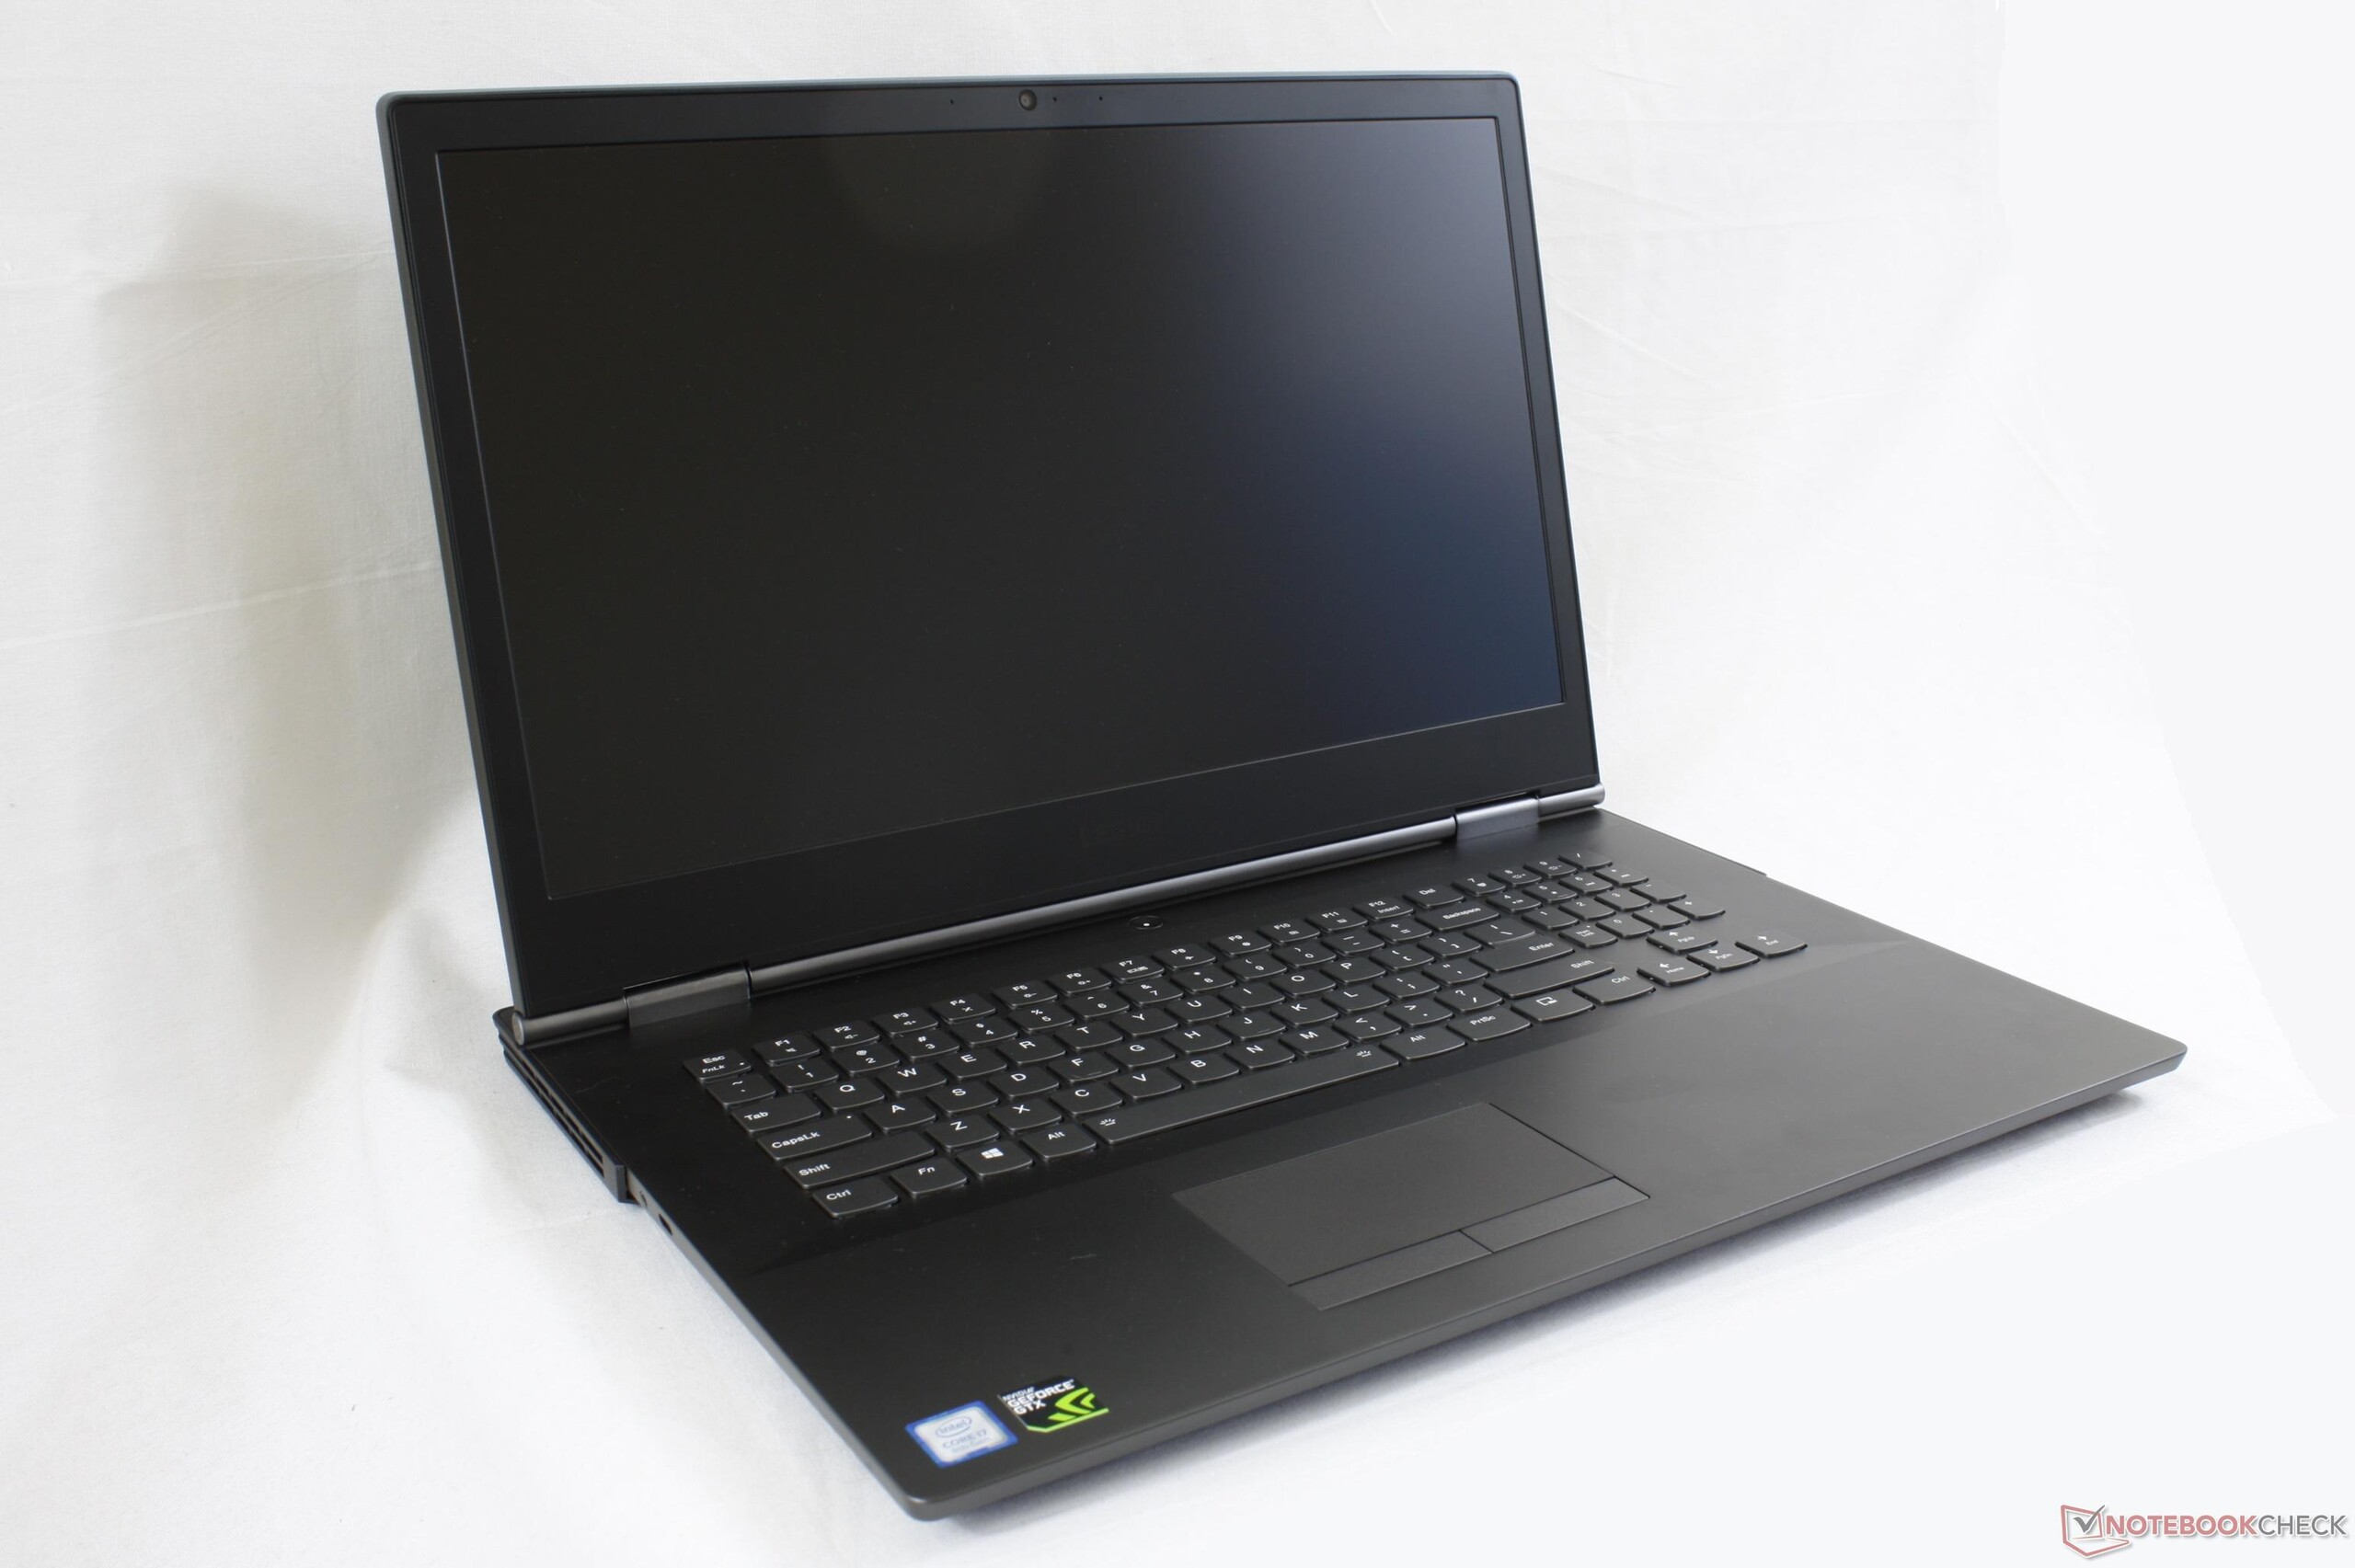
Breve Análise do Portátil Lenovo Legion Y740-17ICH (i7-8750H, RTX 2080 Max-Q)
| |||||||||||||||||||||||||
iluminação: 81 %
iluminação com acumulador: 299.1 cd/m²
Contraste: 1108:1 (Preto: 0.27 cd/m²)
ΔE ColorChecker Calman: 5.07 | ∀{0.5-29.43 Ø4.73}
calibrated: 3.31
ΔE Greyscale Calman: 6.8 | ∀{0.09-98 Ø4.97}
89.9% sRGB (Argyll 1.6.3 3D)
58.5% AdobeRGB 1998 (Argyll 1.6.3 3D)
64.8% AdobeRGB 1998 (Argyll 3D)
90.4% sRGB (Argyll 3D)
64% Display P3 (Argyll 3D)
Gamma: 2.46
CCT: 7805 K
| Lenovo Legion Y740-17ICH AU Optronics B173HAN03.2, IPS, 17.3", 1920x1080 | Asus ROG Strix Scar II GL704GW B173HAN04.0 (AUO409D), AHVA, 17.3", 1920x1080 | Razer Blade Pro 2017 Sharp LQ173D1JW33 (SHP145A), IGZO, 17.3", 3840x2160 | MSI GE75 8SG Raider CMN N173HCE-G33 (CMN175C), AHVA, 17.3", 1920x1080 | Alienware 17 R5 JYWWF_B173QTN (AUO1496), TN, 17.3", 2560x1440 | Lenovo Legion Y730-17ICH, i7-8750H LP173WF4-SPF6, IPS, 17.3", 1920x1080 | |
|---|---|---|---|---|---|---|
| Display | -3% | 35% | -2% | -3% | -2% | |
| Display P3 Coverage (%) | 64 | 62.9 -2% | 88.9 39% | 60.6 -5% | 63.4 -1% | 66.4 4% |
| sRGB Coverage (%) | 90.4 | 87.1 -4% | 100 11% | 91.2 1% | 86.1 -5% | 84.9 -6% |
| AdobeRGB 1998 Coverage (%) | 64.8 | 63.7 -2% | 99.7 54% | 62.6 -3% | 62.9 -3% | 62.1 -4% |
| Response Times | 0% | -245% | 39% | 10% | -112% | |
| Response Time Grey 50% / Grey 80% * (ms) | 15.6 ? | 17.6 ? -13% | 60.8 ? -290% | 8 ? 49% | 20.8 ? -33% | 36.8 ? -136% |
| Response Time Black / White * (ms) | 12.8 ? | 11.2 ? 13% | 38.4 ? -200% | 9.2 ? 28% | 6 ? 53% | 24 ? -88% |
| PWM Frequency (Hz) | 204.9 ? | 26040 ? | ||||
| Screen | 19% | 7% | 24% | -1% | -8% | |
| Brightness middle (cd/m²) | 299.1 | 295 -1% | 230 -23% | 363 21% | 398 33% | 328.7 10% |
| Brightness (cd/m²) | 273 | 291 7% | 207 -24% | 342 25% | 367 34% | 318 16% |
| Brightness Distribution (%) | 81 | 96 19% | 83 2% | 86 6% | 86 6% | 91 12% |
| Black Level * (cd/m²) | 0.27 | 0.24 11% | 0.2 26% | 0.27 -0% | 0.51 -89% | 0.51 -89% |
| Contrast (:1) | 1108 | 1229 11% | 1150 4% | 1344 21% | 780 -30% | 645 -42% |
| Colorchecker dE 2000 * | 5.07 | 3.2 37% | 5.62 -11% | 2.29 55% | 5.45 -7% | 4.91 3% |
| Colorchecker dE 2000 max. * | 10.55 | 6.64 37% | 10.24 3% | 4.54 57% | 10.36 2% | 10.15 4% |
| Colorchecker dE 2000 calibrated * | 3.31 | 2.52 24% | 2.45 26% | 2.56 23% | 4.27 -29% | |
| Greyscale dE 2000 * | 6.8 | 2.16 68% | 4.54 33% | 3.02 56% | 5.4 21% | 3.9 43% |
| Gamma | 2.46 89% | 2.46 89% | 2.36 93% | 2.38 92% | 2.4 92% | 2.13 103% |
| CCT | 7805 83% | 6872 95% | 6625 98% | 7048 92% | 7453 87% | 6911 94% |
| Color Space (Percent of AdobeRGB 1998) (%) | 58.5 | 57 -3% | 88 50% | 58 -1% | 56 -4% | 55.6 -5% |
| Color Space (Percent of sRGB) (%) | 89.9 | 87 -3% | 100 11% | 91 1% | 86 -4% | 84.7 -6% |
| Média Total (Programa/Configurações) | 5% /
12% | -68% /
-21% | 20% /
21% | 2% /
-0% | -41% /
-20% |
* ... menor é melhor
Exibir tempos de resposta
| ↔ Tempo de resposta preto para branco | ||
|---|---|---|
| 12.8 ms ... ascensão ↗ e queda ↘ combinadas | ↗ 7.6 ms ascensão | 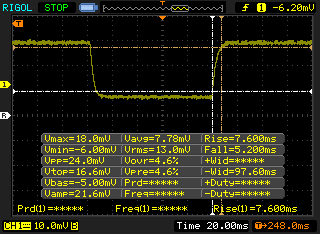 |
| ↘ 5.2 ms queda | ||
| A tela mostra boas taxas de resposta em nossos testes, mas pode ser muito lenta para jogadores competitivos. Em comparação, todos os dispositivos testados variam de 0.1 (mínimo) a 240 (máximo) ms. » 33 % de todos os dispositivos são melhores. Isso significa que o tempo de resposta medido é melhor que a média de todos os dispositivos testados (19.9 ms). | ||
| ↔ Tempo de resposta 50% cinza a 80% cinza | ||
| 15.6 ms ... ascensão ↗ e queda ↘ combinadas | ↗ 8 ms ascensão | 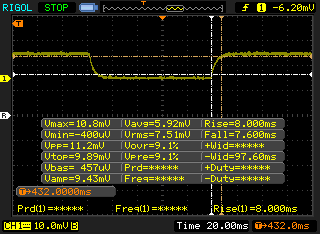 |
| ↘ 7.6 ms queda | ||
| A tela mostra boas taxas de resposta em nossos testes, mas pode ser muito lenta para jogadores competitivos. Em comparação, todos os dispositivos testados variam de 0.165 (mínimo) a 636 (máximo) ms. » 30 % de todos os dispositivos são melhores. Isso significa que o tempo de resposta medido é melhor que a média de todos os dispositivos testados (31.1 ms). | ||
Cintilação da tela / PWM (modulação por largura de pulso)
| Tela tremeluzindo / PWM não detectado | 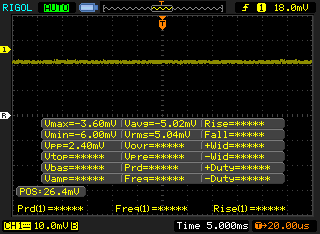 | ||
[pwm_comparison] Em comparação: 52 % de todos os dispositivos testados não usam PWM para escurecer a tela. Se PWM foi detectado, uma média de 7784 (mínimo: 5 - máximo: 343500) Hz foi medida. | |||
| Cinebench R15 | |
| CPU Single 64Bit | |
| Intel Core i7-9700K, AMD Radeon RX Vega 64 | |
| Dell XPS 15 9570 Core i9 UHD | |
| Lenovo Legion Y730-17ICH, i7-8750H | |
| Alienware m15 GTX 1070 Max-Q | |
| Média Intel Core i7-8750H (163 - 177, n=86) | |
| Lenovo ThinkPad X1 Carbon 2018-20KGS5DU00 | |
| Lenovo Legion Y740-17ICH | |
| Lenovo Legion Y730-15ICH i5-8300H | |
| Lenovo Ideapad 720S-15IKB 81AC001AGE | |
| Acer Nitro 5 AN515-42-R6V0 | |
| CPU Multi 64Bit | |
| Intel Core i7-9700K, AMD Radeon RX Vega 64 | |
| Lenovo Legion Y740-17ICH | |
| Lenovo Legion Y730-17ICH, i7-8750H | |
| Dell XPS 15 9570 Core i9 UHD | |
| Alienware m15 GTX 1070 Max-Q | |
| Média Intel Core i7-8750H (863 - 1251, n=93) | |
| Lenovo Legion Y730-15ICH i5-8300H | |
| Lenovo Ideapad 720S-15IKB 81AC001AGE | |
| Acer Nitro 5 AN515-42-R6V0 | |
| Lenovo ThinkPad X1 Carbon 2018-20KGS5DU00 | |
| PCMark 8 Home Score Accelerated v2 | 5107 pontos | |
| PCMark 8 Work Score Accelerated v2 | 5882 pontos | |
| PCMark 10 Score | 6053 pontos | |
Ajuda | ||
| Lenovo Legion Y740-17ICH Samsung SSD PM981 MZVLB256HAHQ | Asus ROG Strix Scar II GL704GW Intel SSD 660p SSDPEKNW512G8 | Razer Blade Pro 2017 2x Samsung SSD PM951 MZVLV256HCHP (RAID 0) | Alienware 17 R5 SK hynix PC401 HFS256GD9TNG | HP Omen X 17-ap0xx Samsung PM961 MZVLW256HEHP | |
|---|---|---|---|---|---|
| AS SSD | -21% | 11% | -29% | 13% | |
| Seq Read (MB/s) | 1153 | 1315 14% | 2599 125% | 2203 91% | 2352 104% |
| Seq Write (MB/s) | 1328 | 927 -30% | 588 -56% | 559 -58% | 1145 -14% |
| 4K Read (MB/s) | 35.05 | 52.4 50% | 37.57 7% | 38.74 11% | 44.81 28% |
| 4K Write (MB/s) | 96 | 122.8 28% | 104.4 9% | 92.7 -3% | 116.2 21% |
| 4K-64 Read (MB/s) | 727 | 326.5 -55% | 1116 54% | 447.2 -38% | 967 33% |
| 4K-64 Write (MB/s) | 1212 | 727 -40% | 513 -58% | 279.1 -77% | 798 -34% |
| Access Time Read * (ms) | 0.063 | 0.11 -75% | 0.051 19% | 0.091 -44% | 0.05 21% |
| Access Time Write * (ms) | 0.04 | 0.045 -13% | 0.036 10% | 0.065 -63% | 0.032 20% |
| Score Read (Points) | 878 | 510 -42% | 1414 61% | 706 -20% | 1248 42% |
| Score Write (Points) | 1441 | 942 -35% | 676 -53% | 428 -70% | 1029 -29% |
| Score Total (Points) | 2784 | 1715 -38% | 2715 -2% | 1424 -49% | 2862 3% |
| Copy ISO MB/s (MB/s) | 1487 | 1834 23% | |||
| Copy Program MB/s (MB/s) | 608 | 492.1 -19% | |||
| Copy Game MB/s (MB/s) | 1162 | 983 -15% |
* ... menor é melhor

| 3DMark 11 Performance | 20177 pontos | |
| 3DMark Cloud Gate Standard Score | 37537 pontos | |
| 3DMark Fire Strike Score | 16302 pontos | |
| 3DMark Fire Strike Extreme Score | 8104 pontos | |
| 3DMark Time Spy Score | 7153 pontos | |
Ajuda | ||
| The Witcher 3 - 1920x1080 Ultra Graphics & Postprocessing (HBAO+) | |
| Asus ROG G703GX | |
| MSI GS75 8SG Stealth | |
| Lenovo Legion Y740-17ICH | |
| Asus ROG Strix Scar II GL704GW | |
| Razer Blade 15 RTX 2070 Max-Q | |
| HP Omen X 17-ap0xx | |
| Alienware 17 R5 | |
| Alienware m15 GTX 1070 Max-Q | |
| Lenovo Legion Y730-17ICH, i7-8750H | |
| Acer Nitro 5 AN515-42-R6V0 | |
| baixo | média | alto | ultra | |
|---|---|---|---|---|
| BioShock Infinite (2013) | 316.8 | 283.4 | 239.6 | 161.5 |
| The Witcher 3 (2015) | 305.4 | 222.4 | 144.2 | 73.1 |
| Rise of the Tomb Raider (2016) | 253.4 | 182.8 | 138.8 | 109 |
| Lenovo Legion Y740-17ICH GeForce RTX 2080 Max-Q, i7-8750H, Samsung SSD PM981 MZVLB256HAHQ | Asus ROG Strix Scar II GL704GW GeForce RTX 2070 Mobile, i7-8750H, Intel SSD 660p SSDPEKNW512G8 | Razer Blade Pro 2017 GeForce GTX 1080 Mobile, i7-7820HK, 2x Samsung SSD PM951 MZVLV256HCHP (RAID 0) | MSI GE75 8SG Raider GeForce RTX 2080 Mobile, i7-8750H, Kingston RBUSNS8154P3512GJ | Alienware 17 R5 GeForce GTX 1070 Mobile, i7-8750H, SK hynix PC401 HFS256GD9TNG | Lenovo Legion Y730-17ICH, i7-8750H GeForce GTX 1050 Ti Mobile, i7-8750H, Toshiba KBG30ZMT128G | |
|---|---|---|---|---|---|---|
| Noise | -14% | -13% | -18% | -12% | 3% | |
| desligado / ambiente * (dB) | 28.3 | 29 -2% | 30 -6% | 30 -6% | 30 -6% | 28 1% |
| Idle Minimum * (dB) | 31.5 | 29 8% | 30 5% | 30 5% | 32 -2% | 28 11% |
| Idle Average * (dB) | 31.6 | 32 -1% | 31 2% | 34 -8% | 33 -4% | 28 11% |
| Idle Maximum * (dB) | 31.6 | 40 -27% | 33 -4% | 37 -17% | 34 -8% | 31.3 1% |
| Load Average * (dB) | 32.3 | 46 -42% | 43 -33% | 52 -61% | 43 -33% | 33.4 -3% |
| Witcher 3 ultra * (dB) | 43 | 51 -19% | 55 -28% | 53 -23% | 51 -19% | 42.8 -0% |
| Load Maximum * (dB) | 45.5 | 52 -14% | 58 -27% | 54 -19% | 51 -12% | 46.2 -2% |
* ... menor é melhor
Barulho
| Ocioso |
| 31.5 / 31.6 / 31.6 dB |
| HDD |
| 31.6 dB |
| Carga |
| 32.3 / 45.5 dB |
 | ||
30 dB silencioso 40 dB(A) audível 50 dB(A) ruidosamente alto |
||
min: | ||
(+) A temperatura máxima no lado superior é 38.6 °C / 101 F, em comparação com a média de 40.4 °C / 105 F , variando de 21.2 a 68.8 °C para a classe Gaming.
(±) A parte inferior aquece até um máximo de 43.6 °C / 110 F, em comparação com a média de 43.2 °C / 110 F
(+) Em uso inativo, a temperatura média para o lado superior é 26.1 °C / 79 F, em comparação com a média do dispositivo de 33.9 °C / ### class_avg_f### F.
(+) Jogando The Witcher 3, a temperatura média para o lado superior é 29.6 °C / 85 F, em comparação com a média do dispositivo de 33.9 °C / ## #class_avg_f### F.
(+) Os apoios para as mãos e o touchpad são mais frios que a temperatura da pele, com um máximo de 27 °C / 80.6 F e, portanto, são frios ao toque.
(±) A temperatura média da área do apoio para as mãos de dispositivos semelhantes foi 28.8 °C / 83.8 F (+1.8 °C / 3.2 F).
Lenovo Legion Y740-17ICH análise de áudio
(±) | o volume do alto-falante é médio, mas bom (###valor### dB)
Graves 100 - 315Hz
(-) | quase nenhum baixo - em média 21.1% menor que a mediana
(-) | graves não são lineares (16.5% delta para frequência anterior)
Médios 400 - 2.000 Hz
(+) | médios equilibrados - apenas 3.3% longe da mediana
(±) | a linearidade dos médios é média (9.7% delta para frequência anterior)
Altos 2 - 16 kHz
(+) | agudos equilibrados - apenas 1.7% longe da mediana
(+) | os máximos são lineares (4.6% delta da frequência anterior)
Geral 100 - 16.000 Hz
(±) | a linearidade do som geral é média (23.4% diferença em relação à mediana)
Comparado com a mesma classe
» 85% de todos os dispositivos testados nesta classe foram melhores, 5% semelhantes, 11% piores
» O melhor teve um delta de 6%, a média foi 18%, o pior foi 132%
Comparado com todos os dispositivos testados
» 70% de todos os dispositivos testados foram melhores, 6% semelhantes, 24% piores
» O melhor teve um delta de 4%, a média foi 24%, o pior foi 134%
Apple MacBook 12 (Early 2016) 1.1 GHz análise de áudio
(+) | os alto-falantes podem tocar relativamente alto (###valor### dB)
Graves 100 - 315Hz
(±) | graves reduzidos - em média 11.3% menor que a mediana
(±) | a linearidade dos graves é média (14.2% delta para a frequência anterior)
Médios 400 - 2.000 Hz
(+) | médios equilibrados - apenas 2.4% longe da mediana
(+) | médios são lineares (5.5% delta para frequência anterior)
Altos 2 - 16 kHz
(+) | agudos equilibrados - apenas 2% longe da mediana
(+) | os máximos são lineares (4.5% delta da frequência anterior)
Geral 100 - 16.000 Hz
(+) | o som geral é linear (10.2% diferença em relação à mediana)
Comparado com a mesma classe
» 7% de todos os dispositivos testados nesta classe foram melhores, 2% semelhantes, 91% piores
» O melhor teve um delta de 5%, a média foi 18%, o pior foi 53%
Comparado com todos os dispositivos testados
» 5% de todos os dispositivos testados foram melhores, 1% semelhantes, 94% piores
» O melhor teve um delta de 4%, a média foi 24%, o pior foi 134%
| desligado | |
| Ocioso | |
| Carga |
|
Key:
min: | |
| Lenovo Legion Y740-17ICH i7-8750H, GeForce RTX 2080 Max-Q, Samsung SSD PM981 MZVLB256HAHQ, IPS, 1920x1080, 17.3" | Asus ROG Strix Scar II GL704GW i7-8750H, GeForce RTX 2070 Mobile, Intel SSD 660p SSDPEKNW512G8, AHVA, 1920x1080, 17.3" | Razer Blade Pro 2017 i7-7820HK, GeForce GTX 1080 Mobile, 2x Samsung SSD PM951 MZVLV256HCHP (RAID 0), IGZO, 3840x2160, 17.3" | MSI GE75 8SG Raider i7-8750H, GeForce RTX 2080 Mobile, Kingston RBUSNS8154P3512GJ, AHVA, 1920x1080, 17.3" | Alienware 17 R5 i7-8750H, GeForce GTX 1070 Mobile, SK hynix PC401 HFS256GD9TNG, TN, 2560x1440, 17.3" | Lenovo Legion Y730-17ICH, i7-8750H i7-8750H, GeForce GTX 1050 Ti Mobile, Toshiba KBG30ZMT128G, IPS, 1920x1080, 17.3" | |
|---|---|---|---|---|---|---|
| Power Consumption | -9% | -42% | 7% | -29% | 41% | |
| Idle Minimum * (Watt) | 20.2 | 19 6% | 31 -53% | 7 65% | 28 -39% | 6.3 69% |
| Idle Average * (Watt) | 27.2 | 22 19% | 36 -32% | 15 45% | 32 -18% | 11 60% |
| Idle Maximum * (Watt) | 28.7 | 29 -1% | 44 -53% | 22 23% | 37 -29% | 11.5 60% |
| Load Average * (Watt) | 90.8 | 102 -12% | 107 -18% | 92 -1% | 112 -23% | 89.8 1% |
| Witcher 3 ultra * (Watt) | 152.1 | 190 -25% | 212 -39% | 207 -36% | 192 -26% | 102 33% |
| Load Maximum * (Watt) | 165.4 | 231 -40% | 258 -56% | 254 -54% | 231 -40% | 130.7 21% |
* ... menor é melhor
| Lenovo Legion Y740-17ICH i7-8750H, GeForce RTX 2080 Max-Q, 76 Wh | Asus ROG Strix Scar II GL704GW i7-8750H, GeForce RTX 2070 Mobile, 66 Wh | Razer Blade Pro 2017 i7-7820HK, GeForce GTX 1080 Mobile, 99 Wh | MSI GE75 8SG Raider i7-8750H, GeForce RTX 2080 Mobile, 65 Wh | Alienware 17 R5 i7-8750H, GeForce GTX 1070 Mobile, 99 Wh | Lenovo Legion Y730-17ICH, i7-8750H i7-8750H, GeForce GTX 1050 Ti Mobile, 76 Wh | |
|---|---|---|---|---|---|---|
| Duração da bateria | 22% | 3% | 47% | 13% | 109% | |
| WiFi v1.3 (h) | 3.2 | 3.9 22% | 3.3 3% | 4.7 47% | 3.6 13% | 6.7 109% |
| Reader / Idle (h) | 6.2 | 4.2 | 7.8 | 4.5 | 13.2 | |
| Witcher 3 ultra (h) | 0.9 | 0.8 | ||||
| Load (h) | 1.1 | 1.4 | 0.9 | 1.1 | 0.9 |
Pro
Contra
A maioria dos OEMs normalmente reserva as GPUs GeForce 80 de gama alta para seus modelos carro-chefe entusiastas. Isto costumava ser a família Legion Y900 para a Lenovo, mas o fabricante desde então deixou essa série em espera deixando a série Legion Y700 de gama média como a oferte de maior gama. O resultado é um portátil de jogos de gama média com uma GPU GeForce de gama alta a preços muito mais acessíveis do que "super” portáteis de jogos concorrentes como o Alienware m17, Asus ROG G703, MSI GT75, ou Acer Triton 700. O portátil da Lenovo oferece o mesmo desempenho de jogo que essas alternativas de entusiastas por centenas de dólares a menos, em grande parte porque seu design de chassi é mais simples e menos excêntrico.
O desempenho da CPU é mais rápido do que a média do Core i7-8750H devido à excelente sustentabilidade do Turbo Boost. Tanto as temperaturas do núcleo como o ruído do ventilador são menores do que o esperado, considerando também o formato fino e o alto desempenho.
Como o Legion Y740 carrega um chassi de médio alcance, no entanto, as primeiras impressões não são tão fortes quanto as alternativas de gama alta já mencionadas. O dispositivo da Lenovo é mais propenso a se flexionar e balançar do que o mais rígido (e mais caro) MSI GT75 ou Asus ROG G703. Nossa unidade específica também sofre de bleeding da iluminação de fundo moderada-pesada e cores imprecisas. Suas teclas são mais suaves e geralmente mais fracas para jogos também. Os jogadores não perderão desempenho, mas o chassi e as teclas mais fracos afetarão a experiência geral de jogo.
O Legion Y740 de gama média é vendido por muito menos do que um portátil de jogos de 17,3 polegadas, entusiasta da concorrência, enquanto ostenta a mesma CPU e GPU de gama alta. Ele tem excelente valor em termos de desempenho, desde que você esteja conforme com seu design modesto e chassi mais flexível.
Lenovo Legion Y740-17ICH
- 03/01/2019 v6 (old)
Allen Ngo
Price comparison
