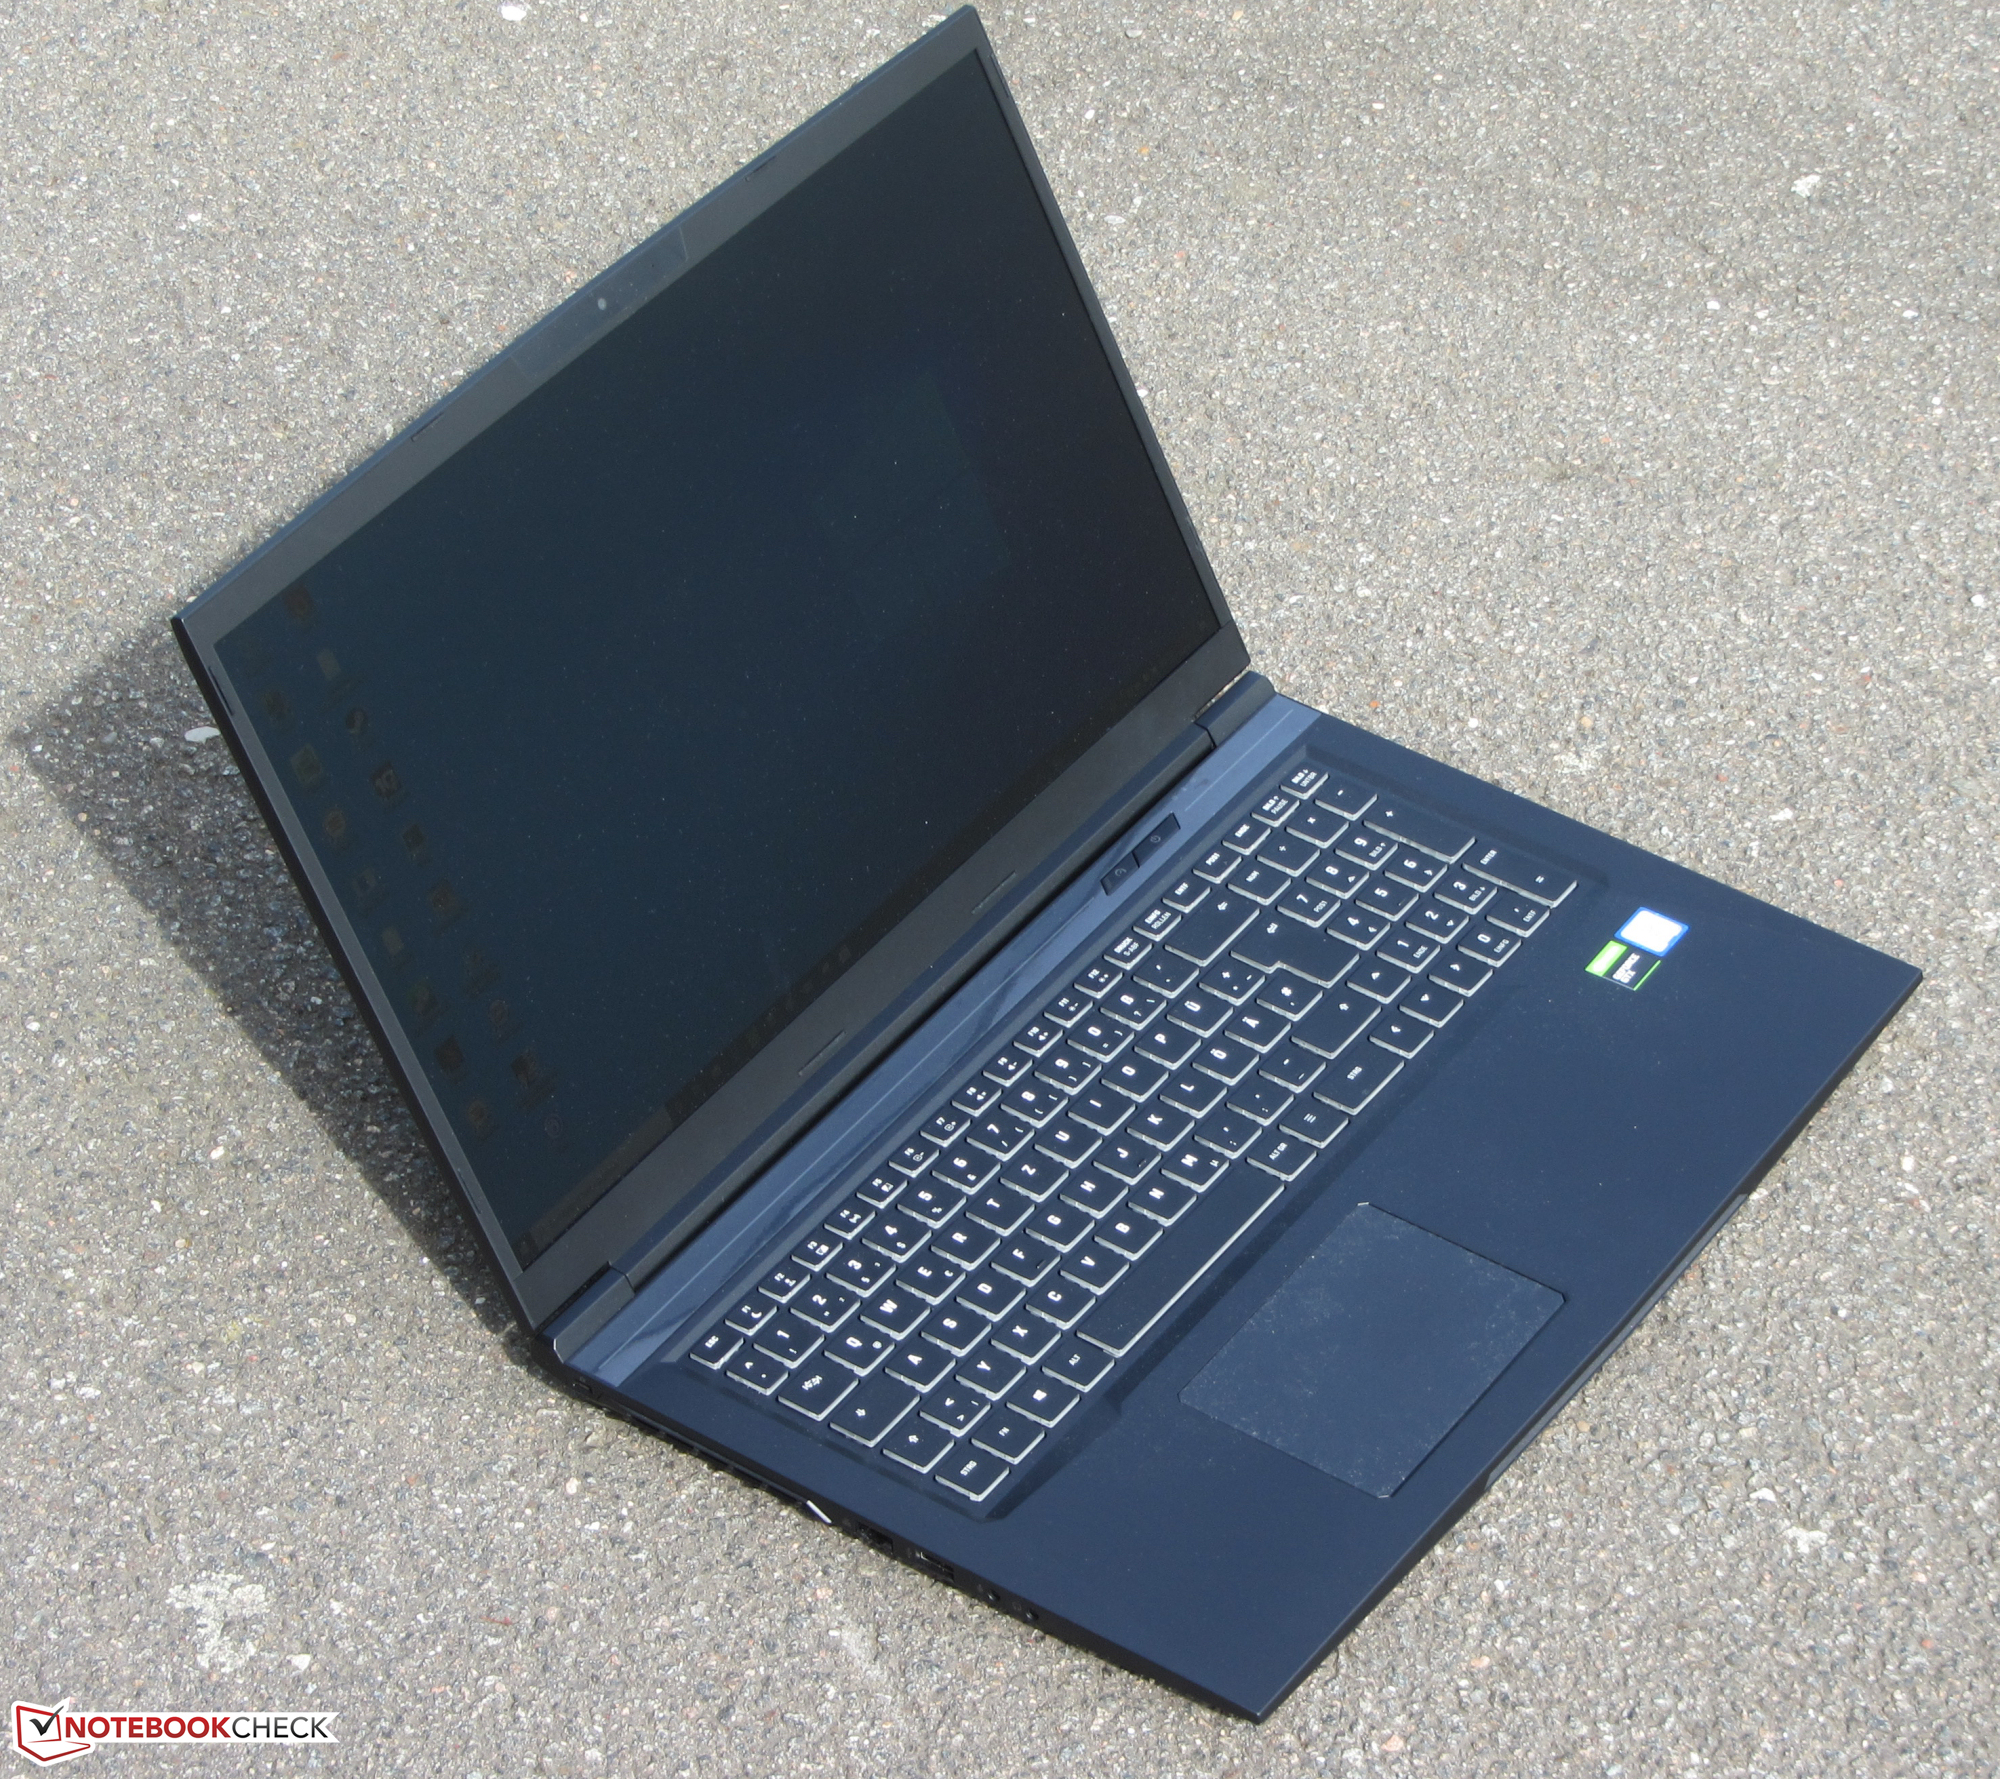
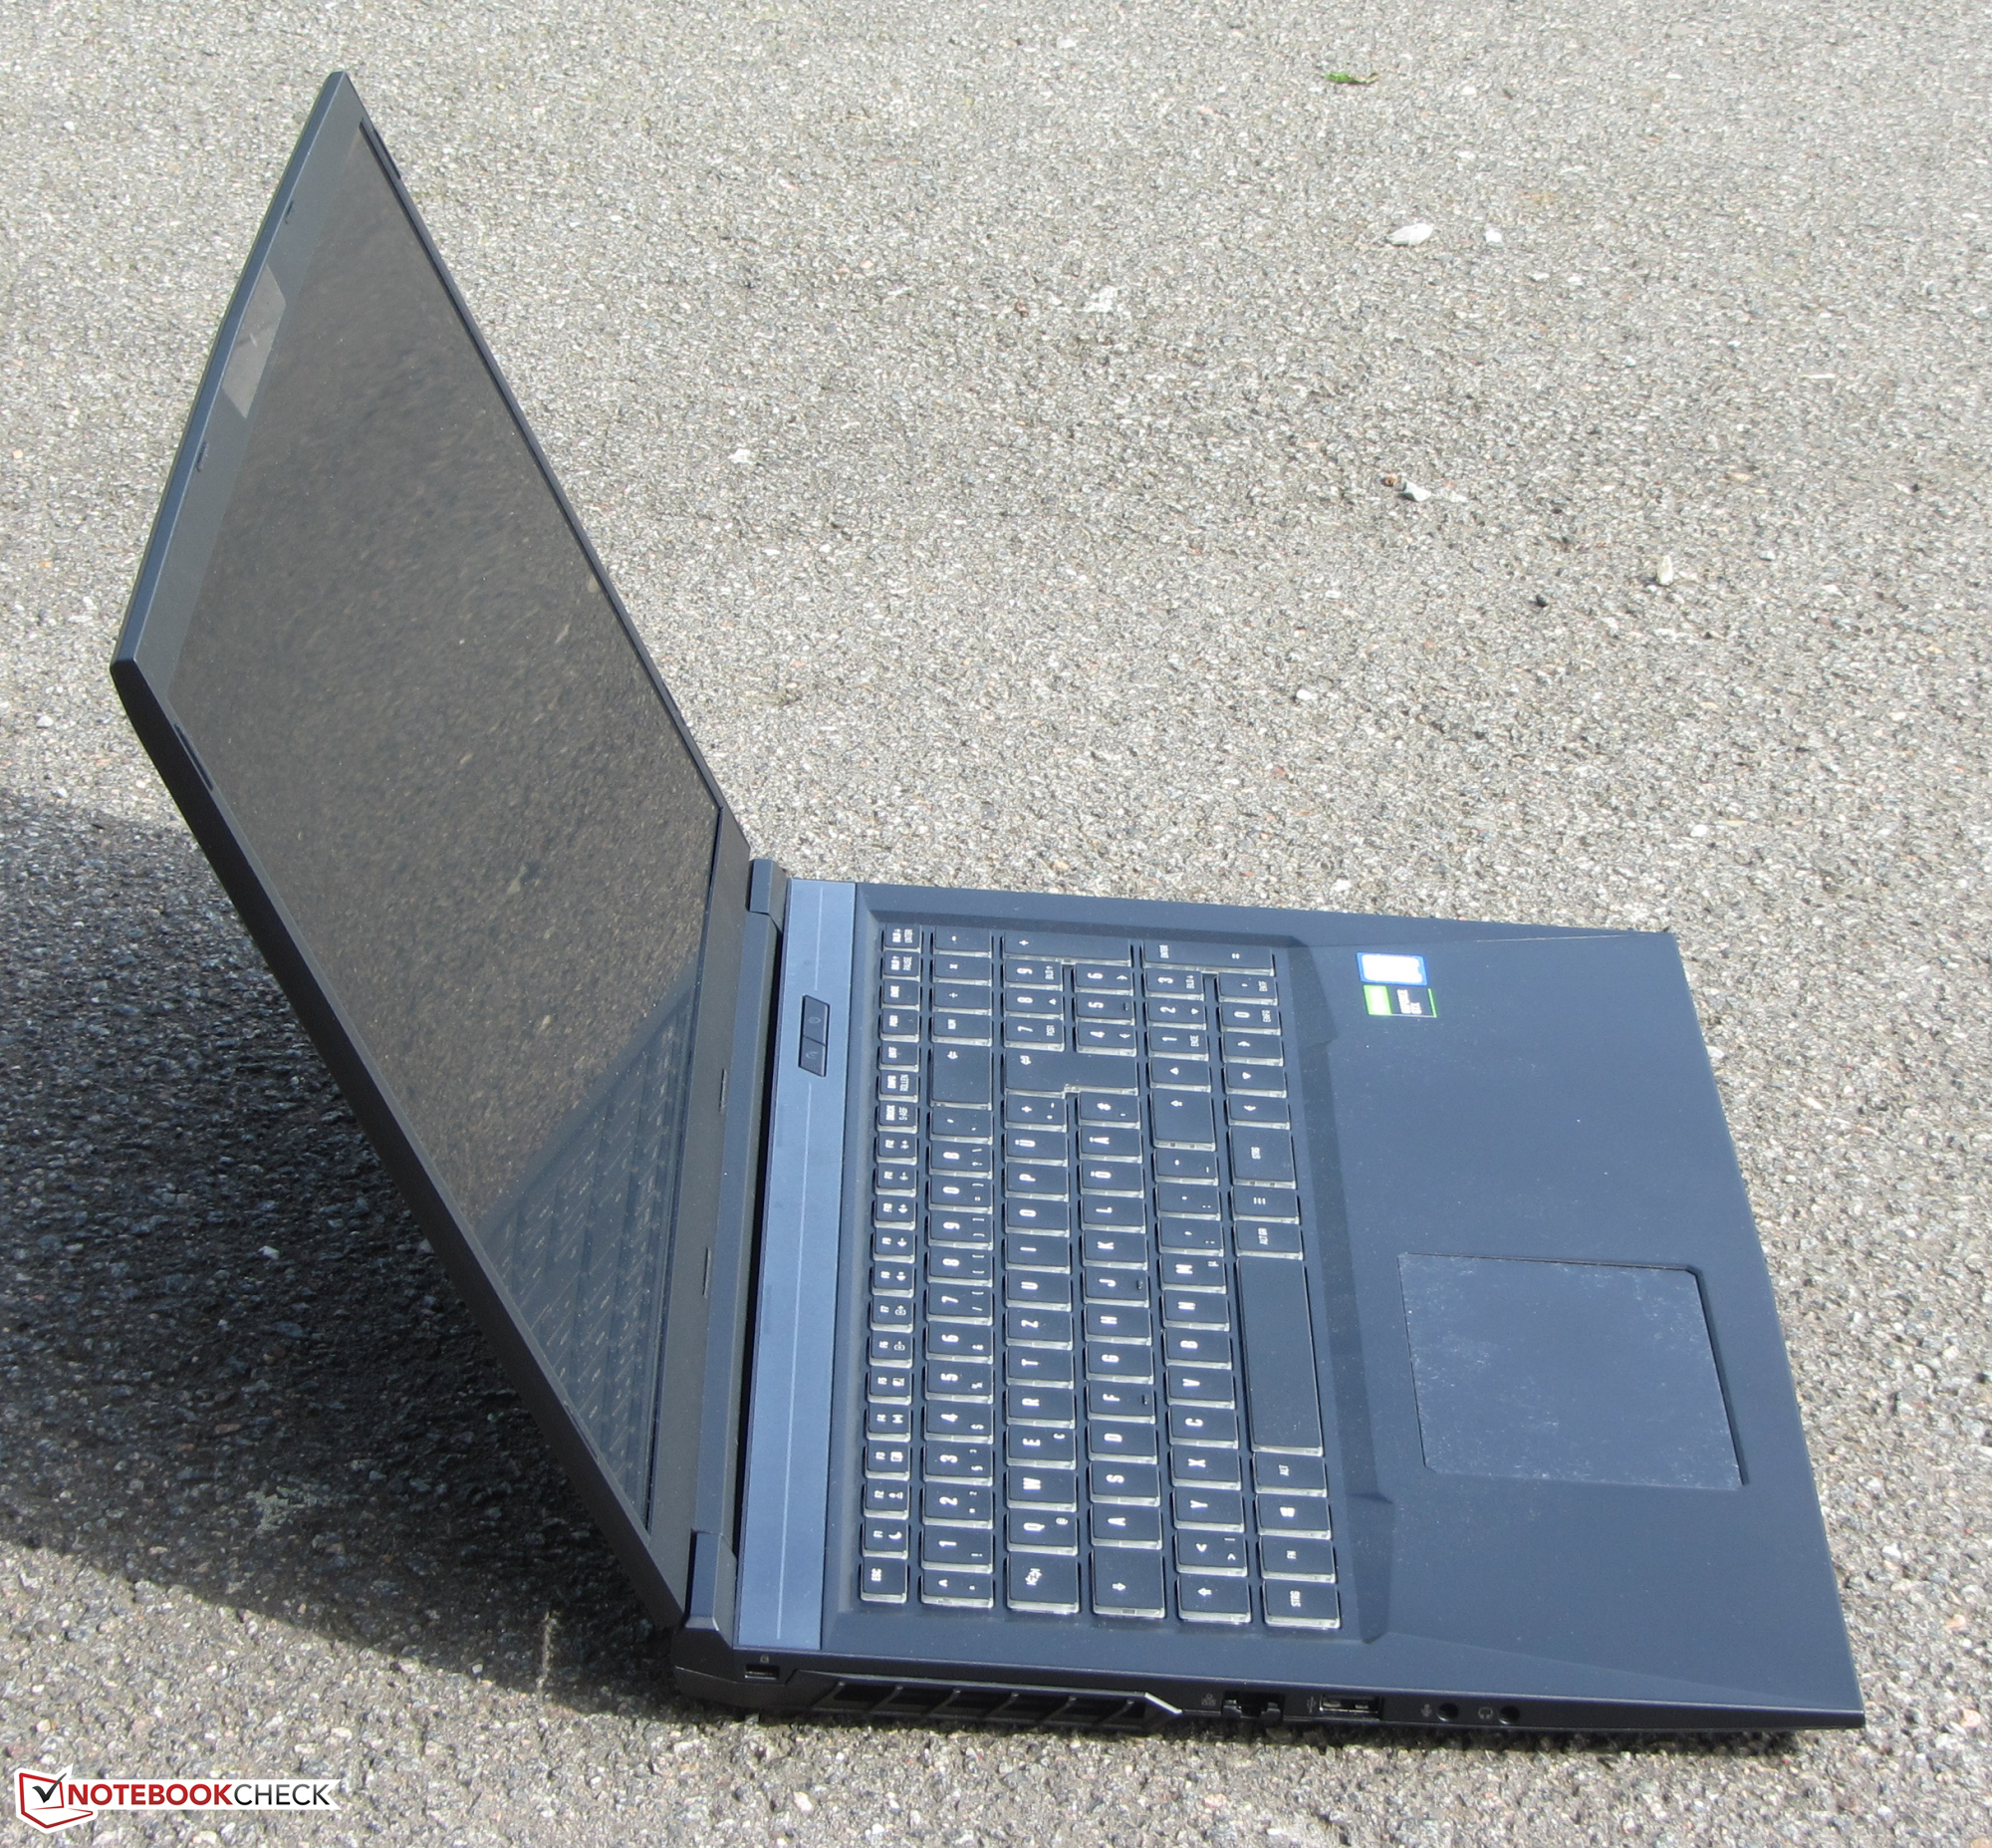
Breve Análise do Portátil Schenker XMG Core 17 (Core i7-9750H, GeForce GTX 1660 Ti, Tela de 144-Hz) Tongfang GK7CP6R

| SD Card Reader | |
| average JPG Copy Test (av. of 3 runs) | |
| Média da turma Gaming (20.9 - 210, n=54, últimos 2 anos) | |
| Schenker XMG Core 15 (Toshiba Exceria Pro SDXC 64 GB UHS-II) | |
| Schenker XMG Neo 17 (Toshiba Exceria Pro SDXC 64 GB UHS-II) | |
| Gigabyte Sabre 17-W8 (Toshiba Exceria Pro SDXC 64 GB UHS-II) | |
| Dell G7 17 7790 (Toshiba Exceria Pro SDXC 64 GB UHS-II) | |
| MSI GP75 Leopard 9SD (Toshiba Exceria Pro SDXC 64 GB UHS-II) | |
| Schenker XMG Core 17 (Toshiba Exceria Pro SDXC 64 GB UHS-II) | |
| maximum AS SSD Seq Read Test (1GB) | |
| Média da turma Gaming (25.5 - 261, n=51, últimos 2 anos) | |
| Schenker XMG Neo 17 (Toshiba Exceria Pro SDXC 64 GB UHS-II) | |
| Schenker XMG Core 15 (Toshiba Exceria Pro SDXC 64 GB UHS-II) | |
| Gigabyte Sabre 17-W8 (Toshiba Exceria Pro SDXC 64 GB UHS-II) | |
| Dell G7 17 7790 (Toshiba Exceria Pro SDXC 64 GB UHS-II) | |
| MSI GP75 Leopard 9SD (Toshiba Exceria Pro SDXC 64 GB UHS-II) | |
| Schenker XMG Core 17 (Toshiba Exceria Pro SDXC 64 GB UHS-II) | |
| |||||||||||||||||||||||||
iluminação: 79 %
iluminação com acumulador: 329 cd/m²
Contraste: 1097:1 (Preto: 0.3 cd/m²)
ΔE ColorChecker Calman: 2.52 | ∀{0.5-29.43 Ø4.72}
calibrated: 1.31
ΔE Greyscale Calman: 2.98 | ∀{0.09-98 Ø4.97}
95% sRGB (Argyll 1.6.3 3D)
60% AdobeRGB 1998 (Argyll 1.6.3 3D)
65.6% AdobeRGB 1998 (Argyll 3D)
95.6% sRGB (Argyll 3D)
64.4% Display P3 (Argyll 3D)
Gamma: 2.38
CCT: 6738 K
| Schenker XMG Core 17 LG Philips LP173WFG-SPB1 (LGD0615), IPS, 1920x1080 | Schenker XMG Neo 17 BOEhydis NV173FHM-N44 (BOE07B6), IPS, 1920x1080 | Dell G7 17 7790 AU Optronics AUO409D, B173HAN, IPS, 1920x1080 | MSI GP75 Leopard 9SD Chi Mei N173HCE-G33 (CMN175C), IPS, 1920x1080 | Gigabyte Sabre 17-W8 Chi Mei CMN1747, TN, 1920x1080 | Lenovo Legion Y730-17ICH, i7-8750H LP173WF4-SPF6, IPS, 1920x1080 | |
|---|---|---|---|---|---|---|
| Display | -1% | -5% | -1% | 25% | -4% | |
| Display P3 Coverage (%) | 64.4 | 65.2 1% | 61.9 -4% | 63.4 -2% | 89.9 40% | 66.4 3% |
| sRGB Coverage (%) | 95.6 | 92.2 -4% | 89.6 -6% | 94.9 -1% | 100 5% | 84.9 -11% |
| AdobeRGB 1998 Coverage (%) | 65.6 | 66.5 1% | 63.2 -4% | 65.1 -1% | 85.1 30% | 62.1 -5% |
| Response Times | -28% | -22% | 26% | 27% | -153% | |
| Response Time Grey 50% / Grey 80% * (ms) | 14.4 ? | 18.8 ? -31% | 17.2 ? -19% | 8 ? 44% | 9 ? 37% | 36.8 ? -156% |
| Response Time Black / White * (ms) | 9.6 ? | 12 ? -25% | 12 ? -25% | 8.8 ? 8% | 8 ? 17% | 24 ? -150% |
| PWM Frequency (Hz) | 971 ? | 25510 ? | 25000 ? | |||
| Screen | 2% | -24% | 6% | -62% | -46% | |
| Brightness middle (cd/m²) | 329 | 304 -8% | 308.6 -6% | 420 28% | 326 -1% | 328.7 0% |
| Brightness (cd/m²) | 286 | 289 1% | 299 5% | 393 37% | 309 8% | 318 11% |
| Brightness Distribution (%) | 79 | 90 14% | 92 16% | 91 15% | 82 4% | 91 15% |
| Black Level * (cd/m²) | 0.3 | 0.26 13% | 0.29 3% | 0.32 -7% | 0.27 10% | 0.51 -70% |
| Contrast (:1) | 1097 | 1169 7% | 1064 -3% | 1313 20% | 1207 10% | 645 -41% |
| Colorchecker dE 2000 * | 2.52 | 2.65 -5% | 4.26 -69% | 3.04 -21% | 9.11 -262% | 4.91 -95% |
| Colorchecker dE 2000 max. * | 6.9 | 6.11 11% | 7.83 -13% | 7.22 -5% | 14.14 -105% | 10.15 -47% |
| Colorchecker dE 2000 calibrated * | 1.31 | 1.5 -15% | 2.93 -124% | 0.89 32% | 2.62 -100% | 4.27 -226% |
| Greyscale dE 2000 * | 2.98 | 2.75 8% | 5 -68% | 3.91 -31% | 11.17 -275% | 3.9 -31% |
| Gamma | 2.38 92% | 2.46 89% | 2.07 106% | 2.26 97% | 2.28 96% | 2.13 103% |
| CCT | 6738 96% | 6763 96% | 7488 87% | 7138 91% | 12475 52% | 6911 94% |
| Color Space (Percent of AdobeRGB 1998) (%) | 60 | 60 0% | 57.8 -4% | 60 0% | 76 27% | 55.6 -7% |
| Color Space (Percent of sRGB) (%) | 95 | 92 -3% | 89.2 -6% | 95 0% | 100 5% | 84.7 -11% |
| Média Total (Programa/Configurações) | -9% /
-2% | -17% /
-20% | 10% /
7% | -3% /
-34% | -68% /
-51% |
* ... menor é melhor
Exibir tempos de resposta
| ↔ Tempo de resposta preto para branco | ||
|---|---|---|
| 9.6 ms ... ascensão ↗ e queda ↘ combinadas | ↗ 5.2 ms ascensão | 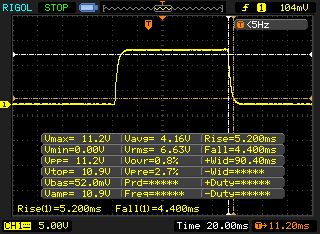 |
| ↘ 4.4 ms queda | ||
| A tela mostra taxas de resposta rápidas em nossos testes e deve ser adequada para jogos. Em comparação, todos os dispositivos testados variam de 0.1 (mínimo) a 240 (máximo) ms. » 26 % de todos os dispositivos são melhores. Isso significa que o tempo de resposta medido é melhor que a média de todos os dispositivos testados (19.8 ms). | ||
| ↔ Tempo de resposta 50% cinza a 80% cinza | ||
| 14.4 ms ... ascensão ↗ e queda ↘ combinadas | ↗ 7.6 ms ascensão | 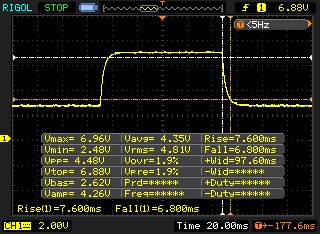 |
| ↘ 6.8 ms queda | ||
| A tela mostra boas taxas de resposta em nossos testes, mas pode ser muito lenta para jogadores competitivos. Em comparação, todos os dispositivos testados variam de 0.165 (mínimo) a 636 (máximo) ms. » 28 % de todos os dispositivos são melhores. Isso significa que o tempo de resposta medido é melhor que a média de todos os dispositivos testados (31 ms). | ||
Cintilação da tela / PWM (modulação por largura de pulso)
| Tela tremeluzindo / PWM não detectado | 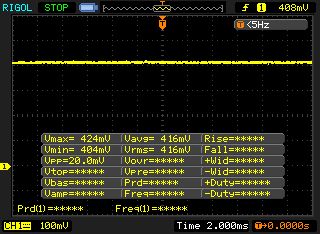 | ||
[pwm_comparison] Em comparação: 52 % de todos os dispositivos testados não usam PWM para escurecer a tela. Se PWM foi detectado, uma média de 7772 (mínimo: 5 - máximo: 343500) Hz foi medida. | |||


| Cinebench R15 | |
| CPU Single 64Bit | |
| Média da turma Gaming (188.8 - 343, n=110, últimos 2 anos) | |
| MSI GP75 Leopard 9SD | |
| Schenker XMG Core 17 | |
| Schenker XMG Core 17 (Overboost-Profil) | |
| Schenker XMG Core 17 (Enthusiast-Profil) | |
| Schenker XMG Neo 17 | |
| Lenovo Legion Y730-17ICH, i7-8750H | |
| Gigabyte Sabre 17-W8 | |
| Dell G7 17 7790 | |
| CPU Multi 64Bit | |
| Média da turma Gaming (1578 - 6271, n=109, últimos 2 anos) | |
| Schenker XMG Core 17 (Enthusiast-Profil) | |
| Schenker XMG Core 17 (Overboost-Profil) | |
| Lenovo Legion Y730-17ICH, i7-8750H | |
| Gigabyte Sabre 17-W8 | |
| MSI GP75 Leopard 9SD | |
| Dell G7 17 7790 | |
| Schenker XMG Core 17 | |
| Schenker XMG Neo 17 | |
| Cinebench R10 | |
| Rendering Single 32Bit | |
| Média da turma Gaming (7457 - 11779, n=8, últimos 2 anos) | |
| Schenker XMG Core 17 | |
| Rendering Multiple CPUs 32Bit | |
| Média da turma Gaming (42932 - 81339, n=8, últimos 2 anos) | |
| Schenker XMG Core 17 | |
| Cinebench R20 | |
| CPU (Single Core) | |
| Média da turma Gaming (442 - 895, n=110, últimos 2 anos) | |
| Schenker XMG Core 17 | |
| CPU (Multi Core) | |
| Média da turma Gaming (4029 - 16108, n=110, últimos 2 anos) | |
| Schenker XMG Core 17 | |
| Geekbench 3 | |
| 32 Bit Multi-Core Score | |
| Schenker XMG Core 17 | |
| 32 Bit Single-Core Score | |
| Schenker XMG Core 17 | |
| Geekbench 4.4 | |
| 64 Bit Multi-Core Score | |
| Média da turma Gaming (89200 - 97490, n=2, últimos 2 anos) | |
| Schenker XMG Core 17 | |
| 64 Bit Single-Core Score | |
| Média da turma Gaming (9335 - 9492, n=2, últimos 2 anos) | |
| Schenker XMG Core 17 | |
| Mozilla Kraken 1.1 - Total | |
| Gigabyte Sabre 17-W8 | |
| MSI GP75 Leopard 9SD | |
| Schenker XMG Core 17 (Edge 44) | |
| Média da turma Gaming (391 - 590, n=106, últimos 2 anos) | |
| Octane V2 - Total Score | |
| Média da turma Gaming (89353 - 139447, n=28, últimos 2 anos) | |
| MSI GP75 Leopard 9SD | |
| Schenker XMG Core 17 (Edge 44) | |
| Gigabyte Sabre 17-W8 | |
| JetStream 1.1 - 1.1 Total | |
| Média da turma Gaming (549 - 647, n=3, últimos 2 anos) | |
| Schenker XMG Core 17 (Edge 44) | |
| MSI GP75 Leopard 9SD | |
| Gigabyte Sabre 17-W8 | |
* ... menor é melhor
| PCMark 7 Score | 6946 pontos | |
| PCMark 8 Home Score Accelerated v2 | 4401 pontos | |
| PCMark 8 Creative Score Accelerated v2 | 4153 pontos | |
| PCMark 8 Work Score Accelerated v2 | 5697 pontos | |
| PCMark 10 Score | 5657 pontos | |
Ajuda | ||
| PCMark 10 - Score | |
| Média da turma Gaming (5828 - 11574, n=96, últimos 2 anos) | |
| Schenker XMG Core 17 (Overboost-Profil) | |
| Schenker XMG Core 17 (Enthusiast-Profil) | |
| Schenker XMG Core 17 | |
| MSI GP75 Leopard 9SD | |
| Schenker XMG Neo 17 | |
| Dell G7 17 7790 | |
| Gigabyte Sabre 17-W8 | |
| Lenovo Legion Y730-17ICH, i7-8750H | |

| Schenker XMG Core 17 Samsung SSD 970 EVO Plus 500GB | Schenker XMG Neo 17 Samsung SSD 970 EVO Plus 1TB | Dell G7 17 7790 Toshiba BG3 KBG30ZMS256G | MSI GP75 Leopard 9SD Kingston RBUSNS8154P3256GJ1 | Gigabyte Sabre 17-W8 Toshiba NVMe THNSN5256GPU7 | Lenovo Legion Y730-17ICH, i7-8750H Toshiba KBG30ZMT128G | |
|---|---|---|---|---|---|---|
| CrystalDiskMark 5.2 / 6 | -5% | -48% | -40% | -23% | -58% | |
| Write 4K (MB/s) | 99.3 | 92.7 -7% | 78.6 -21% | 105.8 7% | 104.7 5% | 71.4 -28% |
| Read 4K (MB/s) | 38.47 | 41.4 8% | 31.89 -17% | 27.89 -28% | 37.39 -3% | 29.98 -22% |
| Write Seq (MB/s) | 1449 | 1363 -6% | 230.4 -84% | 270.8 -81% | 866 -40% | 129.6 -91% |
| Read Seq (MB/s) | 1237 | 1259 2% | 925 -25% | 879 -29% | 944 -24% | 843 -32% |
| Write 4K Q32T1 (MB/s) | 364.4 | 289.7 -20% | 159.1 -56% | 273.3 -25% | 293.3 -20% | 88.9 -76% |
| Read 4K Q32T1 (MB/s) | 421.9 | 337.5 -20% | 315.6 -25% | 361.2 -14% | 374.3 -11% | 196.4 -53% |
| Write Seq Q32T1 (MB/s) | 3276 | 3332 2% | 230.7 -93% | 253 -92% | 1064 -68% | 130.5 -96% |
| Read Seq Q32T1 (MB/s) | 3338 | 3477 4% | 1323 -60% | 1505 -55% | 2616 -22% | 1037 -69% |


| 3DMark 06 Standard Score | 38141 pontos | |
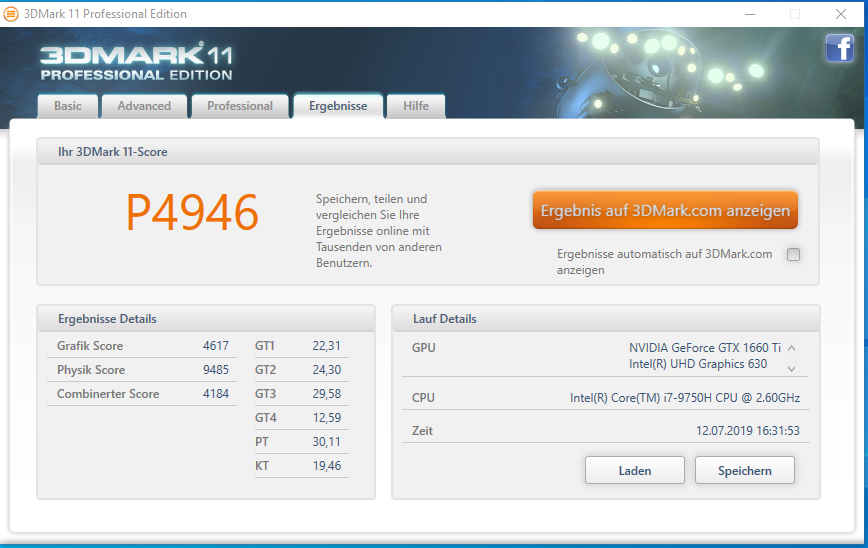
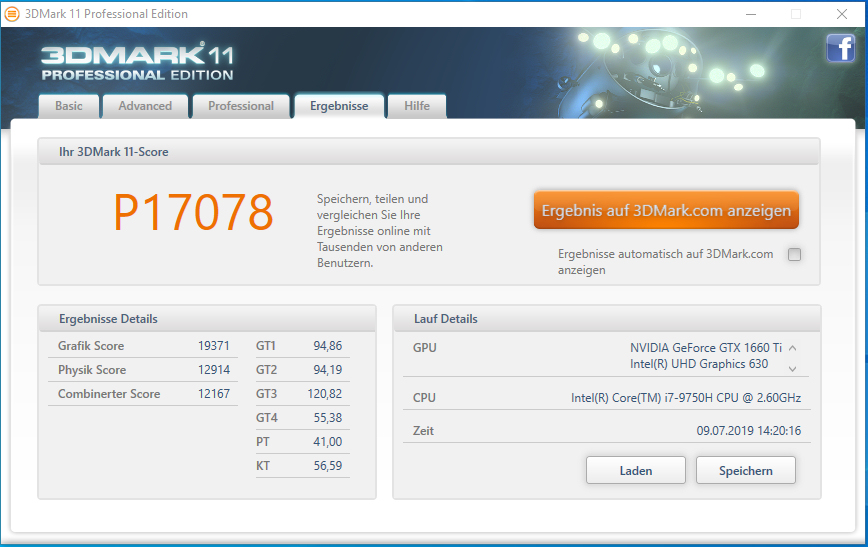
| 3DMark 11 Performance | 16657 pontos | |
| 3DMark Ice Storm Standard Score | 109442 pontos | |
| 3DMark Cloud Gate Standard Score | 34040 pontos | |
| 3DMark Fire Strike Score | 12816 pontos | |
| 3DMark Time Spy Score | 5578 pontos | |
Ajuda | ||
| 3DMark 11 - 1280x720 Performance GPU | |
| Média da turma Gaming (21841 - 80022, n=107, últimos 2 anos) | |
| Schenker XMG Neo 17 | |
| Dell G7 17 7790 | |
| Schenker XMG Core 17 (Overboost-Profil) | |
| MSI GP75 Leopard 9SD | |
| Schenker XMG Core 17 (Enthusiast-Profil) | |
| Schenker XMG Core 17 | |
| Gigabyte Sabre 17-W8 | |
| 3DMark | |
| 1280x720 Cloud Gate Standard Graphics | |
| Média da turma Gaming (86886 - 223650, n=63, últimos 2 anos) | |
| Schenker XMG Neo 17 | |
| MSI GP75 Leopard 9SD | |
| Schenker XMG Core 17 | |
| Dell G7 17 7790 | |
| Gigabyte Sabre 17-W8 | |
| Lenovo Legion Y730-17ICH, i7-8750H | |
| 1920x1080 Fire Strike Graphics | |
| Média da turma Gaming (12242 - 62849, n=119, últimos 2 anos) | |
| Schenker XMG Neo 17 | |
| Dell G7 17 7790 | |
| Schenker XMG Core 17 (Overboost-Profil) | |
| MSI GP75 Leopard 9SD | |
| Schenker XMG Core 17 | |
| Schenker XMG Core 17 (Enthusiast-Profil) | |
| Gigabyte Sabre 17-W8 | |
| Lenovo Legion Y730-17ICH, i7-8750H | |
| 2560x1440 Time Spy Graphics | |
| Média da turma Gaming (5012 - 26212, n=118, últimos 2 anos) | |
| Dell G7 17 7790 | |
| Schenker XMG Core 17 (Overboost-Profil) | |
| MSI GP75 Leopard 9SD | |
| Schenker XMG Core 17 | |
| Schenker XMG Core 17 (Enthusiast-Profil) | |
| The Witcher 3 - 1920x1080 Ultra Graphics & Postprocessing (HBAO+) | |
| Média da turma Gaming (95 - 240, n=8, últimos 2 anos) | |
| Dell G7 17 7790 | |
| MSI GP75 Leopard 9SD | |
| Schenker XMG Core 17 | |
| Lenovo Legion Y730-17ICH, i7-8750H | |
| Gigabyte Sabre 17-W8 | |
| BioShock Infinite - 1920x1080 Ultra Preset, DX11 (DDOF) | |
| MSI GP75 Leopard 9SD | |
| Schenker XMG Core 17 | |
| Dell G7 17 7790 | |
| Lenovo Legion Y730-17ICH, i7-8750H | |
| Rage 2 - 1920x1080 Ultra Preset (Resolution Scale Off) | |
| Schenker XMG Core 17 | |
| Far Cry New Dawn - 1920x1080 Ultra Preset | |
| Schenker XMG Core 17 | |
| Schenker XMG Core 17 (Overboost-Profil) | |
| Anno 1800 - 1920x1080 Ultra Graphics Quality (DX11) | |
| Média da turma Gaming (n=1últimos 2 anos) | |
| Schenker XMG Core 17 | |
| MSI GP75 Leopard 9SD | |
| For Honor - 1920x1080 Extreme Preset AA:T AF:16x | |
| Schenker XMG Core 17 | |
| F1 2019 - 1920x1080 Ultra High Preset AA:T AF:16x | |
| Schenker XMG Core 17 (Overboost-Profil) | |
| Schenker XMG Core 17 | |
| baixo | média | alto | ultra | |
|---|---|---|---|---|
| BioShock Infinite (2013) | 304.3 | 271.6 | 248.7 | 136.2 |
| The Witcher 3 (2015) | 258.9 | 163.9 | 102.6 | 53.3 |
| For Honor (2017) | 237.2 | 128.6 | 121.5 | 93.1 |
| Final Fantasy XV Benchmark (2018) | 120.9 | 79.9 | 57.2 | |
| Far Cry 5 (2018) | 119 | 93 | 88 | 83 |
| Far Cry New Dawn (2019) | 109 | 90 | 86 | 78 |
| Anno 1800 (2019) | 94.6 | 89.6 | 69.2 | 39.6 |
| Rage 2 (2019) | 175.1 | 83.3 | 69.9 | 68.8 |
| F1 2019 (2019) | 181 | 144 | 122 | 92 |
Barulho
| Ocioso |
| 30 / 32 / 35 dB |
| Carga |
| 47 / 51 dB |
 | ||
30 dB silencioso 40 dB(A) audível 50 dB(A) ruidosamente alto |
||
min: | ||
| Schenker XMG Core 17 i7-9750H, GeForce GTX 1660 Ti Mobile | Schenker XMG Neo 17 i7-8750H, GeForce RTX 2070 Mobile | Dell G7 17 7790 i7-8750H, GeForce RTX 2070 Max-Q | MSI GP75 Leopard 9SD i7-9750H, GeForce GTX 1660 Ti Mobile | Gigabyte Sabre 17-W8 i7-8750H, GeForce GTX 1060 Mobile | Lenovo Legion Y730-17ICH, i7-8750H i7-8750H, GeForce GTX 1050 Ti Mobile | Média da turma Gaming | |
|---|---|---|---|---|---|---|---|
| Noise | 4% | 10% | -5% | 2% | 12% | 11% | |
| desligado / ambiente * (dB) | 30 | 29 3% | 28.2 6% | 29 3% | 30.5 -2% | 28 7% | 24.1 ? 20% |
| Idle Minimum * (dB) | 30 | 29 3% | 28.6 5% | 29 3% | 32.1 -7% | 28 7% | 25.9 ? 14% |
| Idle Average * (dB) | 32 | 32 -0% | 28.6 11% | 34 -6% | 32.1 -0% | 28 12% | 27.4 ? 14% |
| Idle Maximum * (dB) | 35 | 33 6% | 28.6 18% | 37 -6% | 32.3 8% | 31.3 11% | 29.9 ? 15% |
| Load Average * (dB) | 47 | 42 11% | 31.8 32% | 53 -13% | 42.9 9% | 33.4 29% | 43 ? 9% |
| Witcher 3 ultra * (dB) | 48 | 49 -2% | 50.6 -5% | 51 -6% | 42.8 11% | ||
| Load Maximum * (dB) | 51 | 49 4% | 50.8 -0% | 55 -8% | 48.8 4% | 46.2 9% | 54.1 ? -6% |
* ... menor é melhor
(-) A temperatura máxima no lado superior é 47 °C / 117 F, em comparação com a média de 40.4 °C / 105 F , variando de 21.2 a 68.8 °C para a classe Gaming.
(-) A parte inferior aquece até um máximo de 50 °C / 122 F, em comparação com a média de 43.2 °C / 110 F
(+) Em uso inativo, a temperatura média para o lado superior é 30.7 °C / 87 F, em comparação com a média do dispositivo de 33.9 °C / ### class_avg_f### F.
(-) Jogando The Witcher 3, a temperatura média para o lado superior é 38.7 °C / 102 F, em comparação com a média do dispositivo de 33.9 °C / ## #class_avg_f### F.
(+) Os apoios para as mãos e o touchpad estão atingindo a temperatura máxima da pele (35 °C / 95 F) e, portanto, não estão quentes.
(-) A temperatura média da área do apoio para as mãos de dispositivos semelhantes foi 28.8 °C / 83.8 F (-6.2 °C / -11.2 F).
| Schenker XMG Core 17 i7-9750H, GeForce GTX 1660 Ti Mobile | Schenker XMG Neo 17 i7-8750H, GeForce RTX 2070 Mobile | Dell G7 17 7790 i7-8750H, GeForce RTX 2070 Max-Q | MSI GP75 Leopard 9SD i7-9750H, GeForce GTX 1660 Ti Mobile | Gigabyte Sabre 17-W8 i7-8750H, GeForce GTX 1060 Mobile | Lenovo Legion Y730-17ICH, i7-8750H i7-8750H, GeForce GTX 1050 Ti Mobile | Média da turma Gaming | |
|---|---|---|---|---|---|---|---|
| Heat | 3% | -6% | 8% | 18% | 1% | 3% | |
| Maximum Upper Side * (°C) | 47 | 47 -0% | 46.6 1% | 45 4% | 35 26% | 42 11% | 45.2 ? 4% |
| Maximum Bottom * (°C) | 50 | 56 -12% | 57 -14% | 42 16% | 34.3 31% | 51.2 -2% | 48.1 ? 4% |
| Idle Upper Side * (°C) | 34 | 28 18% | 34.4 -1% | 30 12% | 30.1 11% | 31.8 6% | 31.1 ? 9% |
| Idle Bottom * (°C) | 32 | 30 6% | 34.6 -8% | 32 -0% | 30.5 5% | 35.4 -11% | 34.2 ? -7% |
* ... menor é melhor
Schenker XMG Core 17 análise de áudio
(±) | o volume do alto-falante é médio, mas bom (###valor### dB)
Graves 100 - 315Hz
(±) | graves reduzidos - em média 12.5% menor que a mediana
(±) | a linearidade dos graves é média (12.5% delta para a frequência anterior)
Médios 400 - 2.000 Hz
(±) | médios mais altos - em média 6.1% maior que a mediana
(±) | a linearidade dos médios é média (10.9% delta para frequência anterior)
Altos 2 - 16 kHz
(+) | agudos equilibrados - apenas 1.1% longe da mediana
(+) | os máximos são lineares (5.2% delta da frequência anterior)
Geral 100 - 16.000 Hz
(±) | a linearidade do som geral é média (18.9% diferença em relação à mediana)
Comparado com a mesma classe
» 63% de todos os dispositivos testados nesta classe foram melhores, 8% semelhantes, 29% piores
» O melhor teve um delta de 6%, a média foi 18%, o pior foi 132%
Comparado com todos os dispositivos testados
» 44% de todos os dispositivos testados foram melhores, 8% semelhantes, 48% piores
» O melhor teve um delta de 4%, a média foi 24%, o pior foi 134%
Schenker XMG Core 15 análise de áudio
(±) | o volume do alto-falante é médio, mas bom (###valor### dB)
Graves 100 - 315Hz
(±) | graves reduzidos - em média 8% menor que a mediana
(±) | a linearidade dos graves é média (11.7% delta para a frequência anterior)
Médios 400 - 2.000 Hz
(±) | médios mais altos - em média 10.1% maior que a mediana
(±) | a linearidade dos médios é média (13.2% delta para frequência anterior)
Altos 2 - 16 kHz
(+) | agudos equilibrados - apenas 1.9% longe da mediana
(±) | a linearidade dos máximos é média (7.5% delta para frequência anterior)
Geral 100 - 16.000 Hz
(±) | a linearidade do som geral é média (23.6% diferença em relação à mediana)
Comparado com a mesma classe
» 86% de todos os dispositivos testados nesta classe foram melhores, 4% semelhantes, 10% piores
» O melhor teve um delta de 6%, a média foi 18%, o pior foi 132%
Comparado com todos os dispositivos testados
» 71% de todos os dispositivos testados foram melhores, 6% semelhantes, 23% piores
» O melhor teve um delta de 4%, a média foi 24%, o pior foi 134%
| desligado | |
| Ocioso | |
| Carga |
|
Key:
min: | |
| Schenker XMG Core 17 i7-9750H, GeForce GTX 1660 Ti Mobile | Schenker XMG Neo 17 i7-8750H, GeForce RTX 2070 Mobile | Dell G7 17 7790 i7-8750H, GeForce RTX 2070 Max-Q | MSI GP75 Leopard 9SD i7-9750H, GeForce GTX 1660 Ti Mobile | Gigabyte Sabre 17-W8 i7-8750H, GeForce GTX 1060 Mobile | Lenovo Legion Y730-17ICH, i7-8750H i7-8750H, GeForce GTX 1050 Ti Mobile | Média da turma Gaming | |
|---|---|---|---|---|---|---|---|
| Power Consumption | -17% | -11% | -11% | 2% | 24% | -32% | |
| Idle Minimum * (Watt) | 10 | 13 -30% | 9.5 5% | 10 -0% | 9.3 7% | 6.3 37% | 13.1 ? -31% |
| Idle Average * (Watt) | 13 | 16 -23% | 16.2 -25% | 15 -15% | 14.8 -14% | 11 15% | 18.8 ? -45% |
| Idle Maximum * (Watt) | 21 | 21 -0% | 23.8 -13% | 22 -5% | 22 -5% | 11.5 45% | 24.4 ? -16% |
| Load Average * (Watt) | 89 | 96 -8% | 101.7 -14% | 92 -3% | 63 29% | 89.8 -1% | 108.5 ? -22% |
| Witcher 3 ultra * (Watt) | 128 | 172 -34% | 155 -21% | 153 -20% | 102 20% | ||
| Load Maximum * (Watt) | 177 | 191 -8% | 172.2 3% | 216 -22% | 187 -6% | 130.7 26% | 254 ? -44% |
* ... menor é melhor
| Schenker XMG Core 17 i7-9750H, GeForce GTX 1660 Ti Mobile, 46.74 Wh | Schenker XMG Neo 17 i7-8750H, GeForce RTX 2070 Mobile, 46.74 Wh | Dell G7 17 7790 i7-8750H, GeForce RTX 2070 Max-Q, 60 Wh | MSI GP75 Leopard 9SD i7-9750H, GeForce GTX 1660 Ti Mobile, 51 Wh | Gigabyte Sabre 17-W8 i7-8750H, GeForce GTX 1060 Mobile, 62 Wh | Lenovo Legion Y730-17ICH, i7-8750H i7-8750H, GeForce GTX 1050 Ti Mobile, 76 Wh | Média da turma Gaming | |
|---|---|---|---|---|---|---|---|
| Duração da bateria | -29% | 14% | -42% | 2% | 25% | 32% | |
| Reader / Idle (h) | 8.1 | 5.3 -35% | 8.5 5% | 4.8 -41% | 6.9 -15% | 13.2 63% | 8.71 ? 8% |
| H.264 (h) | 5.3 | 5.3 0% | 8.26 ? 56% | ||||
| WiFi v1.3 (h) | 4.7 | 3.7 -21% | 3.9 -17% | 3.2 -32% | 5.4 15% | 6.7 43% | 6.98 ? 49% |
| Load (h) | 1.3 | 0.9 -31% | 2 54% | 0.6 -54% | 1.4 8% | 0.9 -31% | 1.47 ? 13% |
Pro
Contra
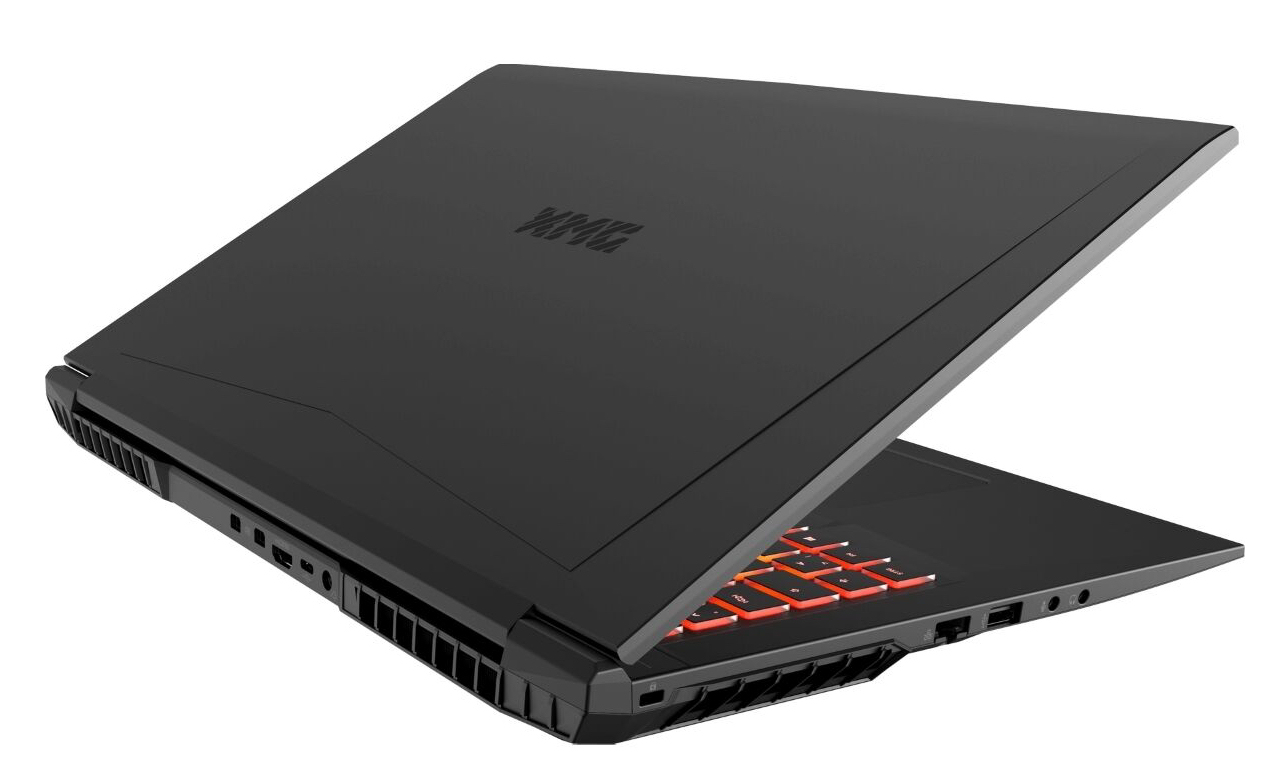
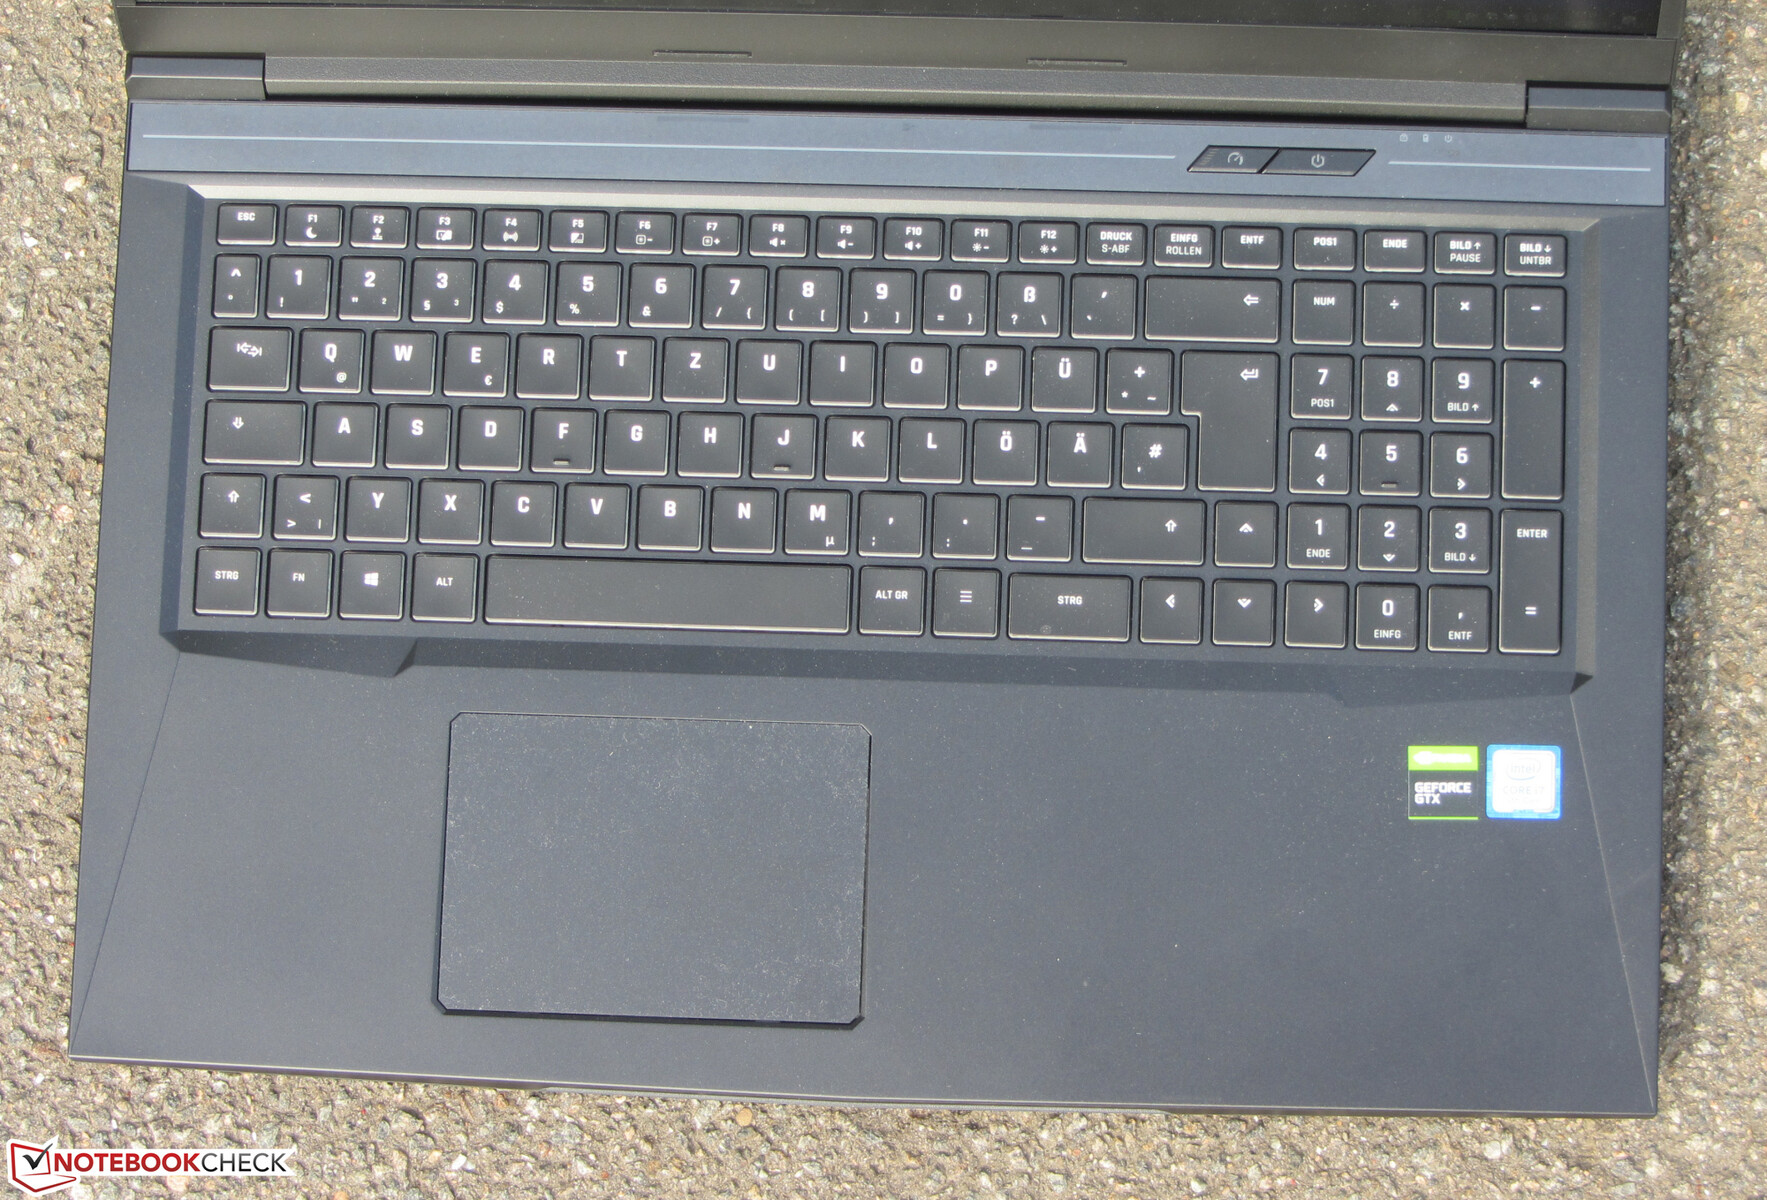
Com o XMG Core 17, a Schenker oferece um portátil para jogos de 17,3 polegadas que é capaz de rodar todos os jogos de computador atuais fluentemente na tela Full HD mate, graças ao processador Core i7-8750H e núcleo gráfico GeForce GTX 1660 Ti. Você sempre pode selecionar configurações de qualidade de gráficos em altas a máximas.
Também é positivo que, ao contrário de muitos outros portáteis para jogos, o Core 17 não se aqueça excessivamente sob uso intenso. Além disso, não produz muito ruído - pelo menos em operação inativa e sob cargas de trabalho leves. Particularmente durante a operação inativa, muitas vezes você não consegue ouvir os ventiladores. No entanto, sob carga, é uma história diferente.
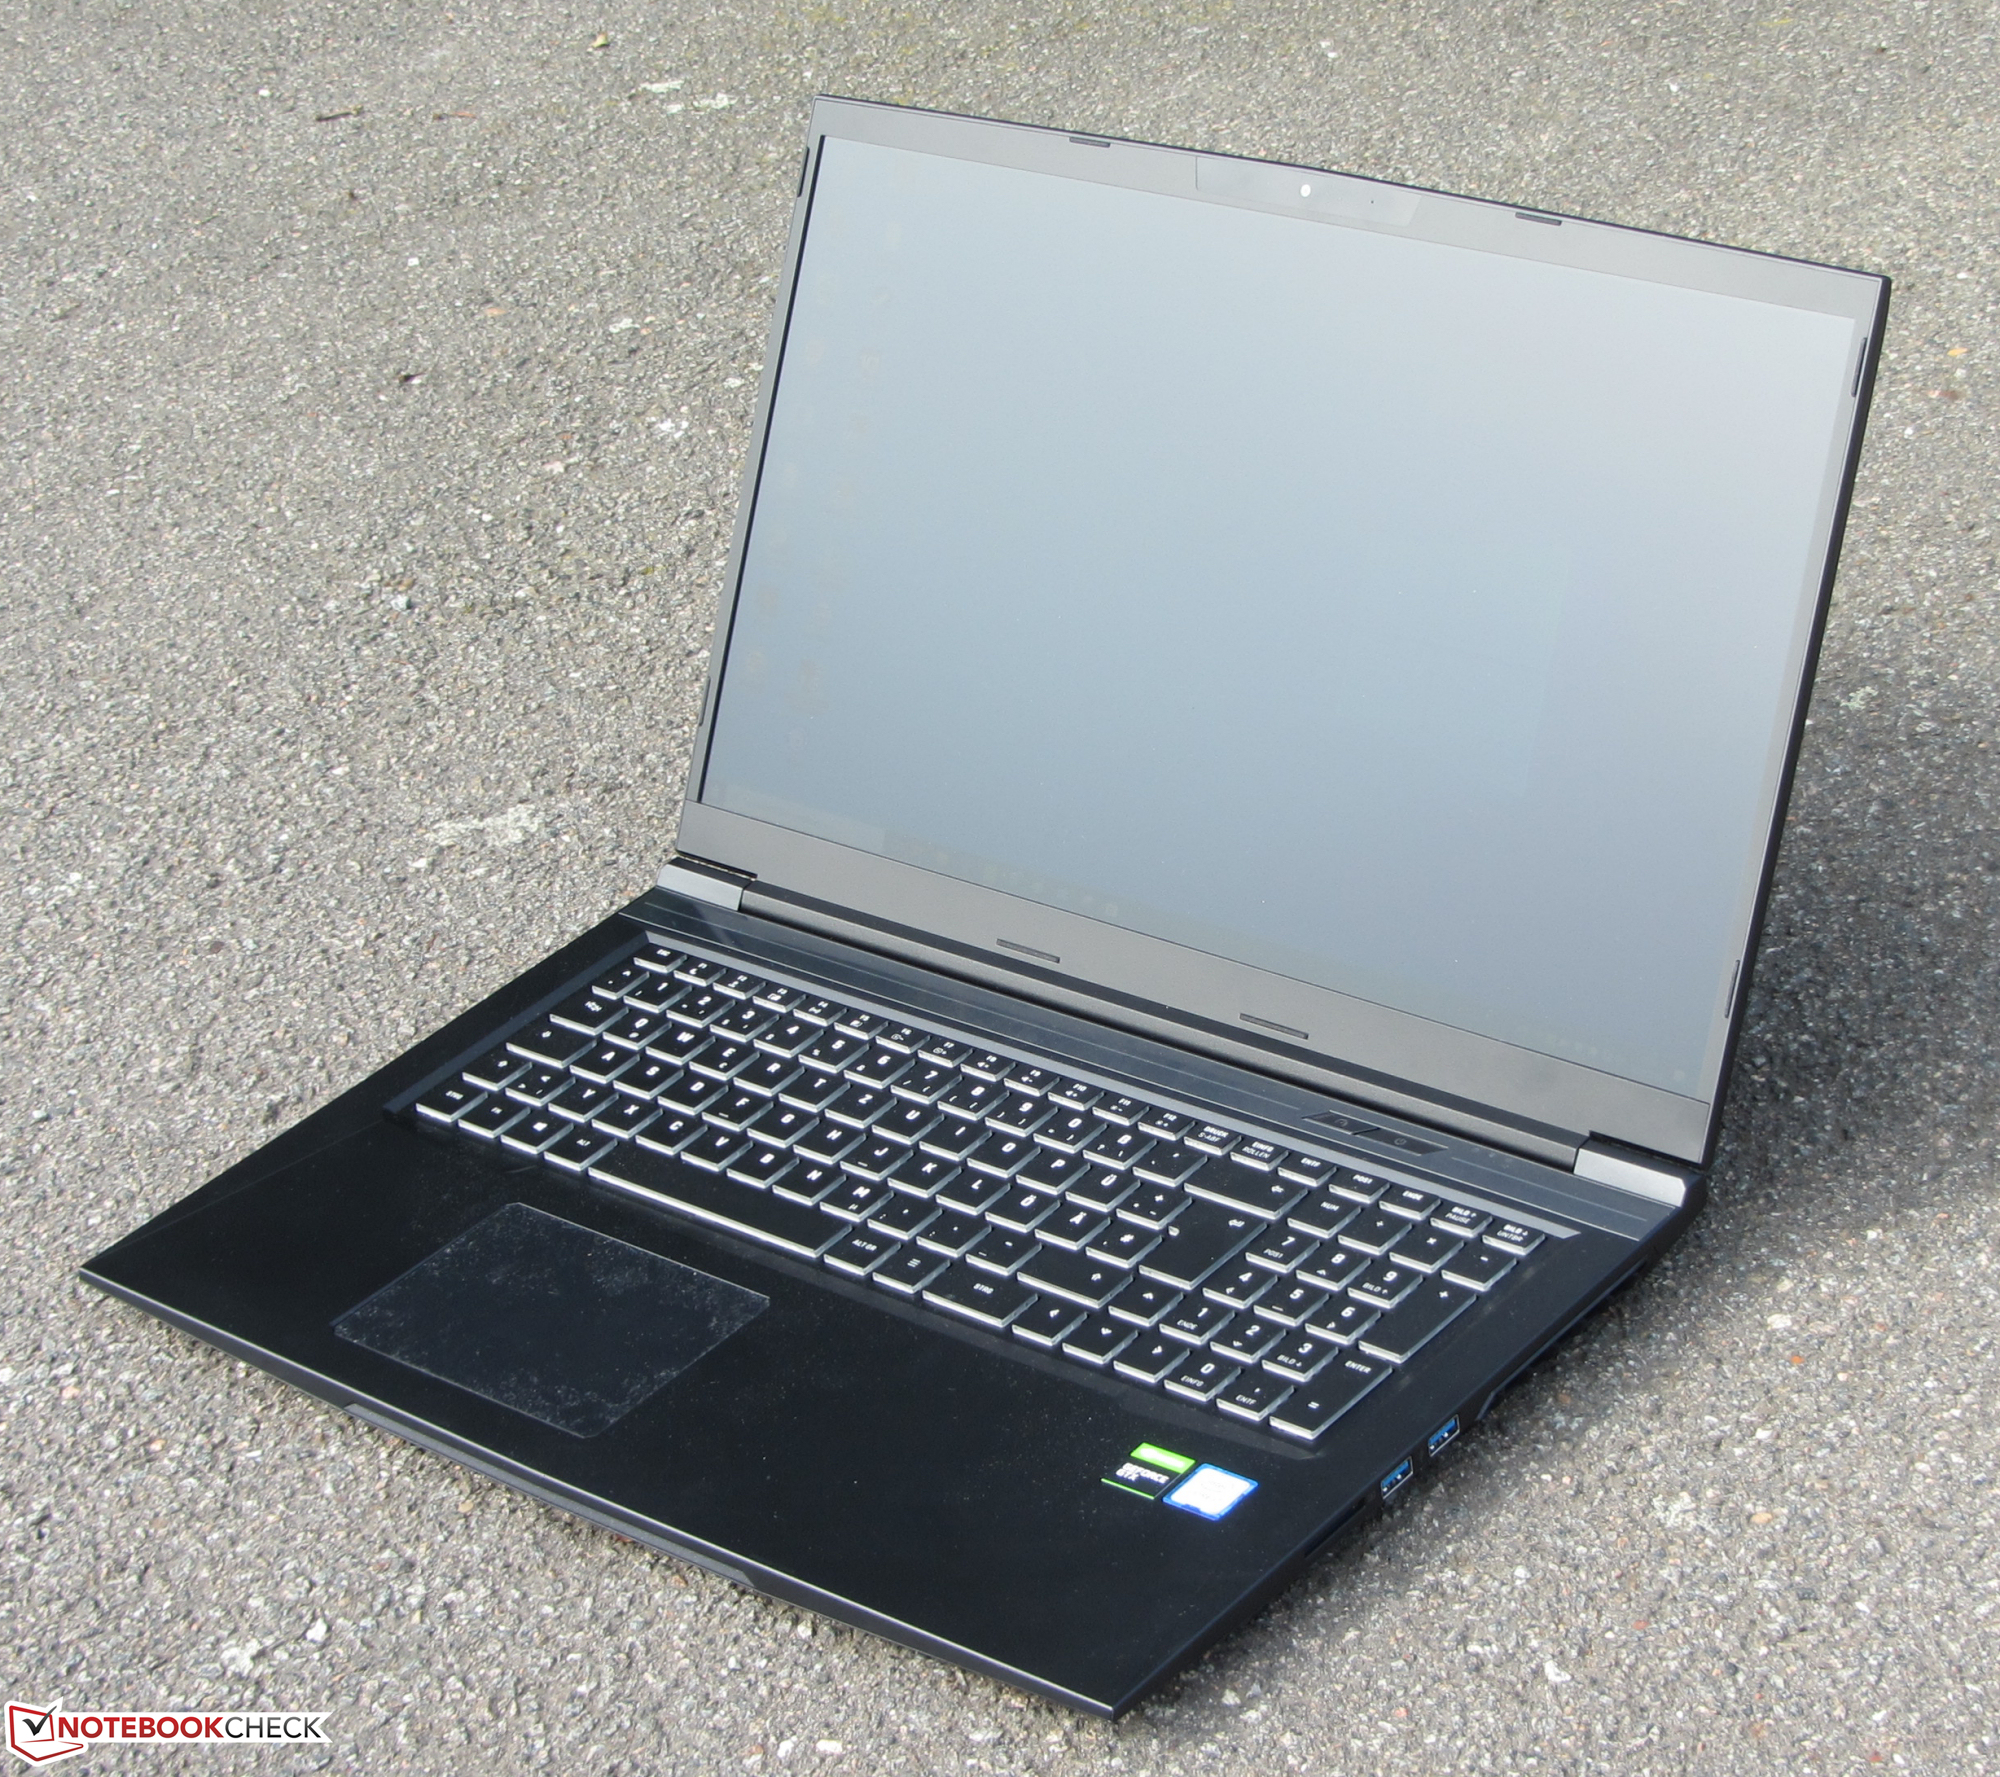
O XMG Core 17 acaba por ser um portátil de jogos completo com um exterior despretensioso.
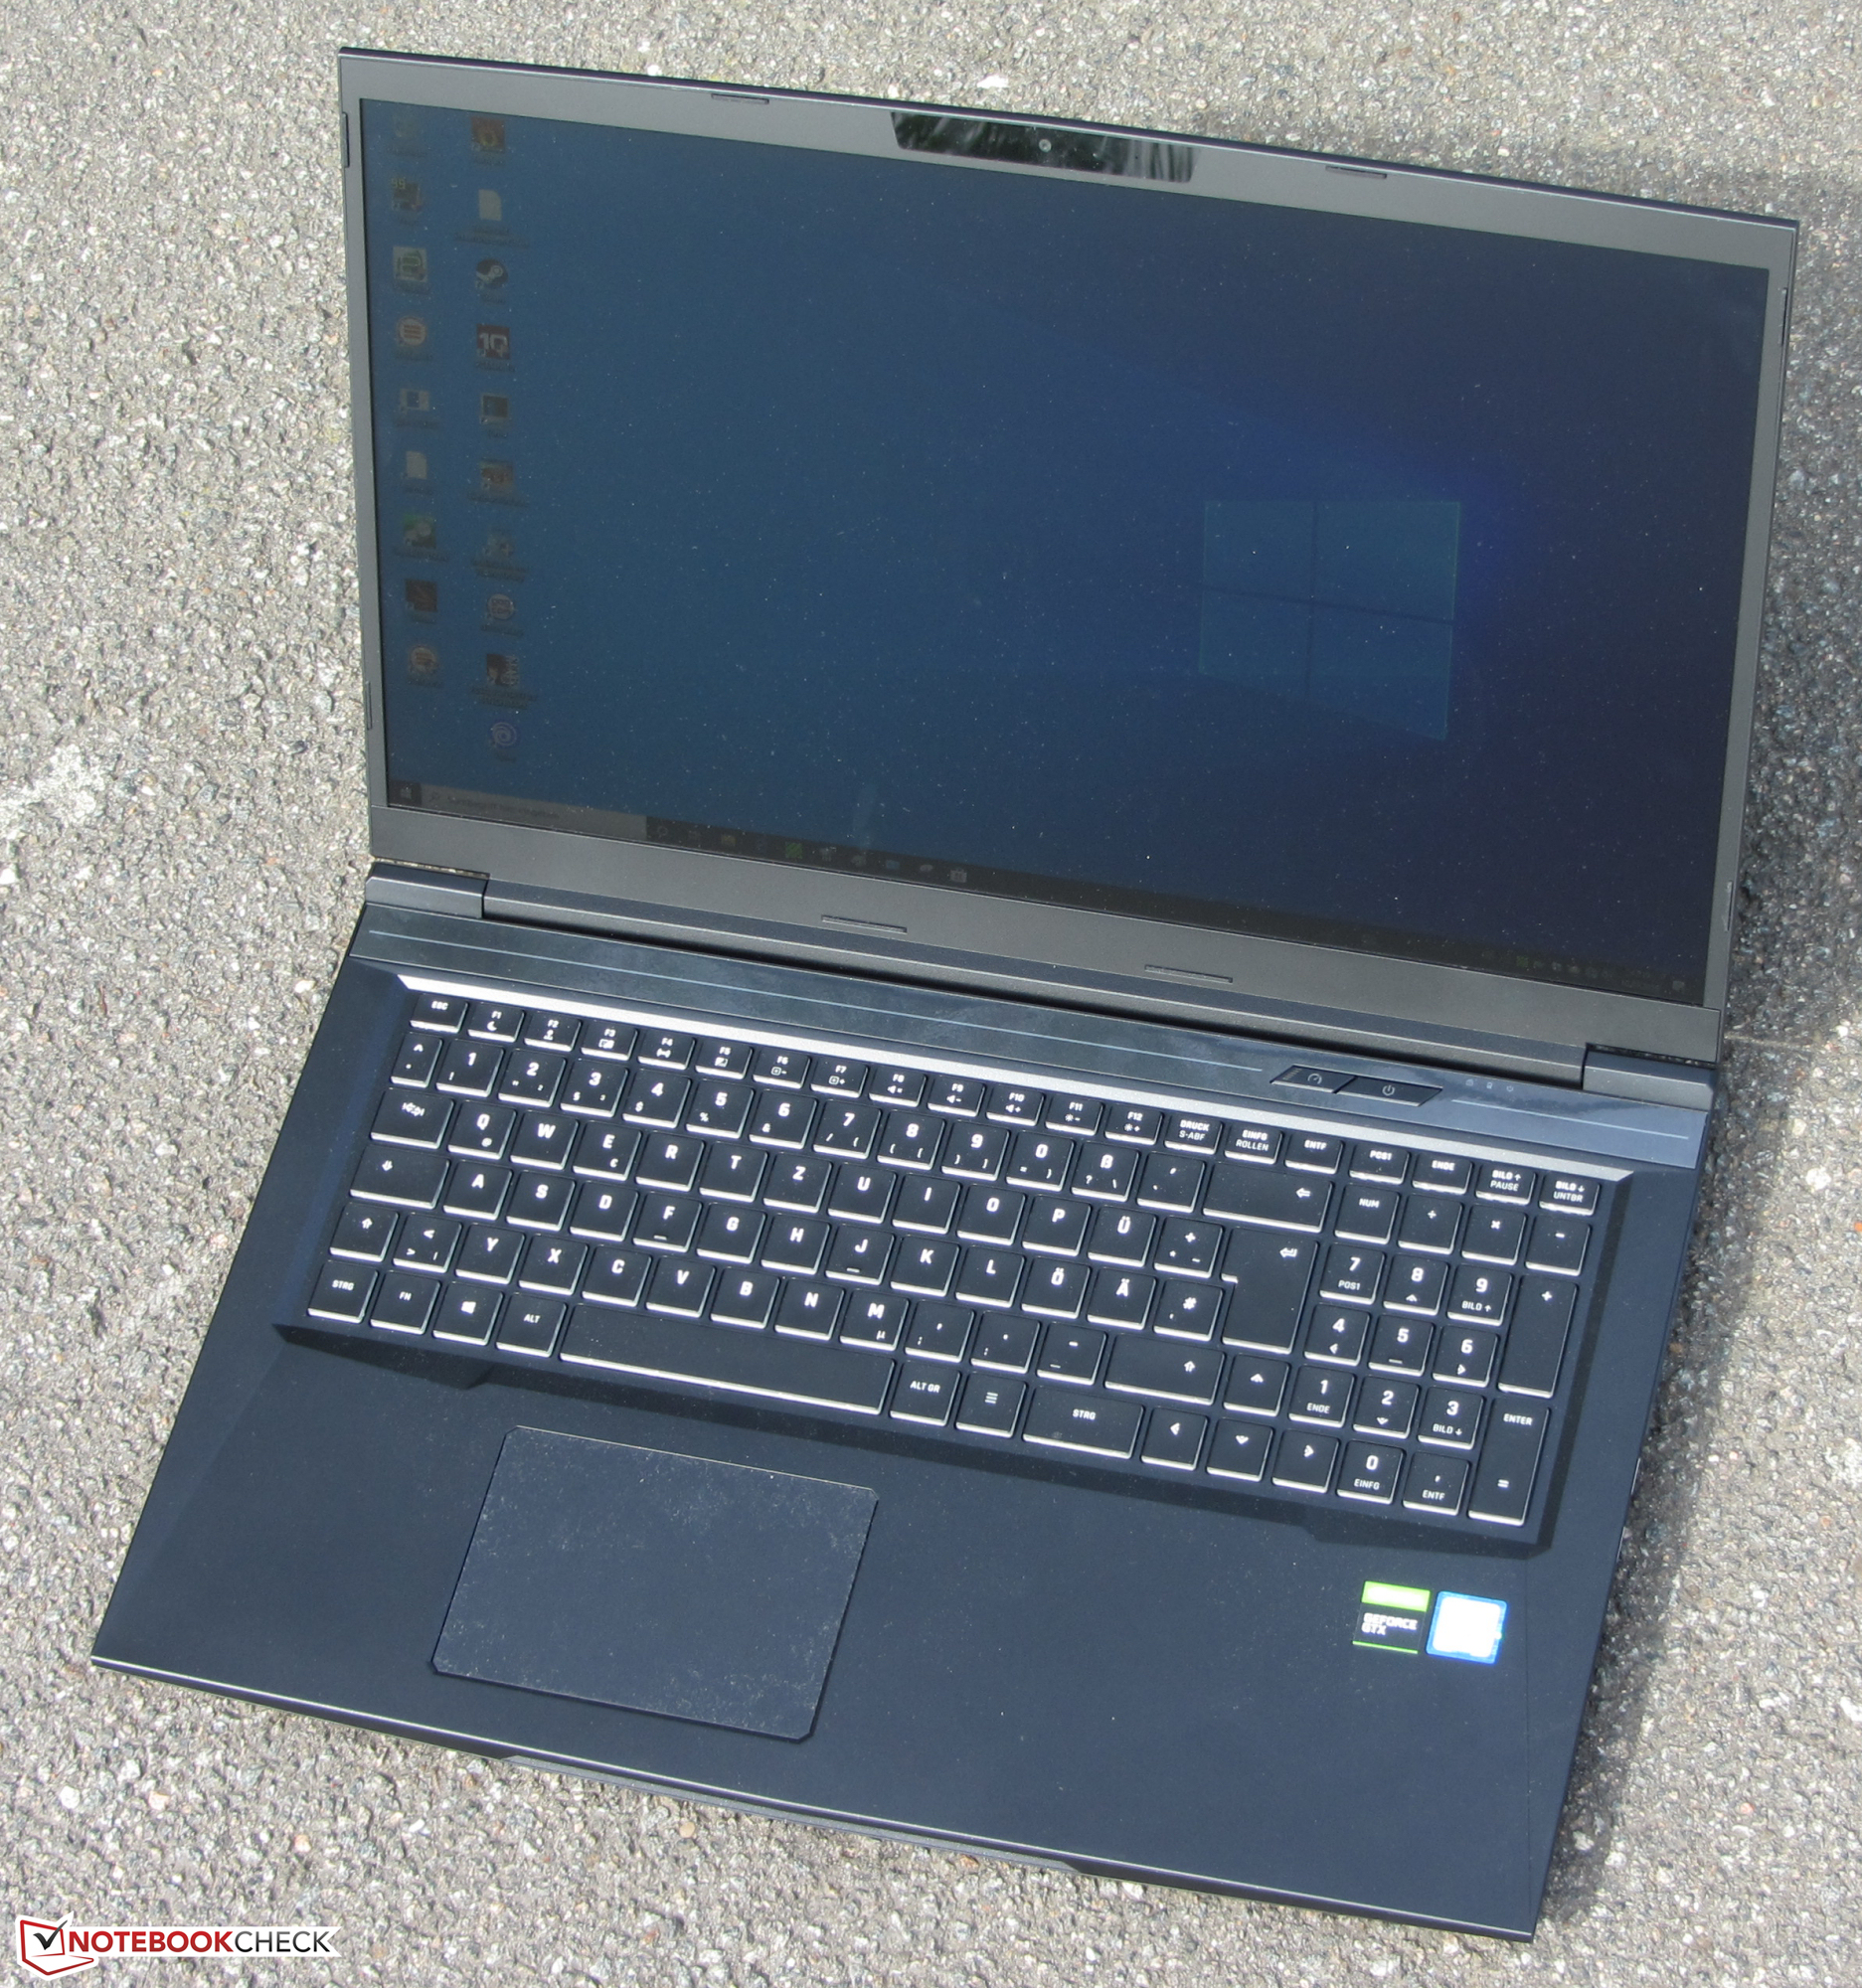
A tela IPS de 144 Hz pontua com tempos de resposta curtos, ângulos de visão estáveis, um bom contraste e uma ótima reprodução de cores. O brilho da tela está bom, mas poderia ter sido melhor para um portátil nessa faixa de preço. Também não devemos esquecer de mencionar os pequenos marcos da tela.
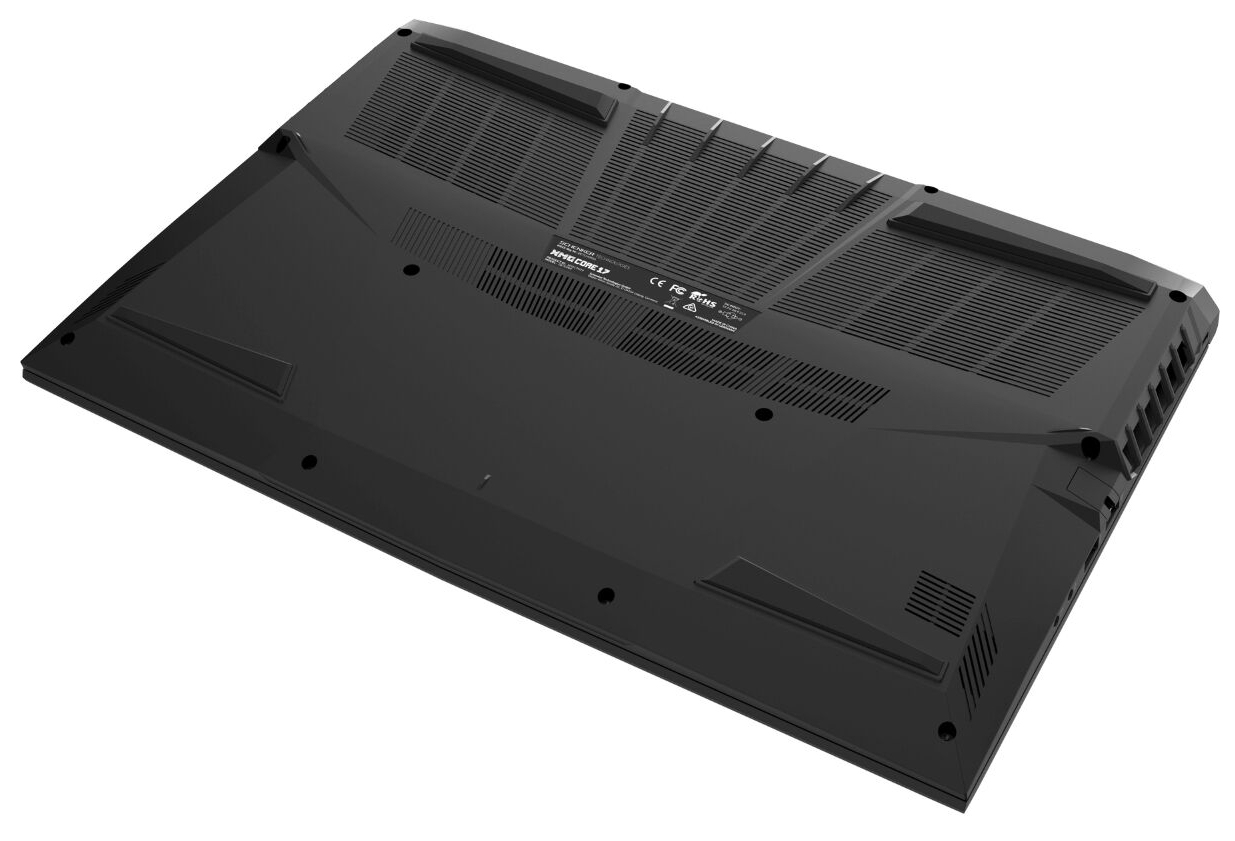
O portátil oferece espaço para dois SSDs NVMe no formato M.2-2280 que também podem ser configurados como uma matriz RAID (0 ou 1). Além disso, você também pode adicionar um disco rígido de 2,5 polegadas. As tarefas de atualização ou manutenção podem ser executadas sem problemas. Depois de remover a parte inferior da carcaça, você obtém acesso a todos os componentes.
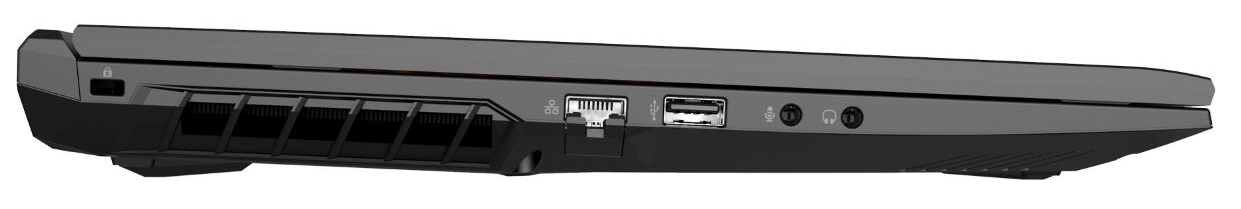
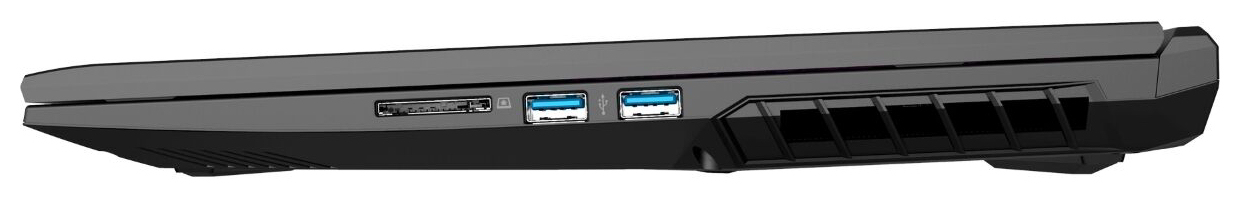
A duração da bateria não vai empolgar ninguém, mas é bastante decente para um portátil de jogos. O teclado chiclet (iluminação RGB) provou ser adequado para tarefas diárias. A quantidade de conexões é bastante grande, mas sentimos falta de uma porta Thunderbolt-3.
Schenker XMG Core 17
- 07/16/2019 v6 (old)
Sascha Mölck
Price comparison
