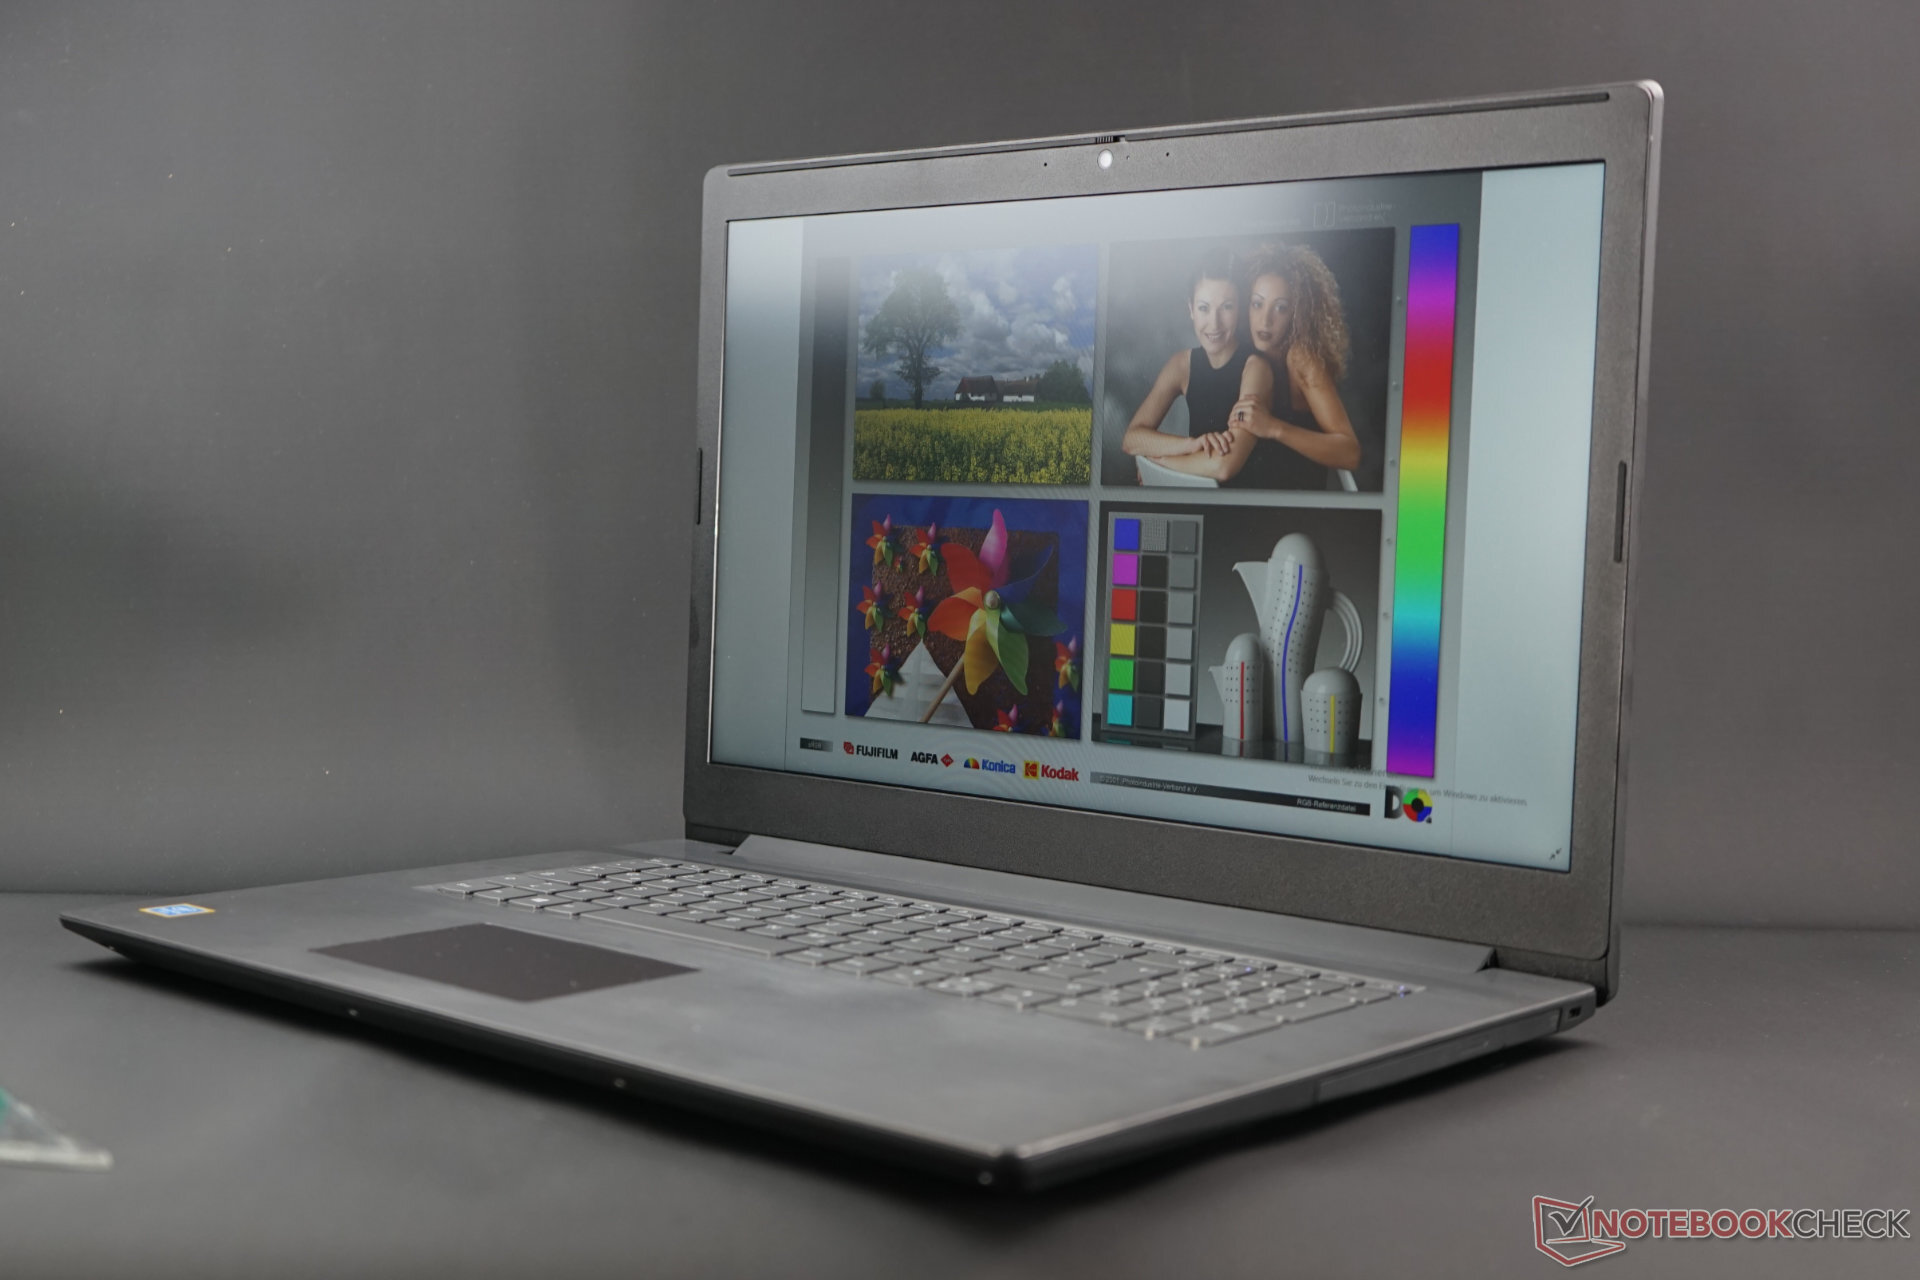
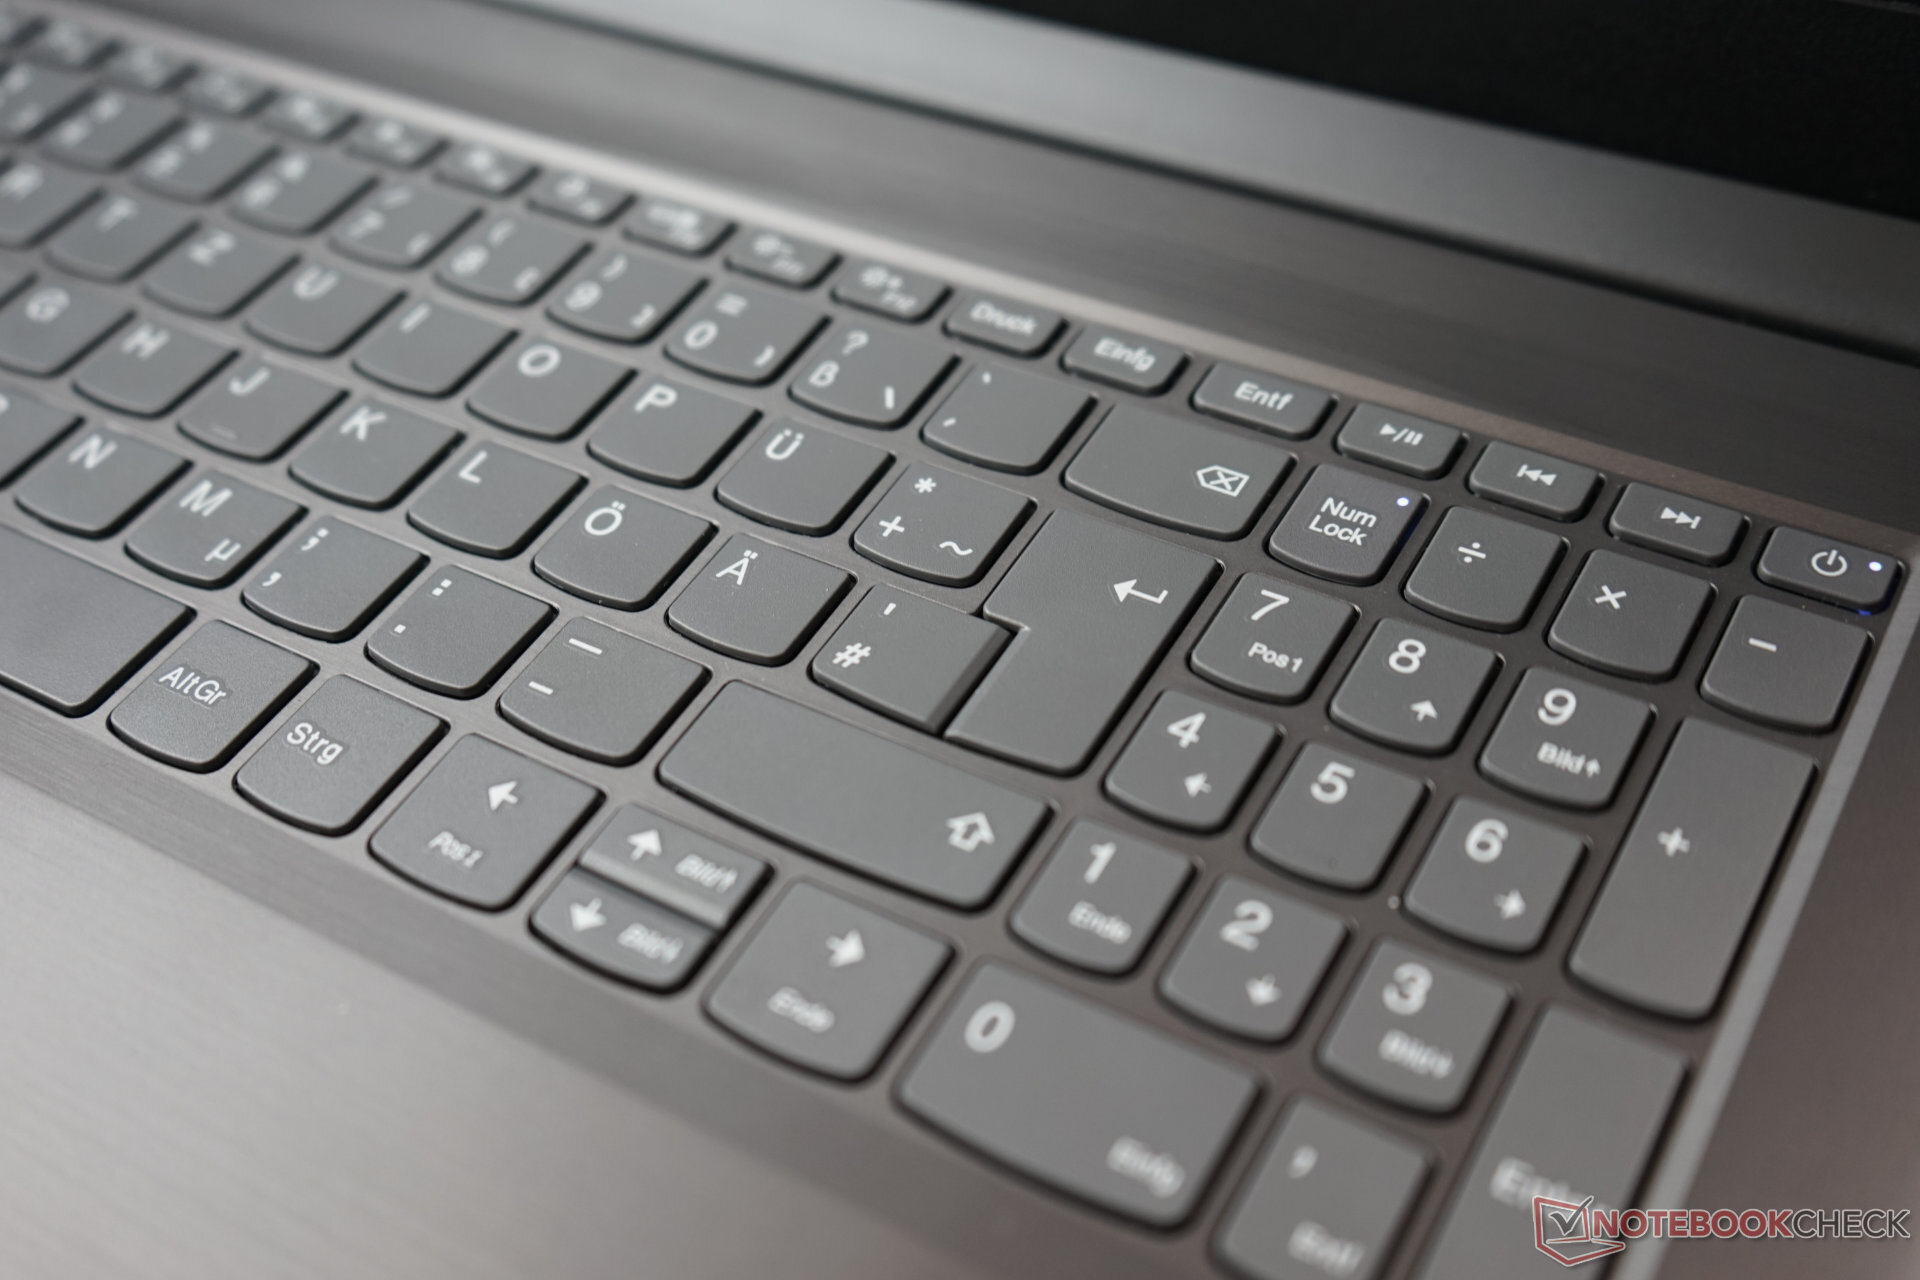
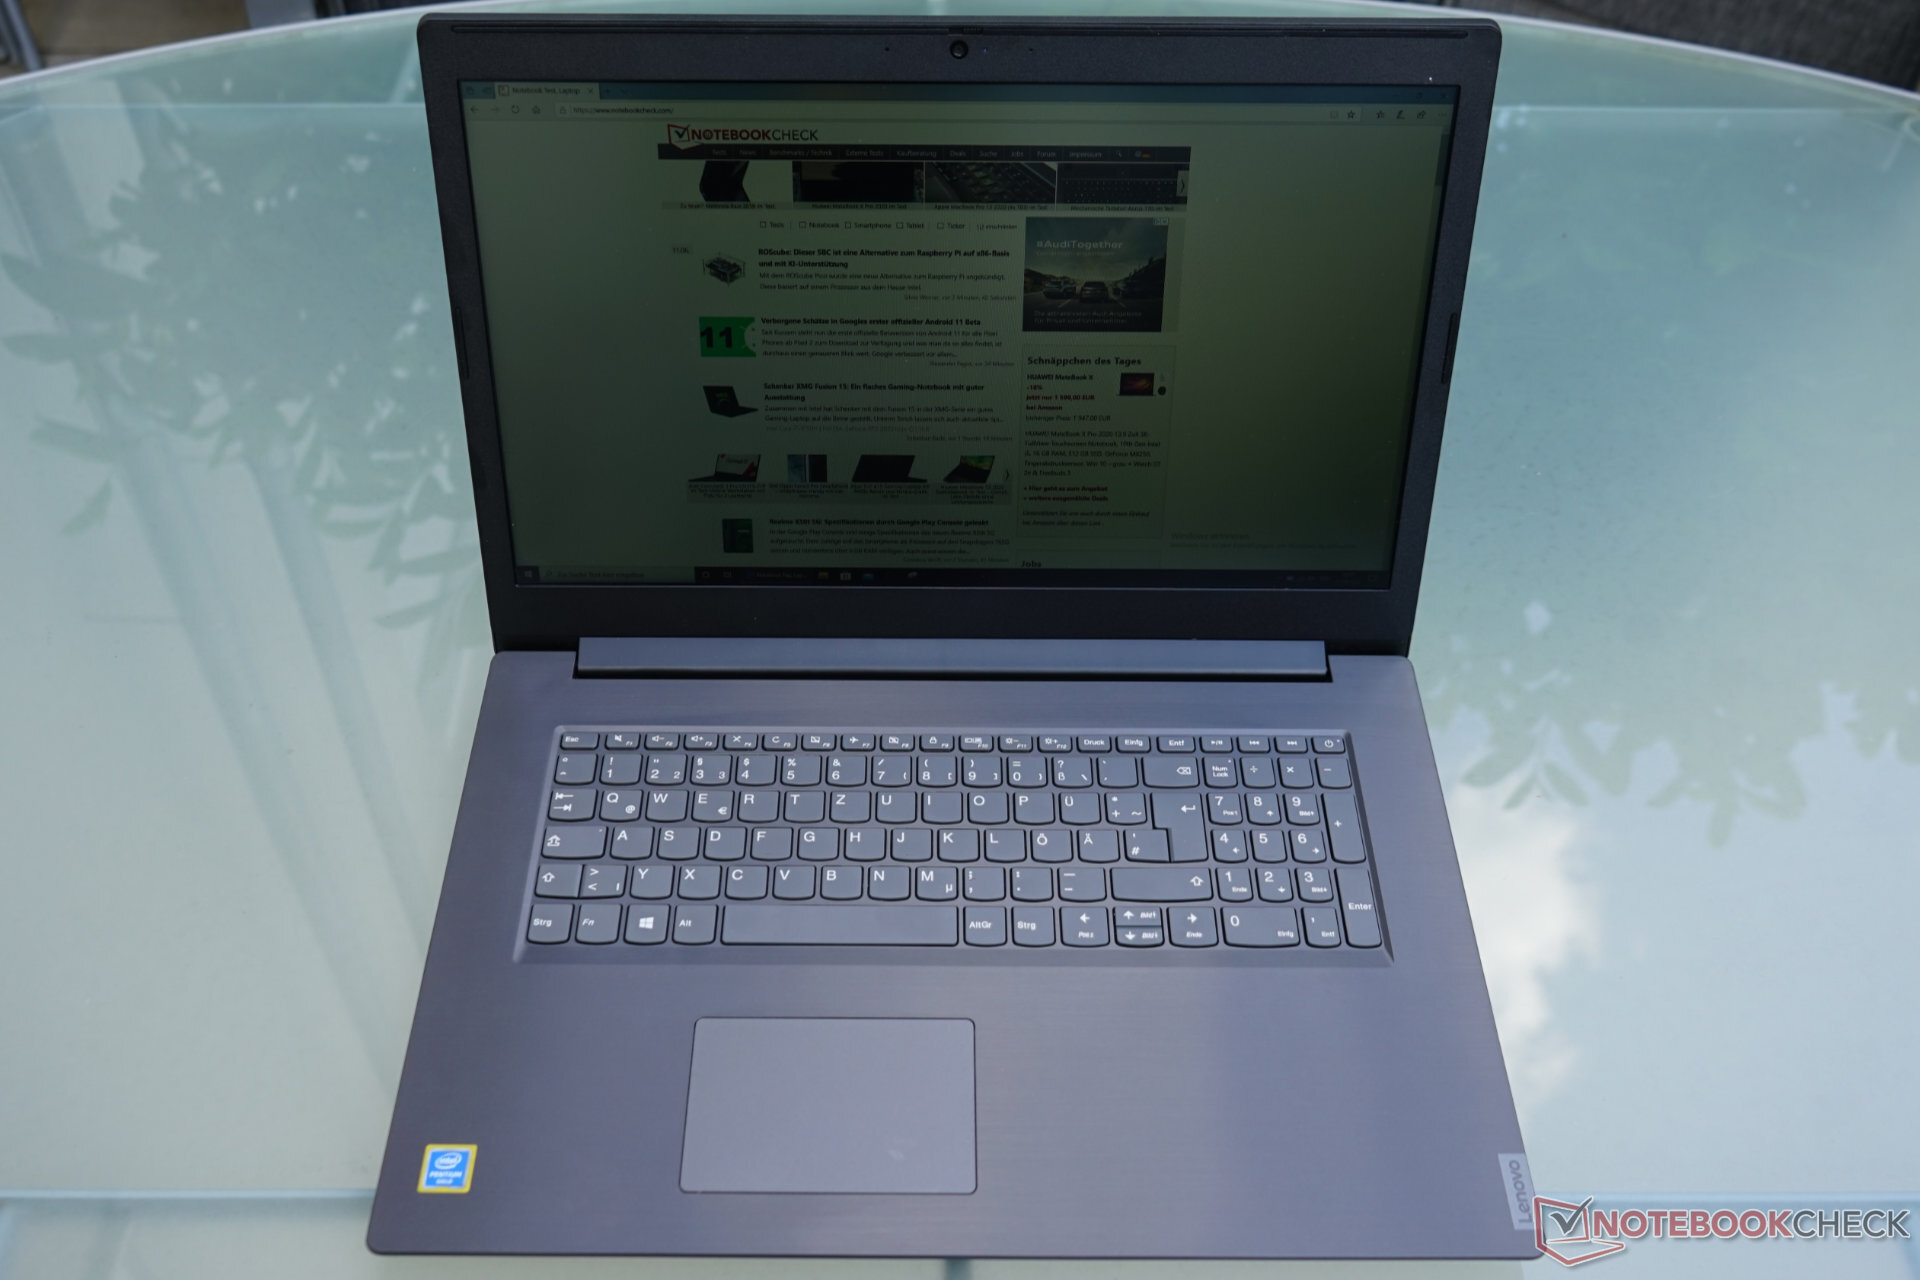
Breve Análise do Lenovo V340-17IWL 81RG001YGE - Sólido dispositivo empresarial de nível de entrada com uma tela IPS de 17 polegadas
Avaliação | Data | Modelo | Peso | Altura | Size | Resolução | Preço |
|---|---|---|---|---|---|---|---|
| 77.1 % v7 (old) | 07/2020 | Lenovo V340-17IWL 81RG001YGE Pentium 5405U, UHD Graphics 610 | 2.8 kg | 27 mm | 17.30" | 1920x1080 | |
| 75.2 % v7 (old) | HP 17-by2437ng i3-10110U, UHD Graphics 620 | 2.4 kg | 24.5 mm | 17.30" | 1600x900 | ||
v (old) | 03/2020 | Acer Aspire 3 A317-51-58S7 i5-10210U, UHD Graphics 620 | 2.7 kg | 24.6 mm | 17.30" | 1920x1080 | |
| 80.8 % v6 (old) | Lenovo Ideapad L340-17API-81LY0004GE R5 3500U, Vega 8 | 2.8 kg | 24.3 mm | 17.30" | 1600x900 | ||
| 78.9 % v6 (old) | 05/2019 | Dell Inspiron 17 3780 i7-8565U, Radeon 520 | 2.8 kg | 25 mm | 17.30" | 1920x1080 | |
| 75.8 % v6 (old) | 03/2019 | Lenovo IdeaPad 330-17IKB 81DM i5-8550U, GeForce MX150 | 2.8 kg | 24.9 mm | 17.30" | 1600x900 | |
| 72 % v7 (old) | 04/2019 | Acer Aspire ES1-732-P7YA Pentium N4200, HD Graphics 505 | 2.8 kg | 27.3 mm | 17.30" | 1600x900 | |
| 79 % v6 (old) | HP 17-ca0013ng R5 2500U, Vega 8 | 2.5 kg | 25 mm | 17.30" | 1920x1080 | ||
| 84.7 % v6 (old) | HP Envy 17-ae143ng i5-8250U, GeForce MX150 | 3 kg | 23.3 mm | 17.30" | 1920x1080 |
| Networking | |
| iperf3 transmit AX12 | |
| HP Envy 17-ae143ng | |
| Dell Inspiron 17 3780 | |
| Lenovo V340-17IWL 81RG001YGE | |
| Lenovo Ideapad L340-17API-81LY0004GE | |
| Média Qualcomm Atheros QCA9377 Wireless Network Adapter (72 - 349, n=56) | |
| Lenovo IdeaPad 330-17IKB 81DM | |
| Acer Aspire ES1-732-P7YA | |
| HP 17-ca0013ng | |
| HP 17-by2437ng | |
| iperf3 receive AX12 | |
| HP Envy 17-ae143ng | |
| Lenovo IdeaPad 330-17IKB 81DM | |
| Lenovo V340-17IWL 81RG001YGE | |
| Lenovo Ideapad L340-17API-81LY0004GE | |
| Média Qualcomm Atheros QCA9377 Wireless Network Adapter (71 - 348, n=56) | |
| Dell Inspiron 17 3780 | |
| Acer Aspire ES1-732-P7YA | |
| HP 17-ca0013ng | |
| HP 17-by2437ng | |


| |||||||||||||||||||||||||
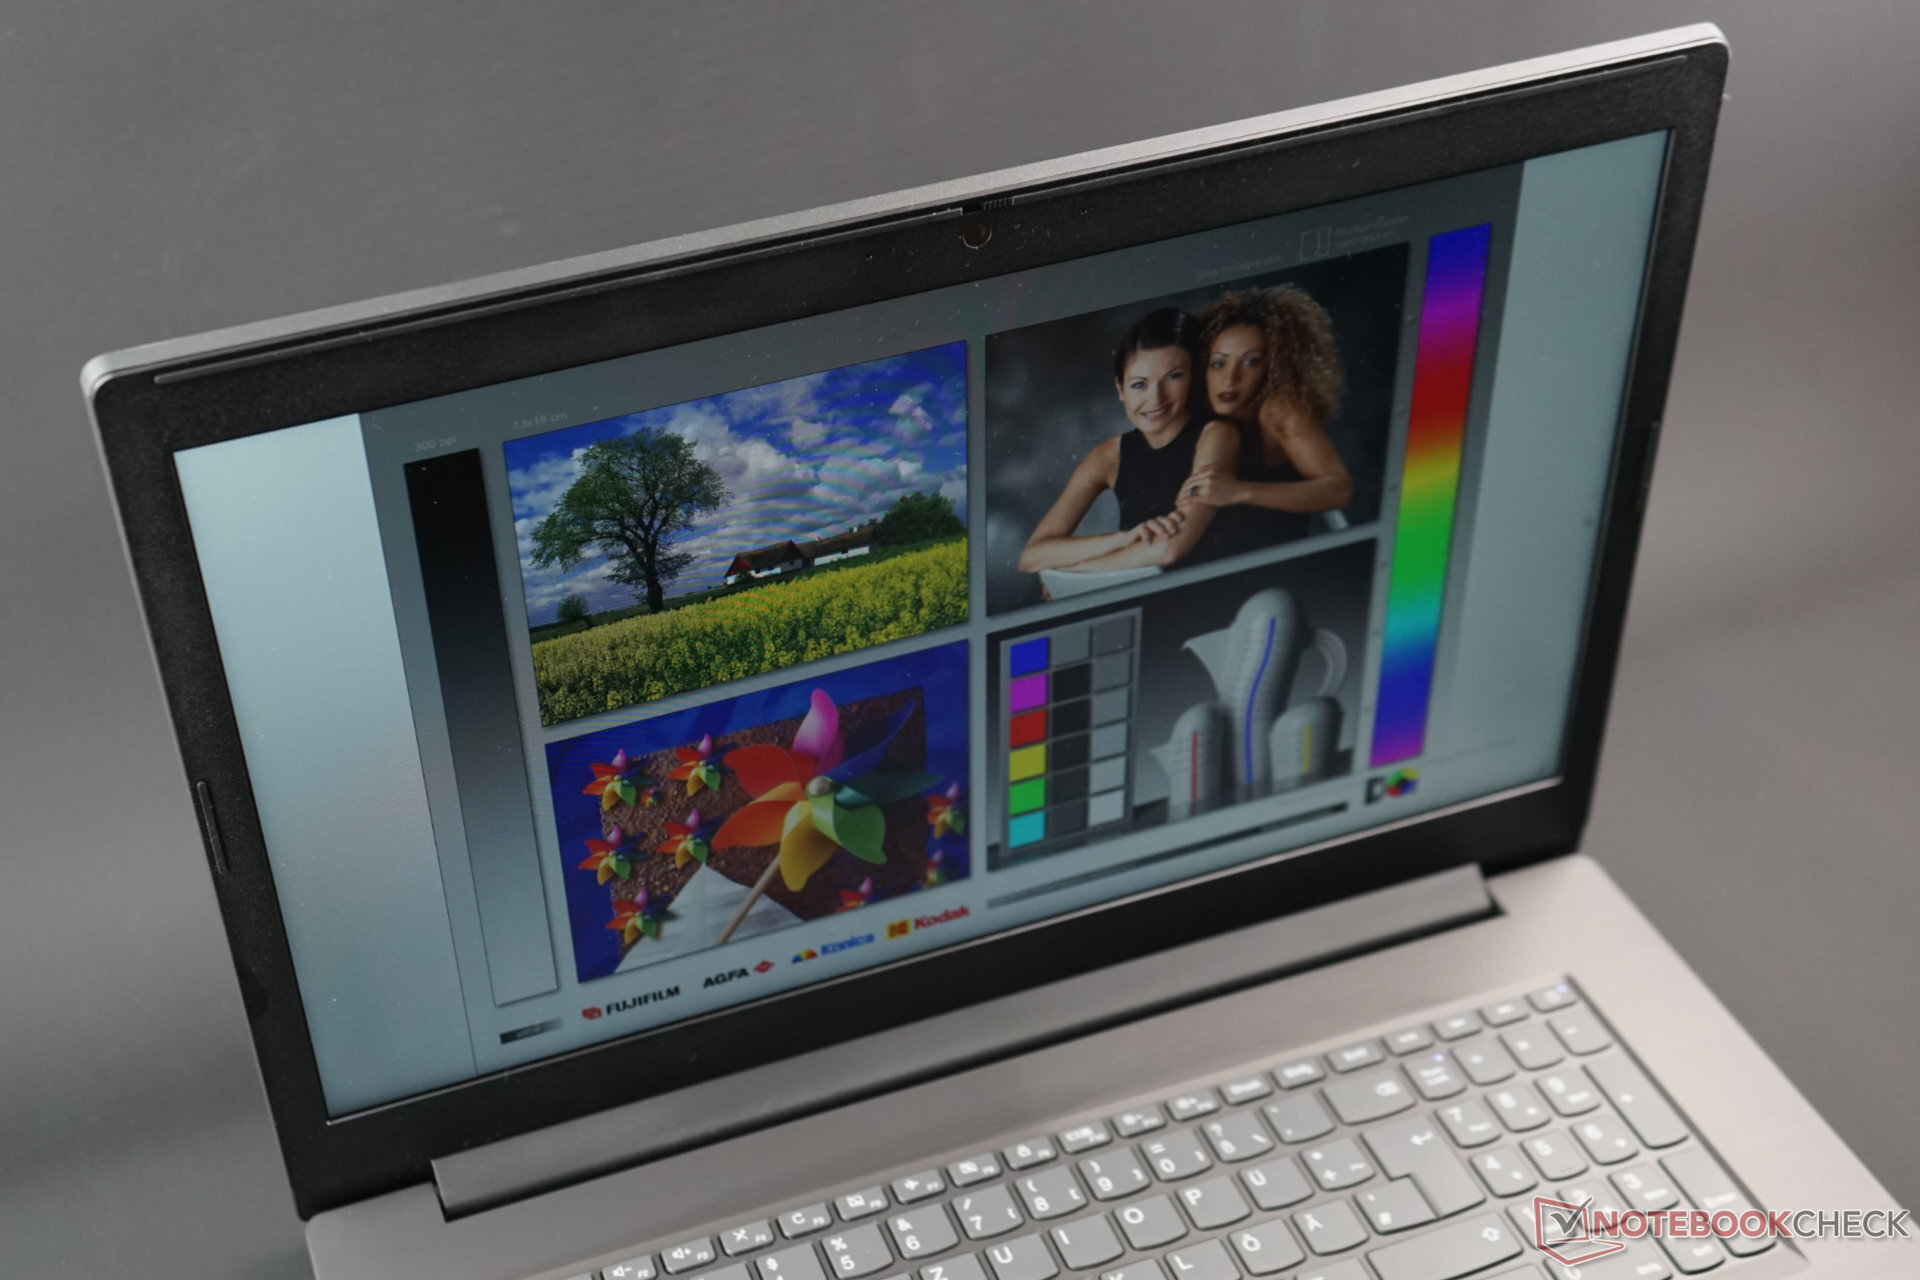
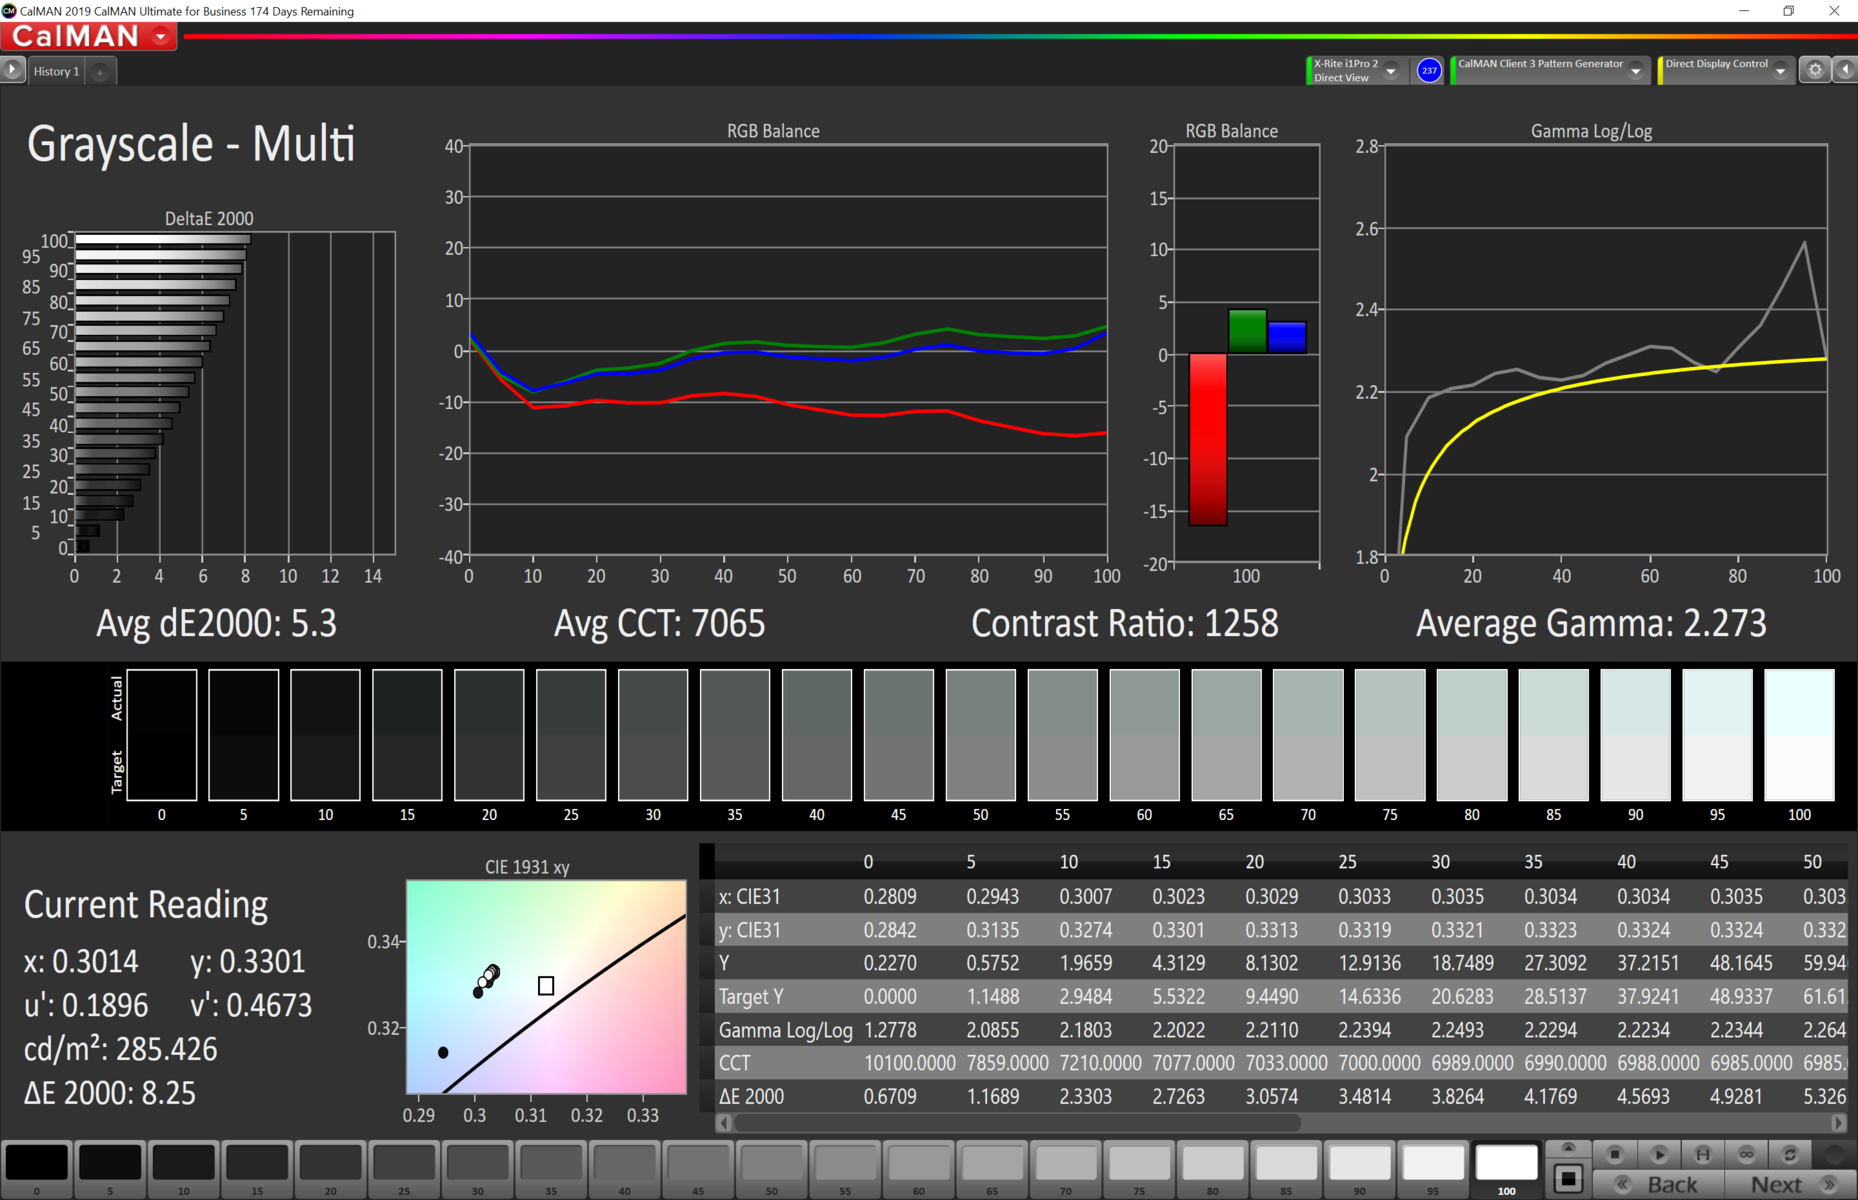
iluminação: 77 %
iluminação com acumulador: 284 cd/m²
Contraste: 1235:1 (Preto: 0.23 cd/m²)
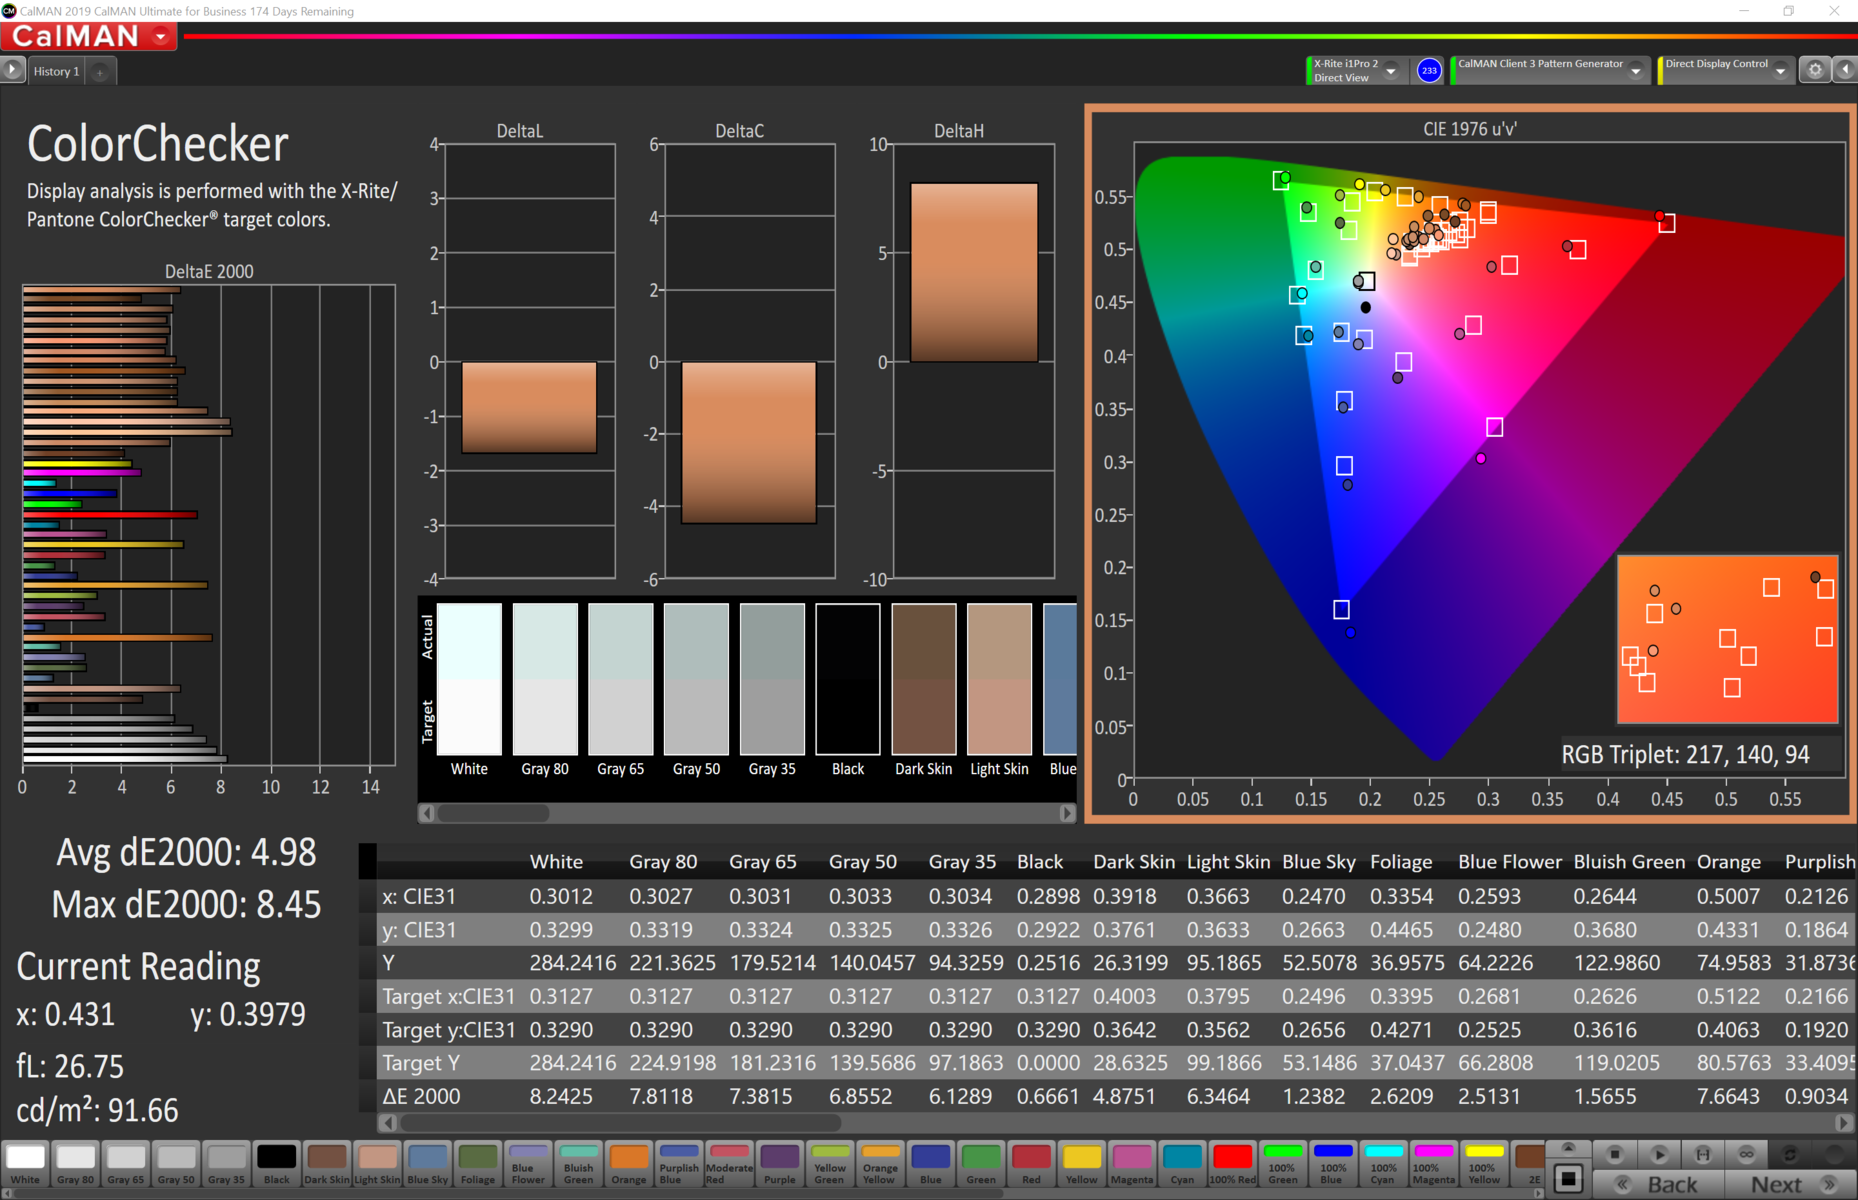
ΔE ColorChecker Calman: 4.98 | ∀{0.5-29.43 Ø4.71}
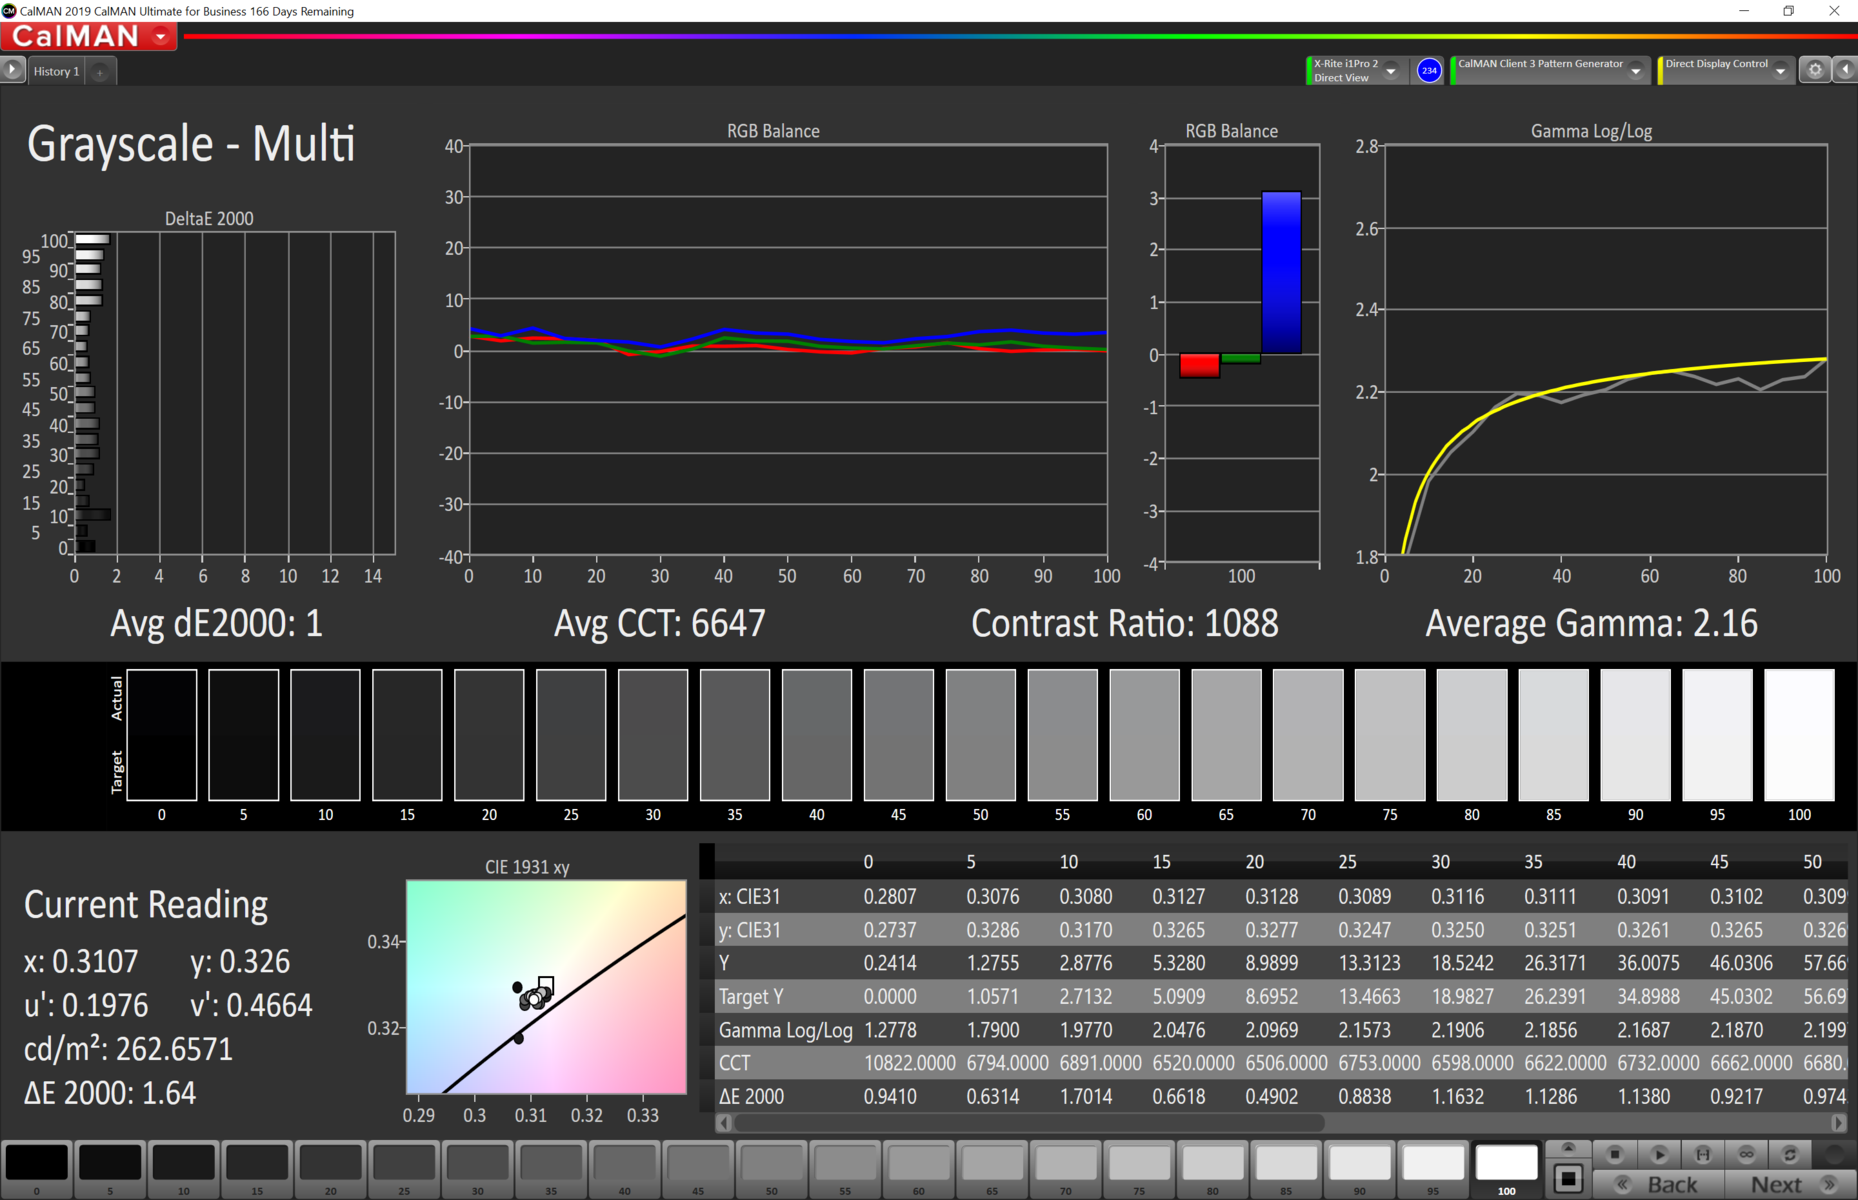
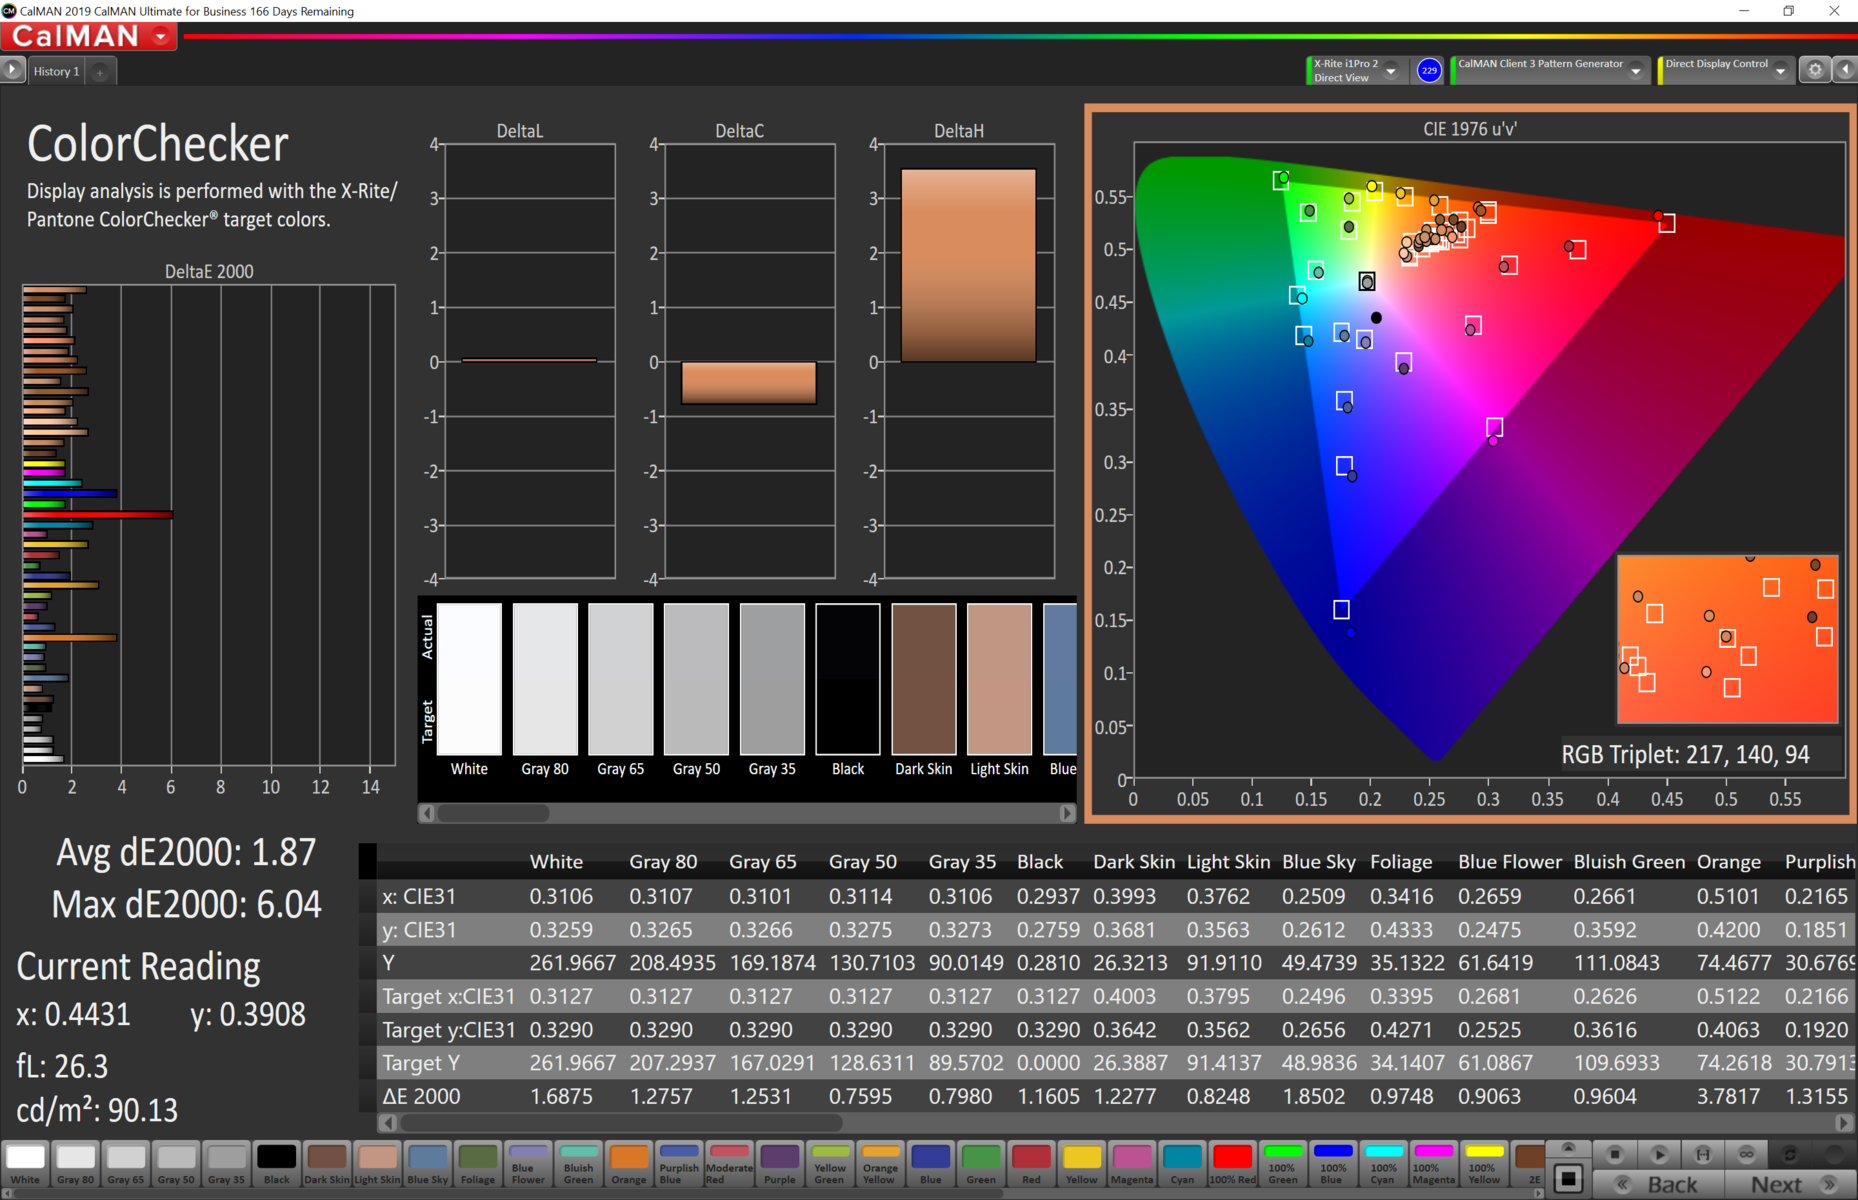
calibrated: 1.87
ΔE Greyscale Calman: 5.3 | ∀{0.09-98 Ø4.96}
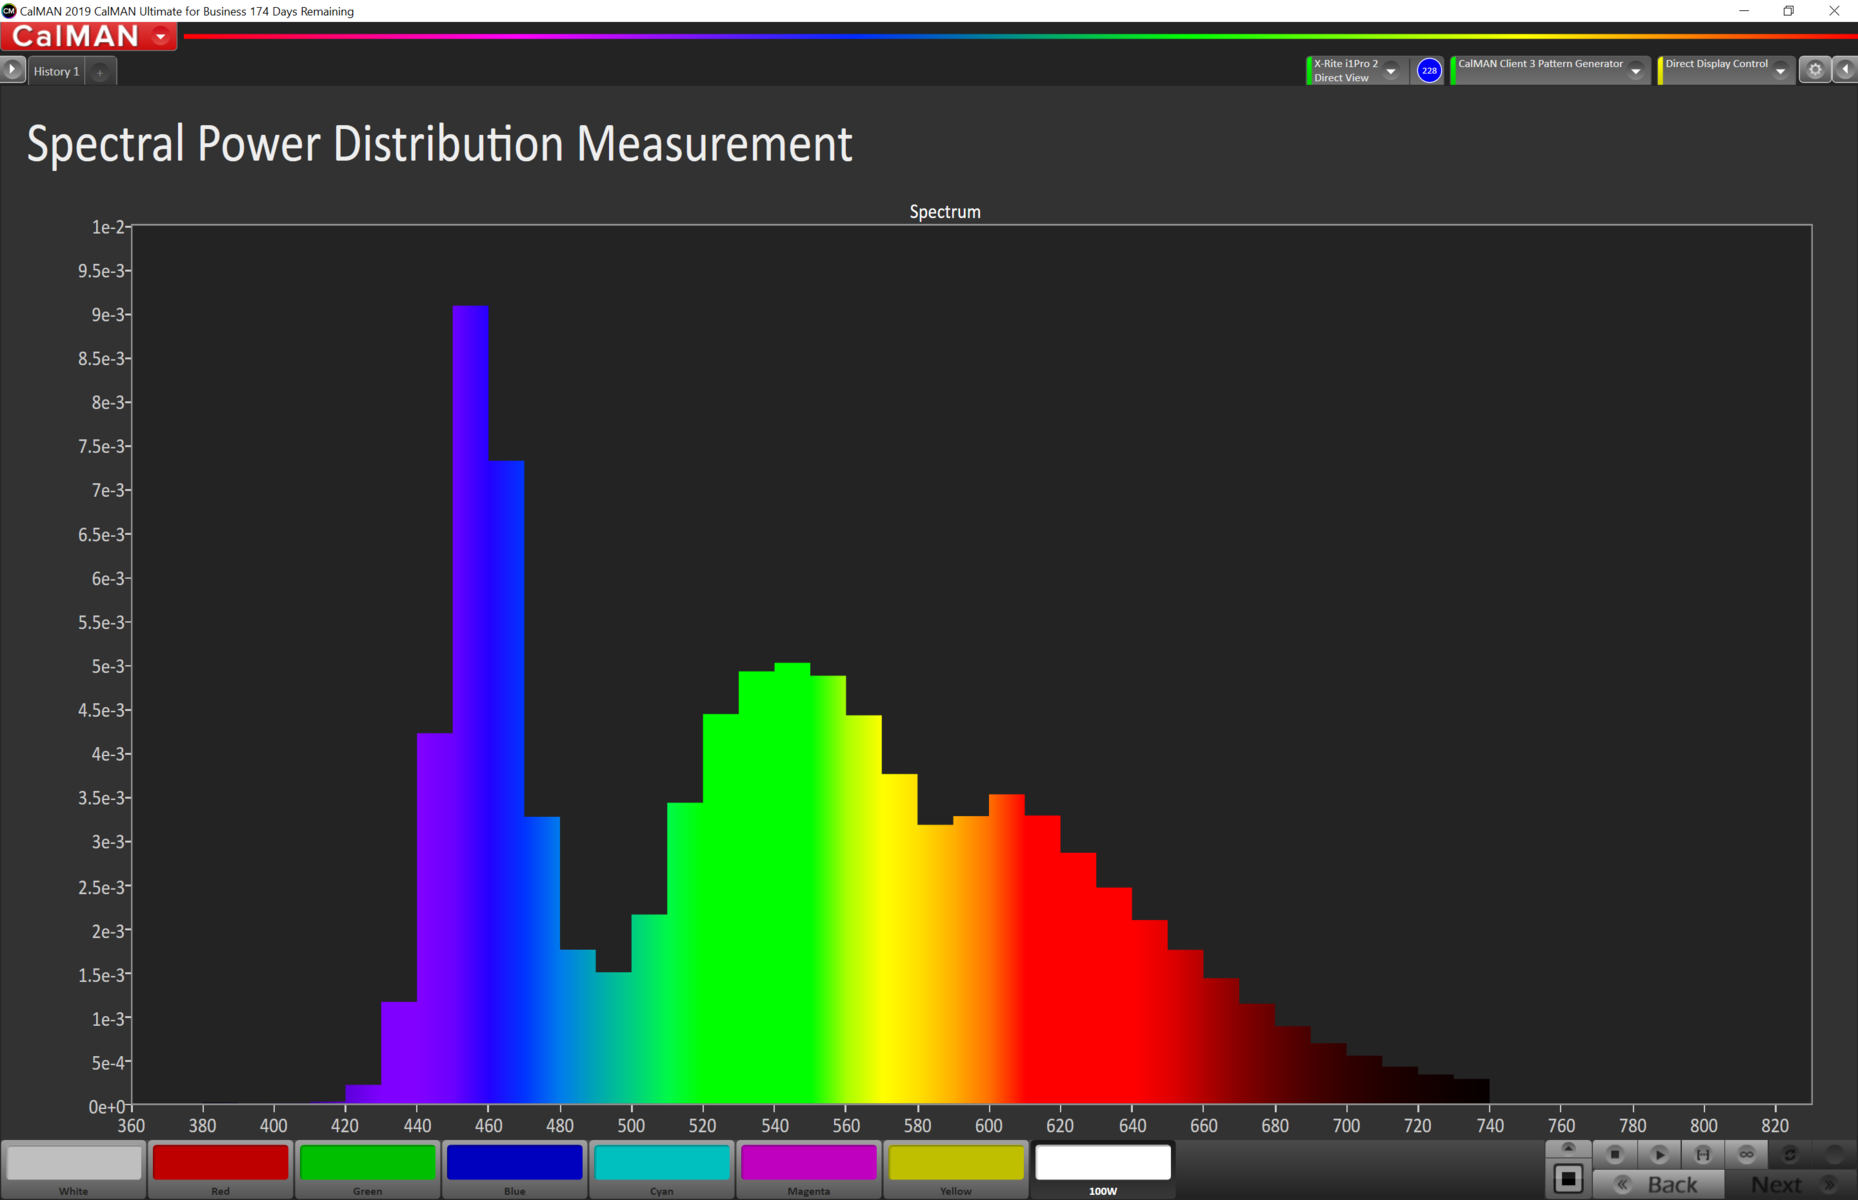
94% sRGB (Argyll 1.6.3 3D)
61% AdobeRGB 1998 (Argyll 1.6.3 3D)
68% AdobeRGB 1998 (Argyll 3D)
94.2% sRGB (Argyll 3D)
67.5% Display P3 (Argyll 3D)
Gamma: 2273
CCT: 7065 K
| Lenovo V340-17IWL 81RG001YGE CMN N173HCE-E31 CMN1738, , 1920x1080, 17.3" | HP 17-by2437ng BOE NT173WDM-N21, TN LED, 1600x900, 17.3" | Lenovo Ideapad L340-17API-81LY0004GE AU Optronics B173RTN02.1, TN LED, 1600x900, 17.3" | Dell Inspiron 17 3780 AU Optronics B173HAN01.3, IPS, 1920x1080, 17.3" | Lenovo IdeaPad 330-17IKB 81DM BOE0685, TN LED, 1600x900, 17.3" | Acer Aspire ES1-732-P7YA Chi Mei N173FGE-E23, TN LED, 1600x900, 17.3" | HP 17-ca0013ng LG Philips LGD059E, IPS, 1920x1080, 17.3" | HP Envy 17-ae143ng AU Optronics B173HW01 V0, IPS, 1920x1080, 17.3" | Média da turma Office | |
|---|---|---|---|---|---|---|---|---|---|
| Display | -21% | -23% | -6% | -18% | -18% | -5% | -6% | -10% | |
| Display P3 Coverage (%) | 67.5 | 53.6 -21% | 51.1 -24% | 63.7 -6% | 56.9 -16% | 53.5 -21% | 67 -1% | 63.9 -5% | 61.7 ? -9% |
| sRGB Coverage (%) | 94.2 | 74 -21% | 73.9 -22% | 88.9 -6% | 76.3 -19% | 80.1 -15% | 86.4 -8% | 88 -7% | 82.5 ? -12% |
| AdobeRGB 1998 Coverage (%) | 68 | 53.9 -21% | 52.7 -22% | 64.6 -5% | 55.9 -18% | 54.9 -19% | 63.2 -7% | 64.3 -5% | 61.9 ? -9% |
| Response Times | 20% | 22% | -30% | 21% | 5% | 9% | 15% | -18% | |
| Response Time Grey 50% / Grey 80% * (ms) | 37 ? | 42 ? -14% | 42 ? -14% | 46 ? -24% | 38.8 ? -5% | 49 ? -32% | 33 ? 11% | 33 ? 11% | 29.6 ? 20% |
| Response Time Black / White * (ms) | 25.8 ? | 12 ? 53% | 11 ? 57% | 35.2 ? -36% | 13.6 ? 47% | 15 ? 42% | 24 ? 7% | 21 ? 19% | 18.8 ? 27% |
| PWM Frequency (Hz) | 25000 ? | 250 ? | 961 | 46.5 ? -100% | |||||
| Screen | -78% | -62% | -2% | -68% | -50% | -12% | 1% | 1% | |
| Brightness middle (cd/m²) | 284 | 222 -22% | 230 -19% | 322.9 14% | 210.5 -26% | 227 -20% | 394 39% | 352 24% | 409 ? 44% |
| Brightness (cd/m²) | 268 | 208 -22% | 201 -25% | 322 20% | 204 -24% | 209 -22% | 352 31% | 330 23% | |
| Brightness Distribution (%) | 77 | 89 16% | 78 1% | 84 9% | 94 22% | 80 4% | 83 8% | 88 14% | |
| Black Level * (cd/m²) | 0.23 | 0.649 -182% | 0.46 -100% | 0.26 -13% | 0.63 -174% | 0.15 35% | 0.35 -52% | 0.31 -35% | 0.2523 ? -10% |
| Contrast (:1) | 1235 | 342 -72% | 500 -60% | 1242 1% | 334 -73% | 1513 23% | 1126 -9% | 1135 -8% | |
| Colorchecker dE 2000 * | 4.98 | 11.77 -136% | 10.36 -108% | 4.19 16% | 9.48 -90% | 12.93 -160% | 6.08 -22% | 4.34 13% | 4.18 ? 16% |
| Colorchecker dE 2000 max. * | 8.45 | 20.78 -146% | 18.63 -120% | 7.04 17% | 17.19 -103% | 20.92 -148% | 10.88 -29% | 8.69 -3% | 11.5 ? -36% |
| Colorchecker dE 2000 calibrated * | 1.87 | 3.5 -87% | 3.55 -90% | 4.04 -116% | 2.8 -50% | 2.51 ? -34% | |||
| Greyscale dE 2000 * | 5.3 | 14.31 -170% | 13.32 -151% | 4.5 15% | 12 -126% | 14.69 -177% | 7.22 -36% | 5.66 -7% | 4.07 ? 23% |
| Gamma | 2273 0% | 2.24 98% | 2.54 87% | 1.97 112% | 2.12 104% | 2.38 92% | 2.48 89% | 2.29 96% | 2.23 99% ? |
| CCT | 7065 92% | 19250 34% | 14124 46% | 7041 92% | 13874 47% | 19863 33% | 7997 81% | 6326 103% | 6786 96% ? |
| Color Space (Percent of AdobeRGB 1998) (%) | 61 | 48 -21% | 48 -21% | 57.6 -6% | 49.4 -19% | 51 -16% | 57 -7% | 57 -7% | |
| Color Space (Percent of sRGB) (%) | 94 | 74 -21% | 74 -21% | 88.4 -6% | 75.8 -19% | 80 -15% | 86 -9% | 88 -6% | |
| Média Total (Programa/Configurações) | -26% /
-55% | -21% /
-43% | -13% /
-6% | -22% /
-47% | -21% /
-36% | -3% /
-8% | 3% /
1% | -9% /
-7% |
* ... menor é melhor
Exibir tempos de resposta
| ↔ Tempo de resposta preto para branco | ||
|---|---|---|
| 25.8 ms ... ascensão ↗ e queda ↘ combinadas | ↗ 15.2 ms ascensão | 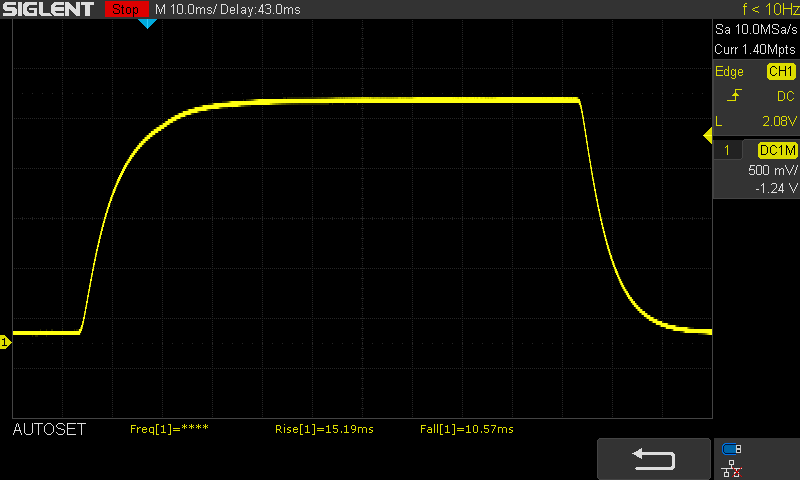 |
| ↘ 10.6 ms queda | ||
| A tela mostra taxas de resposta relativamente lentas em nossos testes e pode ser muito lenta para os jogadores. Em comparação, todos os dispositivos testados variam de 0.1 (mínimo) a 240 (máximo) ms. » 62 % de todos os dispositivos são melhores. Isso significa que o tempo de resposta medido é pior que a média de todos os dispositivos testados (19.8 ms). | ||
| ↔ Tempo de resposta 50% cinza a 80% cinza | ||
| 37 ms ... ascensão ↗ e queda ↘ combinadas | ↗ 17.7 ms ascensão | 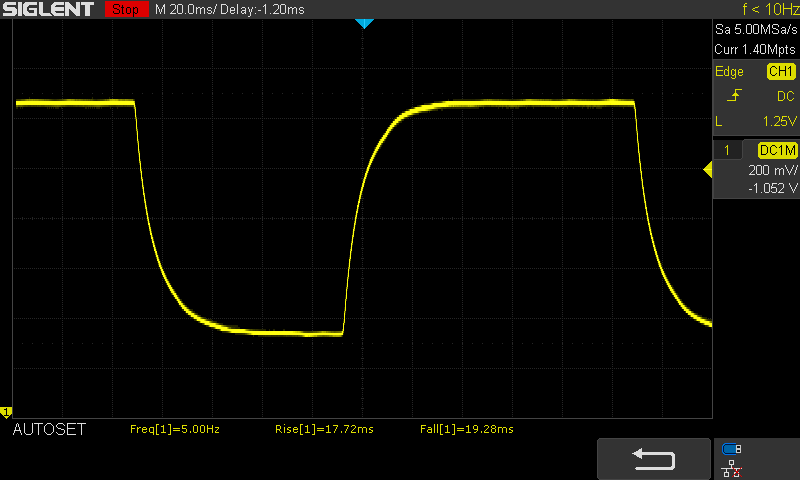 |
| ↘ 19.3 ms queda | ||
| A tela mostra taxas de resposta lentas em nossos testes e será insatisfatória para os jogadores. Em comparação, todos os dispositivos testados variam de 0.165 (mínimo) a 636 (máximo) ms. » 53 % de todos os dispositivos são melhores. Isso significa que o tempo de resposta medido é pior que a média de todos os dispositivos testados (31 ms). | ||
Cintilação da tela / PWM (modulação por largura de pulso)
| Tela tremeluzindo/PWM detectado | 25000 Hz | ≤ 24 % configuração de brilho | 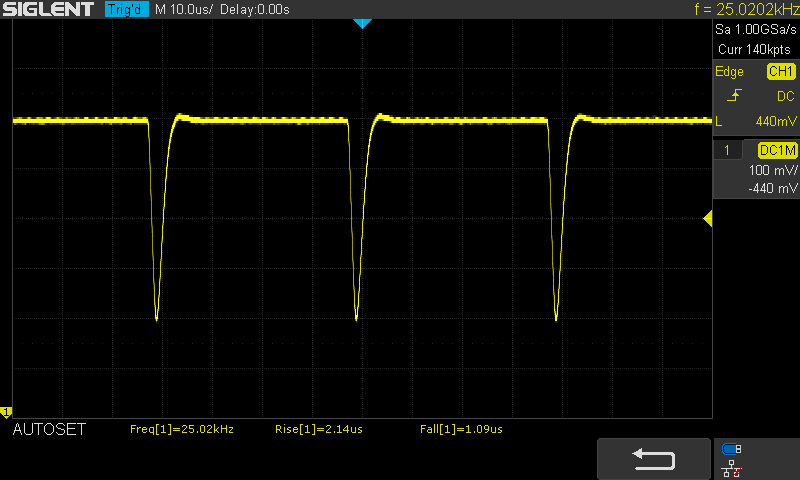 |
A luz de fundo da tela pisca em 25000 Hz (pior caso, por exemplo, utilizando PWM) Cintilação detectada em uma configuração de brilho de 24 % e abaixo. Não deve haver cintilação ou PWM acima desta configuração de brilho. A frequência de 25000 Hz é bastante alta, então a maioria dos usuários sensíveis ao PWM não deve notar nenhuma oscilação. [pwm_comparison] Em comparação: 52 % de todos os dispositivos testados não usam PWM para escurecer a tela. Se PWM foi detectado, uma média de 7754 (mínimo: 5 - máximo: 343500) Hz foi medida. | |||

Cinebench R15: CPU Single 64Bit | CPU Multi 64Bit
Blender: v2.79 BMW27 CPU
7-Zip 18.03: 7z b 4 -mmt1 | 7z b 4
Geekbench 5.5: Single-Core | Multi-Core
HWBOT x265 Benchmark v2.2: 4k Preset
LibreOffice : 20 Documents To PDF
R Benchmark 2.5: Overall mean
| Cinebench R20 / CPU (Single Core) | |
| Média da turma Office (345 - 816, n=75, últimos 2 anos) | |
| HP 17-by2437ng | |
| Média Intel Core i5-8265U (325 - 403, n=16) | |
| Média Intel Core i3-8145U (n=1) | |
| Lenovo V340-17IWL 81RG001YGE | |
| Acer Swift 3 SF314-54-P2RK | |
| Cinebench R20 / CPU (Multi Core) | |
| Média da turma Office (648 - 8840, n=75, últimos 2 anos) | |
| Média Intel Core i5-8265U (972 - 1564, n=16) | |
| HP 17-by2437ng | |
| Média Intel Core i3-8145U (n=1) | |
| Lenovo V340-17IWL 81RG001YGE | |
| Acer Swift 3 SF314-54-P2RK | |
| Cinebench R15 / CPU Single 64Bit | |
| Média da turma Office (99.5 - 316, n=77, últimos 2 anos) | |
| HP 17-by2437ng | |
| Média Intel Core i5-8265U (111 - 164, n=35) | |
| Média Intel Core i3-8145U (139 - 154, n=4) | |
| Lenovo IdeaPad V110-15IKB 80TH001SGE | |
| Lenovo V340-17IWL 81RG001YGE | |
| Acer Swift 3 SF314-54-P2RK | |
| Cinebench R15 / CPU Multi 64Bit | |
| Média da turma Office (250 - 3380, n=77, últimos 2 anos) | |
| Média Intel Core i5-8265U (457 - 750, n=38) | |
| Média Intel Core i3-8145U (318 - 361, n=4) | |
| HP 17-by2437ng | |
| Lenovo IdeaPad V110-15IKB 80TH001SGE | |
| Acer Swift 3 SF314-54-P2RK | |
| Lenovo V340-17IWL 81RG001YGE | |
| Blender / v2.79 BMW27 CPU | |
| Lenovo V340-17IWL 81RG001YGE | |
| HP 17-by2437ng | |
| Média Intel Core i5-8265U (769 - 1098, n=15) | |
| Média da turma Office (158 - 1940, n=76, últimos 2 anos) | |
| 7-Zip 18.03 / 7z b 4 -mmt1 | |
| Média da turma Office (3387 - 6469, n=77, últimos 2 anos) | |
| HP 17-by2437ng | |
| Média Intel Core i5-8265U (3780 - 4195, n=15) | |
| Lenovo V340-17IWL 81RG001YGE | |
| 7-Zip 18.03 / 7z b 4 | |
| Média da turma Office (7098 - 76886, n=77, últimos 2 anos) | |
| Média Intel Core i5-8265U (13731 - 18802, n=15) | |
| HP 17-by2437ng | |
| Lenovo V340-17IWL 81RG001YGE | |
| Geekbench 5.5 / Single-Core | |
| Média da turma Office (811 - 2175, n=73, últimos 2 anos) | |
| Média Intel Core i5-8265U (1024 - 1047, n=4) | |
| HP 17-by2437ng | |
| Lenovo V340-17IWL 81RG001YGE | |
| Geekbench 5.5 / Multi-Core | |
| Média da turma Office (1483 - 16999, n=73, últimos 2 anos) | |
| Média Intel Core i5-8265U (3442 - 3986, n=4) | |
| HP 17-by2437ng | |
| Lenovo V340-17IWL 81RG001YGE | |
| HWBOT x265 Benchmark v2.2 / 4k Preset | |
| Média da turma Office (2.21 - 26, n=76, últimos 2 anos) | |
| Média Intel Core i5-8265U (3.38 - 4.8, n=15) | |
| HP 17-by2437ng | |
| Média Intel Core i3-8145U (n=1) | |
| Lenovo V340-17IWL 81RG001YGE | |
| LibreOffice / 20 Documents To PDF | |
| Lenovo V340-17IWL 81RG001YGE | |
| HP 17-by2437ng | |
| Média Intel Core i5-8265U (59.4 - 67.8, n=4) | |
| Média da turma Office (39.9 - 102.3, n=76, últimos 2 anos) | |
| R Benchmark 2.5 / Overall mean | |
| Lenovo V340-17IWL 81RG001YGE | |
| HP 17-by2437ng | |
| Média Intel Core i5-8265U (0.72 - 0.754, n=4) | |
| Média da turma Office (0.393 - 0.888, n=76, últimos 2 anos) | |
* ... menor é melhor
| Performance rating - Percent | |
| Média da turma Office | |
| Dell Inspiron 17 3780 | |
| Média Intel Core i7-8565U | |
| Média Intel Core i5-8265U | |
| Lenovo Ideapad L340-17API-81LY0004GE | |
| HP 17-by2437ng | |
| HP Envy 17-ae143ng | |
| Média Intel Core i3-8145U | |
| Lenovo IdeaPad 330-17IKB 81DM | |
| Lenovo V340-17IWL 81RG001YGE | |
| Acer Aspire ES1-732-P7YA | |
| PCMark 10 Score | 2363 pontos | |
Ajuda | ||
| DPC Latencies / LatencyMon - interrupt to process latency (max), Web, Youtube, Prime95 | |
| Média da turma Office (365 - 98089, n=63, últimos 2 anos) | |
| HP 17-by2437ng | |
| HP 470 G7 8VU24EA | |
| Lenovo V340-17IWL 81RG001YGE | |
* ... menor é melhor
| Lenovo V340-17IWL 81RG001YGE Lenovo UMIS AM610 RPFTJ256PDD2MWX | Lenovo Ideapad S530-13IWL Lenovo UMIS AM610 RPFTJ256PDD2MWX | Schenker XMG Apex 15 NH57AF1 Samsung SSD 970 EVO Plus 1TB | Média Lenovo UMIS AM610 RPFTJ256PDD2MWX | Média da turma Office | |
|---|---|---|---|---|---|
| AS SSD | 74% | 359% | 29% | 328% | |
| Seq Read (MB/s) | 758 | 1377 82% | 3002 296% | 1068 ? 41% | 4326 ? 471% |
| Seq Write (MB/s) | 278 | 805 190% | 2646 852% | 542 ? 95% | 2771 ? 897% |
| 4K Read (MB/s) | 28.09 | 45.01 60% | 58.3 108% | 36.6 ? 30% | 58.1 ? 107% |
| 4K Write (MB/s) | 74.1 | 88.9 20% | 188.1 154% | 81.5 ? 10% | 162.6 ? 119% |
| 4K-64 Read (MB/s) | 480.5 | 767 60% | 1799 274% | 624 ? 30% | 958 ? 99% |
| 4K-64 Write (MB/s) | 273.3 | 611 124% | 2440 793% | 442 ? 62% | 1643 ? 501% |
| Access Time Read * (ms) | 0.134 | 0.141 -5% | 0.043 68% | 0.1375 ? -3% | 0.08448 ? 37% |
| Access Time Write * (ms) | 0.065 | 0.043 34% | 0.02 69% | 0.054 ? 17% | 0.05931 ? 9% |
| Score Read (Points) | 584 | 950 63% | 2158 270% | 767 ? 31% | 1449 ? 148% |
| Score Write (Points) | 375 | 781 108% | 2892 671% | 578 ? 54% | 2083 ? 455% |
| Score Total (Points) | 1242 | 2200 77% | 6141 394% | 1721 ? 39% | 4207 ? 239% |
| Copy ISO MB/s (MB/s) | 290 | 290 ? 0% | 2541 ? 776% | ||
| Copy Program MB/s (MB/s) | 220 | 220 ? 0% | 790 ? 259% | ||
| Copy Game MB/s (MB/s) | 280 | 280 ? 0% | 1627 ? 481% |
* ... menor é melhor

Dauerleistung Lesen: DiskSpd Read Loop, Queue Depth 8
| 3DMark 11 - 1280x720 Performance GPU | |
| Média da turma Office (2551 - 18313, n=72, últimos 2 anos) | |
| Lenovo IdeaPad 330-17IKB 81DM | |
| HP Envy 17-ae143ng | |
| HP 17-ca0013ng | |
| Média NVIDIA GeForce MX230 (3180 - 3582, n=6) | |
| Lenovo Ideapad L340-17API-81LY0004GE | |
| Dell Inspiron 17 3780 | |
| HP 17-by2437ng | |
| Lenovo V340-17IWL 81RG001YGE | |
| Média Intel HD Graphics 610 (804 - 949, n=5) | |
| Acer Aspire ES1-732-P7YA | |
| 3DMark 06 Standard Score | 6026 pontos | |
| 3DMark 11 Performance | 1026 pontos | |
| 3DMark Ice Storm Standard Score | 37162 pontos | |
| 3DMark Cloud Gate Standard Score | 4244 pontos | |
| 3DMark Fire Strike Score | 597 pontos | |
| 3DMark Time Spy Score | 222 pontos | |
Ajuda | ||
| The Witcher 3 - 1024x768 Low Graphics & Postprocessing | |
| Média da turma Office (32.2 - 135, n=3, últimos 2 anos) | |
| Lenovo IdeaPad 330-17IKB 81DM | |
| Média NVIDIA GeForce MX230 (45.9 - 48.4, n=2) | |
| Dell Inspiron 17 3780 | |
| Média Intel UHD Graphics 620 (8.8 - 50.9, n=64) | |
| Lenovo V340-17IWL 81RG001YGE | |
| Dota 2 Reborn - 1280x720 min (0/3) fastest | |
| Média NVIDIA GeForce MX230 (n=1) | |
| Média da turma Office (32.2 - 174.1, n=77, últimos 2 anos) | |
| Média Intel UHD Graphics 620 (42.4 - 90, n=92) | |
| Média Intel HD Graphics 610 (52.5 - 64.3, n=2) | |
| Lenovo V340-17IWL 81RG001YGE | |
| Far Cry 5 - 1280x720 Low Preset AA:T | |
| Média da turma Office (38 - 99, n=13, últimos 2 anos) | |
| Média NVIDIA GeForce MX230 (n=1) | |
| Média Intel UHD Graphics 620 (6 - 16, n=12) | |
| Lenovo V340-17IWL 81RG001YGE | |
| Média Intel HD Graphics 610 (n=1) | |
| baixo | média | alto | ultra | |
|---|---|---|---|---|
| Diablo III (2012) | 38.9 | 26.2 | ||
| Counter-Strike: GO (2012) | 57.9 | 42.1 | ||
| GTA V (2015) | 17.9 | 16.7 | ||
| The Witcher 3 (2015) | 9.2 | |||
| Dota 2 Reborn (2015) | 54.4 | 23.1 | 10.6 | 9.7 |
| Rainbow Six Siege (2015) | 24.2 | 15.1 | ||
| Overwatch (2016) | 24.8 | 17.7 | ||
| Rocket League (2017) | 20.3 | |||
| Middle-earth: Shadow of War (2017) | 14 | |||
| Fortnite (2018) | 23 pequenos problemas gráficos | |||
| X-Plane 11.11 (2018) | 9.56 | 7.53 | 6.92 | |
| Far Cry 5 (2018) | 7 | |||
| Shadow of the Tomb Raider (2018) | 9 | |||
| Battlefield V (2018) | 6.82 | |||
| Far Cry New Dawn (2019) | 7 | |||
| Dirt Rally 2.0 (2019) | 23.6 | |||
| Anno 1800 (2019) | 10.4 | |||
| Total War: Three Kingdoms (2019) | 16.9 | 5 | ||
| F1 2019 (2019) | 16.6 | |||
| FIFA 20 (2019) | 27 problemas gráficos graves (too slow) | |||
| Ghost Recon Breakpoint (2019) | 6 | |||
| Need for Speed Heat (2019) | 8 | |||
| Star Wars Jedi Fallen Order (2019) | 7.74 | |||
| Hearthstone (2020) | 30.4 | 21.9 | ||
| Hunt Showdown (2020) | 8.59 | |||
| Doom Eternal (2020) | 0 o jogo não começa | |||
| Gears Tactics (2020) | 15.5 |
Barulho
| Ocioso |
| 30.2 / 31.1 / 31.1 dB |
| Carga |
| 31.1 / 32.5 dB |
 | ||
30 dB silencioso 40 dB(A) audível 50 dB(A) ruidosamente alto |
||
min: | ||
(+) A temperatura máxima no lado superior é 31 °C / 88 F, em comparação com a média de 34.3 °C / 94 F , variando de 21.2 a 62.5 °C para a classe Office.
(+) A parte inferior aquece até um máximo de 34 °C / 93 F, em comparação com a média de 36.8 °C / 98 F
(+) Em uso inativo, a temperatura média para o lado superior é 24.1 °C / 75 F, em comparação com a média do dispositivo de 29.5 °C / ### class_avg_f### F.
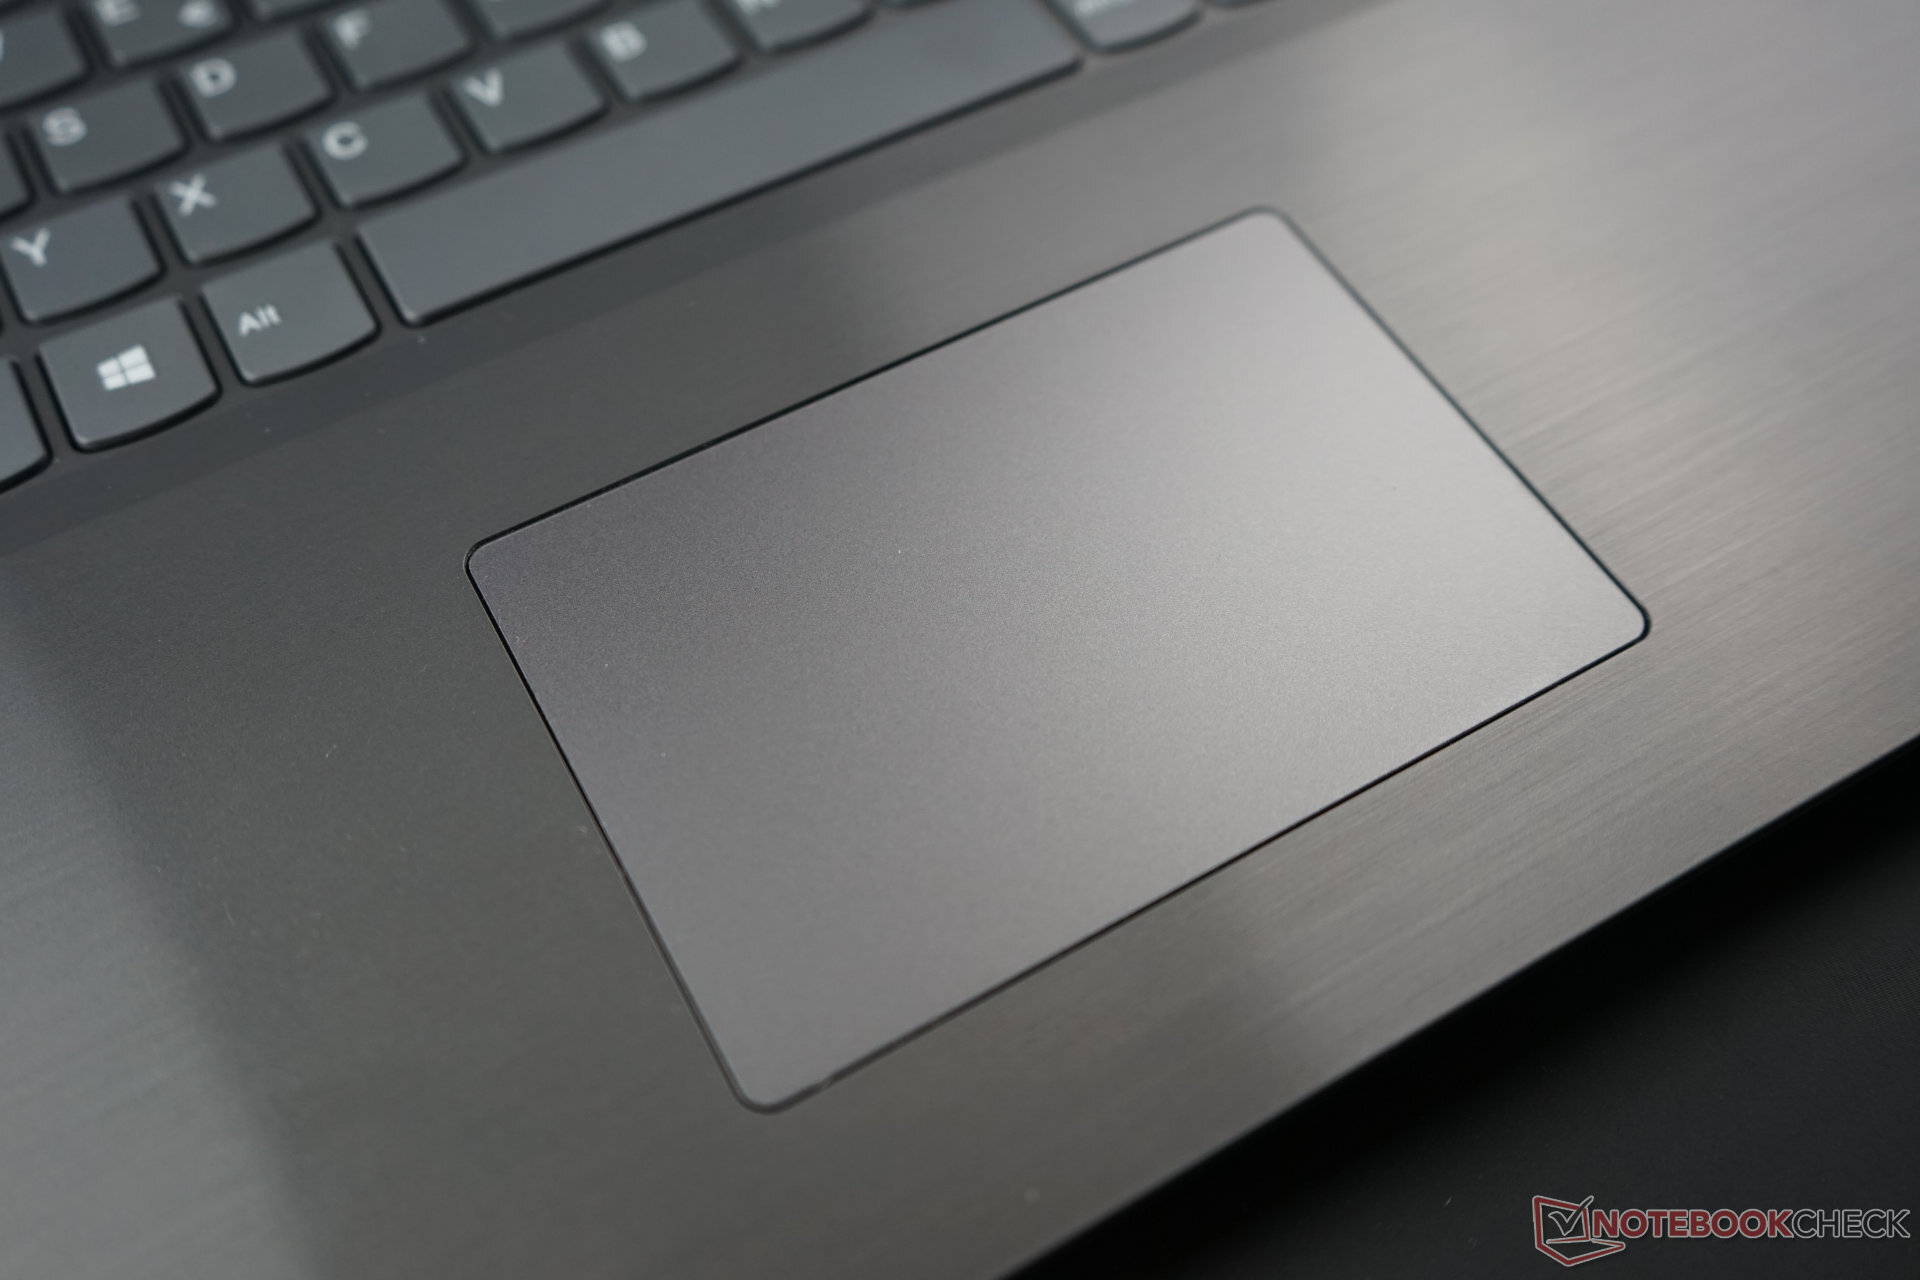
(+) Os apoios para as mãos e o touchpad são mais frios que a temperatura da pele, com um máximo de 25 °C / 77 F e, portanto, são frios ao toque.
(+) A temperatura média da área do apoio para as mãos de dispositivos semelhantes foi 27.5 °C / 81.5 F (+2.5 °C / 4.5 F).
Lenovo V340-17IWL 81RG001YGE análise de áudio
(±) | o volume do alto-falante é médio, mas bom (###valor### dB)
Graves 100 - 315Hz
(-) | quase nenhum baixo - em média 26.3% menor que a mediana
(-) | graves não são lineares (15% delta para frequência anterior)
Médios 400 - 2.000 Hz
(+) | médios equilibrados - apenas 4.9% longe da mediana
(+) | médios são lineares (6% delta para frequência anterior)
Altos 2 - 16 kHz
(+) | agudos equilibrados - apenas 2.3% longe da mediana
(±) | a linearidade dos máximos é média (7% delta para frequência anterior)
Geral 100 - 16.000 Hz
(±) | a linearidade do som geral é média (22.2% diferença em relação à mediana)
Comparado com a mesma classe
» 58% de todos os dispositivos testados nesta classe foram melhores, 9% semelhantes, 33% piores
» O melhor teve um delta de 7%, a média foi 21%, o pior foi 53%
Comparado com todos os dispositivos testados
» 65% de todos os dispositivos testados foram melhores, 6% semelhantes, 29% piores
» O melhor teve um delta de 4%, a média foi 23%, o pior foi 134%
Apple MacBook 12 (Early 2016) 1.1 GHz análise de áudio
(+) | os alto-falantes podem tocar relativamente alto (###valor### dB)
Graves 100 - 315Hz
(±) | graves reduzidos - em média 11.3% menor que a mediana
(±) | a linearidade dos graves é média (14.2% delta para a frequência anterior)
Médios 400 - 2.000 Hz
(+) | médios equilibrados - apenas 2.4% longe da mediana
(+) | médios são lineares (5.5% delta para frequência anterior)
Altos 2 - 16 kHz
(+) | agudos equilibrados - apenas 2% longe da mediana
(+) | os máximos são lineares (4.5% delta da frequência anterior)
Geral 100 - 16.000 Hz
(+) | o som geral é linear (10.2% diferença em relação à mediana)
Comparado com a mesma classe
» 7% de todos os dispositivos testados nesta classe foram melhores, 2% semelhantes, 90% piores
» O melhor teve um delta de 5%, a média foi 18%, o pior foi 53%
Comparado com todos os dispositivos testados
» 5% de todos os dispositivos testados foram melhores, 1% semelhantes, 94% piores
» O melhor teve um delta de 4%, a média foi 23%, o pior foi 134%
| desligado | |
| Ocioso | |
| Carga |
|
Key:
min: | |
| Lenovo V340-17IWL 81RG001YGE Pentium 5405U, UHD Graphics 610, Lenovo UMIS AM610 RPFTJ256PDD2MWX, , 1920x1080, 17.3" | HP 17-by2437ng i3-10110U, UHD Graphics 620, Toshiba KBG30ZMV256G, TN LED, 1600x900, 17.3" | Lenovo Ideapad L340-17API-81LY0004GE R5 3500U, Vega 8, Samsung SSD PM871b MZ7LN256HAJQ, TN LED, 1600x900, 17.3" | Dell Inspiron 17 3780 i7-8565U, Radeon 520, SK Hynix BC501 NVMe 256 GB, IPS, 1920x1080, 17.3" | Lenovo IdeaPad 330-17IKB 81DM i5-8550U, GeForce MX150, WDC Blue WD10SPZX-24Z10T0, TN LED, 1600x900, 17.3" | Acer Aspire ES1-732-P7YA Pentium N4200, HD Graphics 505, Toshiba MQ01ABD100, TN LED, 1600x900, 17.3" | HP 17-ca0013ng R5 2500U, Vega 8, Toshiba KBG30ZMV256G, IPS, 1920x1080, 17.3" | HP Envy 17-ae143ng i5-8250U, GeForce MX150, Liteonit CV3-8D128, IPS, 1920x1080, 17.3" | Média Intel HD Graphics 610 | Média da turma Office | |
|---|---|---|---|---|---|---|---|---|---|---|
| Power Consumption | -5% | 6% | -53% | -56% | -2% | -62% | -65% | 19% | -29% | |
| Idle Minimum * (Watt) | 4.5 | 5.7 -27% | 3.8 16% | 5 -11% | 4.7 -4% | 6 -33% | 7.6 -69% | 4.8 -7% | 4 ? 11% | 4.26 ? 5% |
| Idle Average * (Watt) | 8.8 | 8.6 2% | 6.3 28% | 10.9 -24% | 9.2 -5% | 9.6 -9% | 12.9 -47% | 8.3 6% | 6.85 ? 22% | 7.31 ? 17% |
| Idle Maximum * (Watt) | 10.8 | 9 17% | 6.8 37% | 12 -11% | 10.6 2% | 10.7 1% | 13.7 -27% | 10.3 5% | 7.93 ? 27% | 8.55 ? 21% |
| Load Average * (Watt) | 24.3 | 29.3 -21% | 31 -28% | 49.6 -104% | 56.3 -132% | 21.2 13% | 44 -81% | 61 -151% | 23 ? 5% | 43.8 ? -80% |
| Load Maximum * (Watt) | 31.1 | 30.5 2% | 38.6 -24% | 66.9 -115% | 75.3 -142% | 26 16% | 57.1 -84% | 86 -177% | 22.5 ? 28% | 64.5 ? -107% |
| Witcher 3 ultra * (Watt) | 55 |
* ... menor é melhor
| Lenovo V340-17IWL 81RG001YGE Pentium 5405U, UHD Graphics 610, 36 Wh | HP 17-by2437ng i3-10110U, UHD Graphics 620, 41 Wh | Lenovo Ideapad L340-17API-81LY0004GE R5 3500U, Vega 8, 36 Wh | Dell Inspiron 17 3780 i7-8565U, Radeon 520, 42 Wh | Lenovo IdeaPad 330-17IKB 81DM i5-8550U, GeForce MX150, 34 Wh | Acer Aspire ES1-732-P7YA Pentium N4200, HD Graphics 505, 37 Wh | HP 17-ca0013ng R5 2500U, Vega 8, 40.6 Wh | HP Envy 17-ae143ng i5-8250U, GeForce MX150, 55.8 Wh | Média da turma Office | |
|---|---|---|---|---|---|---|---|---|---|
| Duração da bateria | 8% | 30% | -33% | -26% | -4% | -28% | 53% | 104% | |
| H.264 (h) | 5.7 | 15.5 ? 172% | |||||||
| WiFi v1.3 (h) | 5.3 | 5.7 8% | 6.9 30% | 4.2 -21% | 3.9 -26% | 5.1 -4% | 3.8 -28% | 8.1 53% | 13.2 ? 149% |
| Load (h) | 2 | 1.1 -45% | 1.5 -25% | 1.808 ? -10% | |||||
| Reader / Idle (h) | 9.6 | 8.5 | 24.5 ? |
Pro
Contra
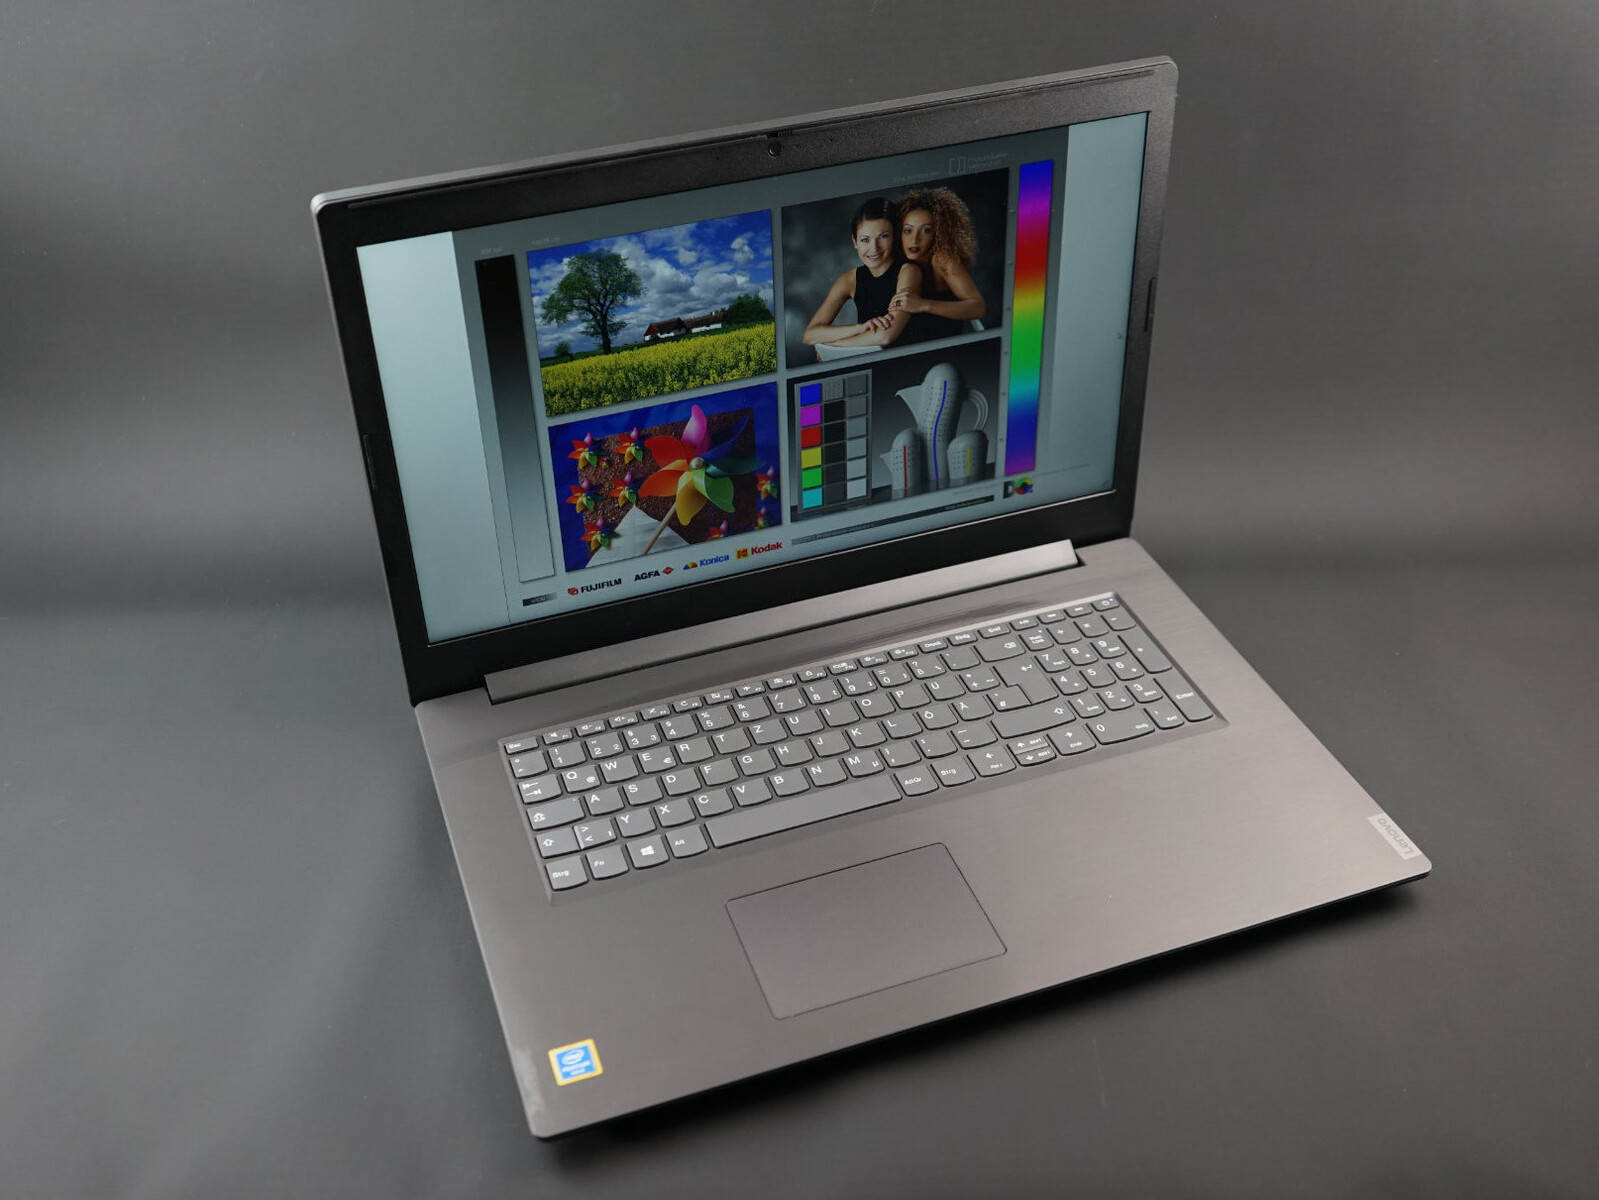
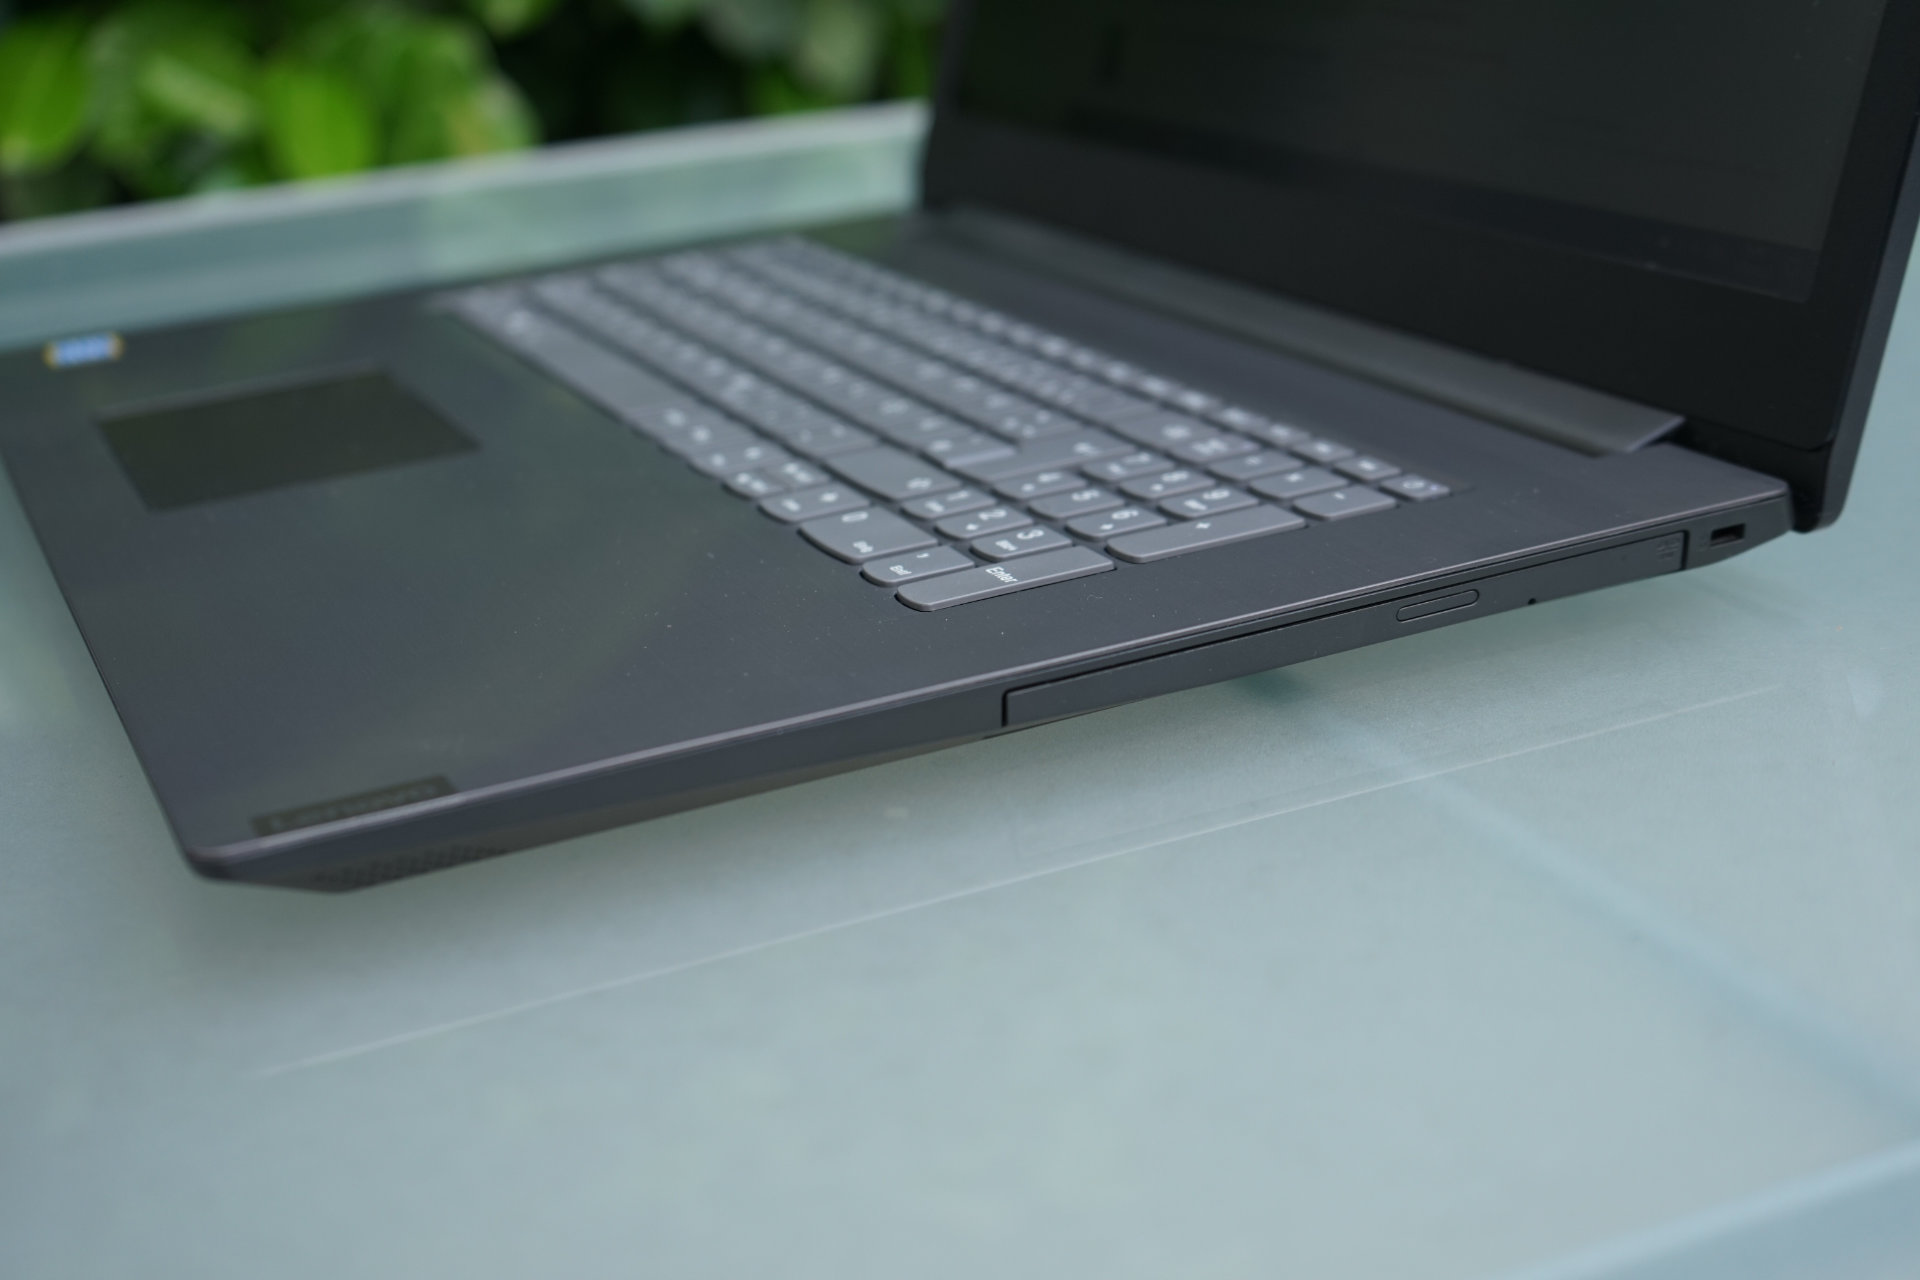
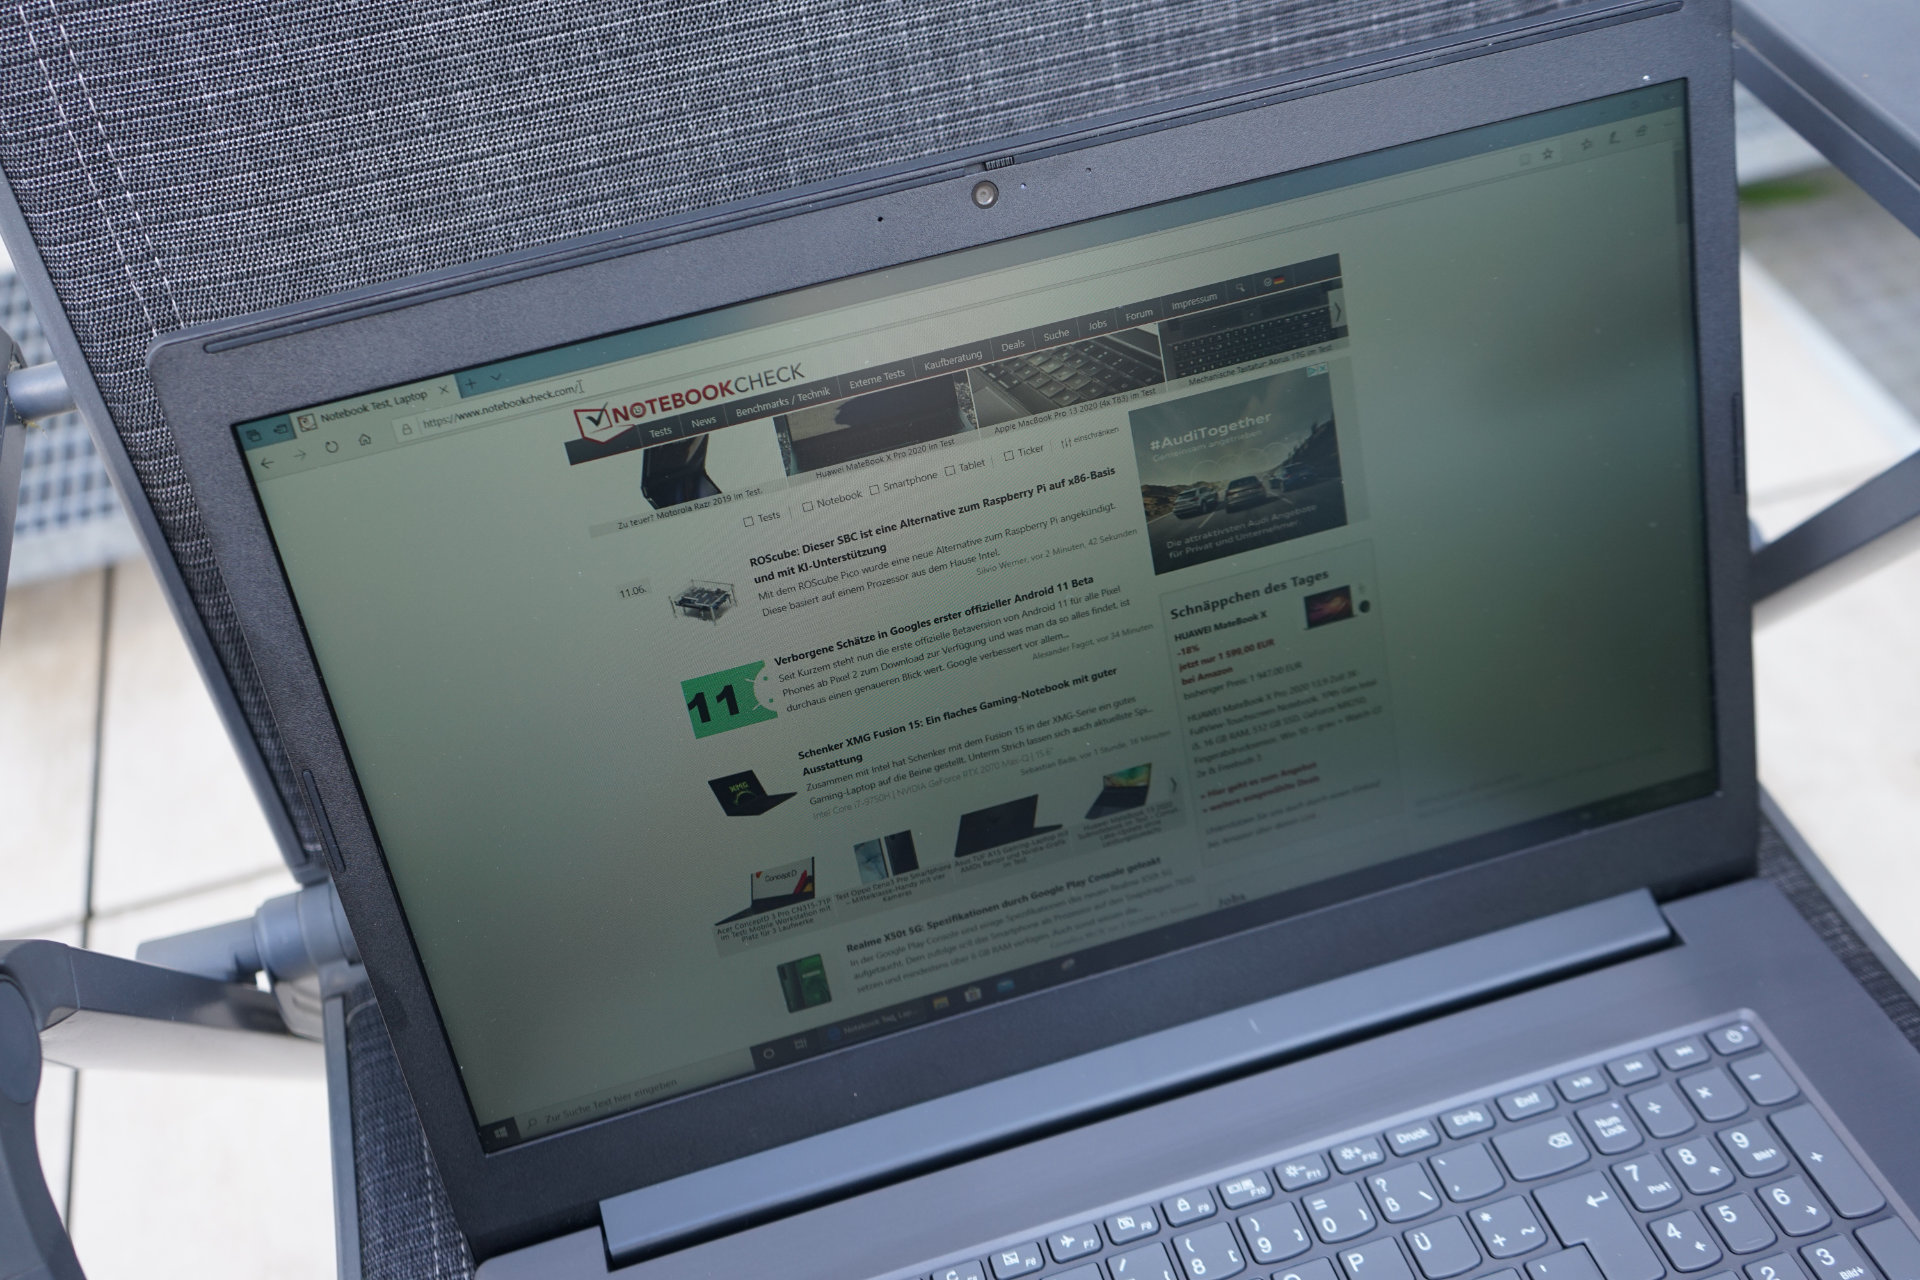
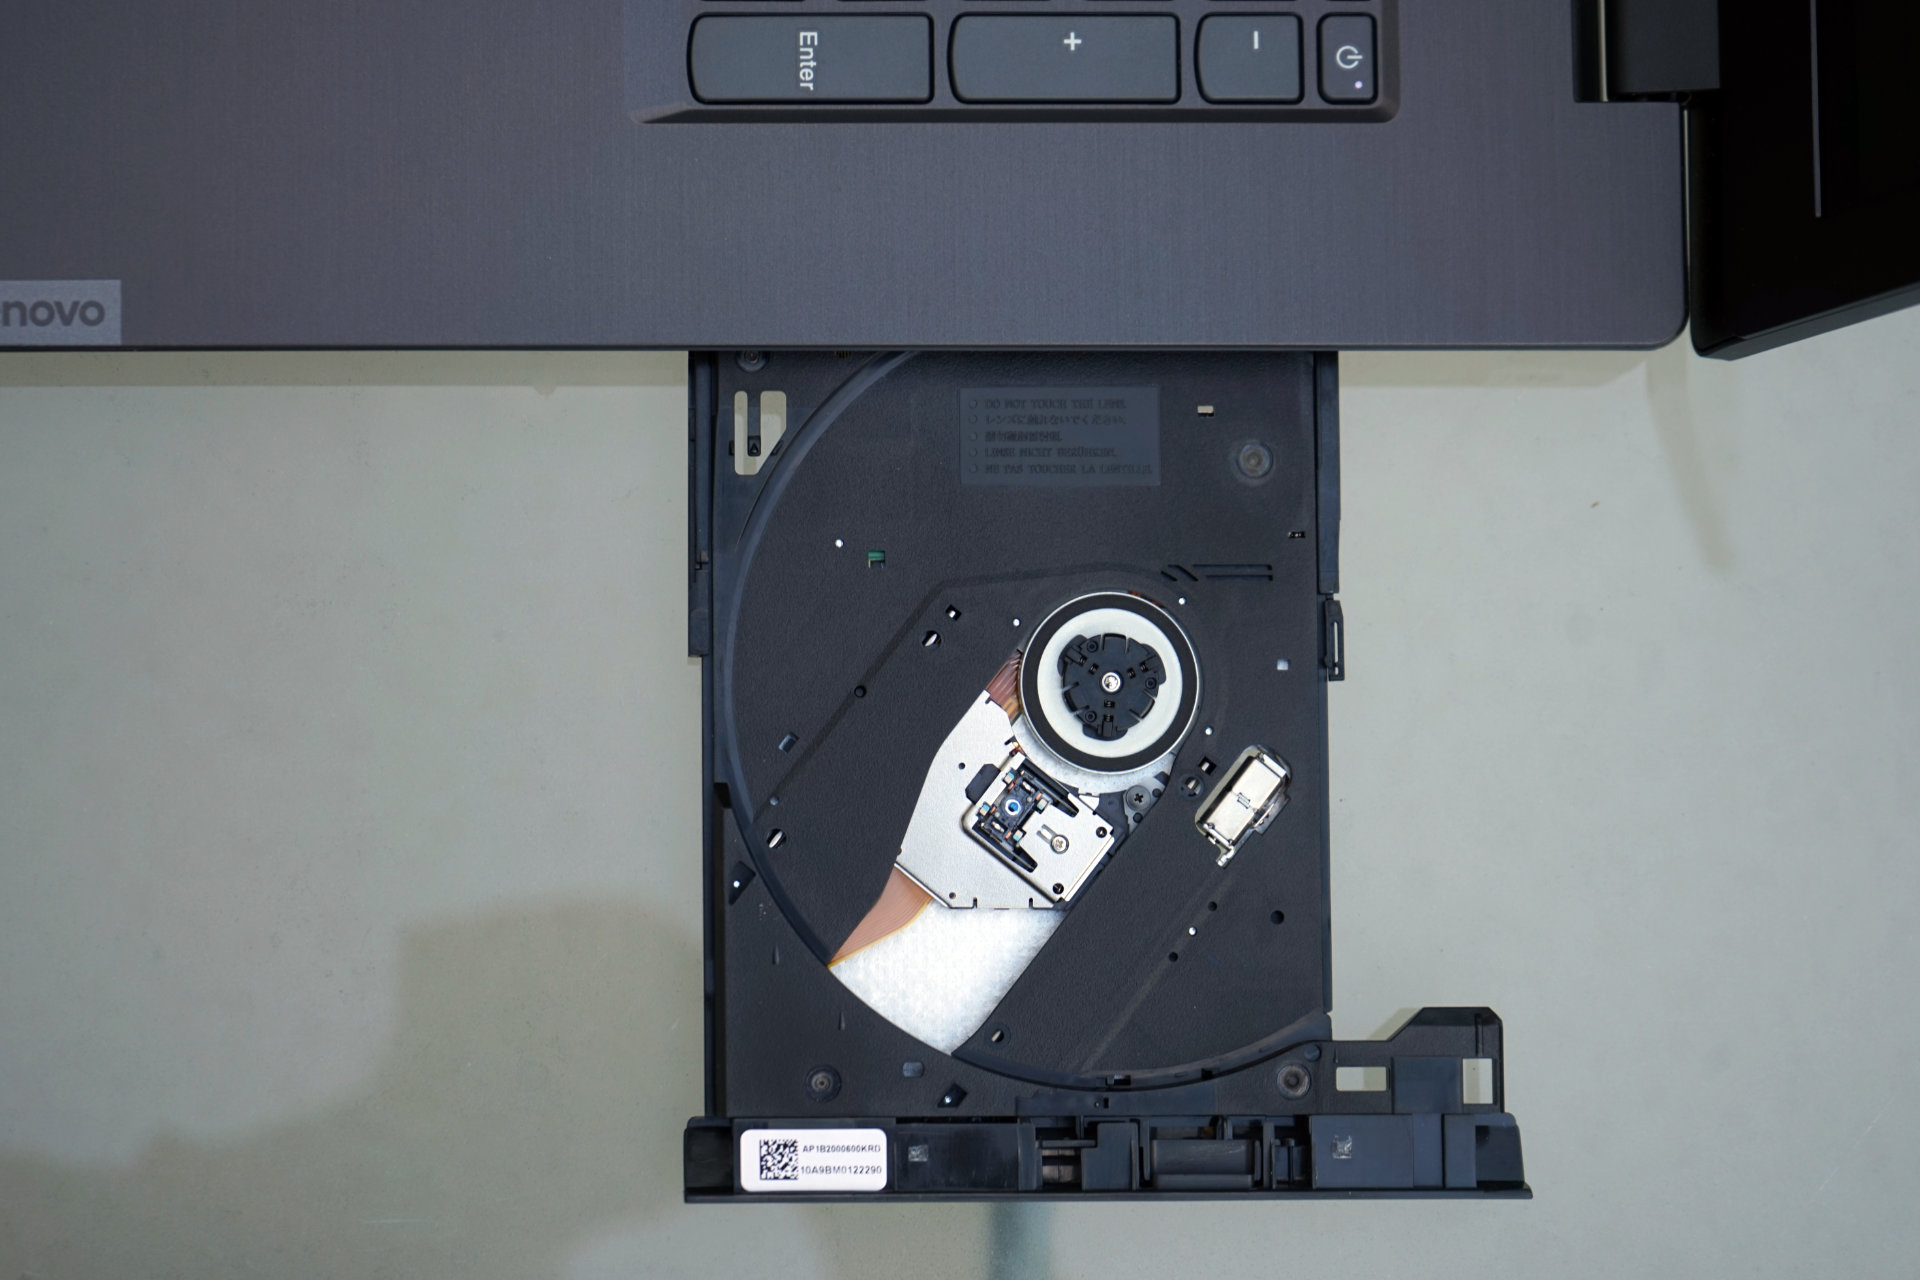
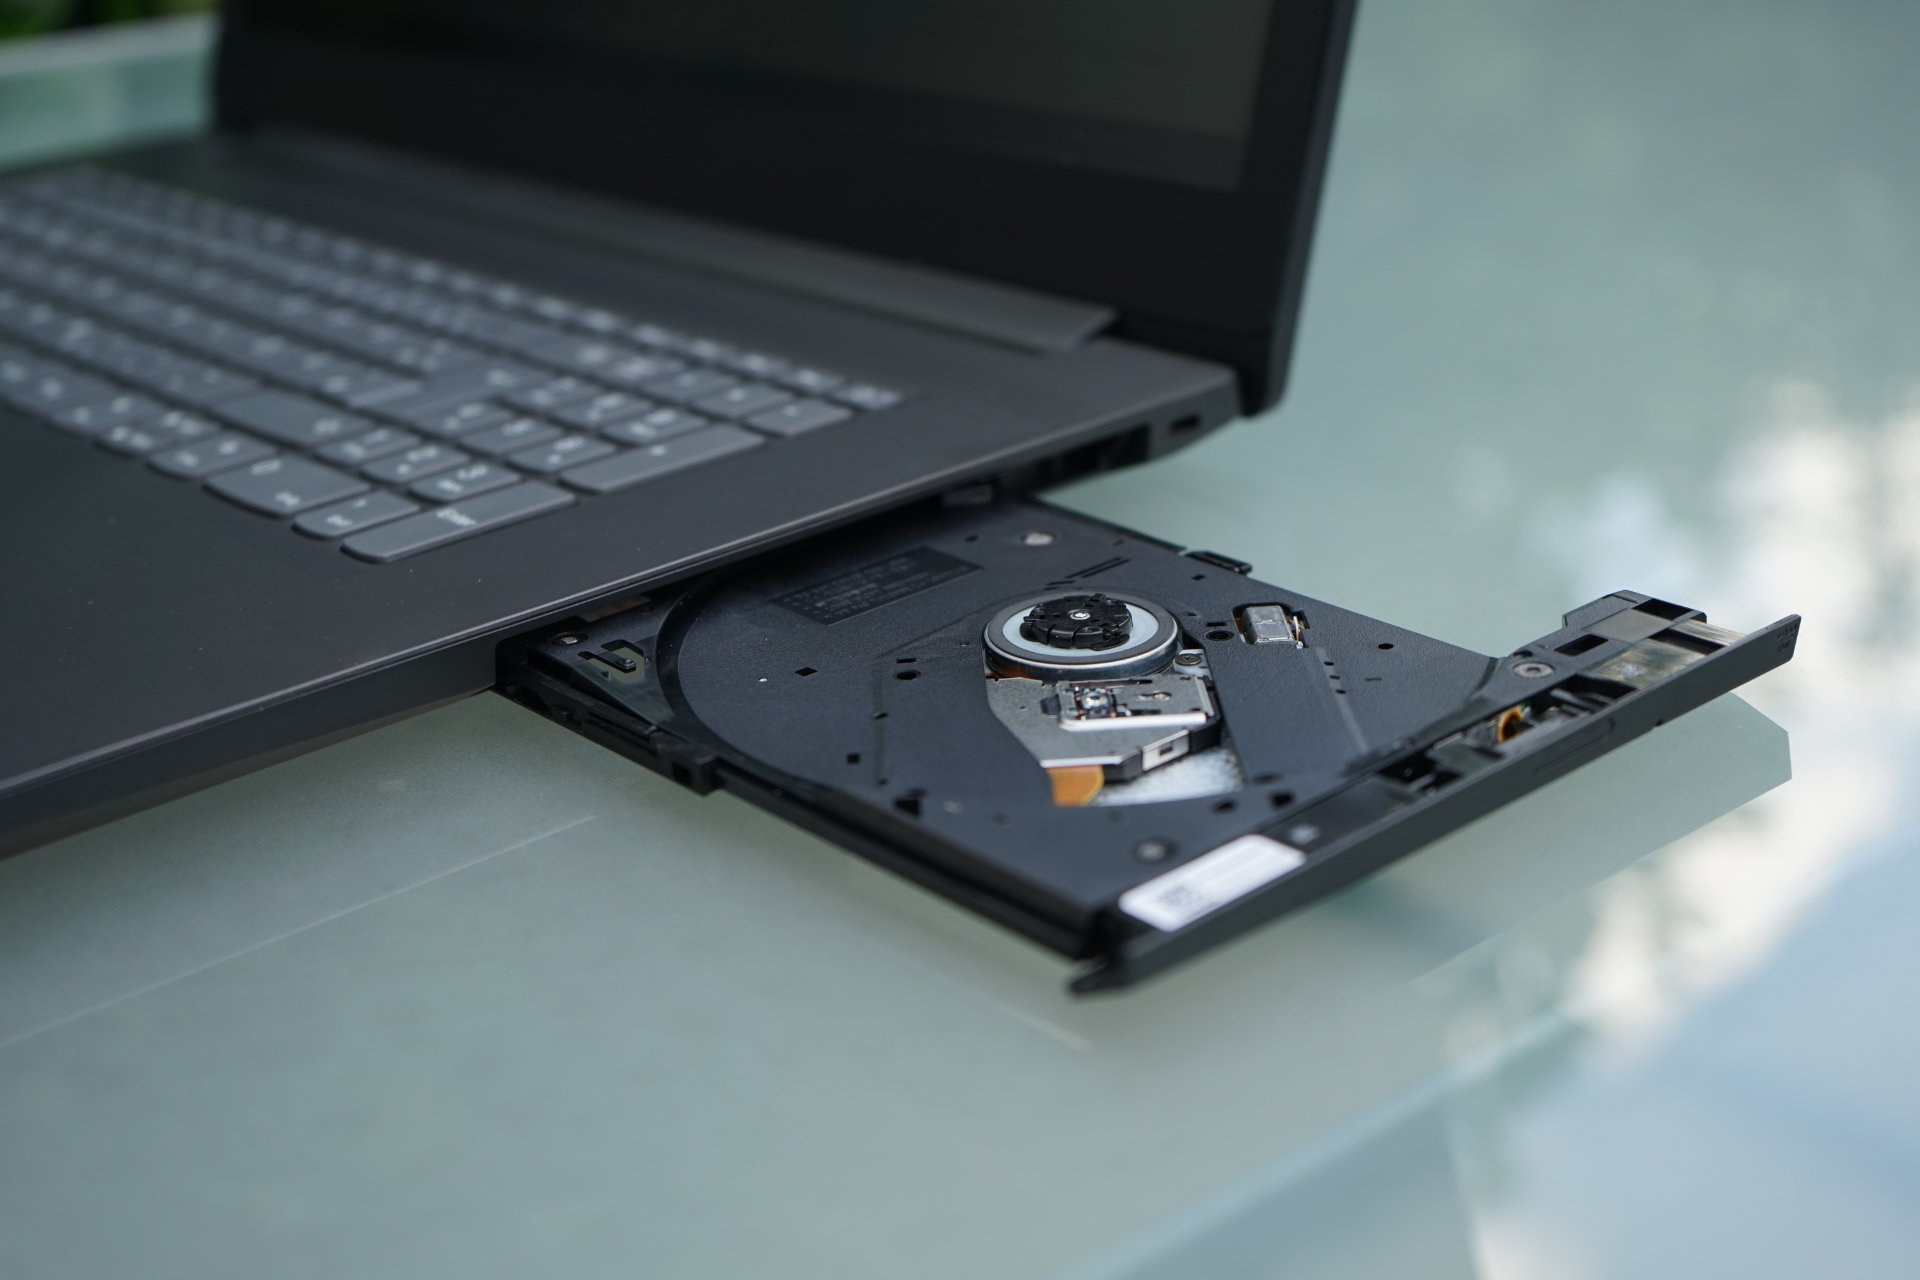
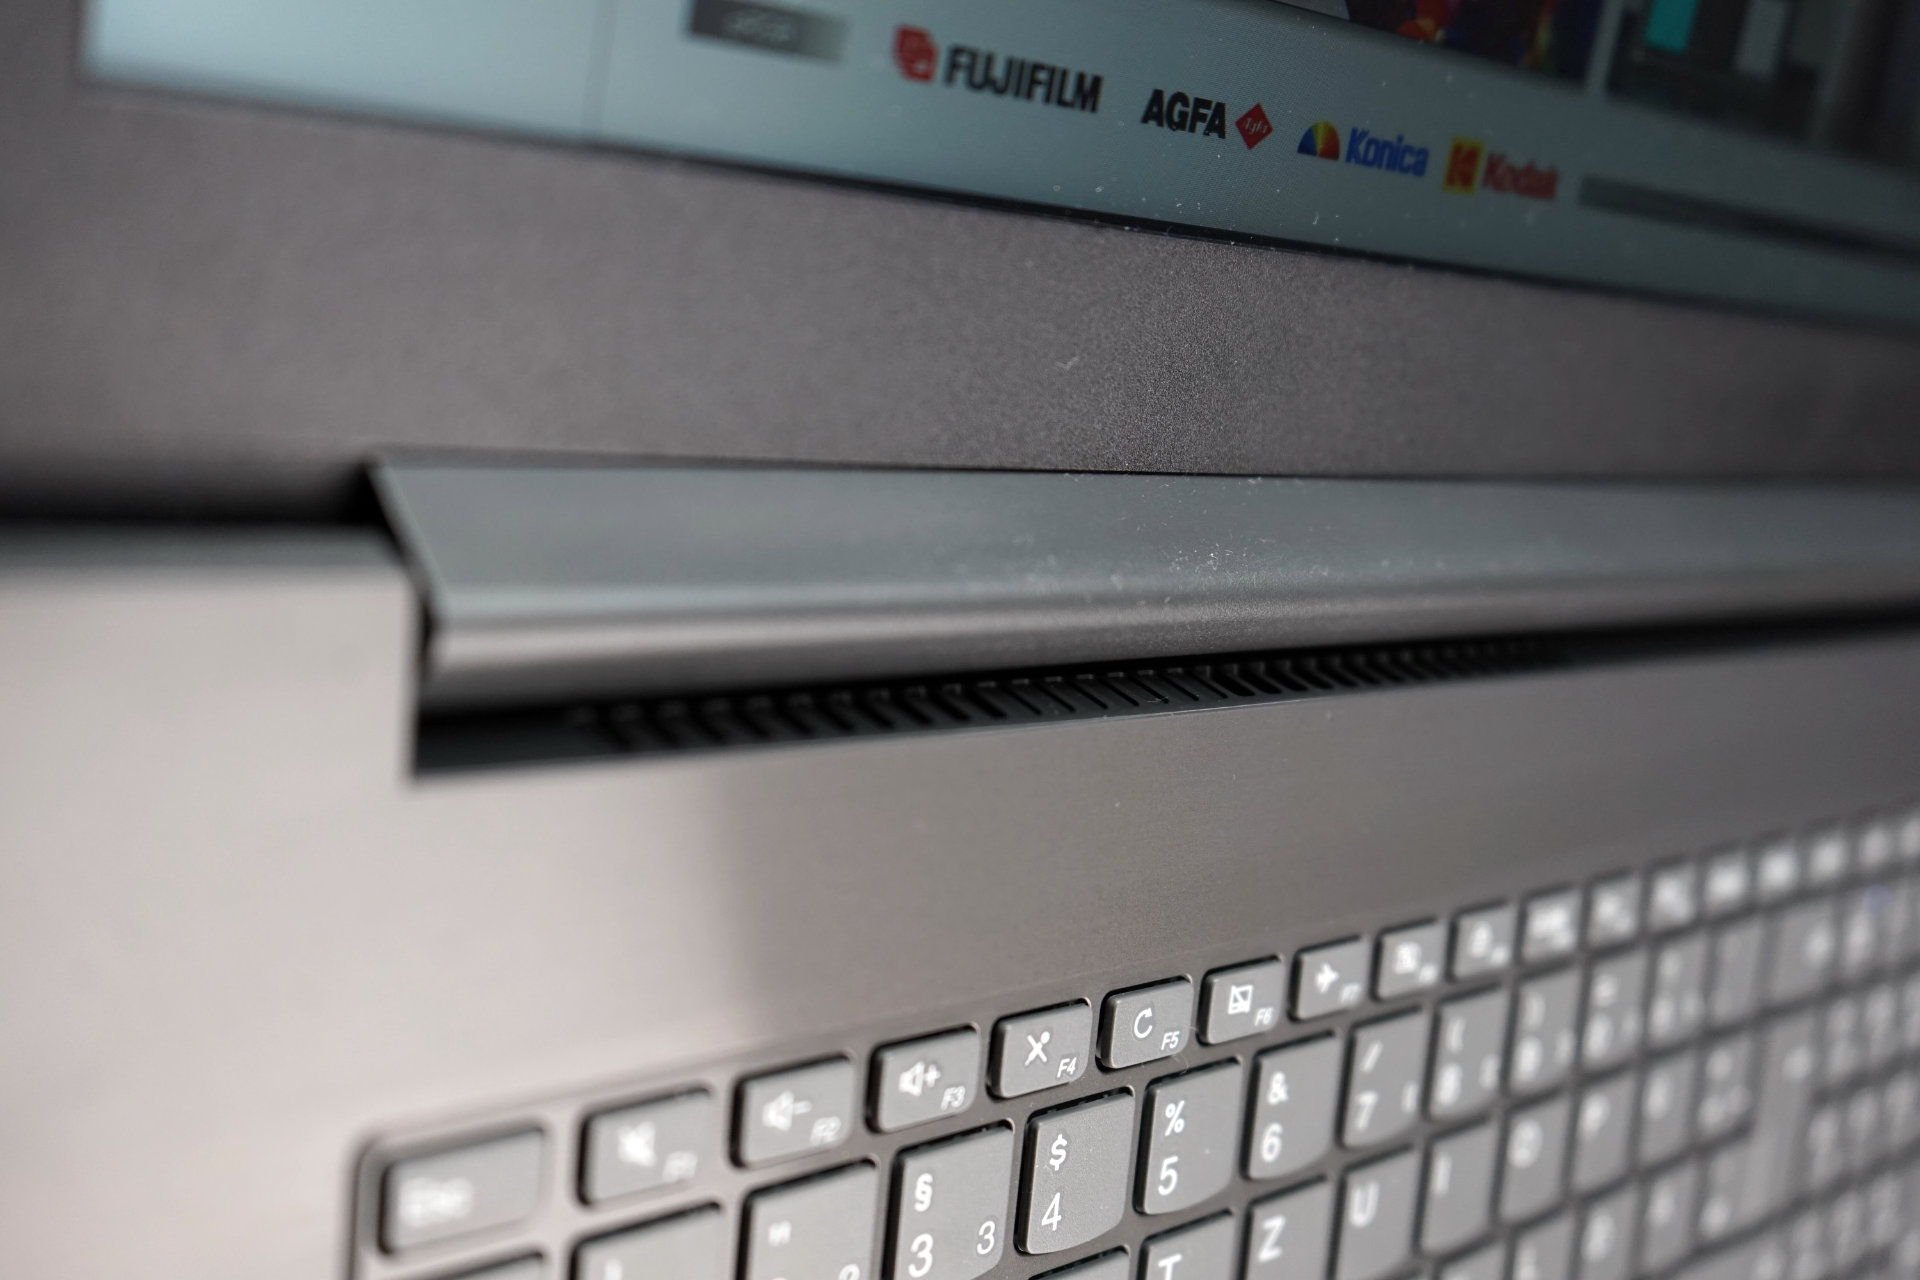
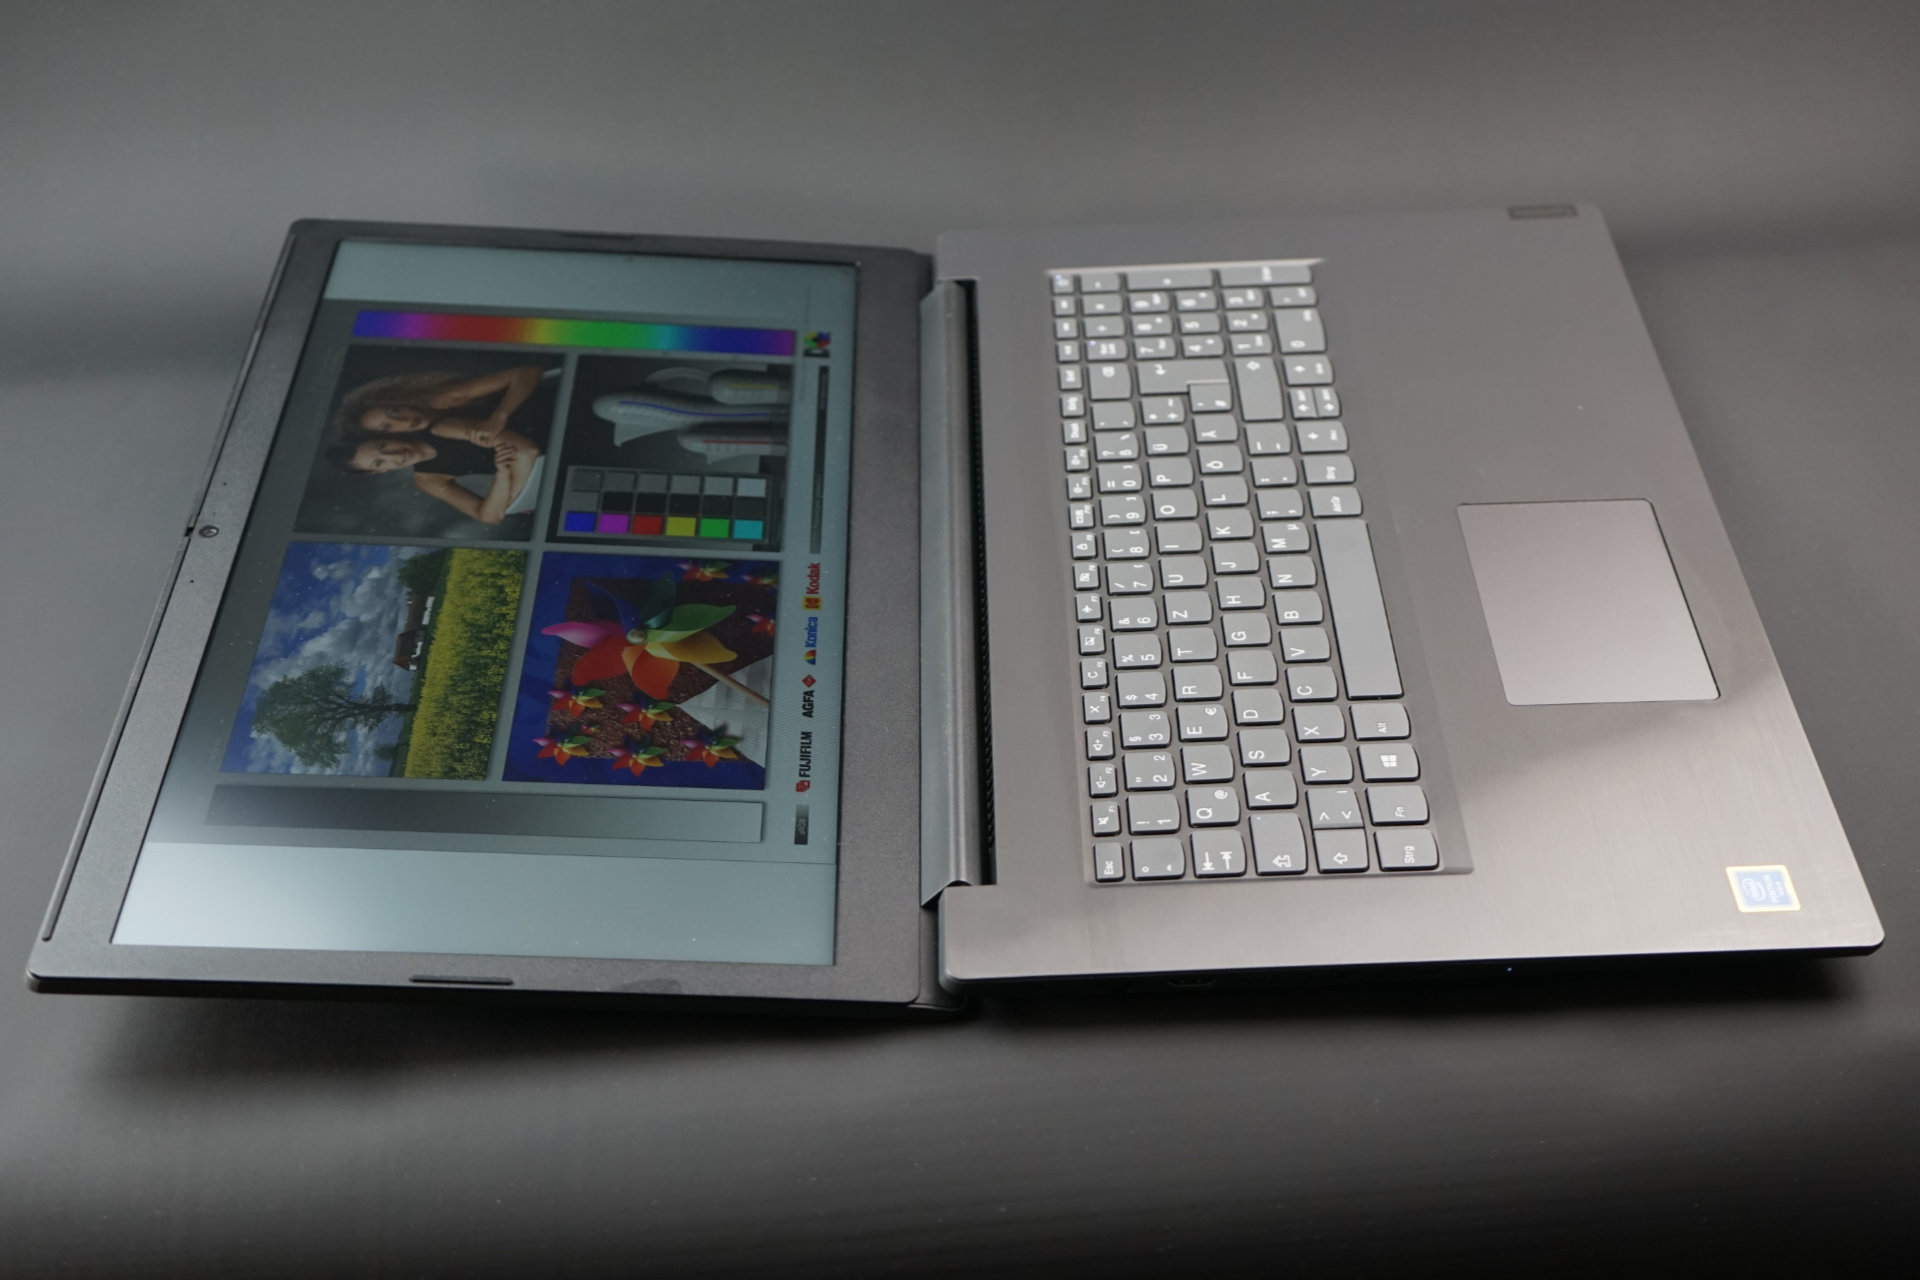
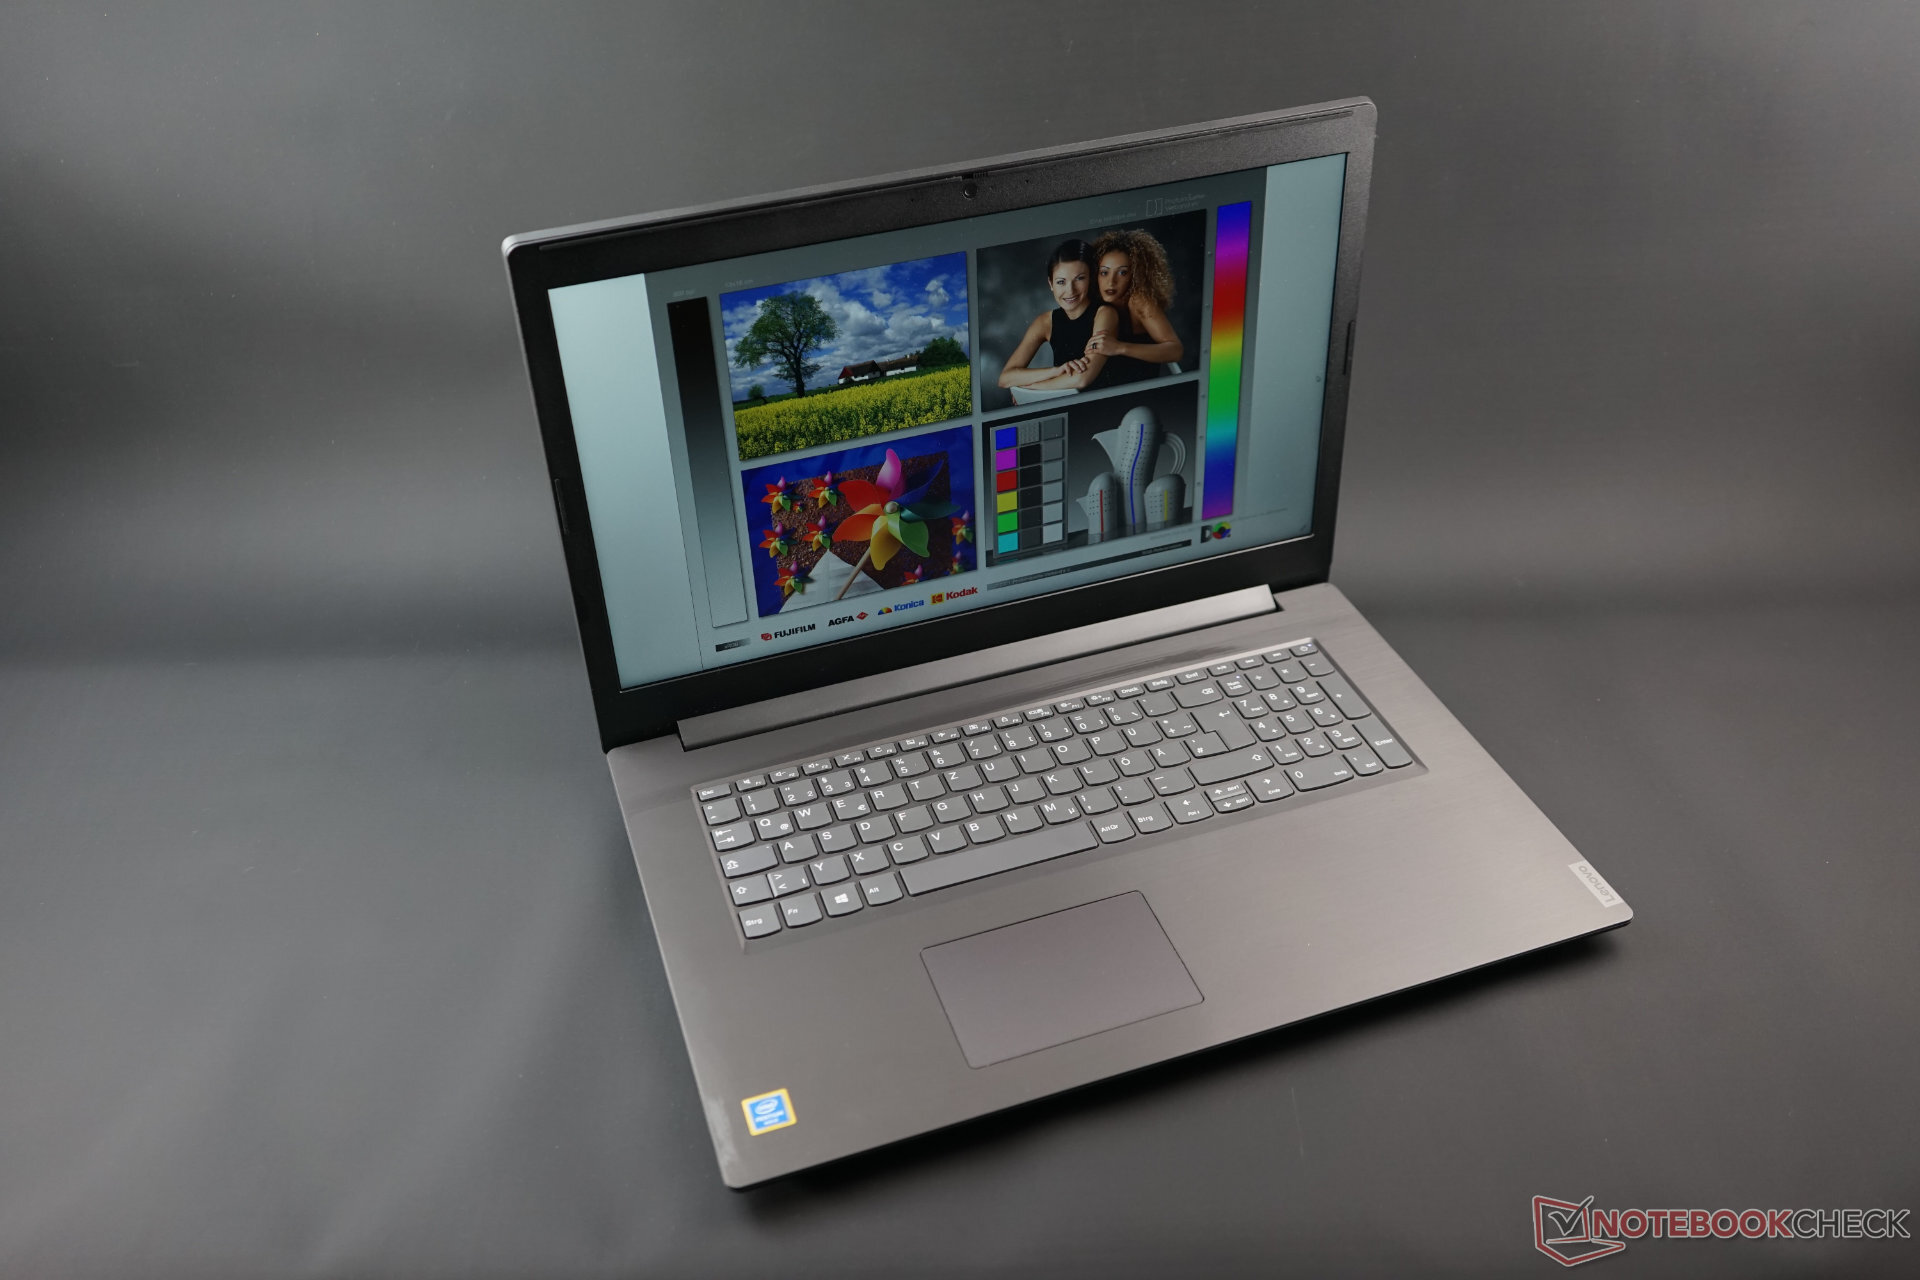
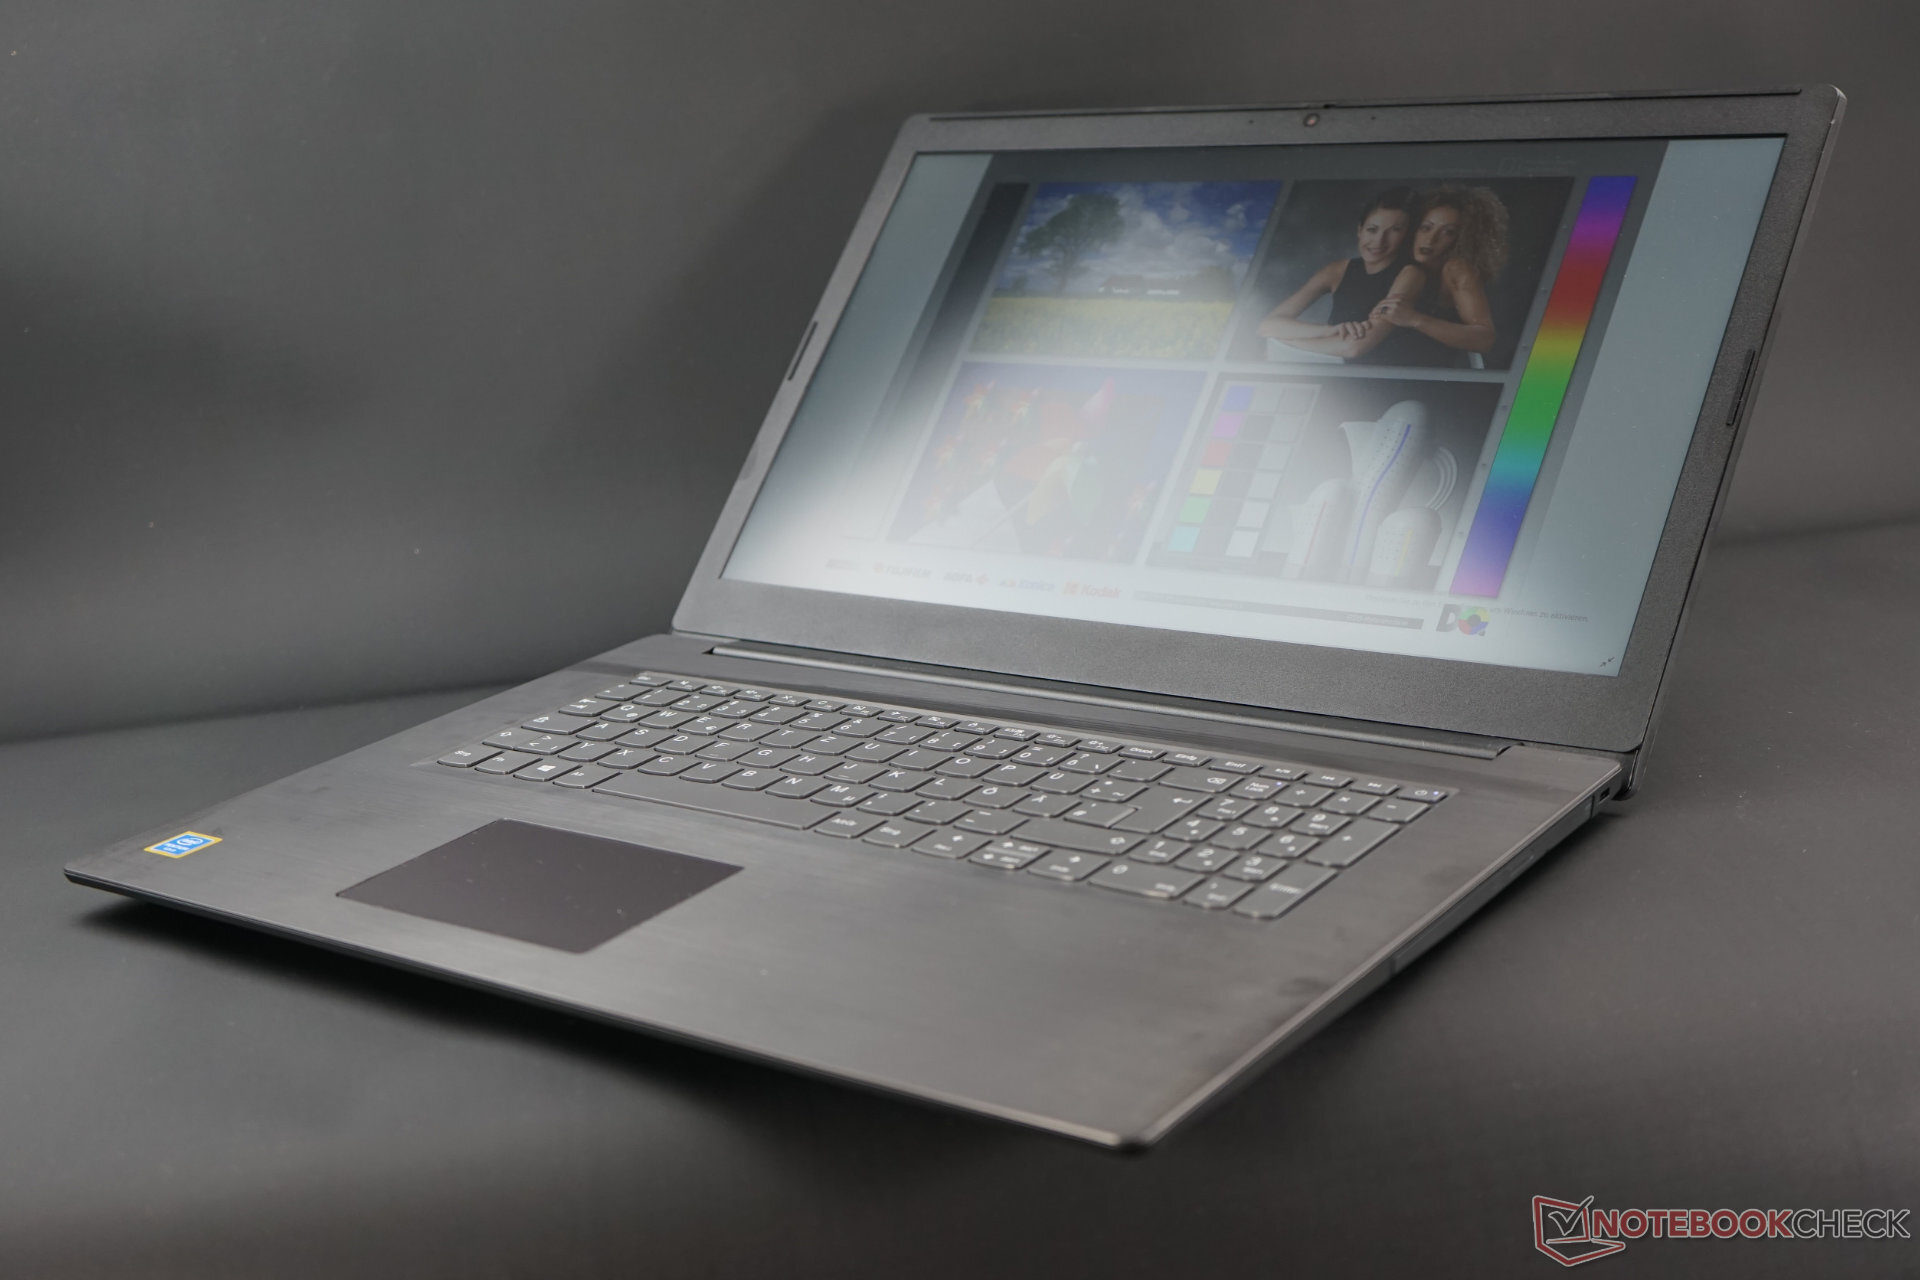
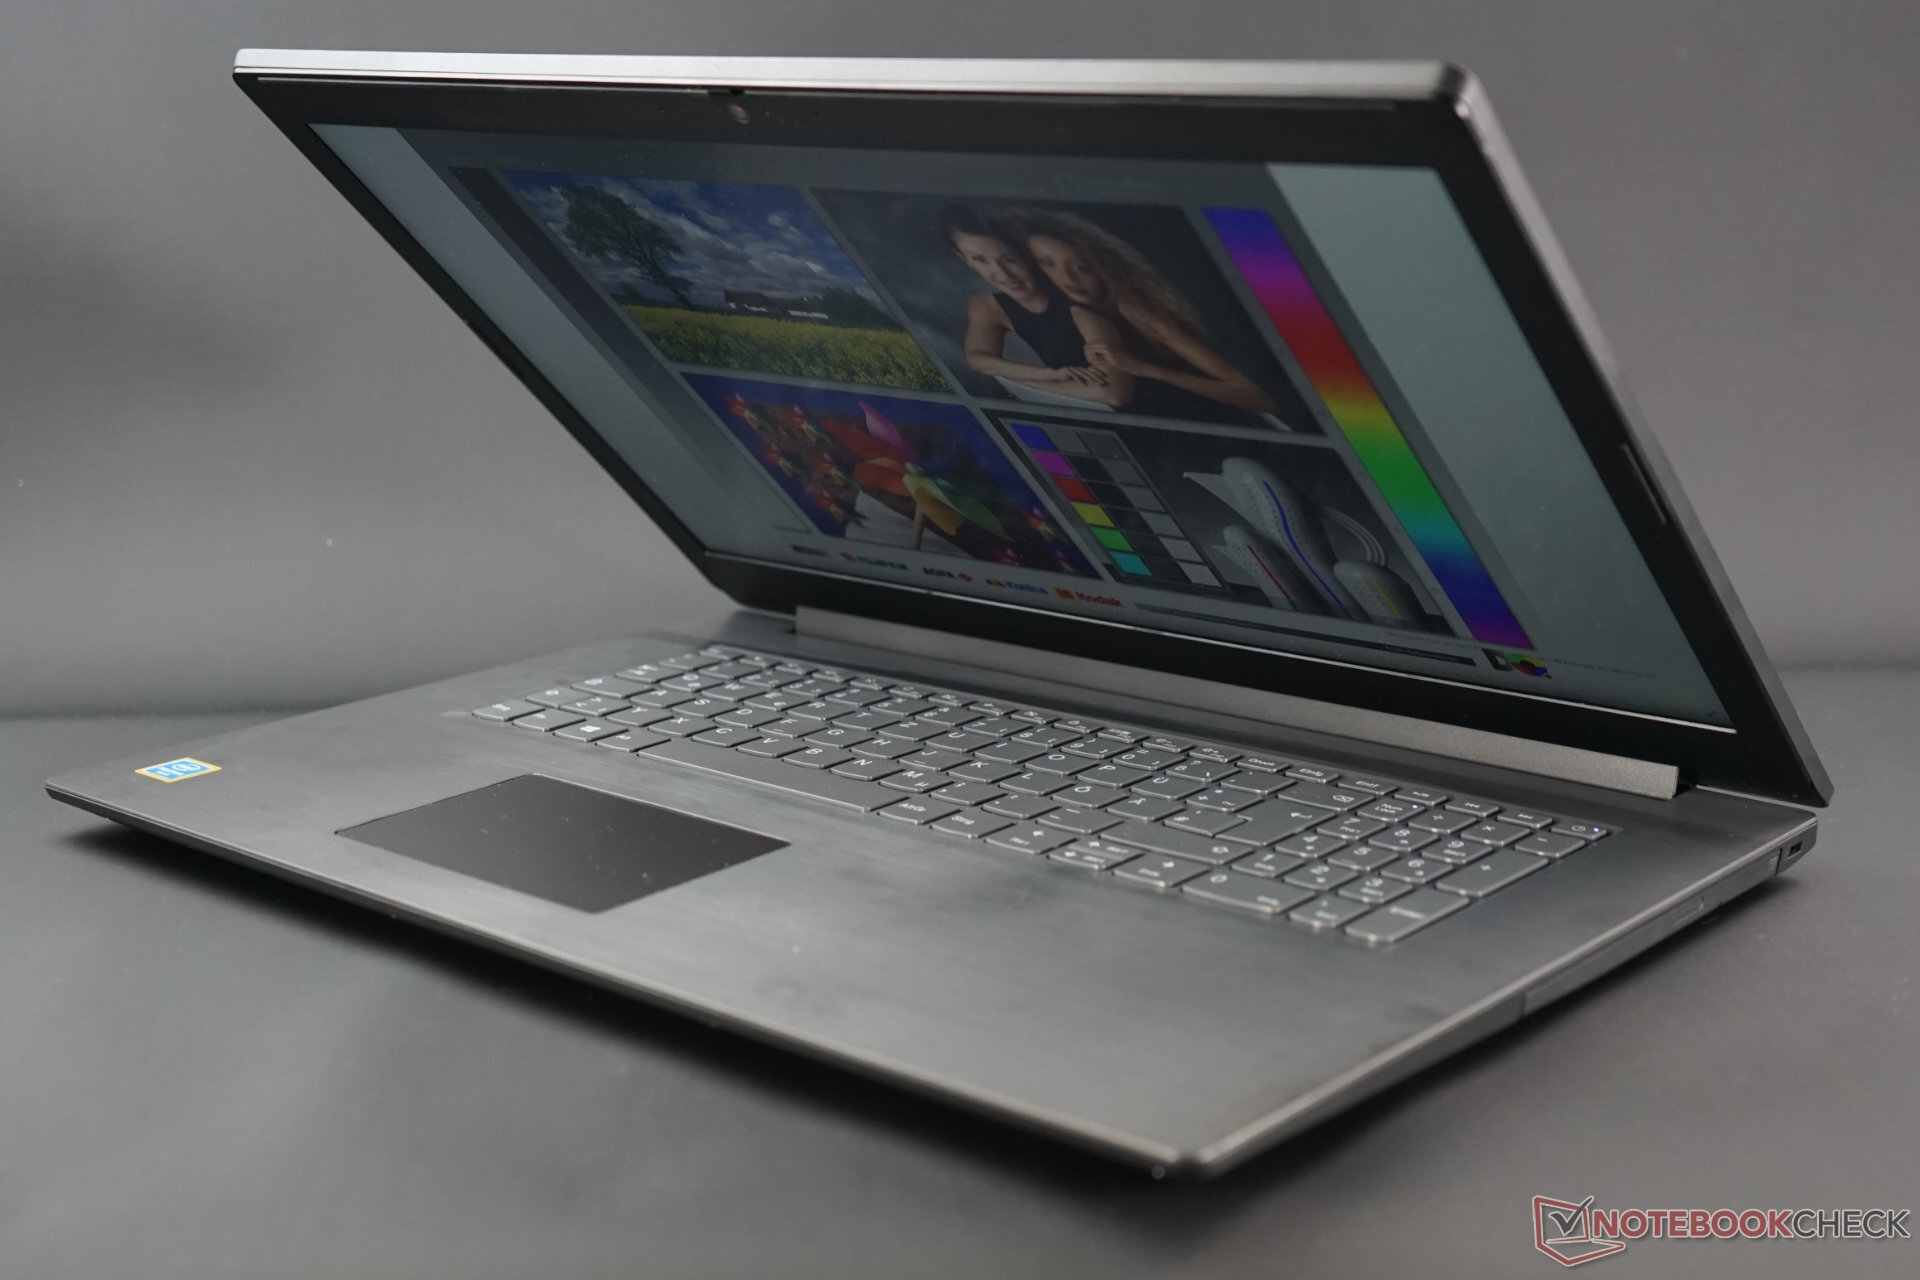
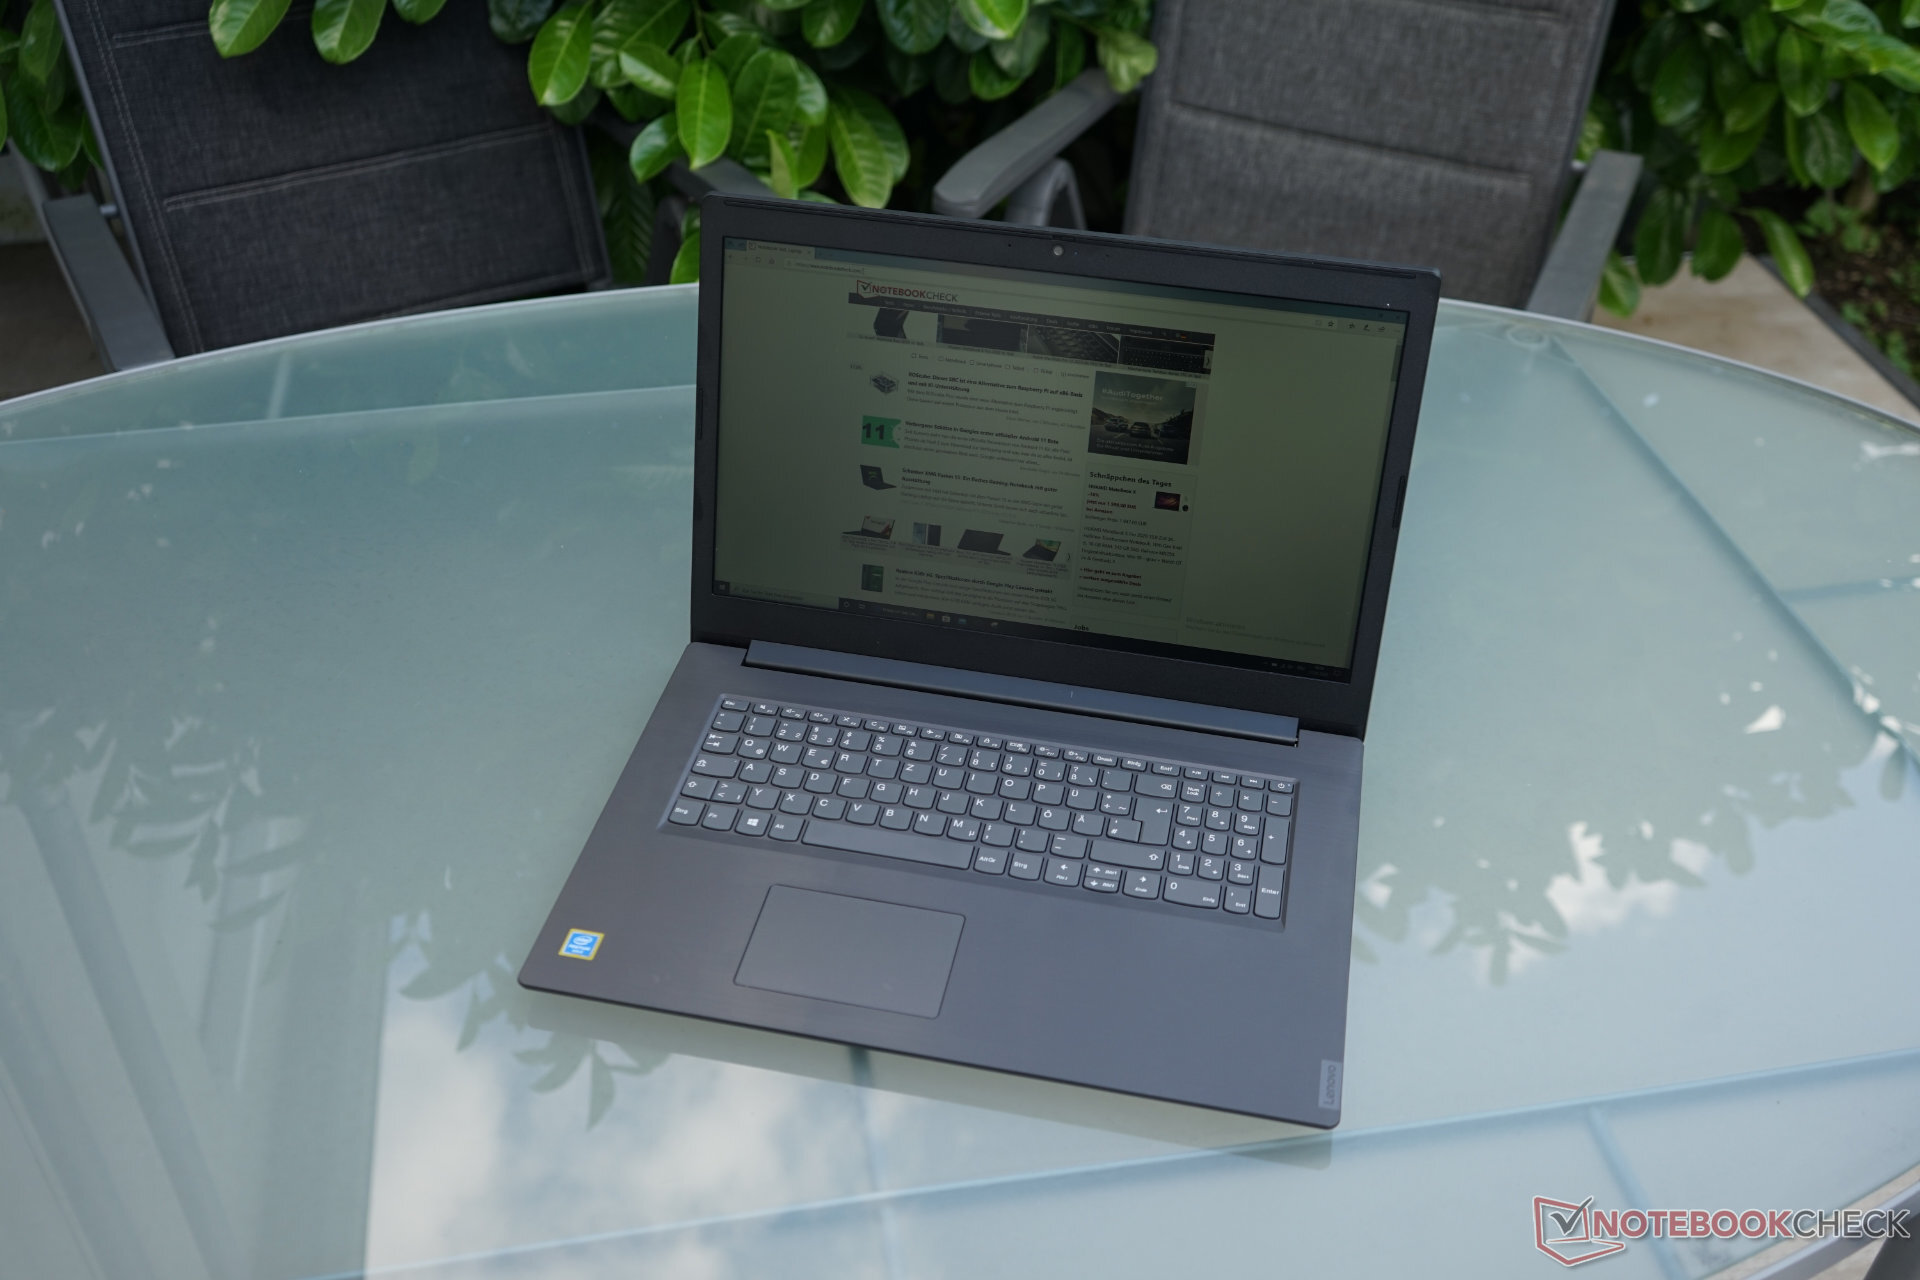
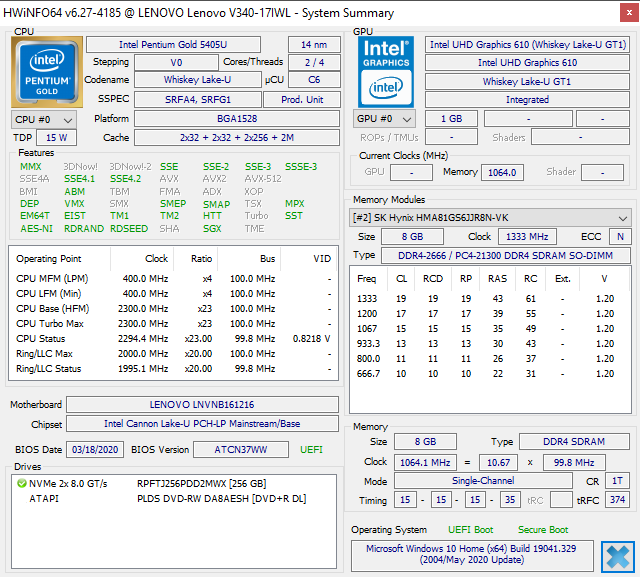
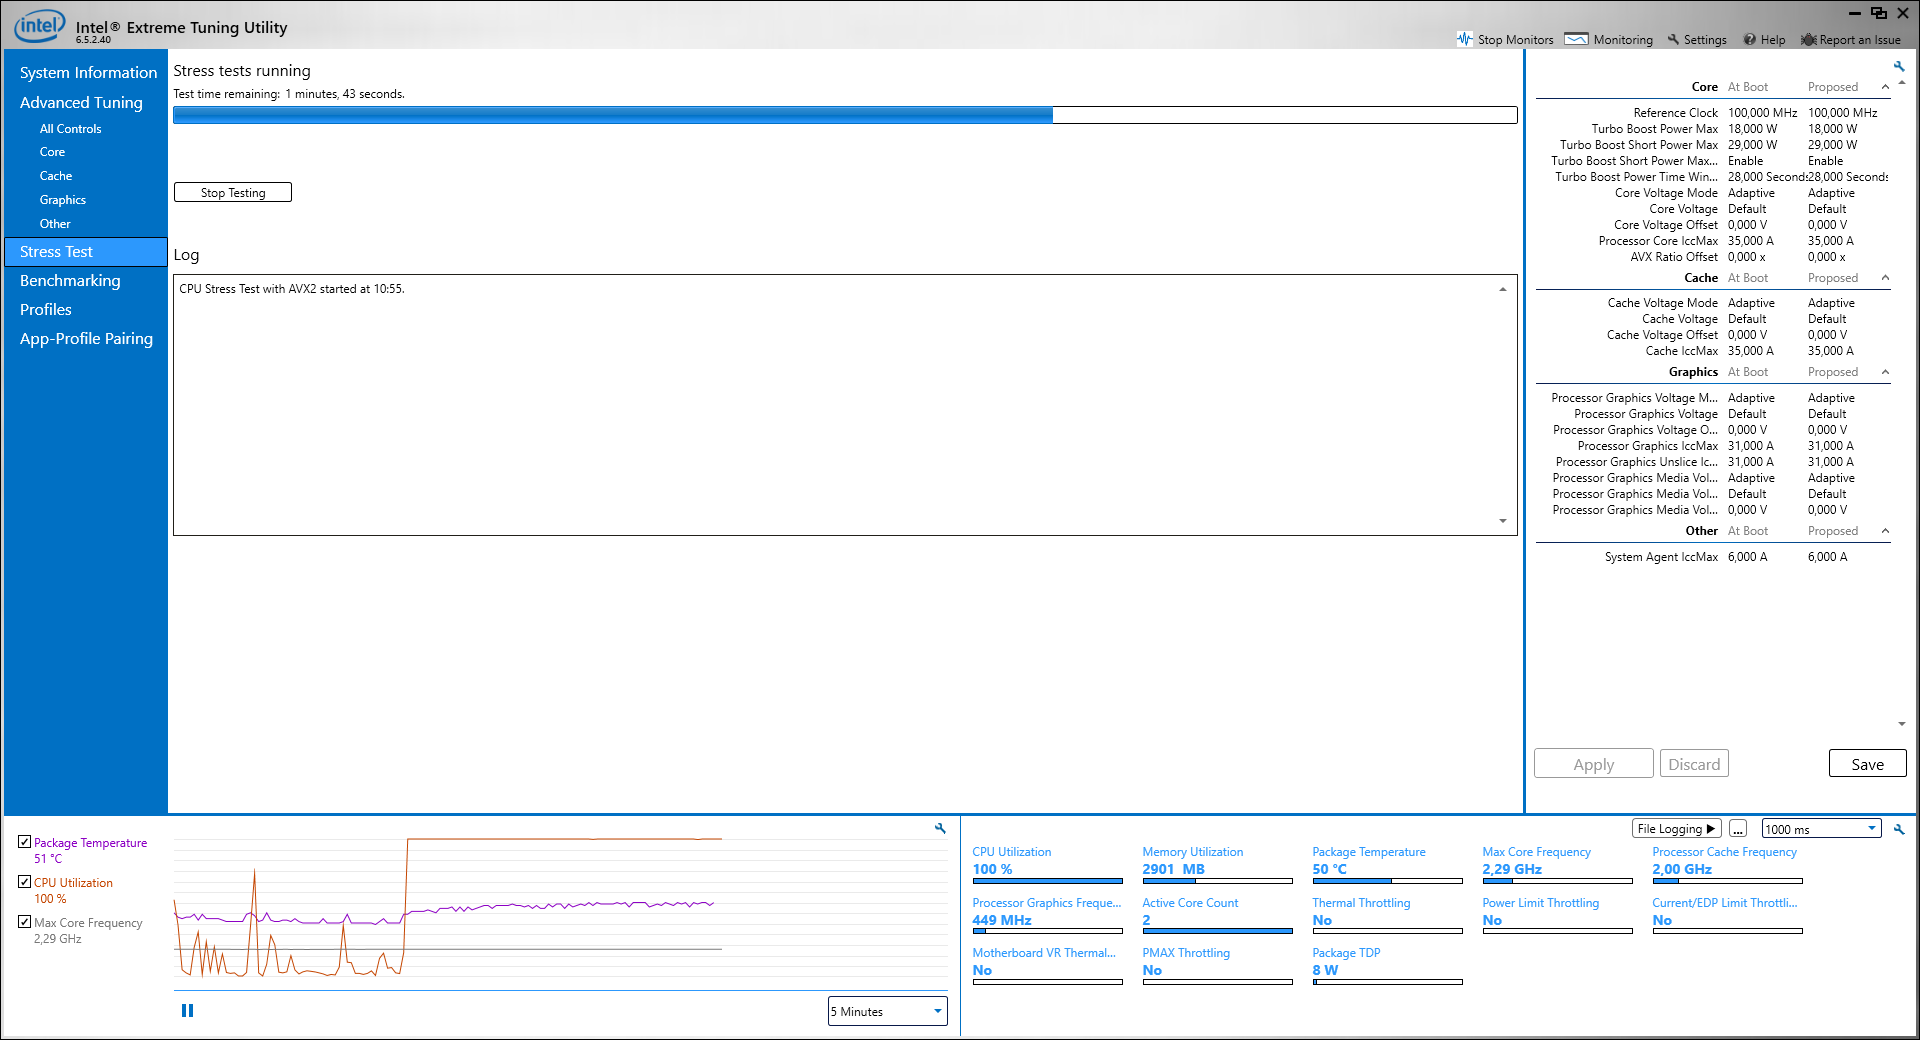
O Lenovo V340-17IWL 81RG001YGE é um portátil empresarial de nível básico barato com uma tela grande de 17 polegadas. A boa tela do IPS e o SSD relativamente rápido fazem dele uma opção de nível de entrada razoável para usuários pouco exigentes. Como o Pentium Gold 5405U possui apenas dois núcleos e não oferece Turbo Boost, fica para trás significativamente em comparação com as CPUs Core i3 e i5 Whiskey Lake mais rápidas, quando se trata de pontuações em benchmarks. Por sua vez, o SoC mostra muito pouco desenvolvimento de calor, o que resulta em níveis muito baixos de ruído e temperatura.
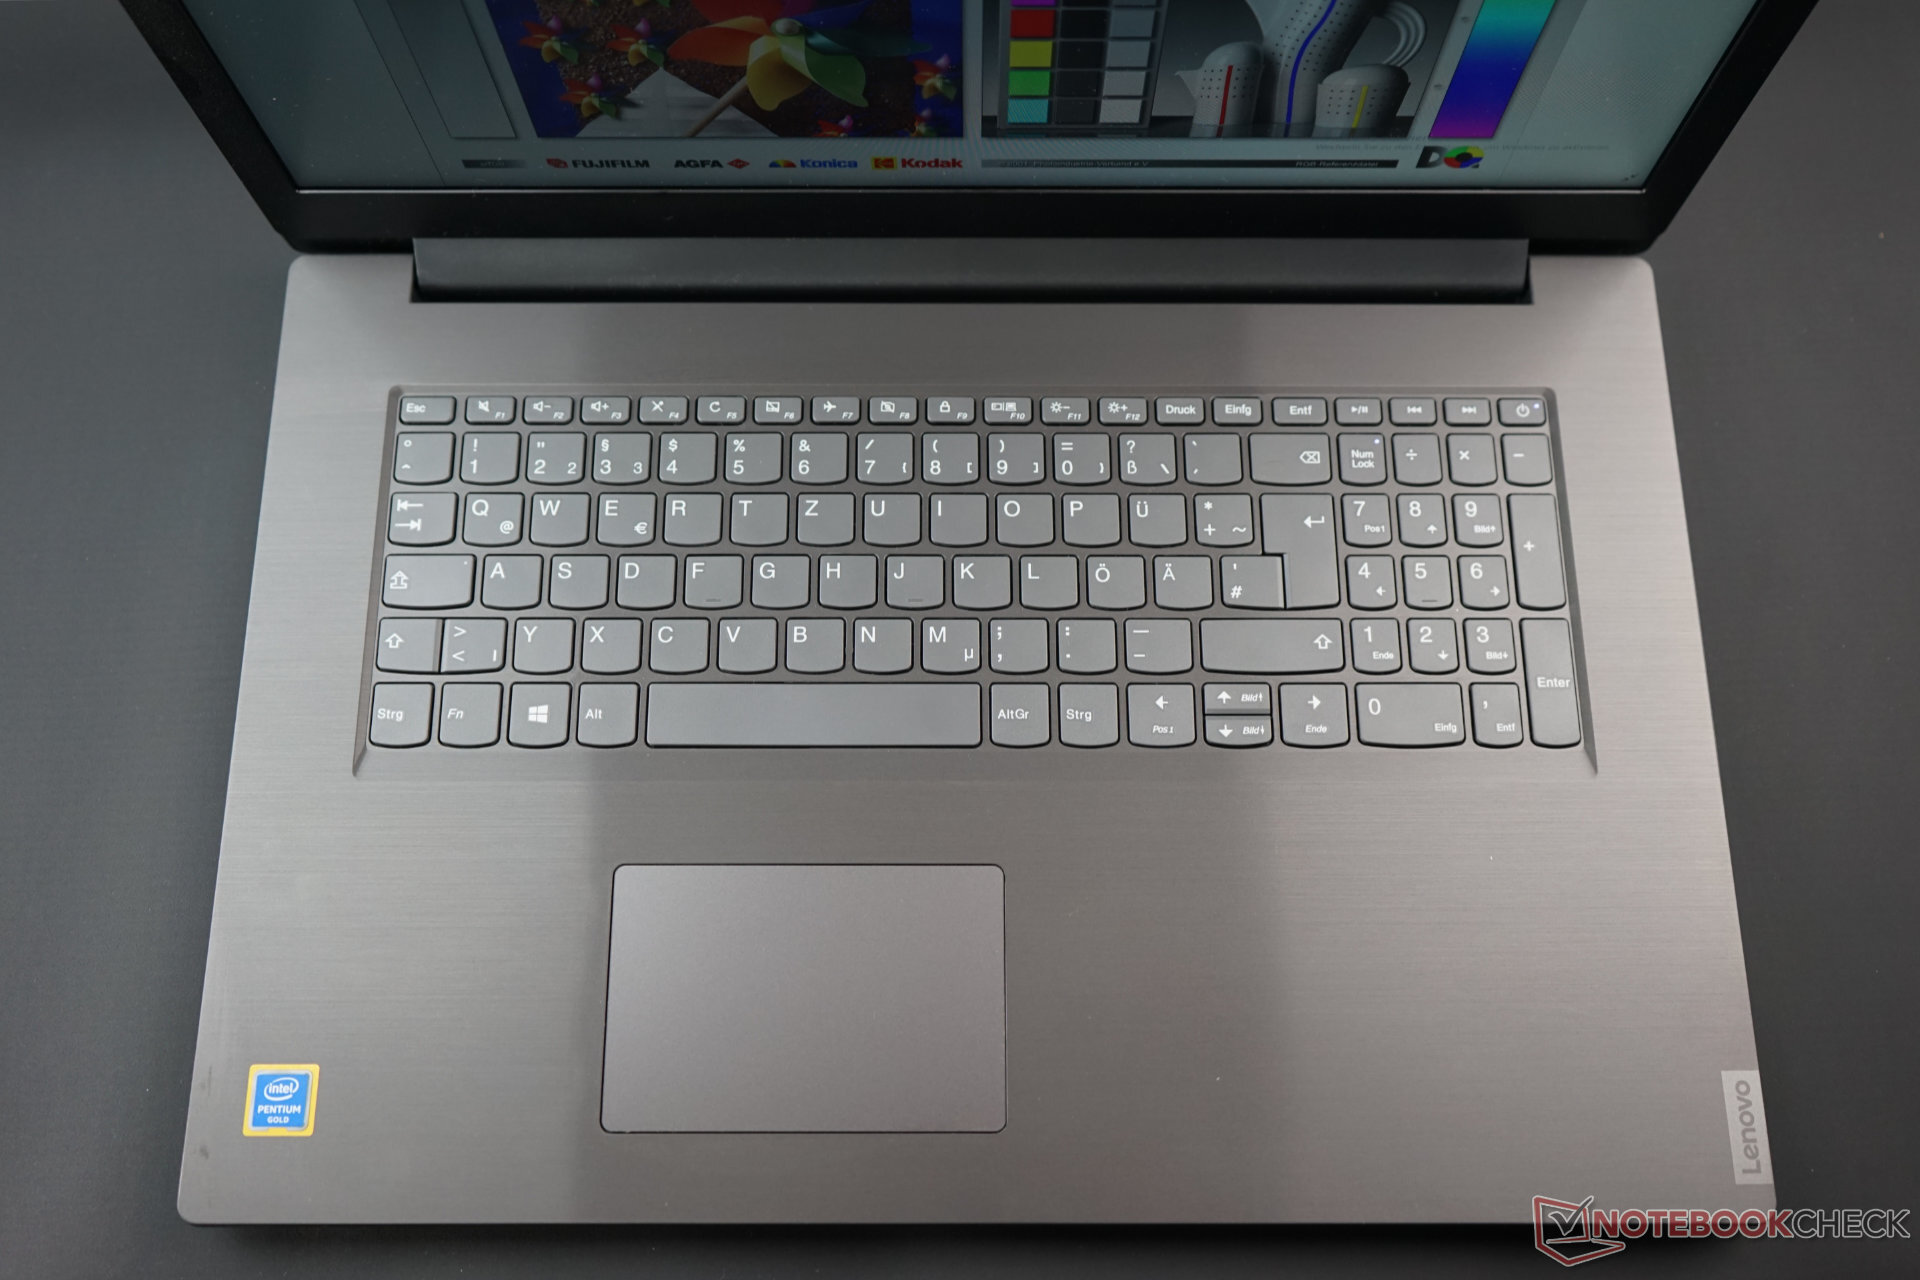
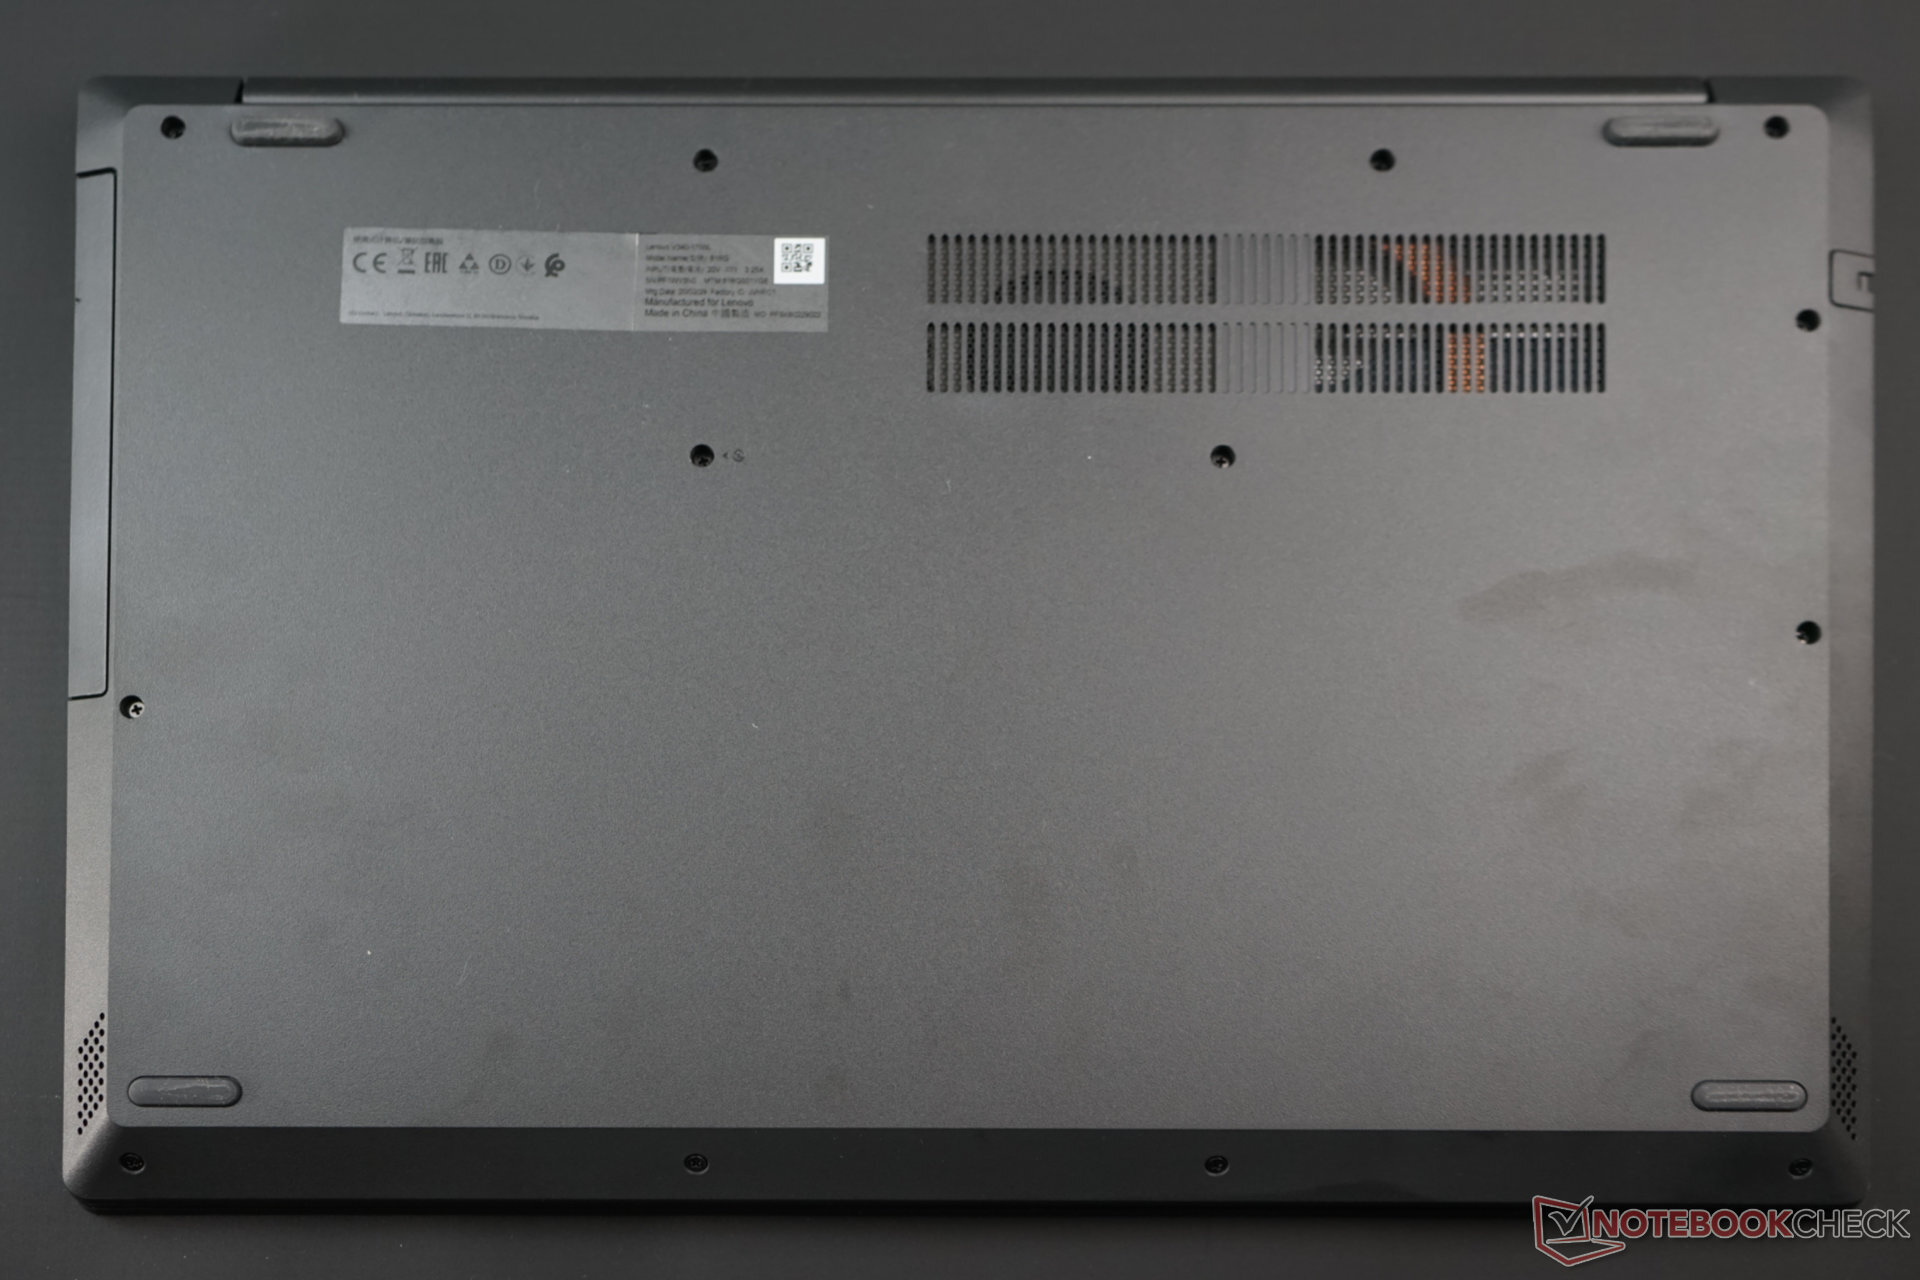
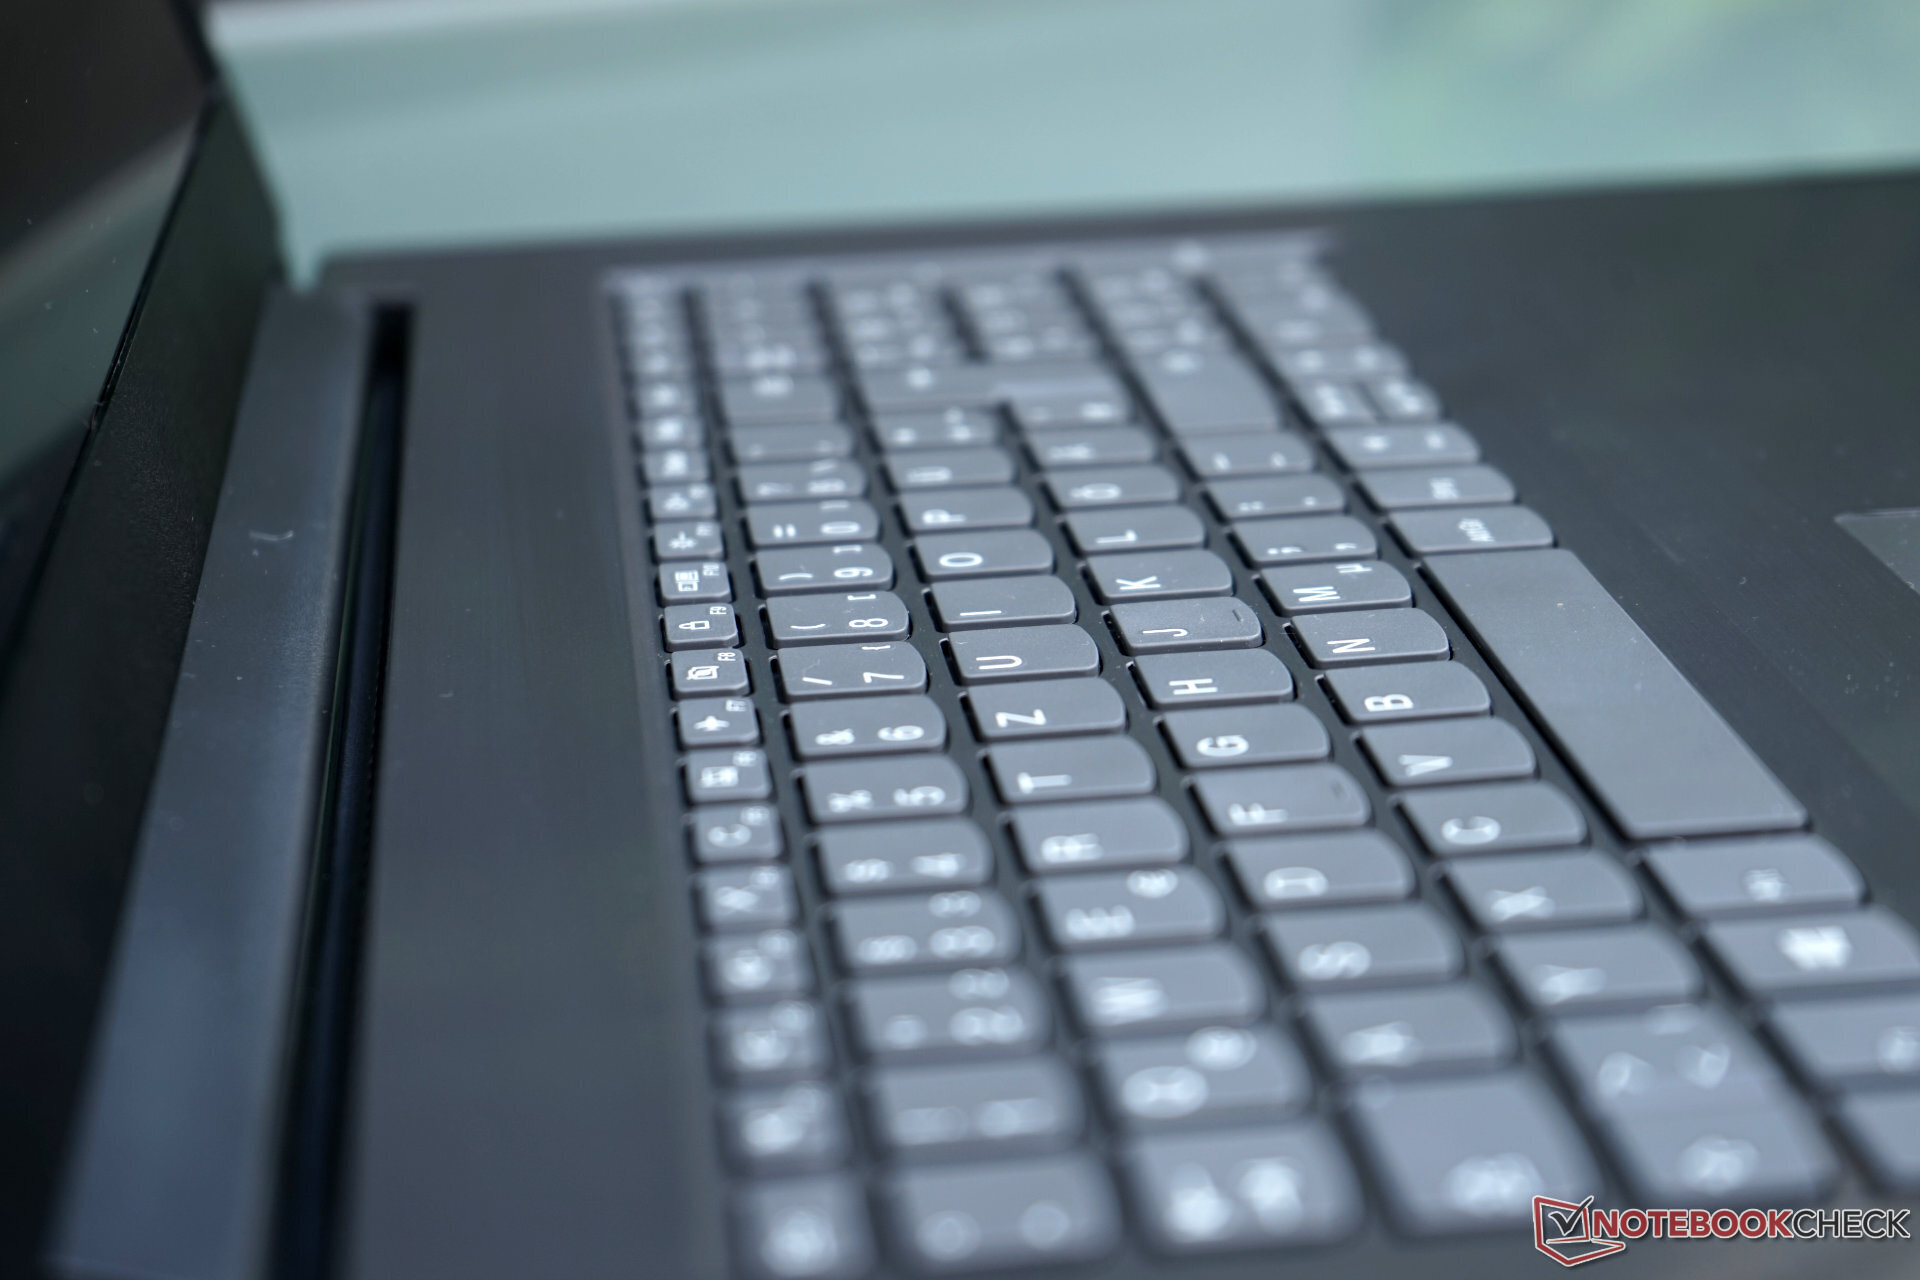
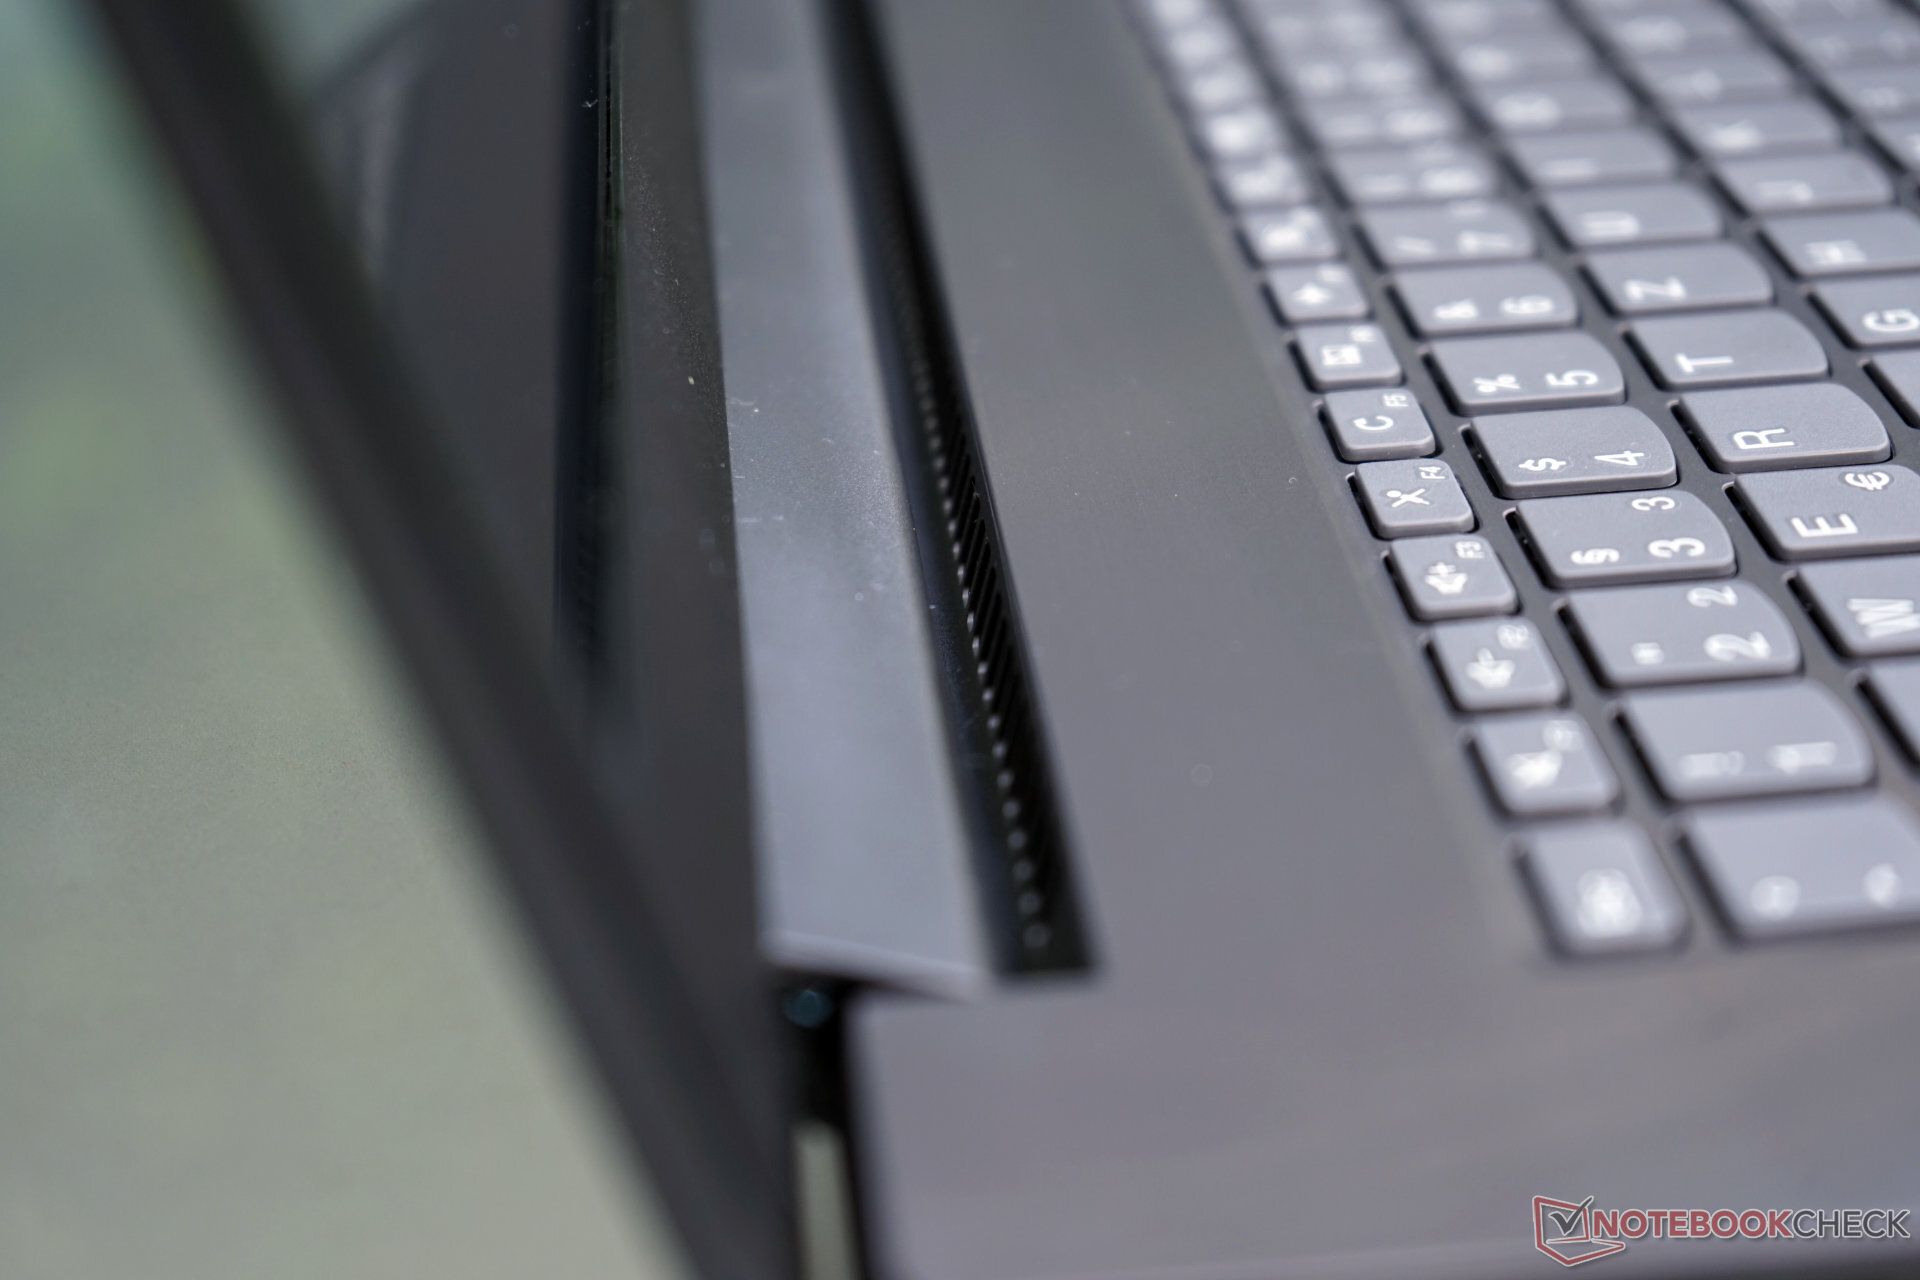
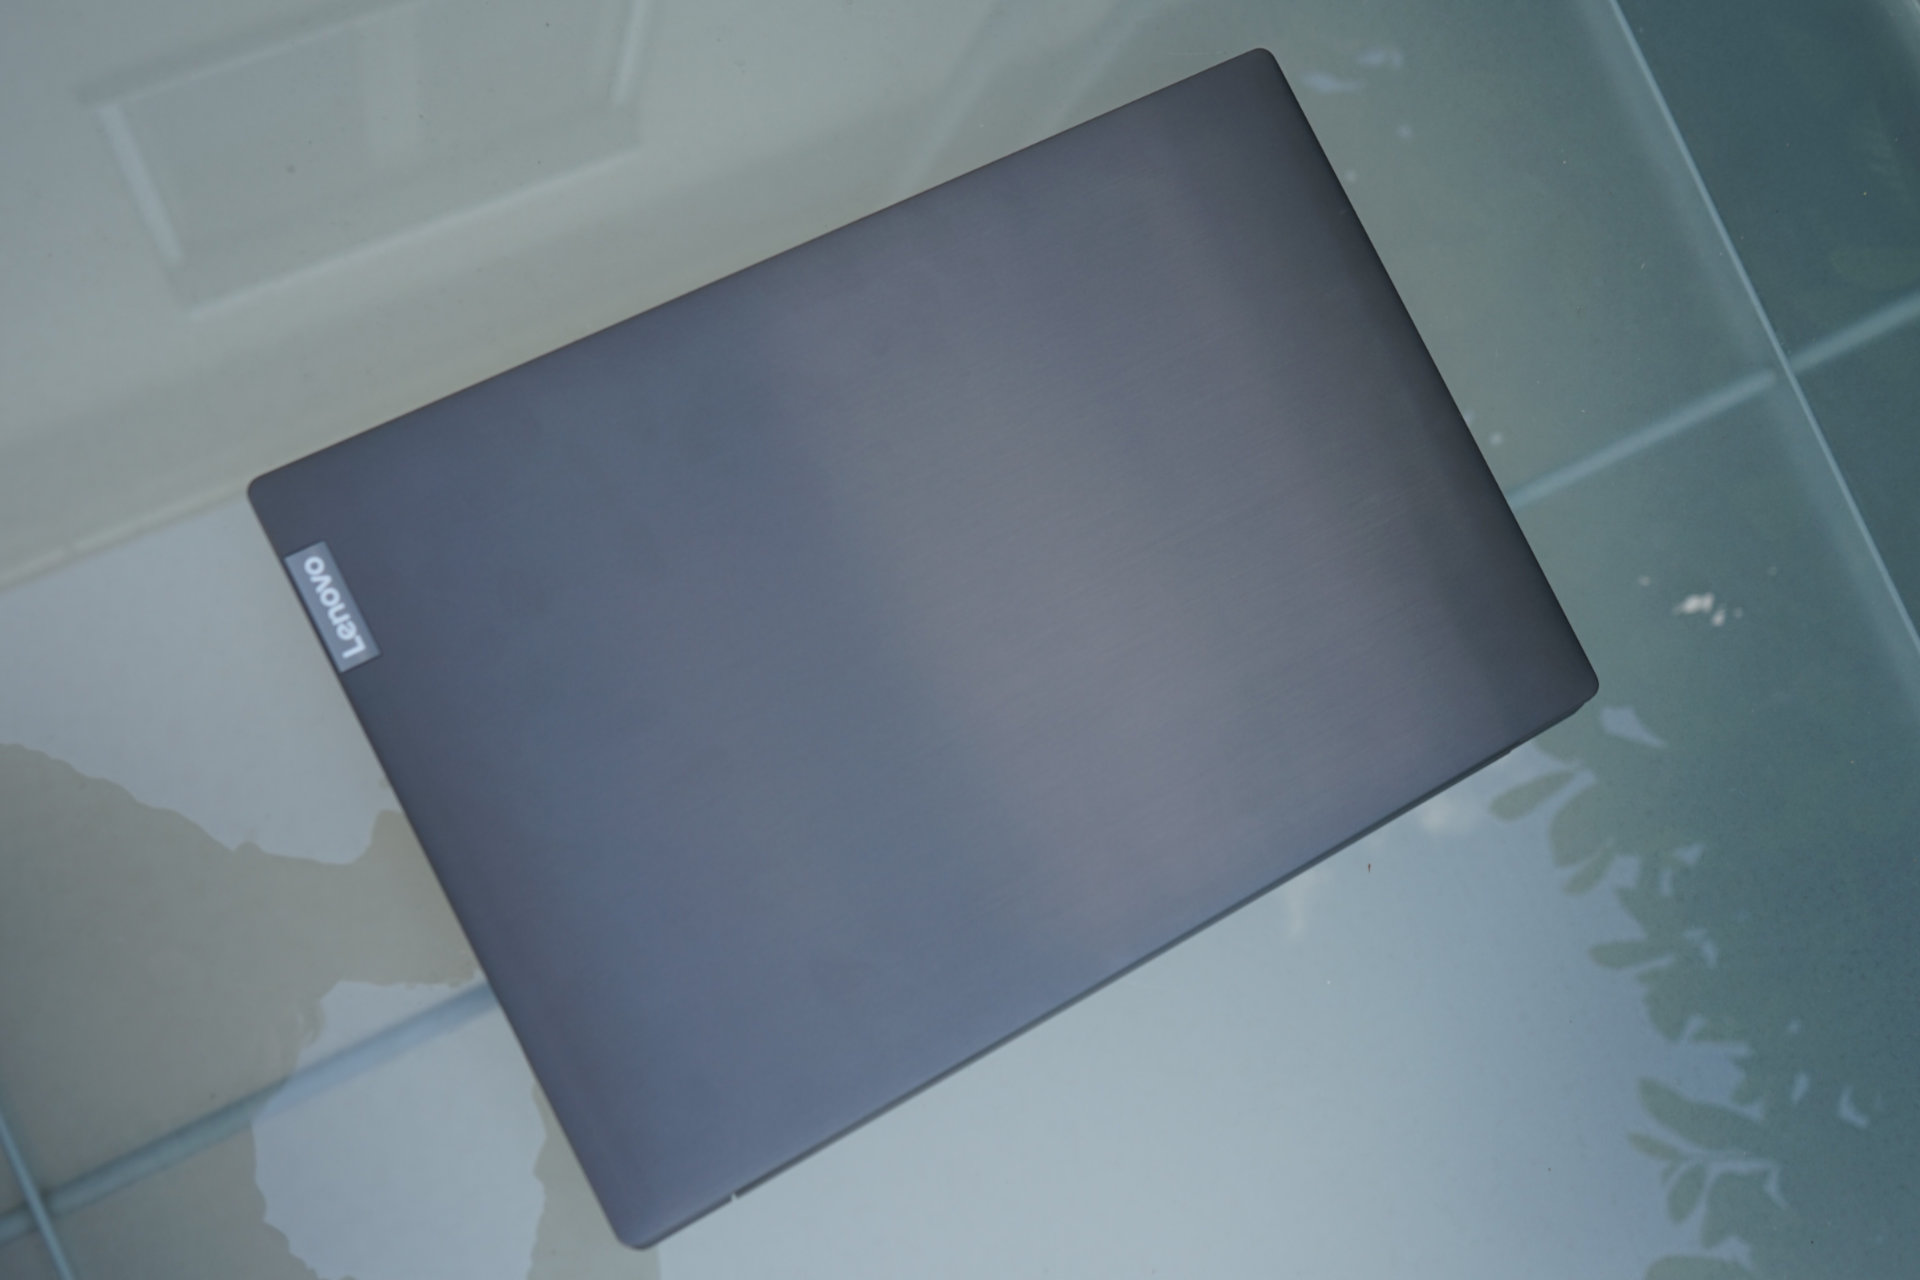
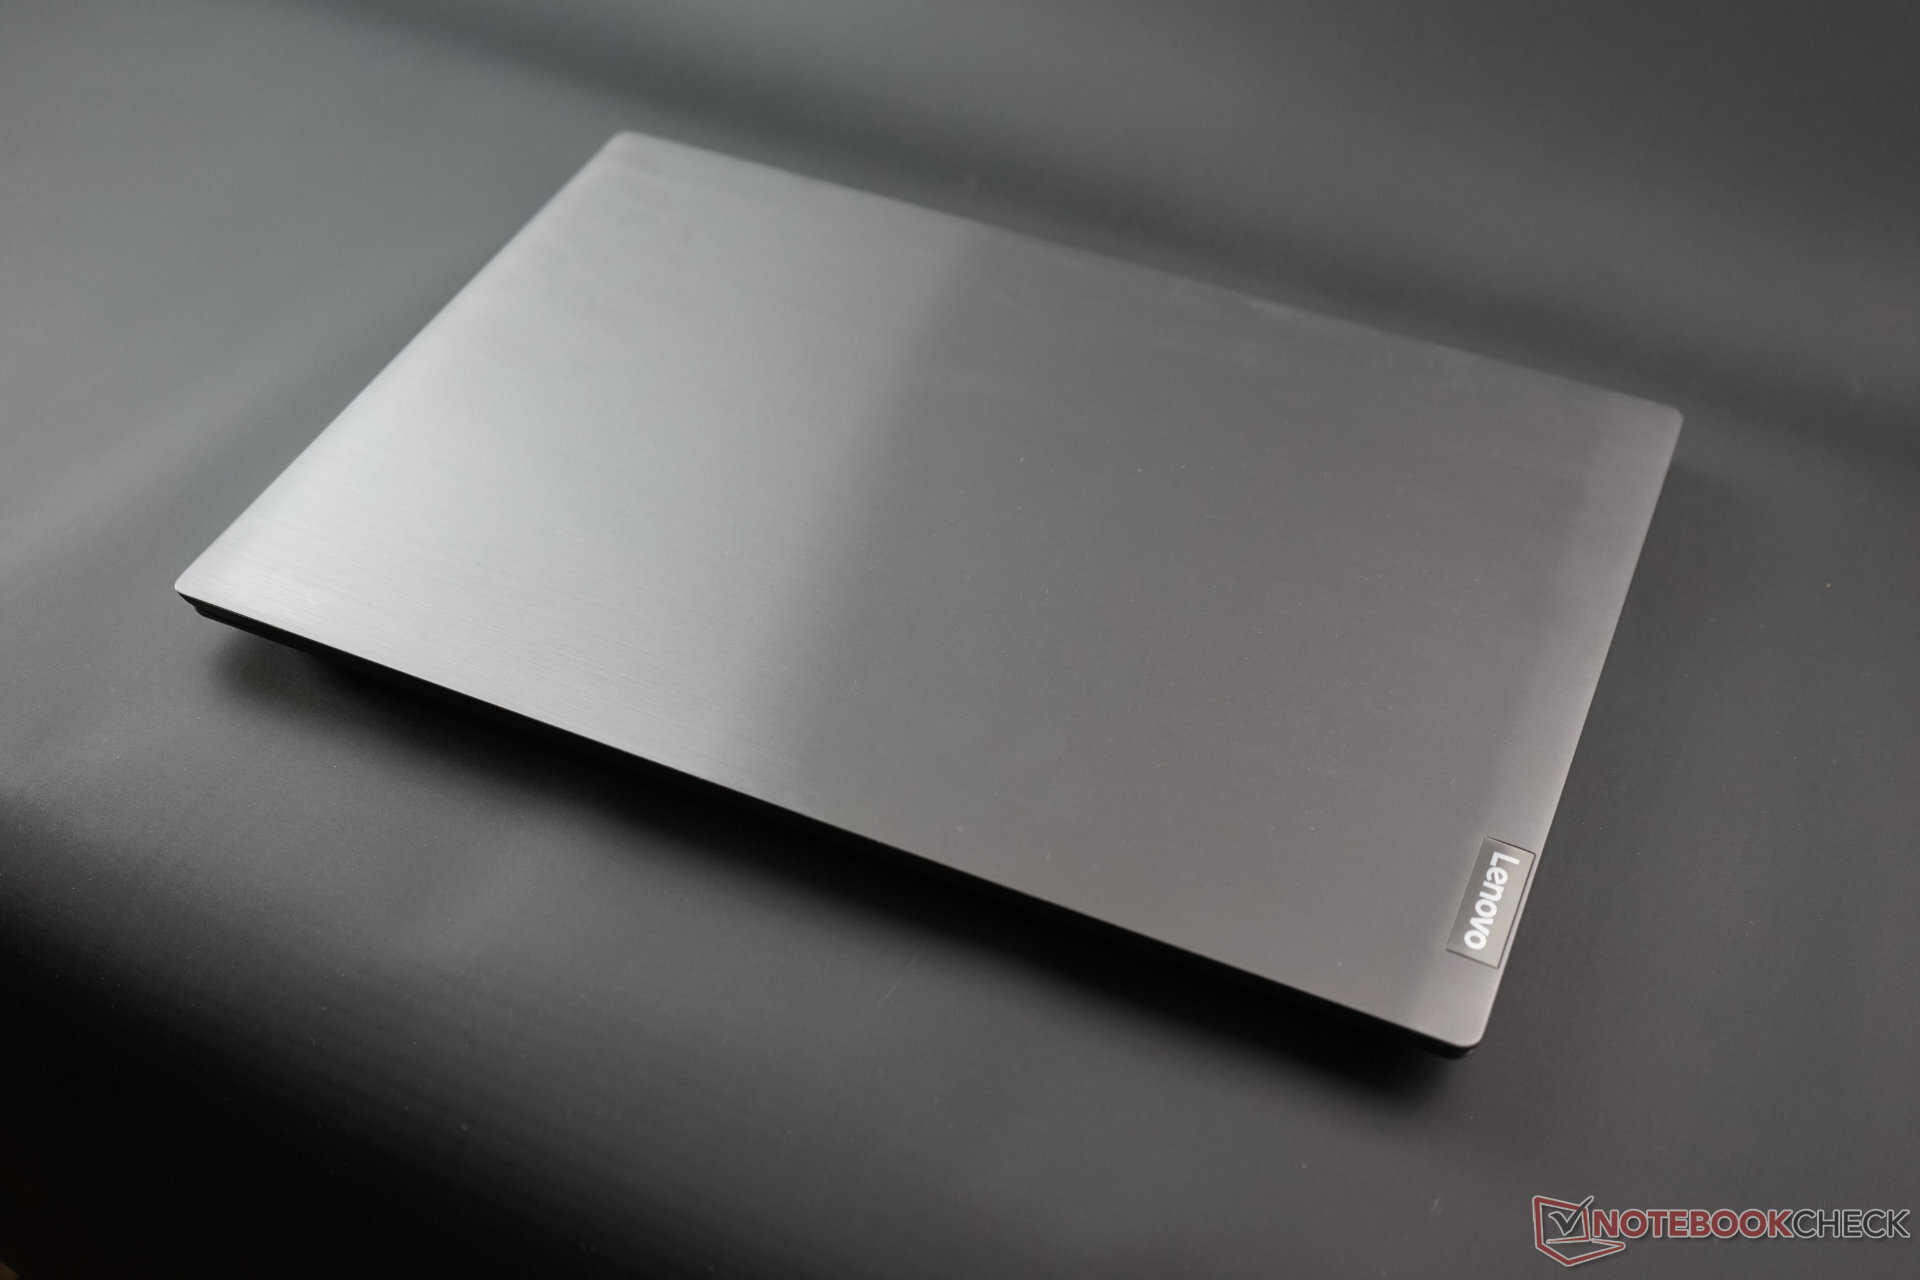
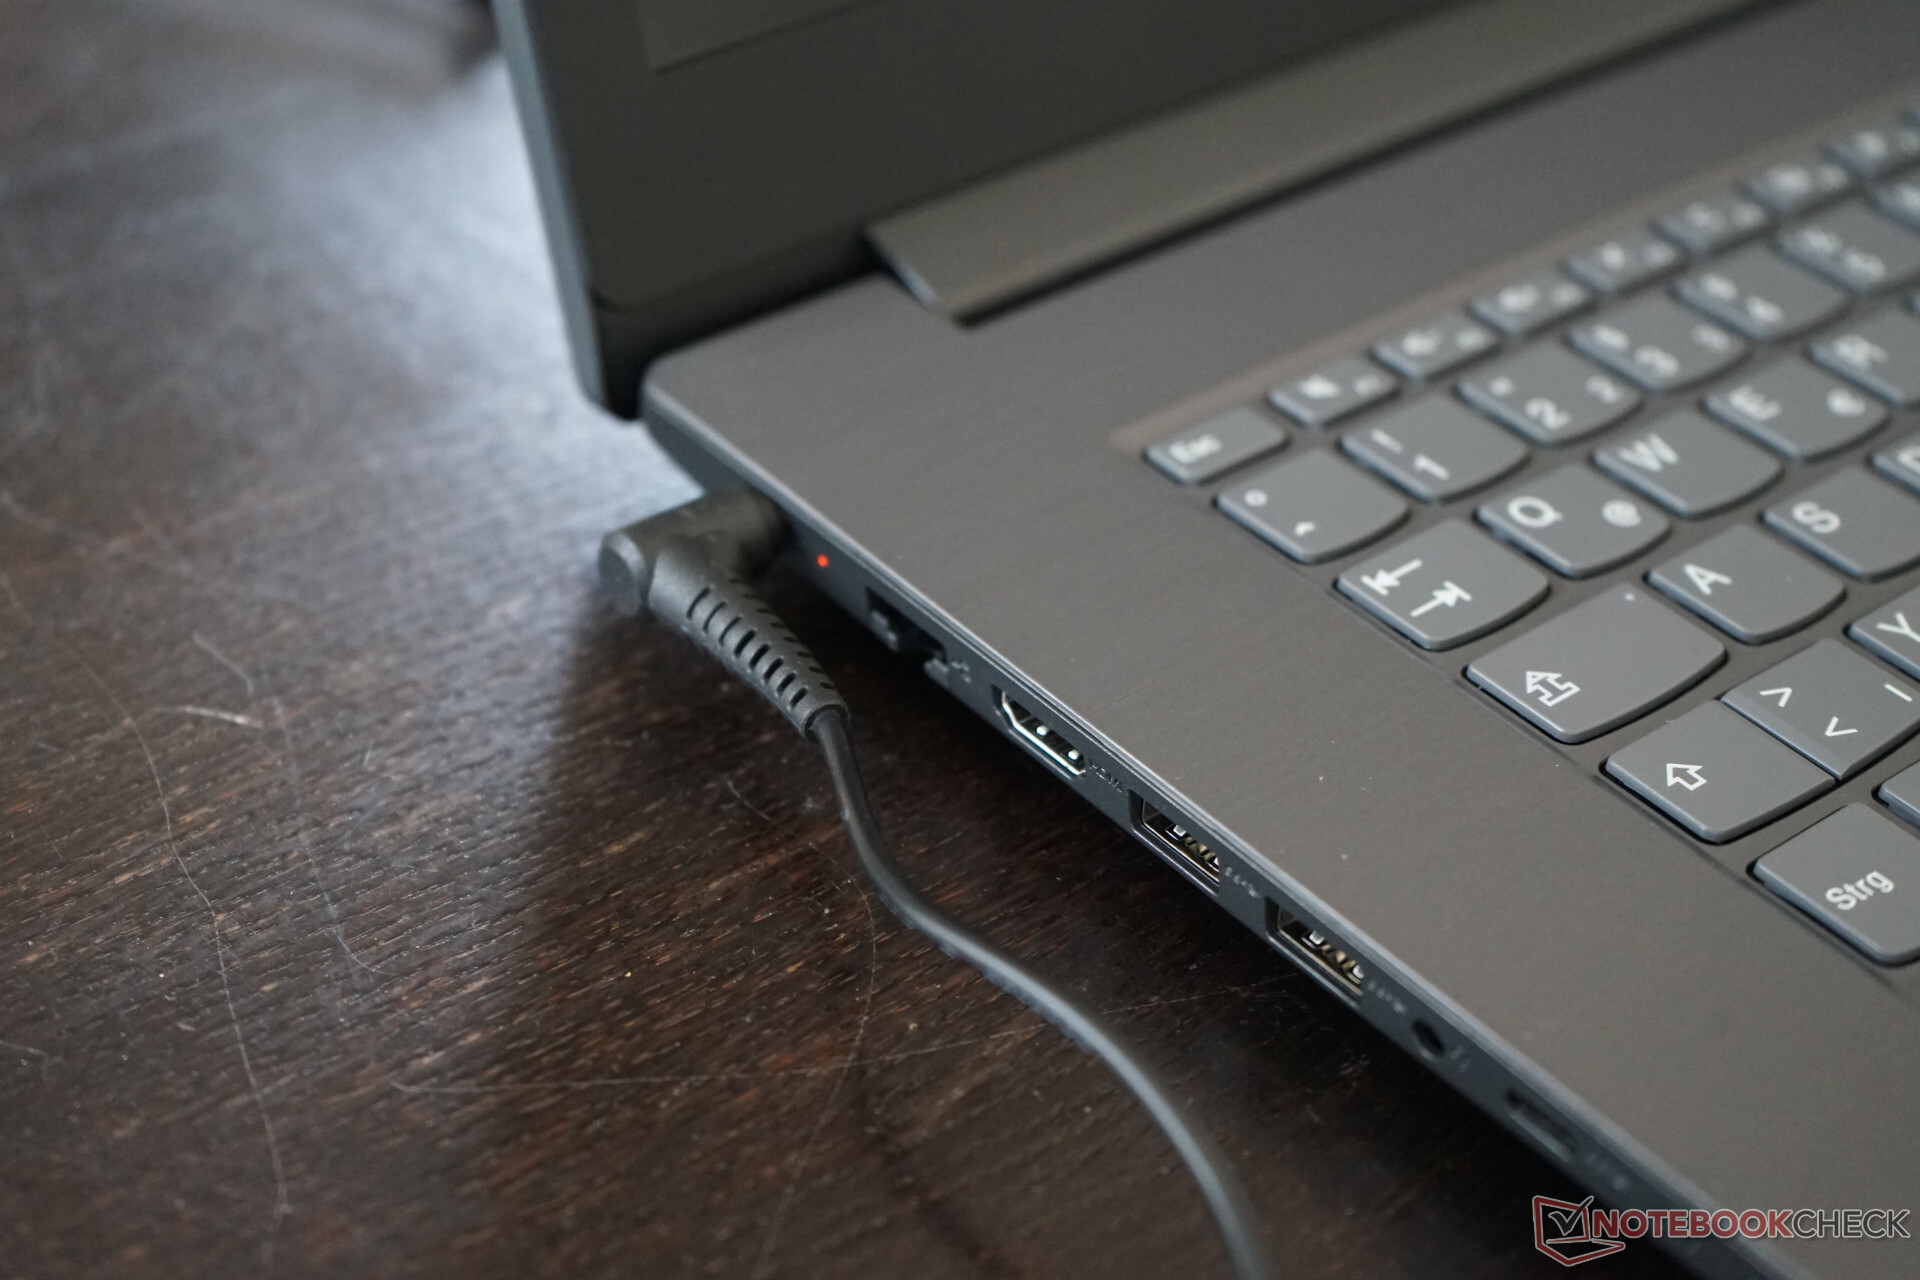
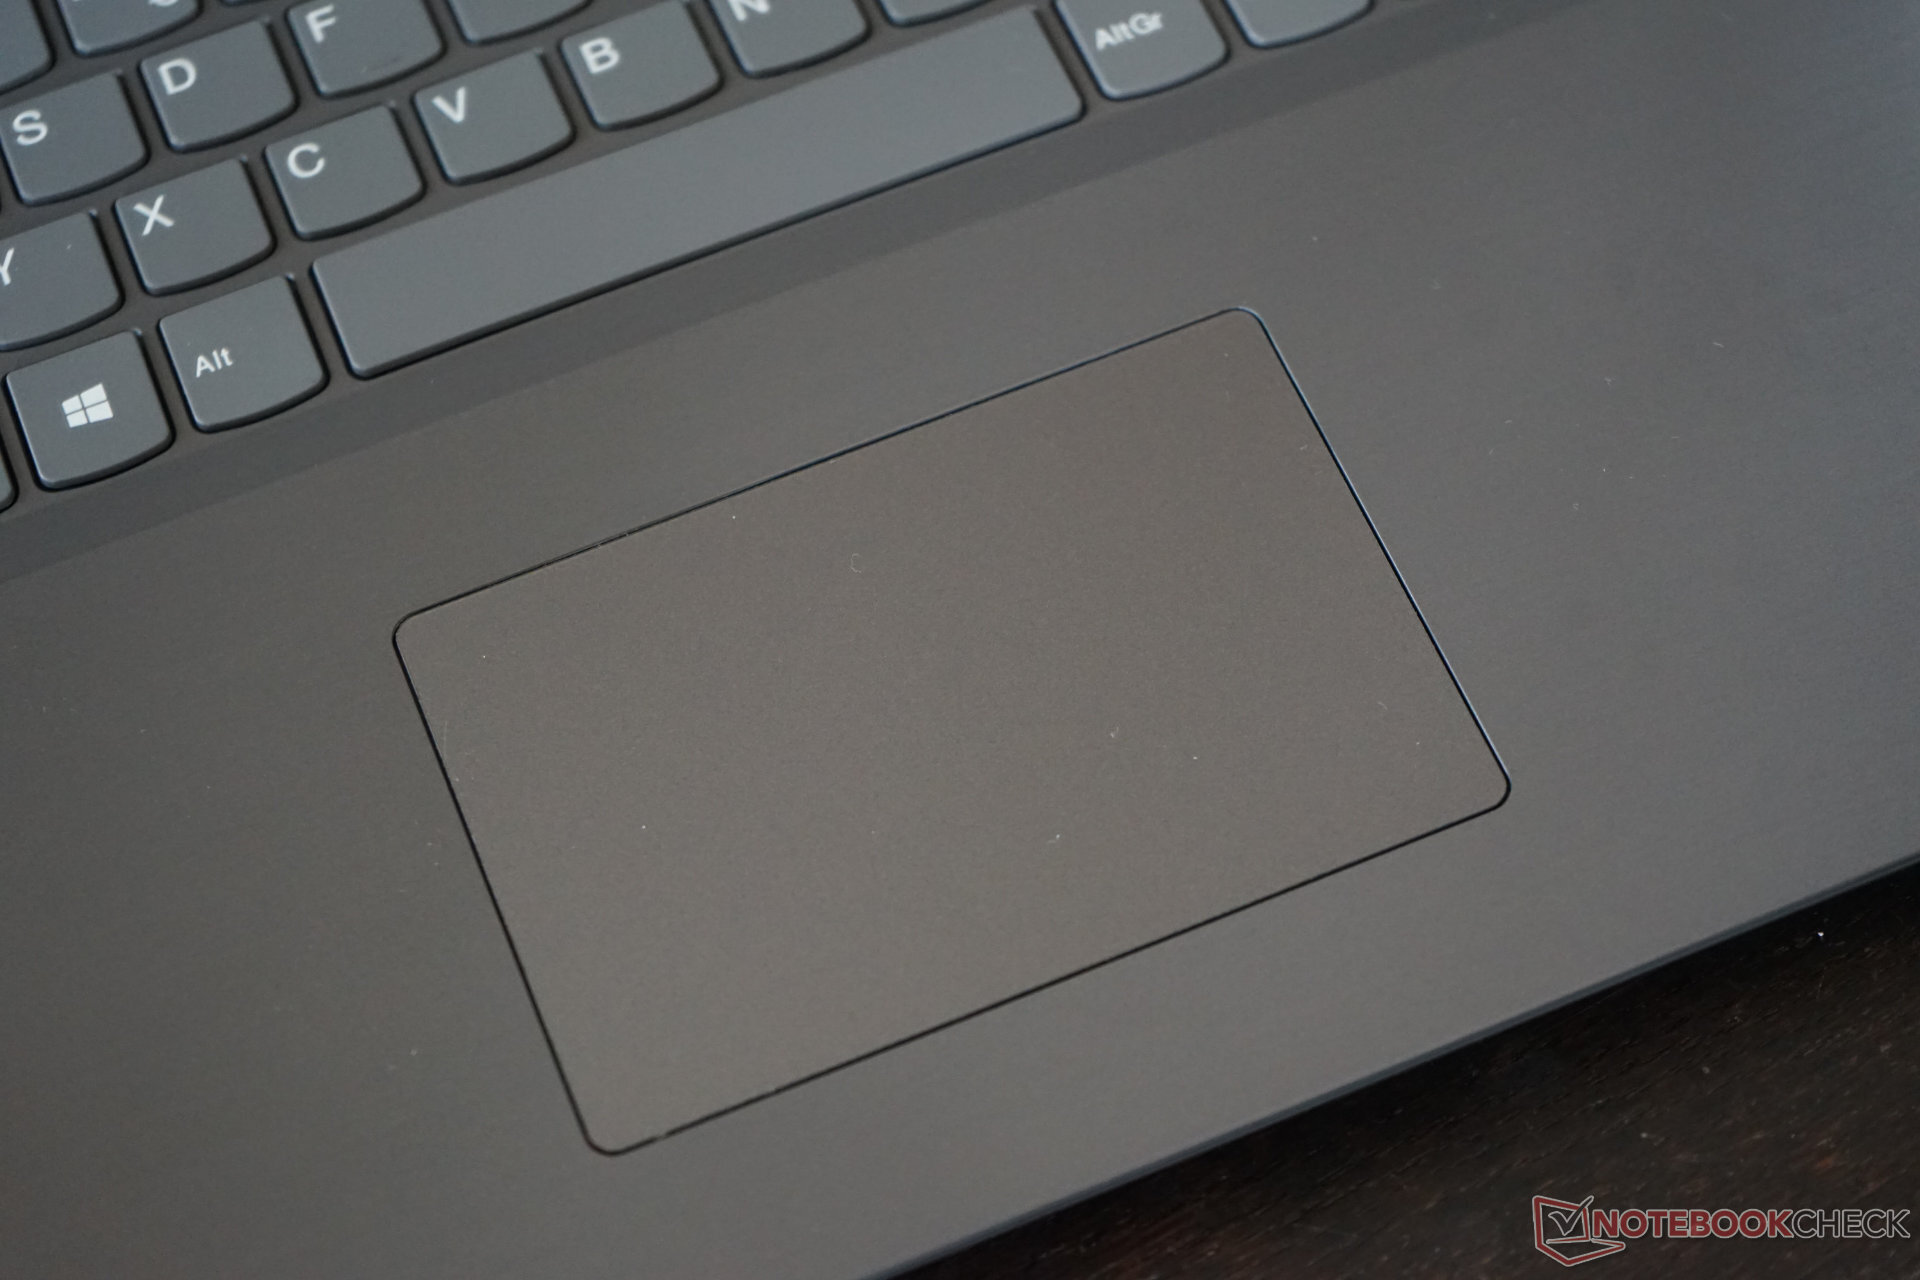
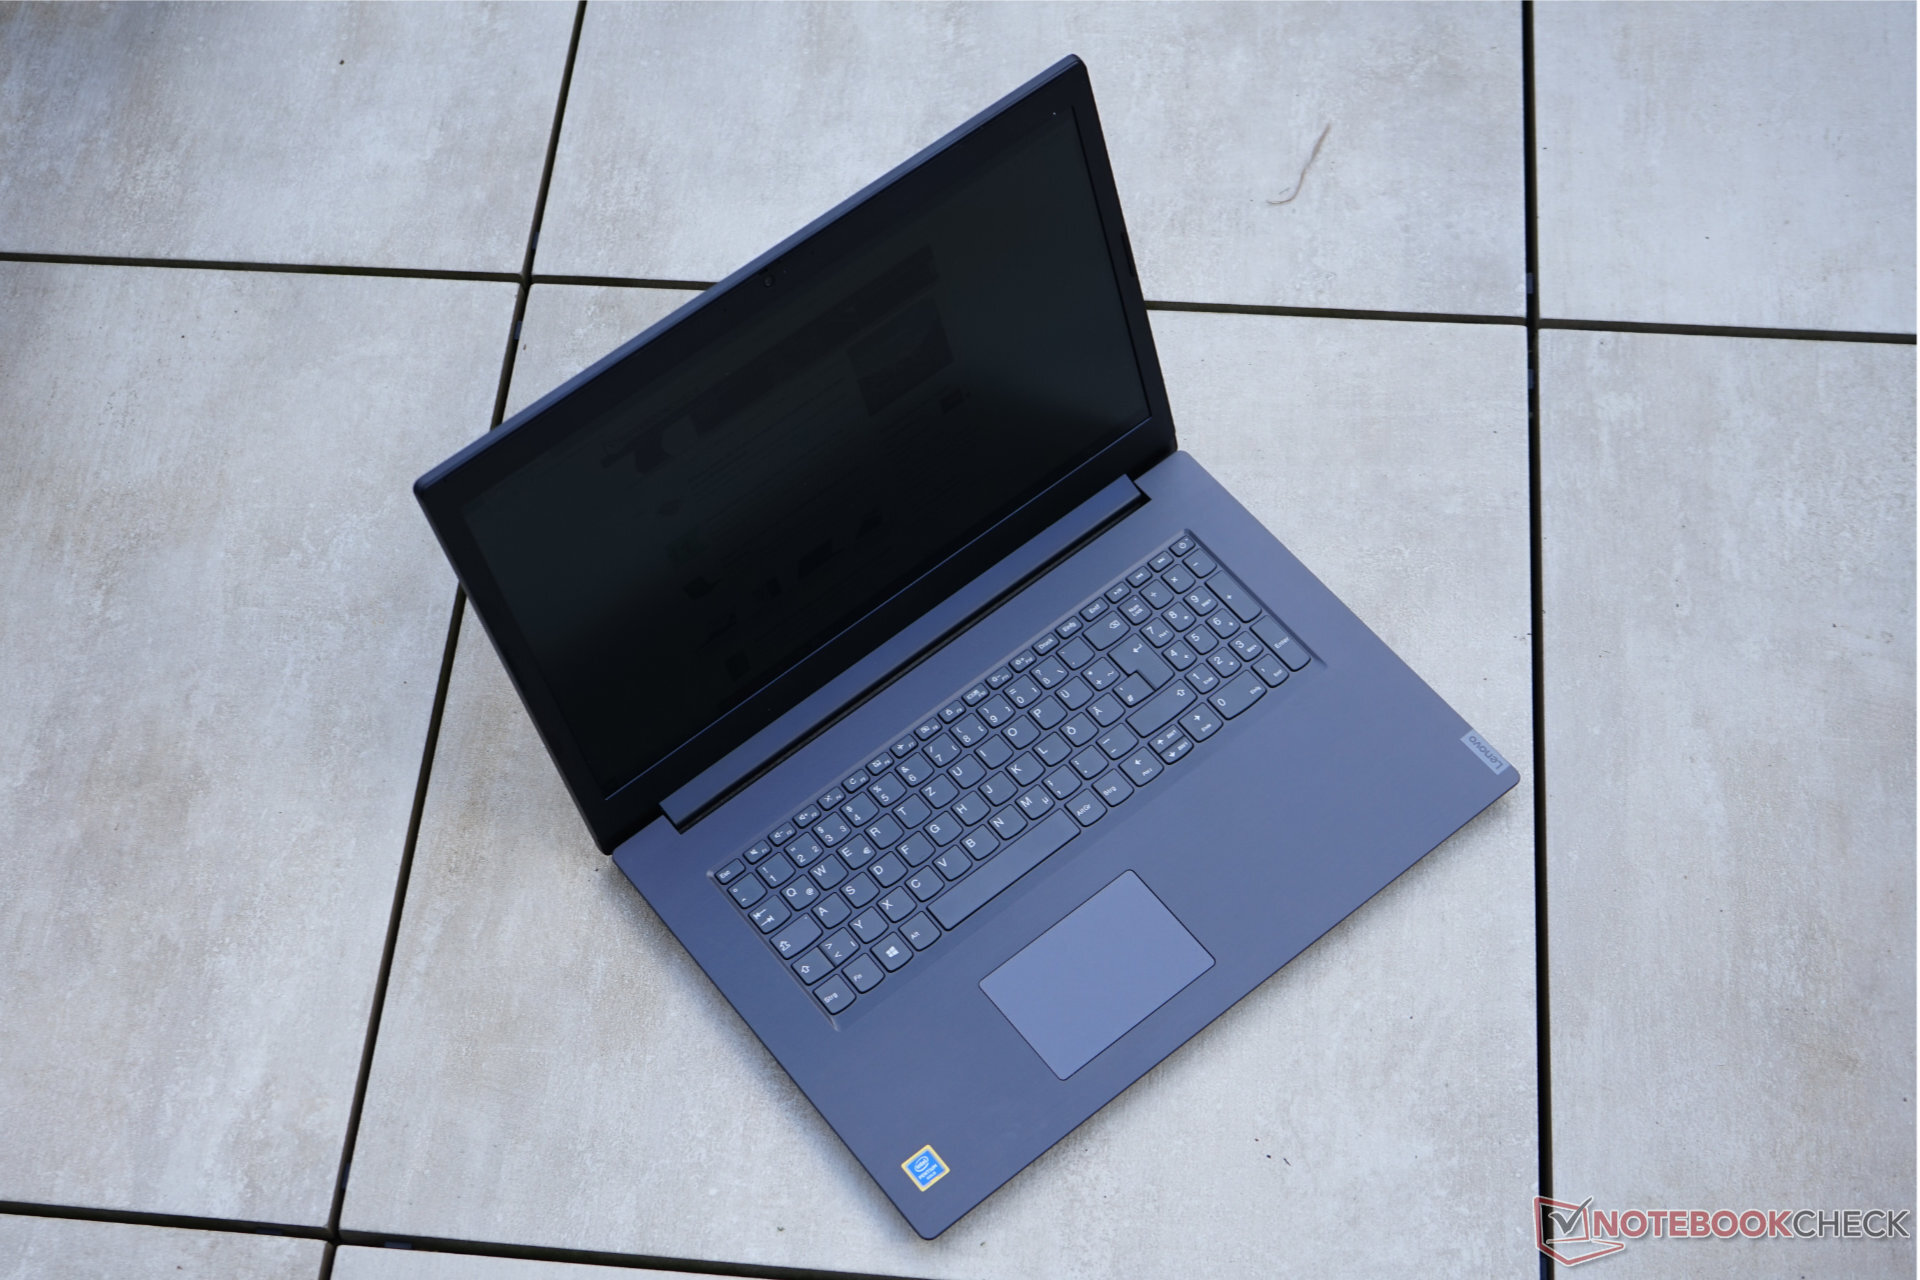
A construção do chassi reflete o baixo preço. No entanto, a fácil acessibilidade de componentes como slot (único) de RAM, SSD, módulo Wi-Fi, compartimento de 2,5 polegadas e ventiladores é uma vantagem. Devido à bateria relativamente pequena, o V340 é adequado para ser um substituto de desktop de escritório barato. Não ficamos impressionados com o touchpad, por isso recomendamos o uso de um mouse externo. A CPU Pentium é uma péssima escolha para jogos ocasionais e usuários com esses interesses seriam melhor atendidos pelo modelo com MX230 graphics dedicados.
Recebemos nossa unidade emprestada da PCO Computer-Handels-GmbH em Wels, que atualmente oferece o V340 por cerca de 529 Euros (~$597).
Lenovo V340-17IWL 81RG001YGE
- 06/22/2020 v7 (old)
Klaus Hinum
Price comparison
