Breve Análise do Portátil Dell Inspiron 17 3000 3780 (i7-8565U, Radeon 520)
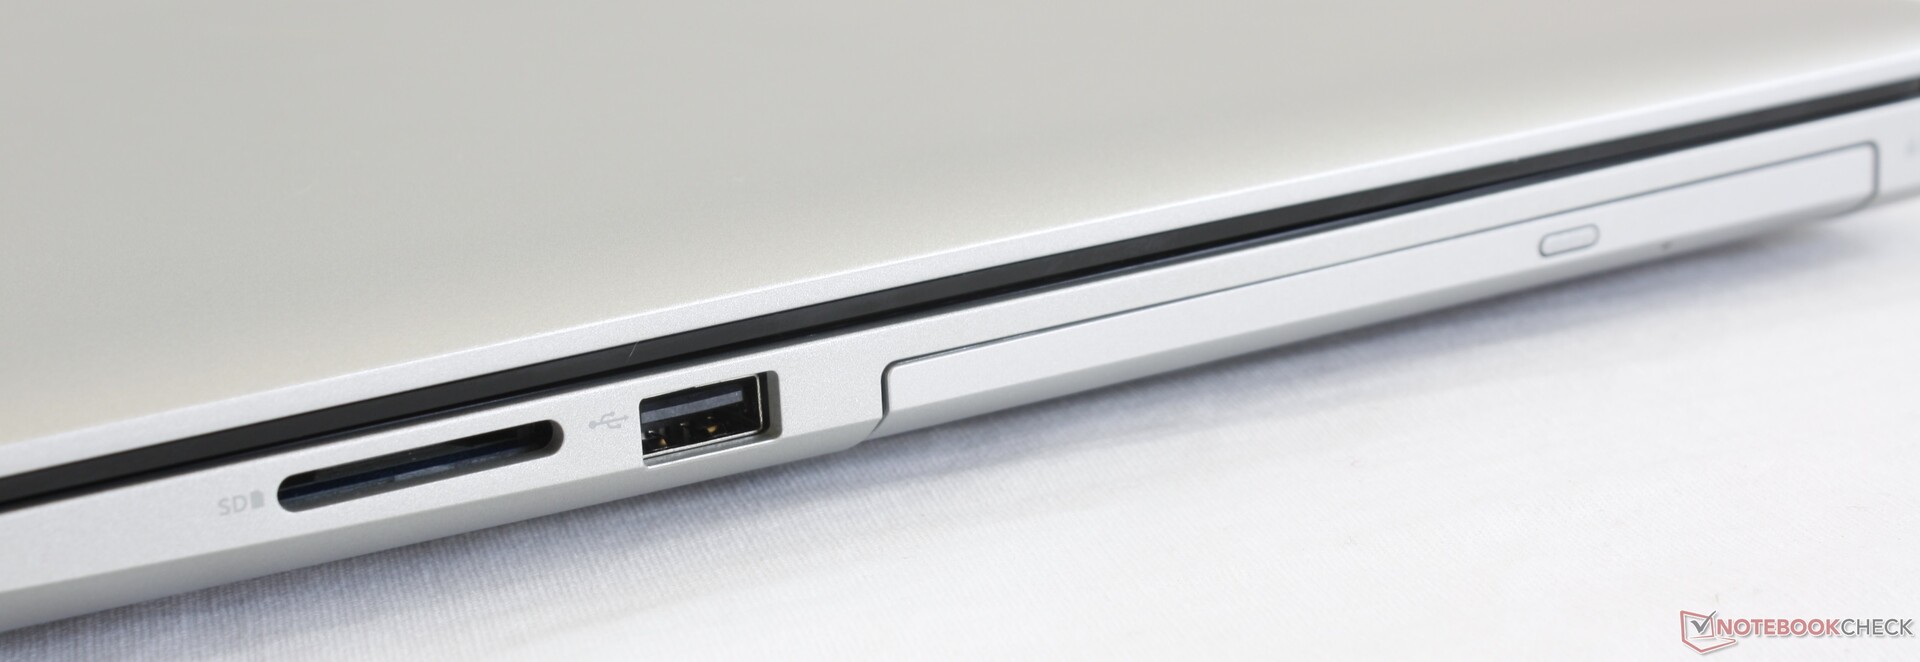
| SD Card Reader | |
| average JPG Copy Test (av. of 3 runs) | |
| Lenovo ThinkPad P71-20HK0004GE | |
| HP ProBook 470 G5 (Toshiba Exceria Pro SDXC 64 GB UHS-II) | |
| Dell Inspiron 17 3780 (Toshiba Exceria Pro SDXC 64 GB UHS-II) | |
| Dell Inspiron 17-7786 (Toshiba Exceria Pro SDXC 64 GB UHS-II) | |
| Lenovo V320-17IKB-81CN000MGE (Toshiba Exceria Pro SDXC 64 GB UHS-II) | |
| maximum AS SSD Seq Read Test (1GB) | |
| Lenovo ThinkPad P71-20HK0004GE | |
| HP ProBook 470 G5 (Toshiba Exceria Pro SDXC 64 GB UHS-II) | |
| Dell Inspiron 17 3780 (Toshiba Exceria Pro SDXC 64 GB UHS-II) | |
| Dell Inspiron 17-7786 (Toshiba Exceria Pro SDXC 64 GB UHS-II) | |
| Lenovo V320-17IKB-81CN000MGE (Toshiba Exceria Pro SDXC 64 GB UHS-II) | |
| Networking | |
| iperf3 transmit AX12 | |
| HP ProBook 470 G5 | |
| Dell Inspiron 17-7786 | |
| Lenovo ThinkPad P71-20HK0004GE | |
| Dell Inspiron 17 3780 | |
| Lenovo V320-17IKB-81CN000MGE | |
| iperf3 receive AX12 | |
| Lenovo ThinkPad P71-20HK0004GE | |
| Dell Inspiron 17-7786 | |
| HP ProBook 470 G5 | |
| Dell Inspiron 17 3780 | |
| Lenovo V320-17IKB-81CN000MGE | |
| |||||||||||||||||||||||||
iluminação: 84 %
iluminação com acumulador: 322.9 cd/m²
Contraste: 1242:1 (Preto: 0.26 cd/m²)
ΔE ColorChecker Calman: 4.19 | ∀{0.5-29.43 Ø4.73}
calibrated: 3.55
ΔE Greyscale Calman: 4.5 | ∀{0.09-98 Ø4.97}
88.4% sRGB (Argyll 1.6.3 3D)
57.6% AdobeRGB 1998 (Argyll 1.6.3 3D)
64.6% AdobeRGB 1998 (Argyll 3D)
88.9% sRGB (Argyll 3D)
63.7% Display P3 (Argyll 3D)
Gamma: 1.97
CCT: 7041 K
| Dell Inspiron 17 3780 AU Optronics B173HAN01.3, IPS, 17.3", 1920x1080 | Dell Inspiron 17-7786 LG Philips, 173W4F, IPS, 17.3", 1920x1080 | Lenovo V320-17IKB-81CN000MGE LG Philips LP173WF4-SPF5, IPS, 17.3", 1920x1080 | HP ProBook 470 G5 LG Philips, IPS, 17.3", 1920x1080 | Dell Inspiron 17-5770-0357 AUO109D (AU Optronics), IPS, 17.3", 1920x1080 | HP 17-ca0013ng LG Philips LGD059E, IPS, 17.3", 1920x1080 | |
|---|---|---|---|---|---|---|
| Display | -5% | -4% | -2% | 0% | 0% | |
| Display P3 Coverage (%) | 63.7 | 64.8 2% | 65.4 3% | 66.1 4% | 63.9 0% | 67 5% |
| sRGB Coverage (%) | 88.9 | 81.6 -8% | 82 -8% | 84.4 -5% | 88.7 0% | 86.4 -3% |
| AdobeRGB 1998 Coverage (%) | 64.6 | 59.7 -8% | 60 -7% | 61.8 -4% | 64.8 0% | 63.2 -2% |
| Response Times | 20% | 24% | 21% | 23% | 30% | |
| Response Time Grey 50% / Grey 80% * (ms) | 46 ? | 38 ? 17% | 33 ? 28% | 36 ? 22% | 38 ? 17% | 33 ? 28% |
| Response Time Black / White * (ms) | 35.2 ? | 27 ? 23% | 28 ? 20% | 28 ? 20% | 25 ? 29% | 24 ? 32% |
| PWM Frequency (Hz) | 119000 ? | |||||
| Screen | -12% | -8% | -16% | 9% | -14% | |
| Brightness middle (cd/m²) | 322.9 | 343 6% | 414 28% | 400 24% | 279 -14% | 394 22% |
| Brightness (cd/m²) | 322 | 313 -3% | 375 16% | 374 16% | 262 -19% | 352 9% |
| Brightness Distribution (%) | 84 | 82 -2% | 82 -2% | 87 4% | 85 1% | 83 -1% |
| Black Level * (cd/m²) | 0.26 | 0.37 -42% | 0.41 -58% | 0.63 -142% | 0.18 31% | 0.35 -35% |
| Contrast (:1) | 1242 | 927 -25% | 1010 -19% | 635 -49% | 1550 25% | 1126 -9% |
| Colorchecker dE 2000 * | 4.19 | 4.8 -15% | 4.5 -7% | 4.34 -4% | 3.58 15% | 6.08 -45% |
| Colorchecker dE 2000 max. * | 7.04 | 10.35 -47% | 9.59 -36% | 8.29 -18% | 5.98 15% | 10.88 -55% |
| Colorchecker dE 2000 calibrated * | 3.55 | 4.57 -29% | 2.8 21% | |||
| Greyscale dE 2000 * | 4.5 | 3.51 22% | 3.13 30% | 3.51 22% | 2.75 39% | 7.22 -60% |
| Gamma | 1.97 112% | 2.19 100% | 2.41 91% | 2.45 90% | 2.57 86% | 2.48 89% |
| CCT | 7041 92% | 6188 105% | 6198 105% | 6570 99% | 6836 95% | 7997 81% |
| Color Space (Percent of AdobeRGB 1998) (%) | 57.6 | 54 -6% | 54 -6% | 55 -5% | 58 1% | 57 -1% |
| Color Space (Percent of sRGB) (%) | 88.4 | 81 -8% | 82 -7% | 84 -5% | 88 0% | 86 -3% |
| Média Total (Programa/Configurações) | 1% /
-6% | 4% /
-3% | 1% /
-8% | 11% /
9% | 5% /
-6% |
* ... menor é melhor
Exibir tempos de resposta
| ↔ Tempo de resposta preto para branco | ||
|---|---|---|
| 35.2 ms ... ascensão ↗ e queda ↘ combinadas | ↗ 22 ms ascensão | 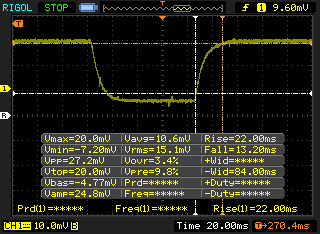 |
| ↘ 13.2 ms queda | ||
| A tela mostra taxas de resposta lentas em nossos testes e será insatisfatória para os jogadores. Em comparação, todos os dispositivos testados variam de 0.1 (mínimo) a 240 (máximo) ms. » 93 % de todos os dispositivos são melhores. Isso significa que o tempo de resposta medido é pior que a média de todos os dispositivos testados (19.9 ms). | ||
| ↔ Tempo de resposta 50% cinza a 80% cinza | ||
| 46 ms ... ascensão ↗ e queda ↘ combinadas | ↗ 24.4 ms ascensão | 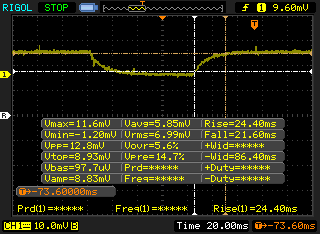 |
| ↘ 21.6 ms queda | ||
| A tela mostra taxas de resposta lentas em nossos testes e será insatisfatória para os jogadores. Em comparação, todos os dispositivos testados variam de 0.165 (mínimo) a 636 (máximo) ms. » 79 % de todos os dispositivos são melhores. Isso significa que o tempo de resposta medido é pior que a média de todos os dispositivos testados (31.1 ms). | ||
Cintilação da tela / PWM (modulação por largura de pulso)
| Tela tremeluzindo / PWM não detectado | 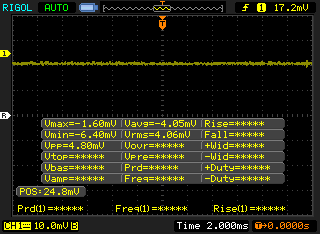 | ||
[pwm_comparison] Em comparação: 52 % de todos os dispositivos testados não usam PWM para escurecer a tela. Se PWM foi detectado, uma média de 7791 (mínimo: 5 - máximo: 343500) Hz foi medida. | |||
| PCMark 10 | |
| Score | |
| Dell Inspiron 17 3780 | |
| Dell Inspiron 17-7786 | |
| Lenovo V320-17IKB-81CN000MGE | |
| HP ProBook 470 G5 | |
| Dell Inspiron 17-5770-0357 | |
| Essentials | |
| Dell Inspiron 17 3780 | |
| Dell Inspiron 17-7786 | |
| Lenovo V320-17IKB-81CN000MGE | |
| Dell Inspiron 17-5770-0357 | |
| HP ProBook 470 G5 | |
| Productivity | |
| Dell Inspiron 17 3780 | |
| Dell Inspiron 17-7786 | |
| Lenovo V320-17IKB-81CN000MGE | |
| Dell Inspiron 17-5770-0357 | |
| HP ProBook 470 G5 | |
| Digital Content Creation | |
| Dell Inspiron 17-7786 | |
| Dell Inspiron 17 3780 | |
| Lenovo V320-17IKB-81CN000MGE | |
| Dell Inspiron 17-5770-0357 | |
| HP ProBook 470 G5 | |
| PCMark 8 | |
| Home Score Accelerated v2 | |
| Dell Inspiron 17-7786 | |
| Lenovo V320-17IKB-81CN000MGE | |
| HP ProBook 470 G5 | |
| Dell Inspiron 17-5770-0357 | |
| Dell Inspiron 17 3780 | |
| HP 17-ca0013ng | |
| Work Score Accelerated v2 | |
| Dell Inspiron 17 3780 | |
| Dell Inspiron 17-7786 | |
| HP ProBook 470 G5 | |
| Lenovo V320-17IKB-81CN000MGE | |
| Dell Inspiron 17-5770-0357 | |
| PCMark 8 Home Score Accelerated v2 | 3509 pontos | |
| PCMark 8 Work Score Accelerated v2 | 5260 pontos | |
| PCMark 10 Score | 4594 pontos | |
Ajuda | ||
| Dell Inspiron 17 3780 SK Hynix BC501 NVMe 256 GB | Lenovo V320-17IKB-81CN000MGE Liteonit CV3-DE256 | HP ProBook 470 G5 Intel SSD 600p SSDPEKKW256G7 | Dell Inspiron 17-5770-0357 SK hynix SC311 M.2 | HP 17-ca0013ng Toshiba KBG30ZMV256G | |
|---|---|---|---|---|---|
| AS SSD | -53% | -23% | -68% | -42% | |
| Seq Read (MB/s) | 1061 | 520 -51% | 1257 18% | 492.1 -54% | 1334 26% |
| Seq Write (MB/s) | 491.4 | 259.4 -47% | 461.8 -6% | 182.1 -63% | 760 55% |
| 4K Read (MB/s) | 39.13 | 21.59 -45% | 26.95 -31% | 25.6 -35% | 37.67 -4% |
| 4K Write (MB/s) | 104 | 53.6 -48% | 90.6 -13% | 68.8 -34% | 72 -31% |
| 4K-64 Read (MB/s) | 505 | 329.4 -35% | 279.4 -45% | 159.1 -68% | 629 25% |
| 4K-64 Write (MB/s) | 314.8 | 215.4 -32% | 429.4 36% | 73.4 -77% | 259 -18% |
| Access Time Read * (ms) | 0.063 | 0.084 -33% | 0.109 -73% | 0.128 -103% | 0.085 -35% |
| Access Time Write * (ms) | 0.034 | 0.072 -112% | 0.039 -15% | 0.061 -79% | 0.204 -500% |
| Score Read (Points) | 650 | 403 -38% | 432 -34% | 234 -64% | 800 23% |
| Score Write (Points) | 468 | 295 -37% | 566 21% | 160 -66% | 407 -13% |
| Score Total (Points) | 1434 | 897 -37% | 1188 -17% | 509 -65% | 1596 11% |
| Copy ISO MB/s (MB/s) | 876 | 305 -65% | 549 -37% | 162.8 -81% | 574 -34% |
| Copy Program MB/s (MB/s) | 653 | 99.2 -85% | 209.2 -68% | 107.8 -83% | 219.2 -66% |
| Copy Game MB/s (MB/s) | 512 | 147.8 -71% | 248.6 -51% | 130.9 -74% | 374 -27% |
* ... menor é melhor

| 3DMark 11 Performance | 2409 pontos | |
| 3DMark Cloud Gate Standard Score | 8971 pontos | |
| 3DMark Fire Strike Score | 1511 pontos | |
| 3DMark Time Spy Score | 526 pontos | |
Ajuda | ||
| The Witcher 3 | |
| 1024x768 Low Graphics & Postprocessing | |
| Média da turma Multimedia (68 - 380, n=10, últimos 2 anos) | |
| Dell Inspiron 17 3780 | |
| Média AMD Radeon 520 (n=1) | |
| 1366x768 Medium Graphics & Postprocessing | |
| Média da turma Multimedia (41 - 93, n=4, últimos 2 anos) | |
| Dell Inspiron 17 3780 | |
| Média AMD Radeon 520 (n=1) | |
| 1920x1080 High Graphics & Postprocessing (Nvidia HairWorks Off) | |
| Média da turma Multimedia (22 - 224, n=13, últimos 2 anos) | |
| Dell Inspiron 17 3780 | |
| Média AMD Radeon 520 (n=1) | |
| 1920x1080 Ultra Graphics & Postprocessing (HBAO+) | |
| Média da turma Multimedia (11 - 121, n=13, últimos 2 anos) | |
| Dell Inspiron 17 3780 | |
| Média AMD Radeon 520 (n=1) | |
| baixo | média | alto | ultra | |
|---|---|---|---|---|
| BioShock Infinite (2013) | 82.4 | 43.7 | 36.3 | 11.7 |
| The Witcher 3 (2015) | 29.7 | 18.7 | 10.2 | 5.8 |
| Rise of the Tomb Raider (2016) | 36 | 20.8 | 9.8 | 7.4 |
| Dell Inspiron 17 3780 Radeon 520, i7-8565U, SK Hynix BC501 NVMe 256 GB | Dell Inspiron 17-7786 GeForce MX150, i7-8565U, KBG30ZMS128G | Lenovo V320-17IKB-81CN000MGE UHD Graphics 620, i5-8250U, Liteonit CV3-DE256 | HP ProBook 470 G5 GeForce 930MX, i5-8250U, Intel SSD 600p SSDPEKKW256G7 | Dell Inspiron 17-5770-0357 UHD Graphics 620, i5-8250U, SK hynix SC311 M.2 | HP 17-ca0013ng Vega 8, R5 2500U, Toshiba KBG30ZMV256G | |
|---|---|---|---|---|---|---|
| Noise | 6% | 7% | 7% | -0% | 3% | |
| desligado / ambiente * (dB) | 28.1 | 30.3 -8% | 30.4 -8% | 30.5 -9% | 30.1 -7% | 30.6 -9% |
| Idle Minimum * (dB) | 31.7 | 30.7 3% | 30.4 4% | 30.5 4% | 31.1 2% | 32.8 -3% |
| Idle Average * (dB) | 31.8 | 30.7 3% | 30 6% | 30.5 4% | 31.1 2% | 32.8 -3% |
| Idle Maximum * (dB) | 31.8 | 30.7 3% | 31.4 1% | 30.5 4% | 31.1 2% | 32.8 -3% |
| Load Average * (dB) | 38.7 | 33.4 14% | 34.1 12% | 33 15% | 44.4 -15% | 34.2 12% |
| Load Maximum * (dB) | 48.5 | 38.7 20% | 36.4 25% | 38 22% | 41.7 14% | 36.4 25% |
* ... menor é melhor
Barulho
| Ocioso |
| 31.7 / 31.8 / 31.8 dB |
| Carga |
| 38.7 / 48.5 dB |
 | ||
30 dB silencioso 40 dB(A) audível 50 dB(A) ruidosamente alto |
||
min: | ||
(-) A temperatura máxima no lado superior é 49 °C / 120 F, em comparação com a média de 36.8 °C / 98 F , variando de 21 a 71 °C para a classe Multimedia.
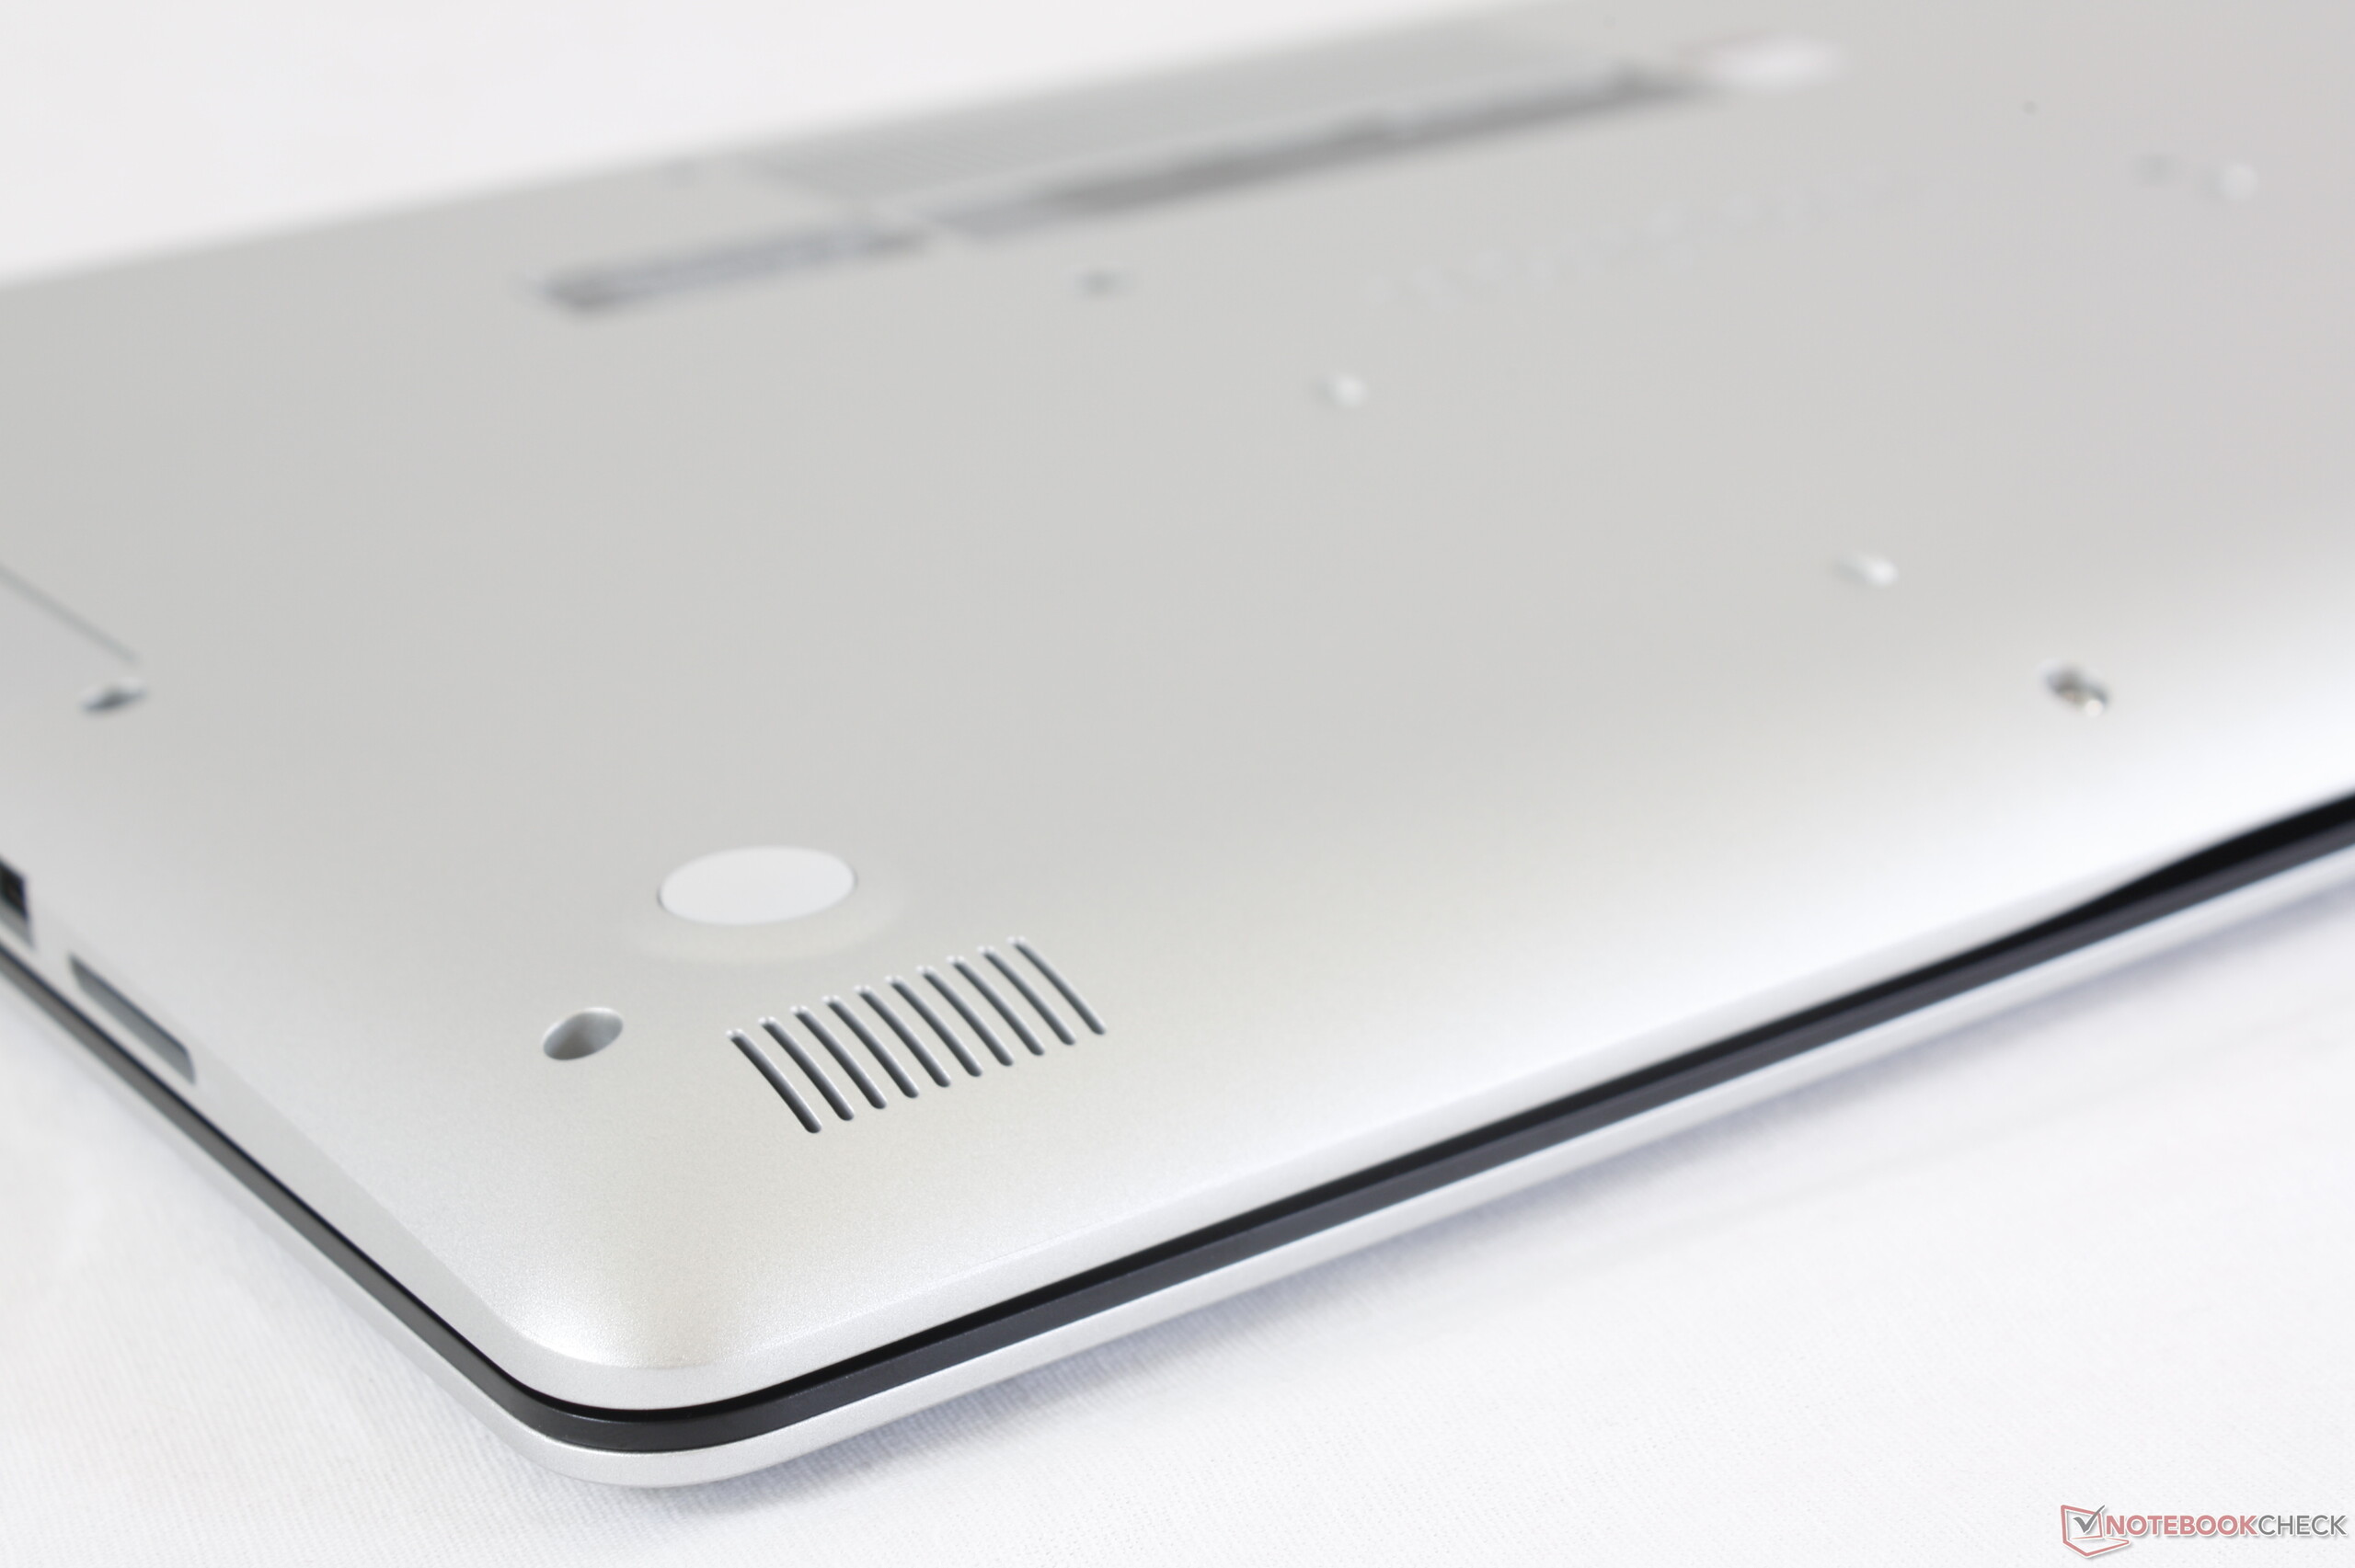
(+) A parte inferior aquece até um máximo de 39.6 °C / 103 F, em comparação com a média de 39.1 °C / 102 F
(+) Em uso inativo, a temperatura média para o lado superior é 27.4 °C / 81 F, em comparação com a média do dispositivo de 31.3 °C / ### class_avg_f### F.
(+) Os apoios para as mãos e o touchpad são mais frios que a temperatura da pele, com um máximo de 27.4 °C / 81.3 F e, portanto, são frios ao toque.
(±) A temperatura média da área do apoio para as mãos de dispositivos semelhantes foi 28.7 °C / 83.7 F (+1.3 °C / 2.4 F).
Apple MacBook 12 (Early 2016) 1.1 GHz análise de áudio
(+) | os alto-falantes podem tocar relativamente alto (###valor### dB)
Graves 100 - 315Hz
(±) | graves reduzidos - em média 11.3% menor que a mediana
(±) | a linearidade dos graves é média (14.2% delta para a frequência anterior)
Médios 400 - 2.000 Hz
(+) | médios equilibrados - apenas 2.4% longe da mediana
(+) | médios são lineares (5.5% delta para frequência anterior)
Altos 2 - 16 kHz
(+) | agudos equilibrados - apenas 2% longe da mediana
(+) | os máximos são lineares (4.5% delta da frequência anterior)
Geral 100 - 16.000 Hz
(+) | o som geral é linear (10.2% diferença em relação à mediana)
Comparado com a mesma classe
» 7% de todos os dispositivos testados nesta classe foram melhores, 2% semelhantes, 91% piores
» O melhor teve um delta de 5%, a média foi 18%, o pior foi 53%
Comparado com todos os dispositivos testados
» 5% de todos os dispositivos testados foram melhores, 1% semelhantes, 94% piores
» O melhor teve um delta de 4%, a média foi 24%, o pior foi 134%
| desligado | |
| Ocioso | |
| Carga |
|
Key:
min: | |
| Dell Inspiron 17 3780 i7-8565U, Radeon 520, SK Hynix BC501 NVMe 256 GB, IPS, 1920x1080, 17.3" | Dell Inspiron 17-7786 i7-8565U, GeForce MX150, KBG30ZMS128G, IPS, 1920x1080, 17.3" | Lenovo V320-17IKB-81CN000MGE i5-8250U, UHD Graphics 620, Liteonit CV3-DE256, IPS, 1920x1080, 17.3" | HP ProBook 470 G5 i5-8250U, GeForce 930MX, Intel SSD 600p SSDPEKKW256G7, IPS, 1920x1080, 17.3" | Dell Inspiron 17-5770-0357 i5-8250U, UHD Graphics 620, SK hynix SC311 M.2, IPS, 1920x1080, 17.3" | HP 17-ca0013ng R5 2500U, Vega 8, Toshiba KBG30ZMV256G, IPS, 1920x1080, 17.3" | |
|---|---|---|---|---|---|---|
| Power Consumption | 3% | 20% | 14% | 23% | -12% | |
| Idle Minimum * (Watt) | 5 | 4.2 16% | 4.3 14% | 3.4 32% | 4.08 18% | 7.6 -52% |
| Idle Average * (Watt) | 10.9 | 9.4 14% | 10.2 6% | 9.6 12% | 8.45 22% | 12.9 -18% |
| Idle Maximum * (Watt) | 12 | 12.9 -8% | 10.5 12% | 11.8 2% | 9.6 20% | 13.7 -14% |
| Load Average * (Watt) | 49.6 | 56 -13% | 34 31% | 43 13% | 40.2 19% | 44 11% |
| Load Maximum * (Watt) | 66.9 | 63.4 5% | 42 37% | 61 9% | 41.4 38% | 57.1 15% |
* ... menor é melhor
| Dell Inspiron 17 3780 i7-8565U, Radeon 520, 42 Wh | Dell Inspiron 17-7786 i7-8565U, GeForce MX150, 56 Wh | Lenovo V320-17IKB-81CN000MGE i5-8250U, UHD Graphics 620, 30 Wh | HP ProBook 470 G5 i5-8250U, GeForce 930MX, 48 Wh | Dell Inspiron 17-5770-0357 i5-8250U, UHD Graphics 620, 42 Wh | HP 17-ca0013ng R5 2500U, Vega 8, 40.6 Wh | |
|---|---|---|---|---|---|---|
| Duração da bateria | 105% | 2% | 99% | 34% | -10% | |
| Reader / Idle (h) | 9.6 | 16.6 73% | 10.5 9% | 18.7 95% | 11.7 22% | |
| WiFi v1.3 (h) | 4.2 | 9 114% | 4.4 5% | 8.1 93% | 6.1 45% | 3.8 -10% |
| Load (h) | 1.1 | 2.5 127% | 1 -9% | 2.3 109% | 1.5 36% |
Pro
Contra
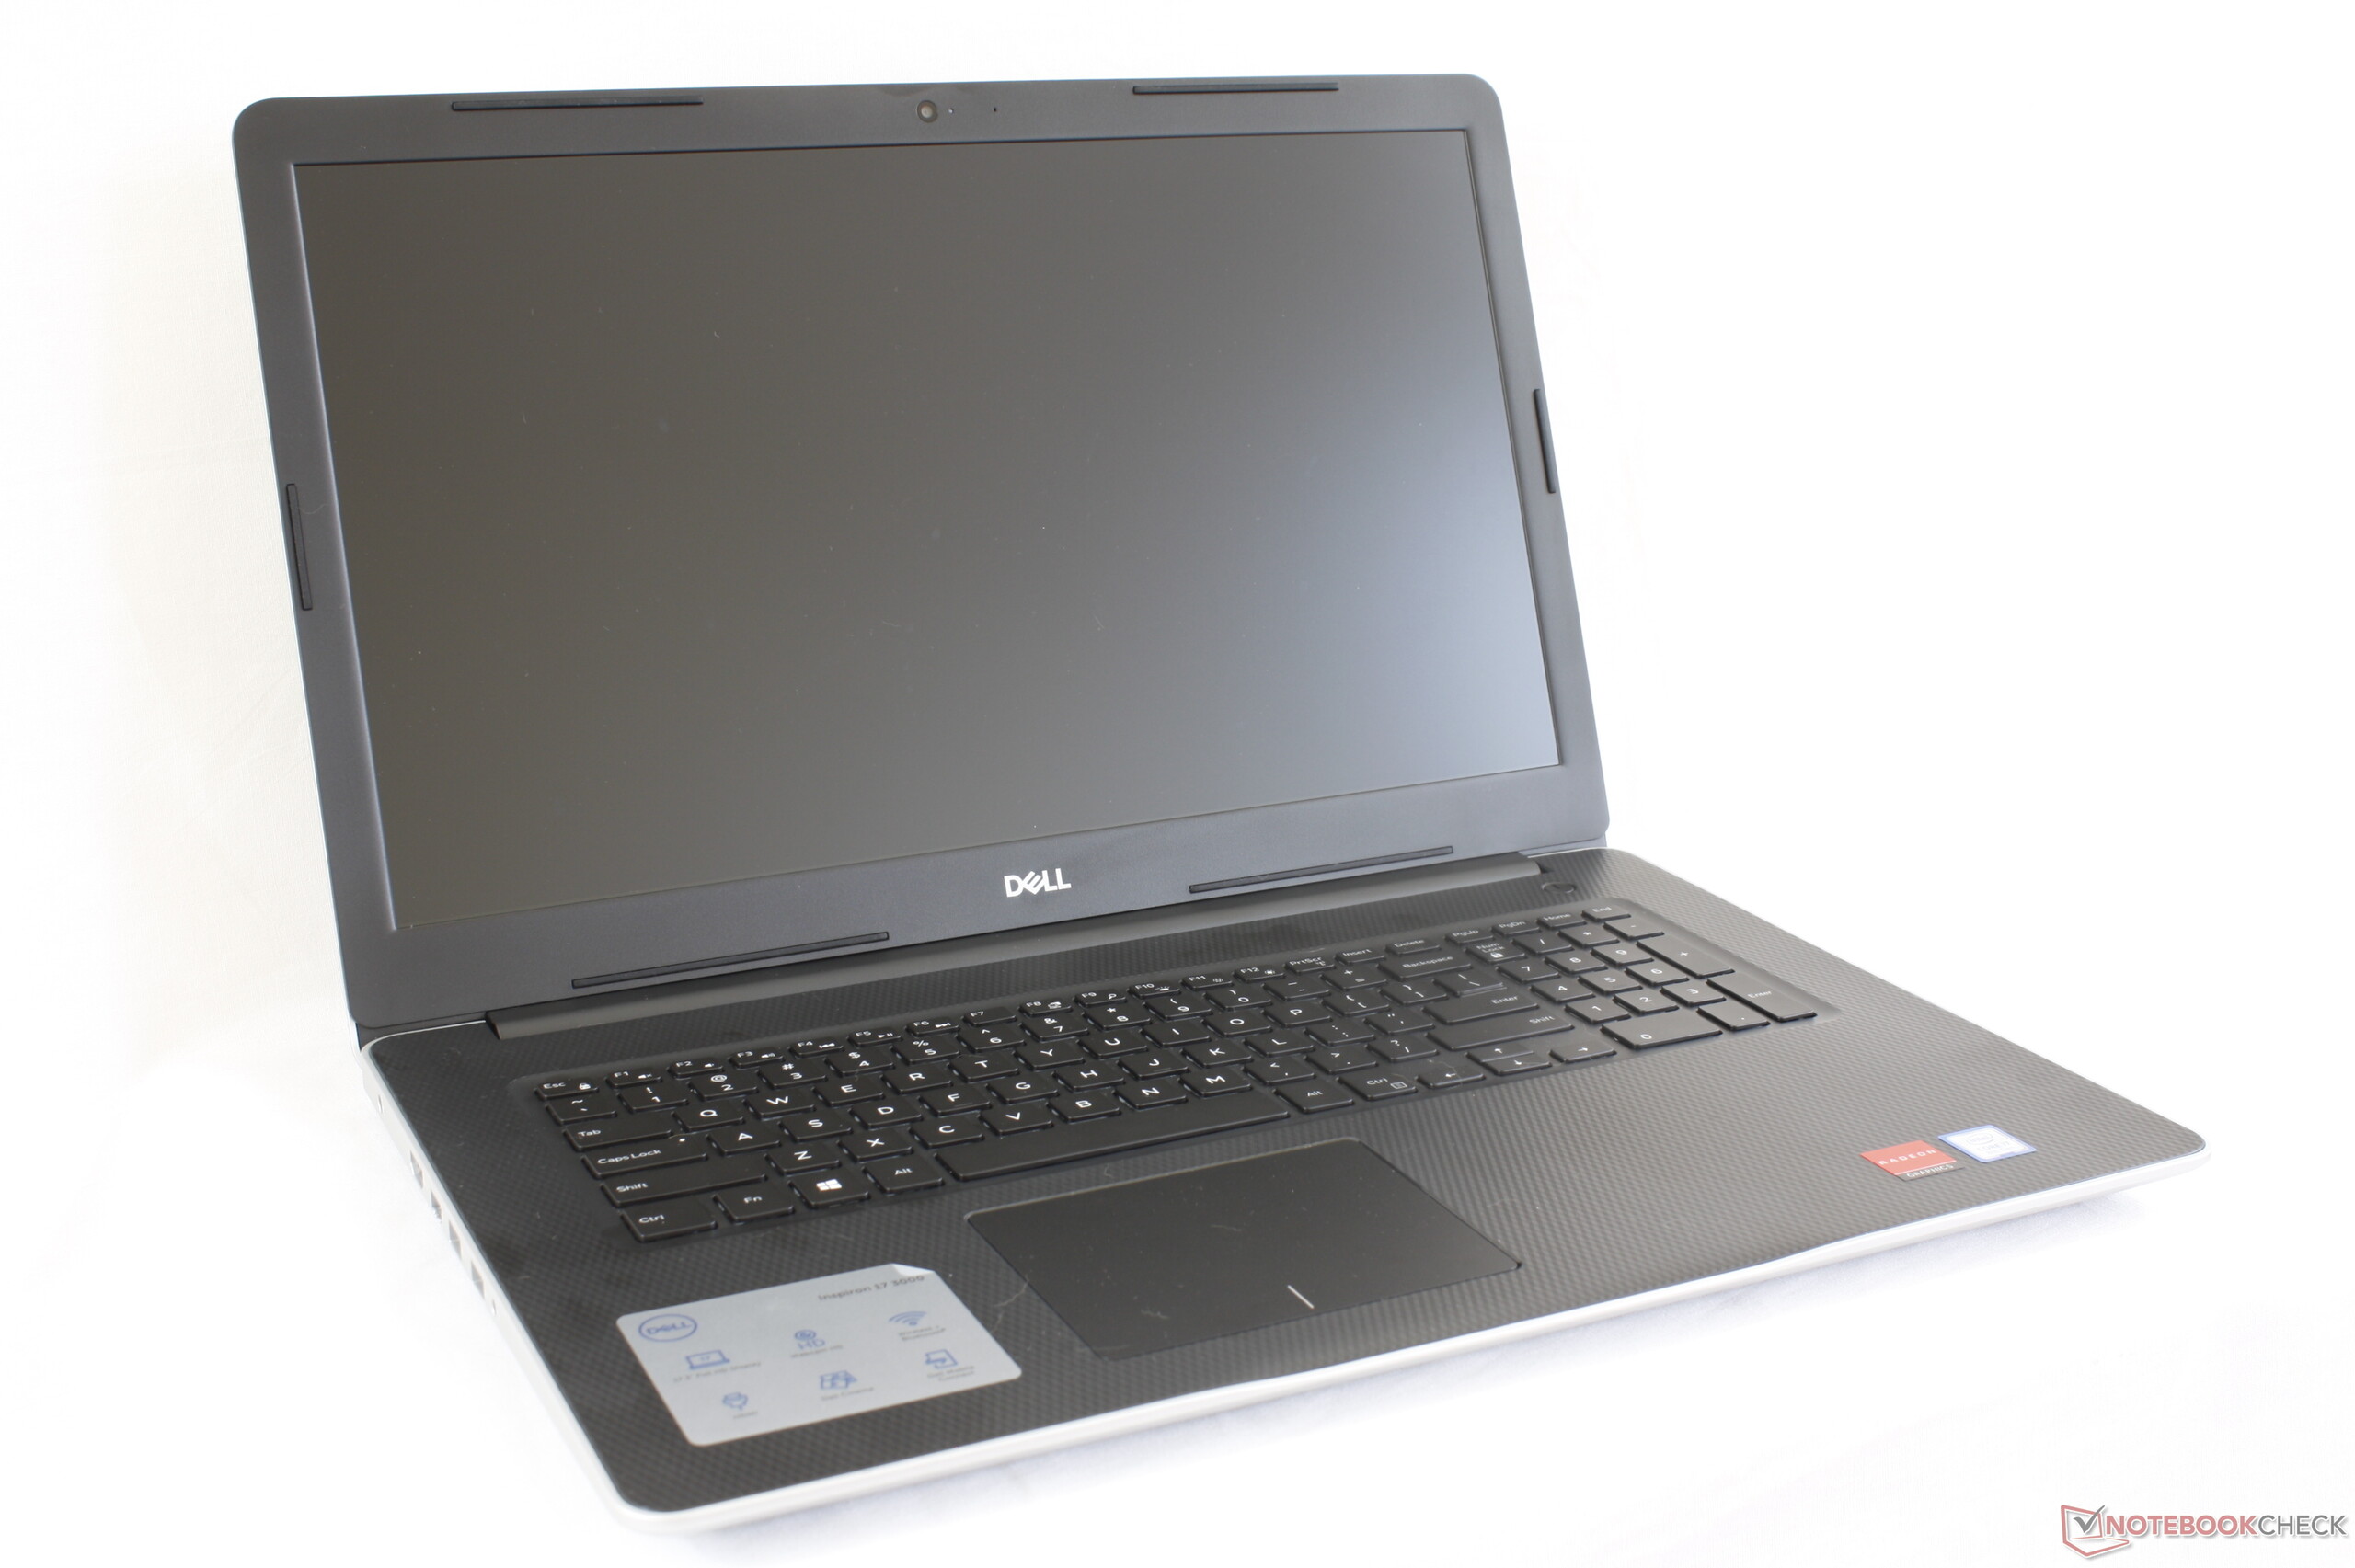
Os recursos mais atraentes do Inspiron 17 3780 são sua tela IPS 1080p padrão e preço baixo. Sistemas concorrentes como o Asus VivoBook 17 podem ter telas de menor resolução e oferecerão apenas 1080p a um preço premium desnecessário.
Se considerar o Inspiron 17 3780, recomendamos ignorar a opção mais cara da GPU dedicada Radeon 520, dado que ela oferece desempenho gráfico muito ruim e baixo desempenho por Watt. Se deseja poder da GPU, então o Lenovo IdeaPad 330-17IKB com gráficos GeForce MX150 seria uma alternativa digna. Se a sua intenção for principalmente processamento de texto, navegação na web e transmissão de vídeo, então a configuração básica do Inspiron 15 com Core i5-8265U ou Ryzen 5 2500U seriam suficientes.
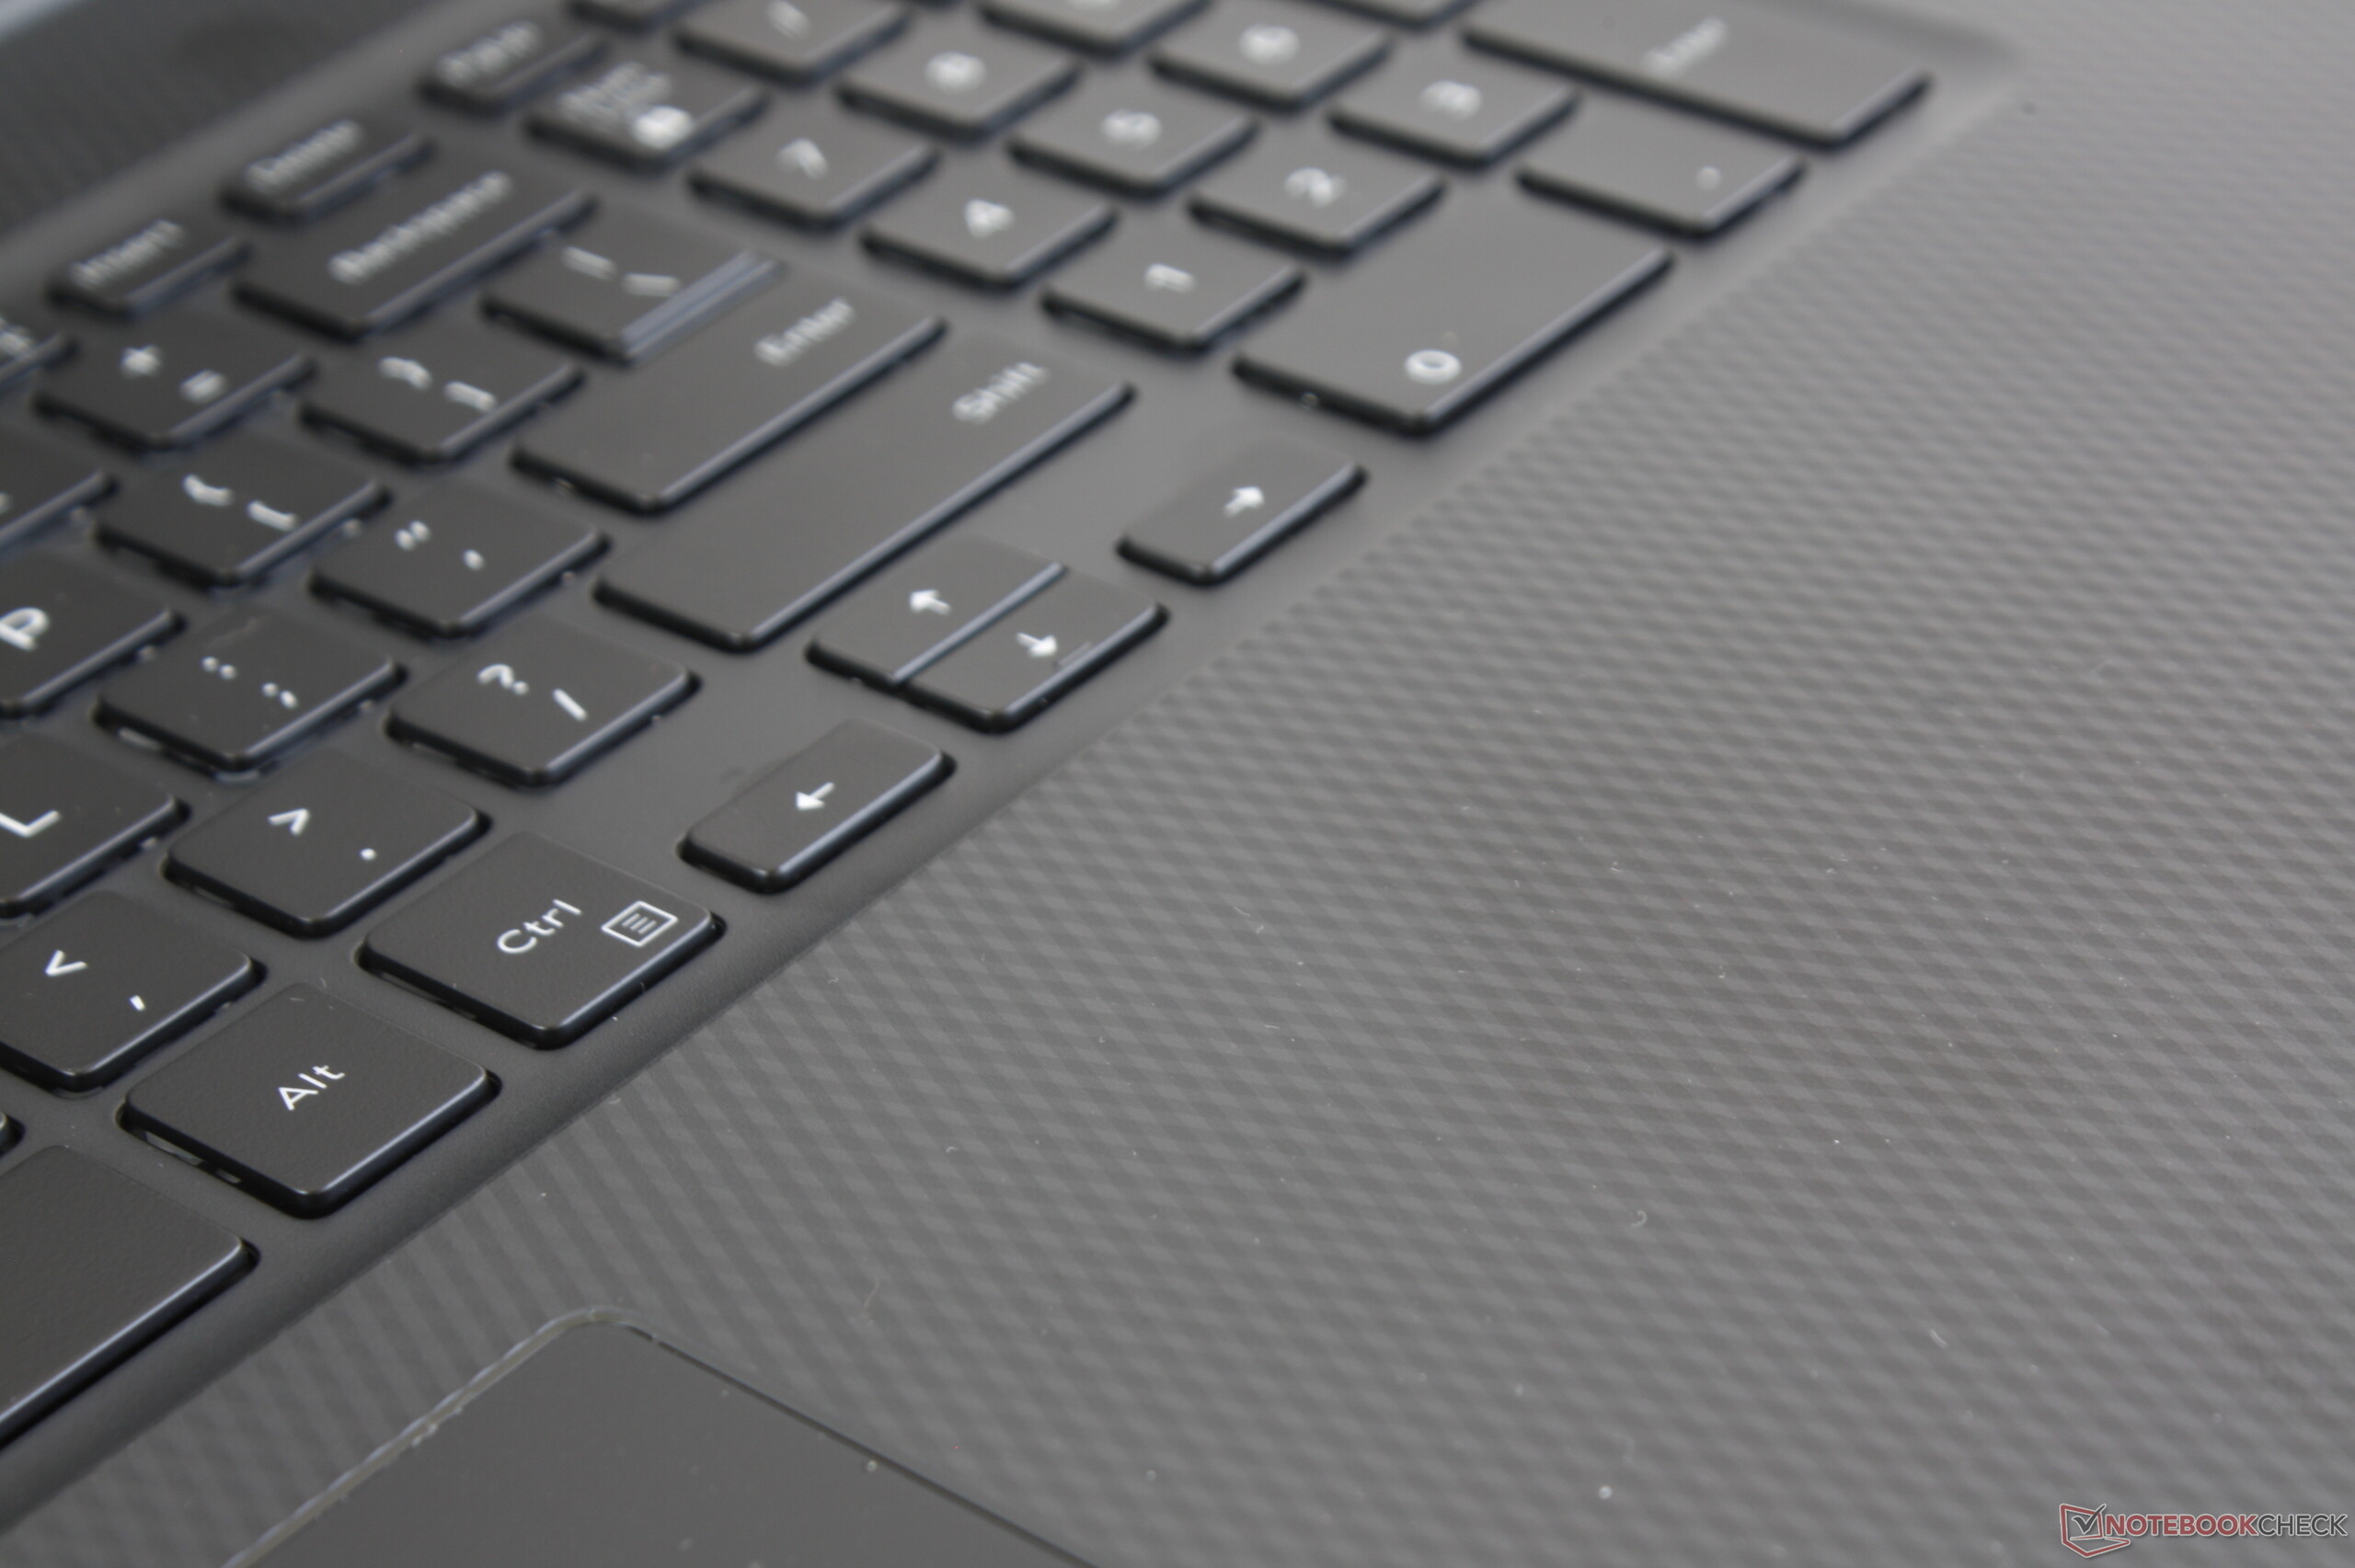
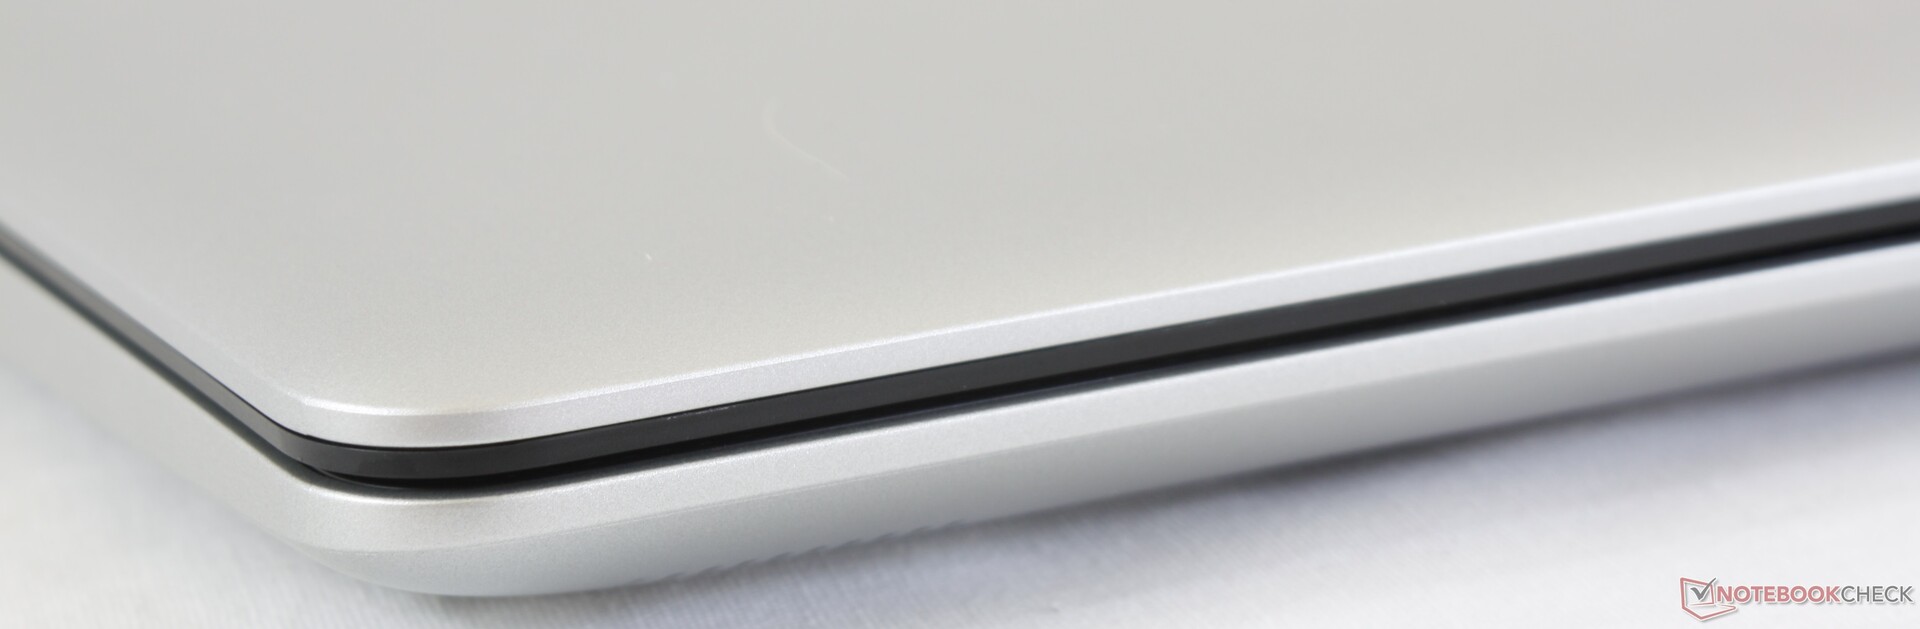
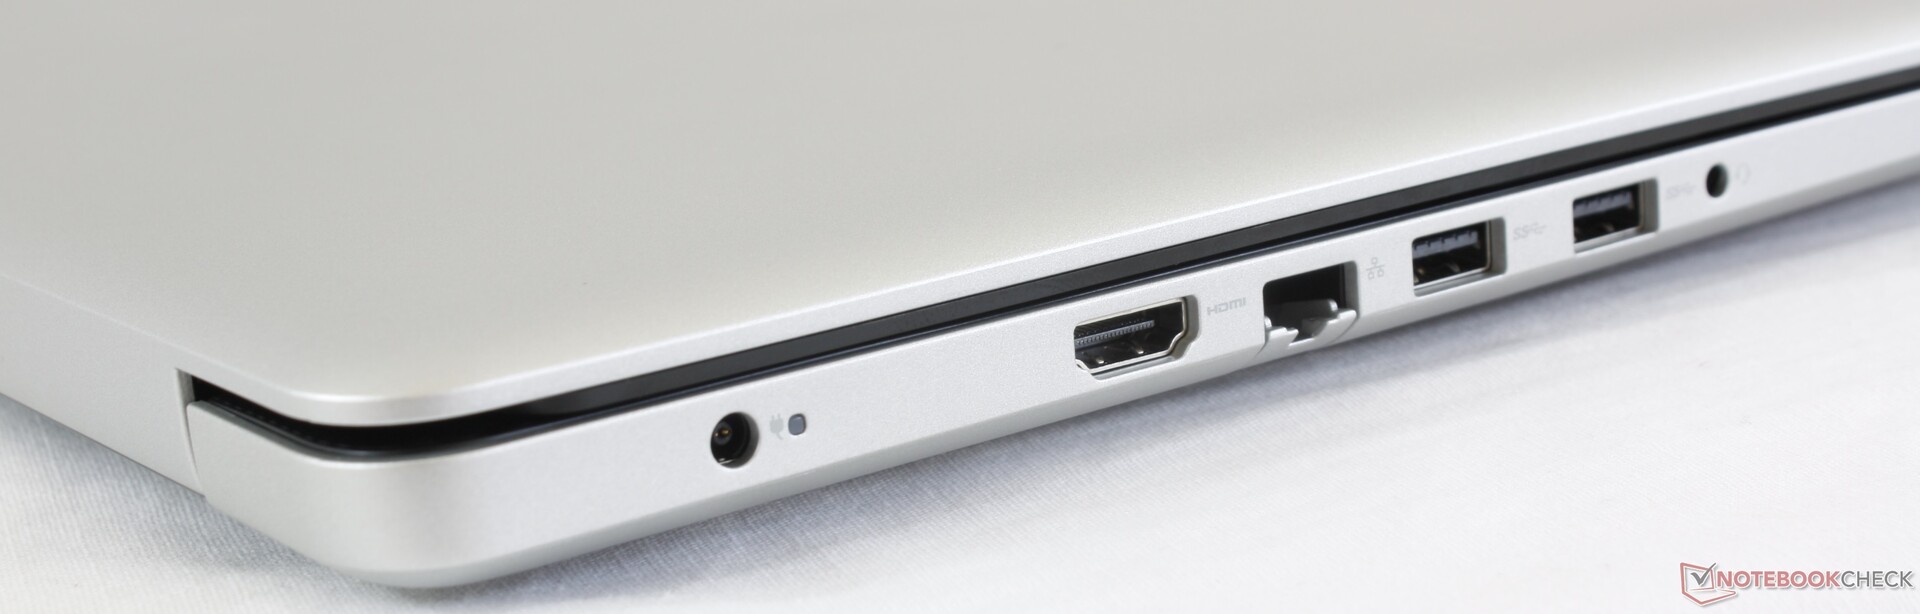
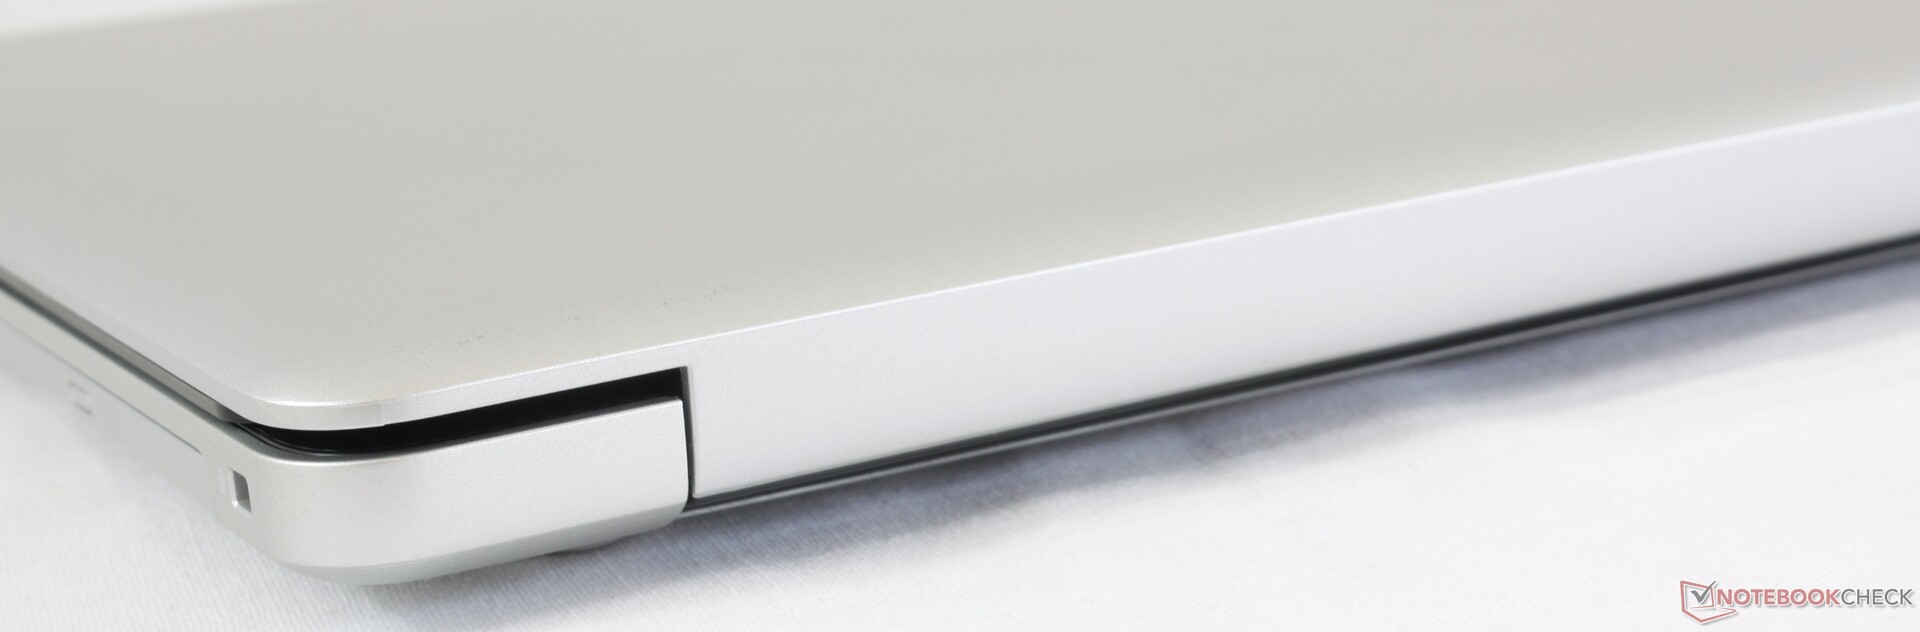
Esperamos que as futuras revisões abordem algumas das principais desvantagens sem precisar aumentar o preço. Ou seja, os marcos grossos, o clickpad suave, as teclas suaves do teclado numérico, e falta de USB Type-C, todos os dificultam a experiência do usuário e versatilidade do sistema.
Evite a configuração com Radeon 520 e o acessível Inspiron 17 3780 será um portátil decente para casa, para tarefas básicas e streaming de vídeo. Invista em um SSD em vez da opção Core i7 para obter um desempenho do sistema mais rápido.
Dell Inspiron 17 3780
- 05/11/2019 v6 (old)
Allen Ngo
Price comparison
