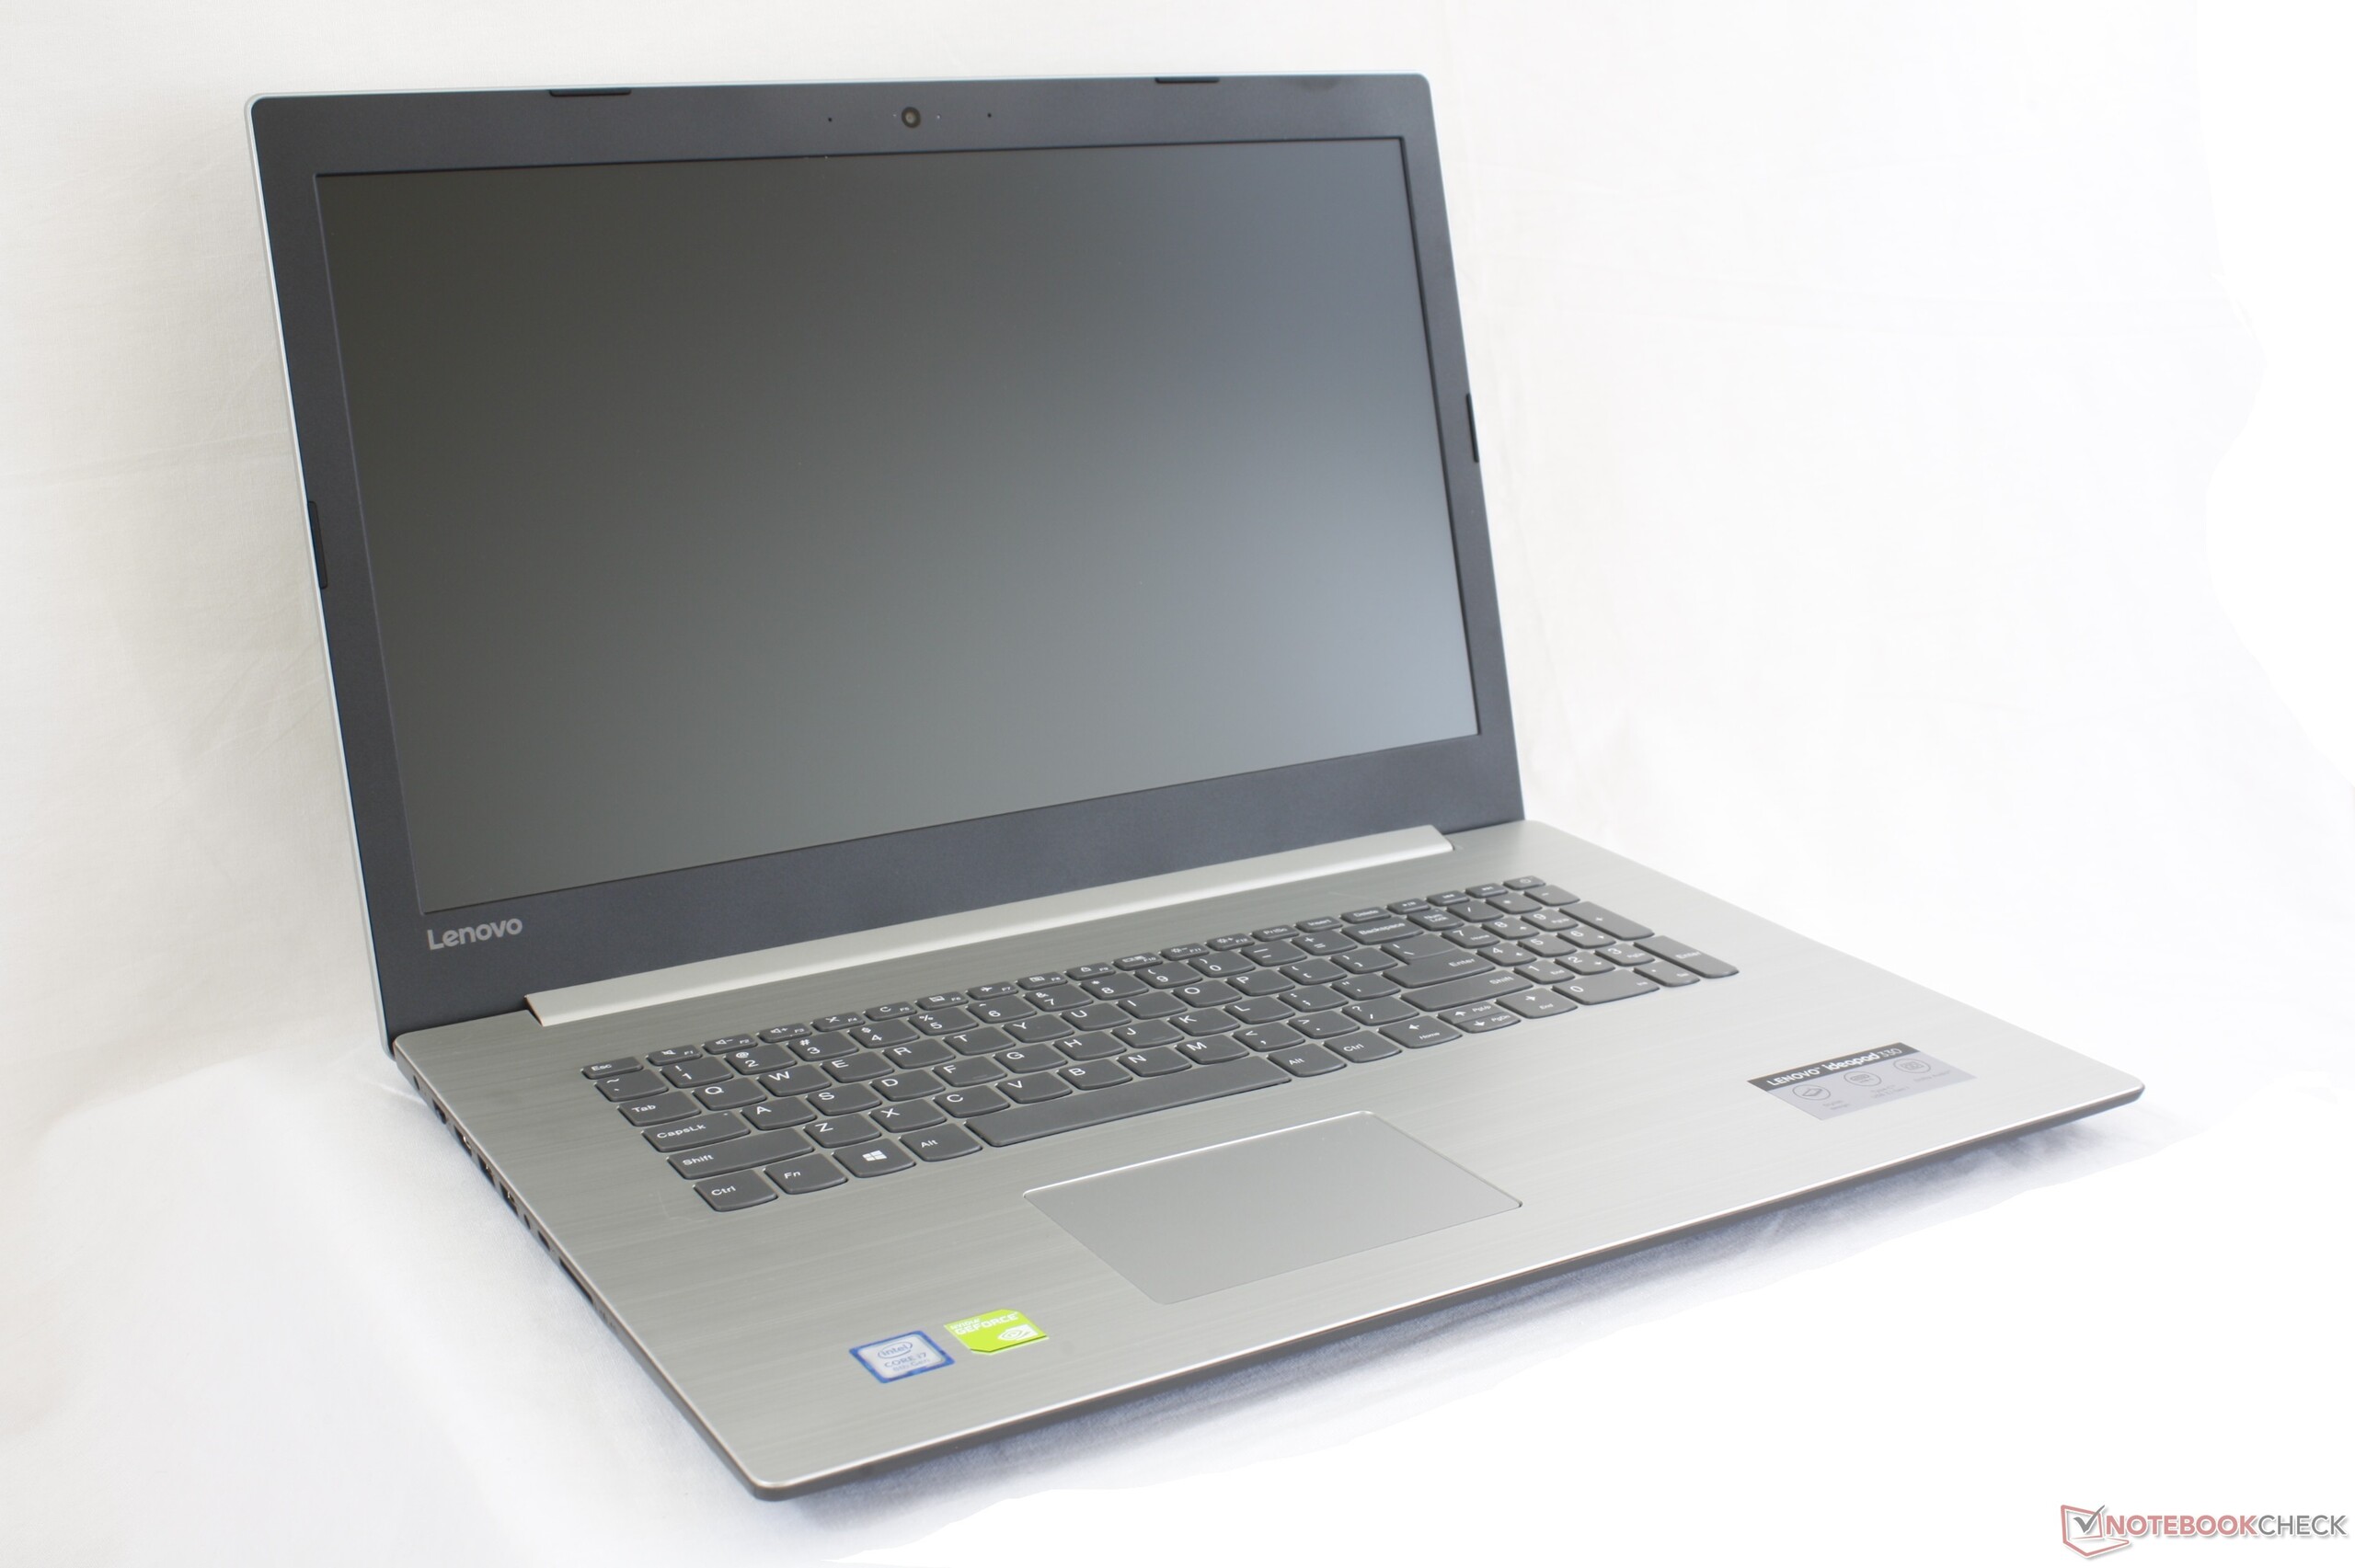
Breve Análise do Portátil Lenovo IdeaPad 330-17IKB (i7-8550U, GeForce MX150)
| SD Card Reader | |
| average JPG Copy Test (av. of 3 runs) | |
| Asus VivoBook Pro 17 N705UD-EH76 (Toshiba Exceria Pro SDXC 64 GB UHS-II) | |
| HP Pavilion 17z 1EX13AV | |
| Lenovo IdeaPad 330-17IKB 81DM (Toshiba Exceria Pro SDXC 64 GB UHS-II) | |
| Dell Inspiron 17-7786 (Toshiba Exceria Pro SDXC 64 GB UHS-II) | |
| Acer Aspire ES1-732-P7YA (Toshiba Exceria Pro SDXC 64 GB UHS-II) | |
| maximum AS SSD Seq Read Test (1GB) | |
| HP Pavilion 17z 1EX13AV | |
| Asus VivoBook Pro 17 N705UD-EH76 (Toshiba Exceria Pro SDXC 64 GB UHS-II) | |
| Dell Inspiron 17-7786 (Toshiba Exceria Pro SDXC 64 GB UHS-II) | |
| Lenovo IdeaPad 330-17IKB 81DM (Toshiba Exceria Pro SDXC 64 GB UHS-II) | |
| Acer Aspire ES1-732-P7YA (Toshiba Exceria Pro SDXC 64 GB UHS-II) | |
| |||||||||||||||||||||||||
iluminação: 94 %
iluminação com acumulador: 210.5 cd/m²
Contraste: 334:1 (Preto: 0.63 cd/m²)
ΔE ColorChecker Calman: 9.48 | ∀{0.5-29.43 Ø4.71}
calibrated: 4.04
ΔE Greyscale Calman: 12 | ∀{0.09-98 Ø4.96}
75.8% sRGB (Argyll 1.6.3 3D)
49.4% AdobeRGB 1998 (Argyll 1.6.3 3D)
55.9% AdobeRGB 1998 (Argyll 3D)
76.3% sRGB (Argyll 3D)
56.9% Display P3 (Argyll 3D)
Gamma: 2.12
CCT: 13874 K
| Lenovo IdeaPad 330-17IKB 81DM BOE0685, TN LED, 17.3", 1600x900 | Dell Inspiron 17-7786 LG Philips, 173W4F, IPS, 17.3", 1920x1080 | Acer Aspire ES1-732-P7YA Chi Mei N173FGE-E23, TN LED, 17.3", 1600x900 | Asus VivoBook Pro 17 N705UD-EH76 LP173WF4-SPF5, IPS, 17.3", 1920x1080 | HP Pavilion 17z 1EX13AV ID: AUO109D, Name: AU Optronics B173HW01 V0, IPS, 17.3", 1920x1080 | Lenovo IdeaPad V110-17IKB 80V20006GE BOE, TN LED, 17.3", 1600x900 | |
|---|---|---|---|---|---|---|
| Display | 9% | -1% | 16% | 14% | 0% | |
| Display P3 Coverage (%) | 56.9 | 64.8 14% | 53.5 -6% | 67.9 19% | 64.8 14% | 56.6 -1% |
| sRGB Coverage (%) | 76.3 | 81.6 7% | 80.1 5% | 86.8 14% | 87.5 15% | 77.2 1% |
| AdobeRGB 1998 Coverage (%) | 55.9 | 59.7 7% | 54.9 -2% | 63.5 14% | 64 14% | 56.5 1% |
| Response Times | -49% | -18% | -25% | -44% | -49% | |
| Response Time Grey 50% / Grey 80% * (ms) | 38.8 ? | 38 ? 2% | 49 ? -26% | 30.8 ? 21% | 34 ? 12% | 44 ? -13% |
| Response Time Black / White * (ms) | 13.6 ? | 27 ? -99% | 15 ? -10% | 23.2 ? -71% | 27.2 ? -100% | 25 ? -84% |
| PWM Frequency (Hz) | 961 | 119000 ? | 50 ? | |||
| Screen | 50% | 35% | 49% | 51% | -9% | |
| Brightness middle (cd/m²) | 210.5 | 343 63% | 227 8% | 376.2 79% | 363.6 73% | 213 1% |
| Brightness (cd/m²) | 204 | 313 53% | 209 2% | 355 74% | 349 71% | 203 0% |
| Brightness Distribution (%) | 94 | 82 -13% | 80 -15% | 89 -5% | 90 -4% | 86 -9% |
| Black Level * (cd/m²) | 0.63 | 0.37 41% | 0.15 76% | 0.42 33% | 0.37 41% | 0.67 -6% |
| Contrast (:1) | 334 | 927 178% | 1513 353% | 896 168% | 983 194% | 318 -5% |
| Colorchecker dE 2000 * | 9.48 | 4.8 49% | 12.93 -36% | 4.21 56% | 5.8 39% | 12.3 -30% |
| Colorchecker dE 2000 max. * | 17.19 | 10.35 40% | 20.92 -22% | 8.31 52% | 10 42% | 21.48 -25% |
| Colorchecker dE 2000 calibrated * | 4.04 | 3.95 2% | ||||
| Greyscale dE 2000 * | 12 | 3.51 71% | 14.69 -22% | 5.5 54% | 8.8 27% | 14.13 -18% |
| Gamma | 2.12 104% | 2.19 100% | 2.38 92% | 2.335 94% | 2.16 102% | 2.11 104% |
| CCT | 13874 47% | 6188 105% | 19863 33% | 7056 92% | 5900 110% | 17705 37% |
| Color Space (Percent of AdobeRGB 1998) (%) | 49.4 | 54 9% | 51 3% | 57 15% | 57.2 16% | 50 1% |
| Color Space (Percent of sRGB) (%) | 75.8 | 81 7% | 80 6% | 87 15% | 87.3 15% | 77 2% |
| Média Total (Programa/Configurações) | 3% /
29% | 5% /
21% | 13% /
34% | 7% /
31% | -19% /
-12% |
* ... menor é melhor
Exibir tempos de resposta
| ↔ Tempo de resposta preto para branco | ||
|---|---|---|
| 13.6 ms ... ascensão ↗ e queda ↘ combinadas | ↗ 8.4 ms ascensão | 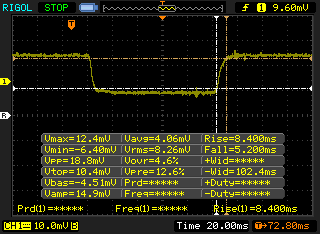 |
| ↘ 5.2 ms queda | ||
| A tela mostra boas taxas de resposta em nossos testes, mas pode ser muito lenta para jogadores competitivos. Em comparação, todos os dispositivos testados variam de 0.1 (mínimo) a 240 (máximo) ms. » 34 % de todos os dispositivos são melhores. Isso significa que o tempo de resposta medido é melhor que a média de todos os dispositivos testados (19.8 ms). | ||
| ↔ Tempo de resposta 50% cinza a 80% cinza | ||
| 38.8 ms ... ascensão ↗ e queda ↘ combinadas | ↗ 20 ms ascensão | 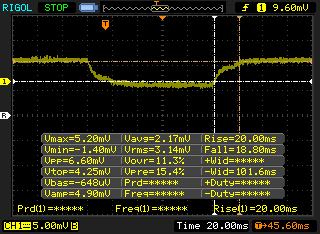 |
| ↘ 18.8 ms queda | ||
| A tela mostra taxas de resposta lentas em nossos testes e será insatisfatória para os jogadores. Em comparação, todos os dispositivos testados variam de 0.165 (mínimo) a 636 (máximo) ms. » 58 % de todos os dispositivos são melhores. Isso significa que o tempo de resposta medido é pior que a média de todos os dispositivos testados (30.9 ms). | ||
Cintilação da tela / PWM (modulação por largura de pulso)
| Tela tremeluzindo / PWM não detectado | 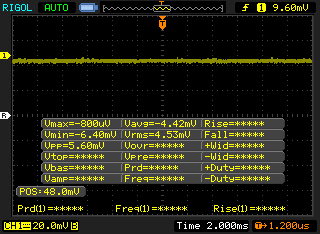 | ||
[pwm_comparison] Em comparação: 52 % de todos os dispositivos testados não usam PWM para escurecer a tela. Se PWM foi detectado, uma média de 7748 (mínimo: 5 - máximo: 343500) Hz foi medida. | |||
| Cinebench R15 | |
| CPU Single 64Bit | |
| Lenovo Legion Y740-15ICHg | |
| Lenovo Yoga S730-13IWL | |
| Lenovo IdeaPad 330-17IKB 81DM | |
| Lenovo ThinkPad T480-20L6S01V00 | |
| Média Intel Core i7-8550U (108 - 172, n=76) | |
| Lenovo Legion Y520-15IKBA-80WY001VGE | |
| Lenovo ThinkPad 13 20J1005TPB | |
| Acer Swift 3 SF313-51-59SZ | |
| Lenovo ThinkPad A285-20MX0002GE | |
| Lenovo Ideapad 330-15IKB-81DC00SWGE | |
| CPU Multi 64Bit | |
| Lenovo Legion Y740-15ICHg | |
| Lenovo ThinkPad T480-20L6S01V00 | |
| Lenovo Yoga S730-13IWL | |
| Acer Swift 3 SF313-51-59SZ | |
| Média Intel Core i7-8550U (301 - 761, n=78) | |
| Lenovo IdeaPad 330-17IKB 81DM | |
| Lenovo ThinkPad A285-20MX0002GE | |
| Lenovo Legion Y520-15IKBA-80WY001VGE | |
| Lenovo ThinkPad 13 20J1005TPB | |
| Lenovo Ideapad 330-15IKB-81DC00SWGE | |
| PCMark 10 | |
| Score | |
| Dell Inspiron 17-7786 | |
| Asus VivoBook S15 S530UN-BQ097T | |
| Média Intel Core i7-8550U, NVIDIA GeForce MX150 (3056 - 4106, n=19) | |
| Lenovo IdeaPad 330-17IKB 81DM | |
| HP Pavilion 17z 1EX13AV | |
| Acer Aspire ES1-732-P7YA | |
| Essentials | |
| Dell Inspiron 17-7786 | |
| Média Intel Core i7-8550U, NVIDIA GeForce MX150 (5448 - 8412, n=19) | |
| Asus VivoBook S15 S530UN-BQ097T | |
| Lenovo IdeaPad 330-17IKB 81DM | |
| HP Pavilion 17z 1EX13AV | |
| Acer Aspire ES1-732-P7YA | |
| Productivity | |
| Dell Inspiron 17-7786 | |
| Asus VivoBook S15 S530UN-BQ097T | |
| Média Intel Core i7-8550U, NVIDIA GeForce MX150 (4779 - 7244, n=19) | |
| Lenovo IdeaPad 330-17IKB 81DM | |
| HP Pavilion 17z 1EX13AV | |
| Acer Aspire ES1-732-P7YA | |
| Digital Content Creation | |
| Dell Inspiron 17-7786 | |
| Asus VivoBook S15 S530UN-BQ097T | |
| Lenovo IdeaPad 330-17IKB 81DM | |
| Média Intel Core i7-8550U, NVIDIA GeForce MX150 (2036 - 3518, n=19) | |
| HP Pavilion 17z 1EX13AV | |
| Acer Aspire ES1-732-P7YA | |
| PCMark 8 | |
| Home Score Accelerated v2 | |
| Dell Inspiron 17-7786 | |
| Lenovo IdeaPad 330-17IKB 81DM | |
| Média Intel Core i7-8550U, NVIDIA GeForce MX150 (3145 - 4130, n=21) | |
| Asus VivoBook S15 S530UN-BQ097T | |
| Lenovo IdeaPad V110-17IKB 80V20006GE | |
| HP Pavilion 17z 1EX13AV | |
| Acer Aspire ES1-732-P7YA | |
| Work Score Accelerated v2 | |
| Dell Inspiron 17-7786 | |
| Asus VivoBook S15 S530UN-BQ097T | |
| Lenovo IdeaPad 330-17IKB 81DM | |
| Média Intel Core i7-8550U, NVIDIA GeForce MX150 (4063 - 5228, n=20) | |
| HP Pavilion 17z 1EX13AV | |
| Acer Aspire ES1-732-P7YA | |
| PCMark 8 Home Score Accelerated v2 | 3724 pontos | |
| PCMark 8 Work Score Accelerated v2 | 4837 pontos | |
| PCMark 10 Score | 3339 pontos | |
Ajuda | ||
| Lenovo IdeaPad 330-17IKB 81DM WDC Blue WD10SPZX-24Z10T0 | Dell Inspiron 17-7786 KBG30ZMS128G | Acer Aspire ES1-732-P7YA Toshiba MQ01ABD100 | Asus VivoBook Pro 17 N705UD-EH76 Samsung PM961 NVMe MZVLW512HMJP | HP Pavilion 17z 1EX13AV Avolusion MD1TBLSSHD | |
|---|---|---|---|---|---|
| CrystalDiskMark 5.2 / 6 | 7306% | 9% | 19592% | 14% | |
| Write 4K (MB/s) | 10.42 | 71.3 584% | 1.167 -89% | 151.3 1352% | 1.322 -87% |
| Read 4K (MB/s) | 0.416 | 33.43 7936% | 0.443 6% | 46.62 11107% | 0.545 31% |
| Write Seq (MB/s) | 116.4 | 127.3 9% | 123.3 6% | 1020 776% | 89.1 -23% |
| Read Seq (MB/s) | 76.8 | 816 963% | 123.9 61% | 935 1117% | 91.4 19% |
| Write 4K Q32T1 (MB/s) | 14.15 | 94.6 569% | 1.163 -92% | 452.3 3096% | 1.239 -91% |
| Read 4K Q32T1 (MB/s) | 0.417 | 196.7 47070% | 0.885 112% | 559 133953% | 1.548 271% |
| Write Seq Q32T1 (MB/s) | 108.1 | 130.6 21% | 121.9 13% | 1614 1393% | 90.3 -16% |
| Read Seq Q32T1 (MB/s) | 79.6 | 1110 1294% | 124.3 56% | 3220 3945% | 88.3 11% |
| Write 4K Q8T8 (MB/s) | 98 | ||||
| Read 4K Q8T8 (MB/s) | 209.4 |

| 3DMark | |
| 1280x720 Cloud Gate Standard Graphics | |
| Lenovo Legion Y520-15IKBA-80WY001VGE | |
| Asus VivoBook Pro 17 N705UD-EH76 | |
| Razer Blade Stealth i7-8565U | |
| Lenovo IdeaPad 330-17IKB 81DM | |
| Média NVIDIA GeForce MX150 (16227 - 22183, n=43) | |
| Lenovo ThinkPad A285-20MX0002GE | |
| Lenovo IdeaPad Flex-1570 81CA000RUS | |
| Lenovo Yoga C930-13IKB 81C4 | |
| Lenovo ThinkPad X1 Carbon 2018-20KGS5DU00 | |
| Lenovo ThinkPad 13 20J1005TPB | |
| HP Pavilion 17z 1EX13AV | |
| Acer Aspire ES1-732-P7YA | |
| 1920x1080 Fire Strike Graphics | |
| Asus VivoBook Pro 17 N705UD-EH76 | |
| Lenovo Legion Y520-15IKBA-80WY001VGE | |
| Razer Blade Stealth i7-8565U | |
| Lenovo IdeaPad 330-17IKB 81DM | |
| Média NVIDIA GeForce MX150 (2323 - 3739, n=44) | |
| Lenovo IdeaPad Flex-1570 81CA000RUS | |
| Lenovo ThinkPad A285-20MX0002GE | |
| Lenovo ThinkPad X1 Carbon 2018-20KGS5DU00 | |
| HP Pavilion 17z 1EX13AV | |
| Lenovo ThinkPad 13 20J1005TPB | |
| Acer Aspire ES1-732-P7YA | |
| 3DMark 11 | |
| 1280x720 Performance GPU | |
| Lenovo Legion Y520-15IKBA-80WY001VGE | |
| Asus VivoBook Pro 17 N705UD-EH76 | |
| Razer Blade Stealth i7-8565U | |
| Lenovo IdeaPad 330-17IKB 81DM | |
| Média NVIDIA GeForce MX150 (2796 - 4905, n=47) | |
| Lenovo ThinkPad A285-20MX0002GE | |
| Lenovo IdeaPad Flex-1570 81CA000RUS | |
| HP Pavilion 17z 1EX13AV | |
| Lenovo Yoga C930-13IKB 81C4 | |
| Lenovo IdeaPad V110-17IKB 80V20006GE | |
| Lenovo ThinkPad 13 20J1005TPB | |
| Acer Aspire ES1-732-P7YA | |
| 1280x720 Performance Combined | |
| Asus VivoBook Pro 17 N705UD-EH76 | |
| Lenovo Legion Y520-15IKBA-80WY001VGE | |
| Razer Blade Stealth i7-8565U | |
| Lenovo IdeaPad 330-17IKB 81DM | |
| Média NVIDIA GeForce MX150 (2820 - 4421, n=46) | |
| Lenovo IdeaPad Flex-1570 81CA000RUS | |
| Lenovo ThinkPad A285-20MX0002GE | |
| Lenovo Yoga C930-13IKB 81C4 | |
| HP Pavilion 17z 1EX13AV | |
| Lenovo IdeaPad V110-17IKB 80V20006GE | |
| Lenovo ThinkPad 13 20J1005TPB | |
| Acer Aspire ES1-732-P7YA | |
| 3DMark 11 Performance | 4899 pontos | |
| 3DMark Cloud Gate Standard Score | 12510 pontos | |
| 3DMark Fire Strike Score | 3276 pontos | |
Ajuda | ||
| The Witcher 3 - 1366x768 Medium Graphics & Postprocessing | |
| Asus GL552VW-DK725T | |
| Razer Blade Stealth i7-8565U | |
| Asus ZenBook UX530UX-FY070T | |
| Média NVIDIA GeForce MX150 (24.4 - 43.2, n=26) | |
| Lenovo IdeaPad 330-17IKB 81DM | |
| Asus VivoBook S410UQ-NH74 | |
| HP ProBook 450 G6-5TJ93EA | |
| baixo | média | alto | ultra | |
|---|---|---|---|---|
| BioShock Infinite (2013) | 162.8 | 96.8 | 82.8 | |
| The Witcher 3 (2015) | 59.7 | 30.4 | ||
| Rise of the Tomb Raider (2016) | 74.8 | 40.7 |
| Lenovo IdeaPad 330-17IKB 81DM GeForce MX150, i5-8550U, WDC Blue WD10SPZX-24Z10T0 | Dell Inspiron 17-7786 GeForce MX150, i7-8565U, KBG30ZMS128G | Acer Aspire ES1-732-P7YA HD Graphics 505, Pentium N4200, Toshiba MQ01ABD100 | Asus VivoBook Pro 17 N705UD-EH76 GeForce GTX 1050 Mobile, i5-8550U, Samsung PM961 NVMe MZVLW512HMJP | HP Pavilion 17z 1EX13AV Radeon 530, A9-9420, Avolusion MD1TBLSSHD | Lenovo IdeaPad V110-17IKB 80V20006GE HD Graphics 620, i5-7200U, WDC Scorpio Blue WD10JPCX-24UE4T0 | |
|---|---|---|---|---|---|---|
| Noise | -1% | -1% | -1% | -9% | 1% | |
| desligado / ambiente * (dB) | 28.6 | 30.3 -6% | 30.2 -6% | 28.3 1% | 28 2% | 30.5 -7% |
| Idle Minimum * (dB) | 29 | 30.7 -6% | 31 -7% | 28.3 2% | 30.5 -5% | 31.2 -8% |
| Idle Average * (dB) | 29 | 30.7 -6% | 31 -7% | 29 -0% | 30.6 -6% | 31.2 -8% |
| Idle Maximum * (dB) | 31.8 | 30.7 3% | 31 3% | 29 9% | 30.6 4% | 31.2 2% |
| Load Average * (dB) | 34.8 | 33.4 4% | 35.1 -1% | 36.7 -5% | 41.6 -20% | 32.6 6% |
| Witcher 3 ultra * (dB) | 39.9 | 44.7 -12% | 48 -20% | |||
| Load Maximum * (dB) | 40.8 | 38.7 5% | 35.1 14% | 42.8 -5% | 48 -18% | 32.6 20% |
* ... menor é melhor
Barulho
| Ocioso |
| 29 / 29 / 31.8 dB |
| Carga |
| 34.8 / 40.8 dB |
 | ||
30 dB silencioso 40 dB(A) audível 50 dB(A) ruidosamente alto |
||
min: | ||
(-) A temperatura máxima no lado superior é 47.4 °C / 117 F, em comparação com a média de 36.8 °C / 98 F , variando de 21 a 71 °C para a classe Multimedia.
(-) A parte inferior aquece até um máximo de 51 °C / 124 F, em comparação com a média de 39.1 °C / 102 F
(+) Em uso inativo, a temperatura média para o lado superior é 26.7 °C / 80 F, em comparação com a média do dispositivo de 31.3 °C / ### class_avg_f### F.
(+) Jogando The Witcher 3, a temperatura média para o lado superior é 30.4 °C / 87 F, em comparação com a média do dispositivo de 31.3 °C / ## #class_avg_f### F.
(+) Os apoios para as mãos e o touchpad são mais frios que a temperatura da pele, com um máximo de 30 °C / 86 F e, portanto, são frios ao toque.
(±) A temperatura média da área do apoio para as mãos de dispositivos semelhantes foi 28.7 °C / 83.7 F (-1.3 °C / -2.3 F).
Lenovo IdeaPad 330-17IKB 81DM análise de áudio
(±) | o volume do alto-falante é médio, mas bom (###valor### dB)
Graves 100 - 315Hz
(-) | quase nenhum baixo - em média 17.5% menor que a mediana
(±) | a linearidade dos graves é média (13.2% delta para a frequência anterior)
Médios 400 - 2.000 Hz
(+) | médios equilibrados - apenas 2.5% longe da mediana
(±) | a linearidade dos médios é média (9.4% delta para frequência anterior)
Altos 2 - 16 kHz
(±) | máximos mais altos - em média 5.4% maior que a mediana
(±) | a linearidade dos máximos é média (8.5% delta para frequência anterior)
Geral 100 - 16.000 Hz
(±) | a linearidade do som geral é média (22.8% diferença em relação à mediana)
Comparado com a mesma classe
» 81% de todos os dispositivos testados nesta classe foram melhores, 5% semelhantes, 15% piores
» O melhor teve um delta de 5%, a média foi 17%, o pior foi 45%
Comparado com todos os dispositivos testados
» 68% de todos os dispositivos testados foram melhores, 5% semelhantes, 27% piores
» O melhor teve um delta de 4%, a média foi 23%, o pior foi 134%
Apple MacBook 12 (Early 2016) 1.1 GHz análise de áudio
(+) | os alto-falantes podem tocar relativamente alto (###valor### dB)
Graves 100 - 315Hz
(±) | graves reduzidos - em média 11.3% menor que a mediana
(±) | a linearidade dos graves é média (14.2% delta para a frequência anterior)
Médios 400 - 2.000 Hz
(+) | médios equilibrados - apenas 2.4% longe da mediana
(+) | médios são lineares (5.5% delta para frequência anterior)
Altos 2 - 16 kHz
(+) | agudos equilibrados - apenas 2% longe da mediana
(+) | os máximos são lineares (4.5% delta da frequência anterior)
Geral 100 - 16.000 Hz
(+) | o som geral é linear (10.2% diferença em relação à mediana)
Comparado com a mesma classe
» 7% de todos os dispositivos testados nesta classe foram melhores, 2% semelhantes, 90% piores
» O melhor teve um delta de 5%, a média foi 18%, o pior foi 53%
Comparado com todos os dispositivos testados
» 5% de todos os dispositivos testados foram melhores, 1% semelhantes, 94% piores
» O melhor teve um delta de 4%, a média foi 23%, o pior foi 134%
| desligado | |
| Ocioso | |
| Carga |
|
Key:
min: | |
| Lenovo IdeaPad 330-17IKB 81DM i5-8550U, GeForce MX150, WDC Blue WD10SPZX-24Z10T0, TN LED, 1600x900, 17.3" | Dell Inspiron 17-7786 i7-8565U, GeForce MX150, KBG30ZMS128G, IPS, 1920x1080, 17.3" | Acer Aspire ES1-732-P7YA Pentium N4200, HD Graphics 505, Toshiba MQ01ABD100, TN LED, 1600x900, 17.3" | Asus VivoBook Pro 17 N705UD-EH76 i5-8550U, GeForce GTX 1050 Mobile, Samsung PM961 NVMe MZVLW512HMJP, IPS, 1920x1080, 17.3" | HP Pavilion 17z 1EX13AV A9-9420, Radeon 530, Avolusion MD1TBLSSHD, IPS, 1920x1080, 17.3" | Lenovo IdeaPad V110-17IKB 80V20006GE i5-7200U, HD Graphics 620, WDC Scorpio Blue WD10JPCX-24UE4T0, TN LED, 1600x900, 17.3" | |
|---|---|---|---|---|---|---|
| Power Consumption | 1% | 19% | -28% | -35% | 26% | |
| Idle Minimum * (Watt) | 4.7 | 4.2 11% | 6 -28% | 5.06 -8% | 8.4 -79% | 4.2 11% |
| Idle Average * (Watt) | 9.2 | 9.4 -2% | 9.6 -4% | 10.3 -12% | 11.7 -27% | 8.4 9% |
| Idle Maximum * (Watt) | 10.6 | 12.9 -22% | 10.7 -1% | 10.7 -1% | 24.1 -127% | 9 15% |
| Load Average * (Watt) | 56.3 | 56 1% | 21.2 62% | 83 -47% | 50.4 10% | 36.7 35% |
| Witcher 3 ultra * (Watt) | 55 | 92.4 -68% | 58 -5% | |||
| Load Maximum * (Watt) | 75.3 | 63.4 16% | 26 65% | 99.9 -33% | 62.8 17% | 29.7 61% |
* ... menor é melhor
| Lenovo IdeaPad 330-17IKB 81DM i5-8550U, GeForce MX150, 34 Wh | Dell Inspiron 17-7786 i7-8565U, GeForce MX150, 56 Wh | Acer Aspire ES1-732-P7YA Pentium N4200, HD Graphics 505, 37 Wh | Asus VivoBook Pro 17 N705UD-EH76 i5-8550U, GeForce GTX 1050 Mobile, 42 Wh | HP Pavilion 17z 1EX13AV A9-9420, Radeon 530, 41.6 Wh | Lenovo IdeaPad V110-17IKB 80V20006GE i5-7200U, HD Graphics 620, 32 Wh | |
|---|---|---|---|---|---|---|
| Duração da bateria | 98% | 31% | -14% | 3% | 0% | |
| Reader / Idle (h) | 8.5 | 16.6 95% | 7.8 -8% | |||
| WiFi v1.3 (h) | 3.9 | 9 131% | 5.1 31% | 4.4 13% | 4.6 18% | 3.9 0% |
| Load (h) | 1.5 | 2.5 67% | 0.9 -40% | 1.5 0% |
Pro
Contra
O IdeaPad 330 17 não é o portátil a se ter no 2019. Enquanto sua CPU Kaby Lake-R e a GPU Pascal são comparáveis ou até melhores do que em muitos Ultrabooks, a sua tela é muito ruim. O contraste é incrivelmente fraco, a resolução é baixa, o brilho é fraco e as cores são desbotadas e granuladas. Tal painel teria sido aceitável em um portátil de orçamento há 5 anos, mas não tem lugar aqui, mesmo em uma oferta multimídia econômica.
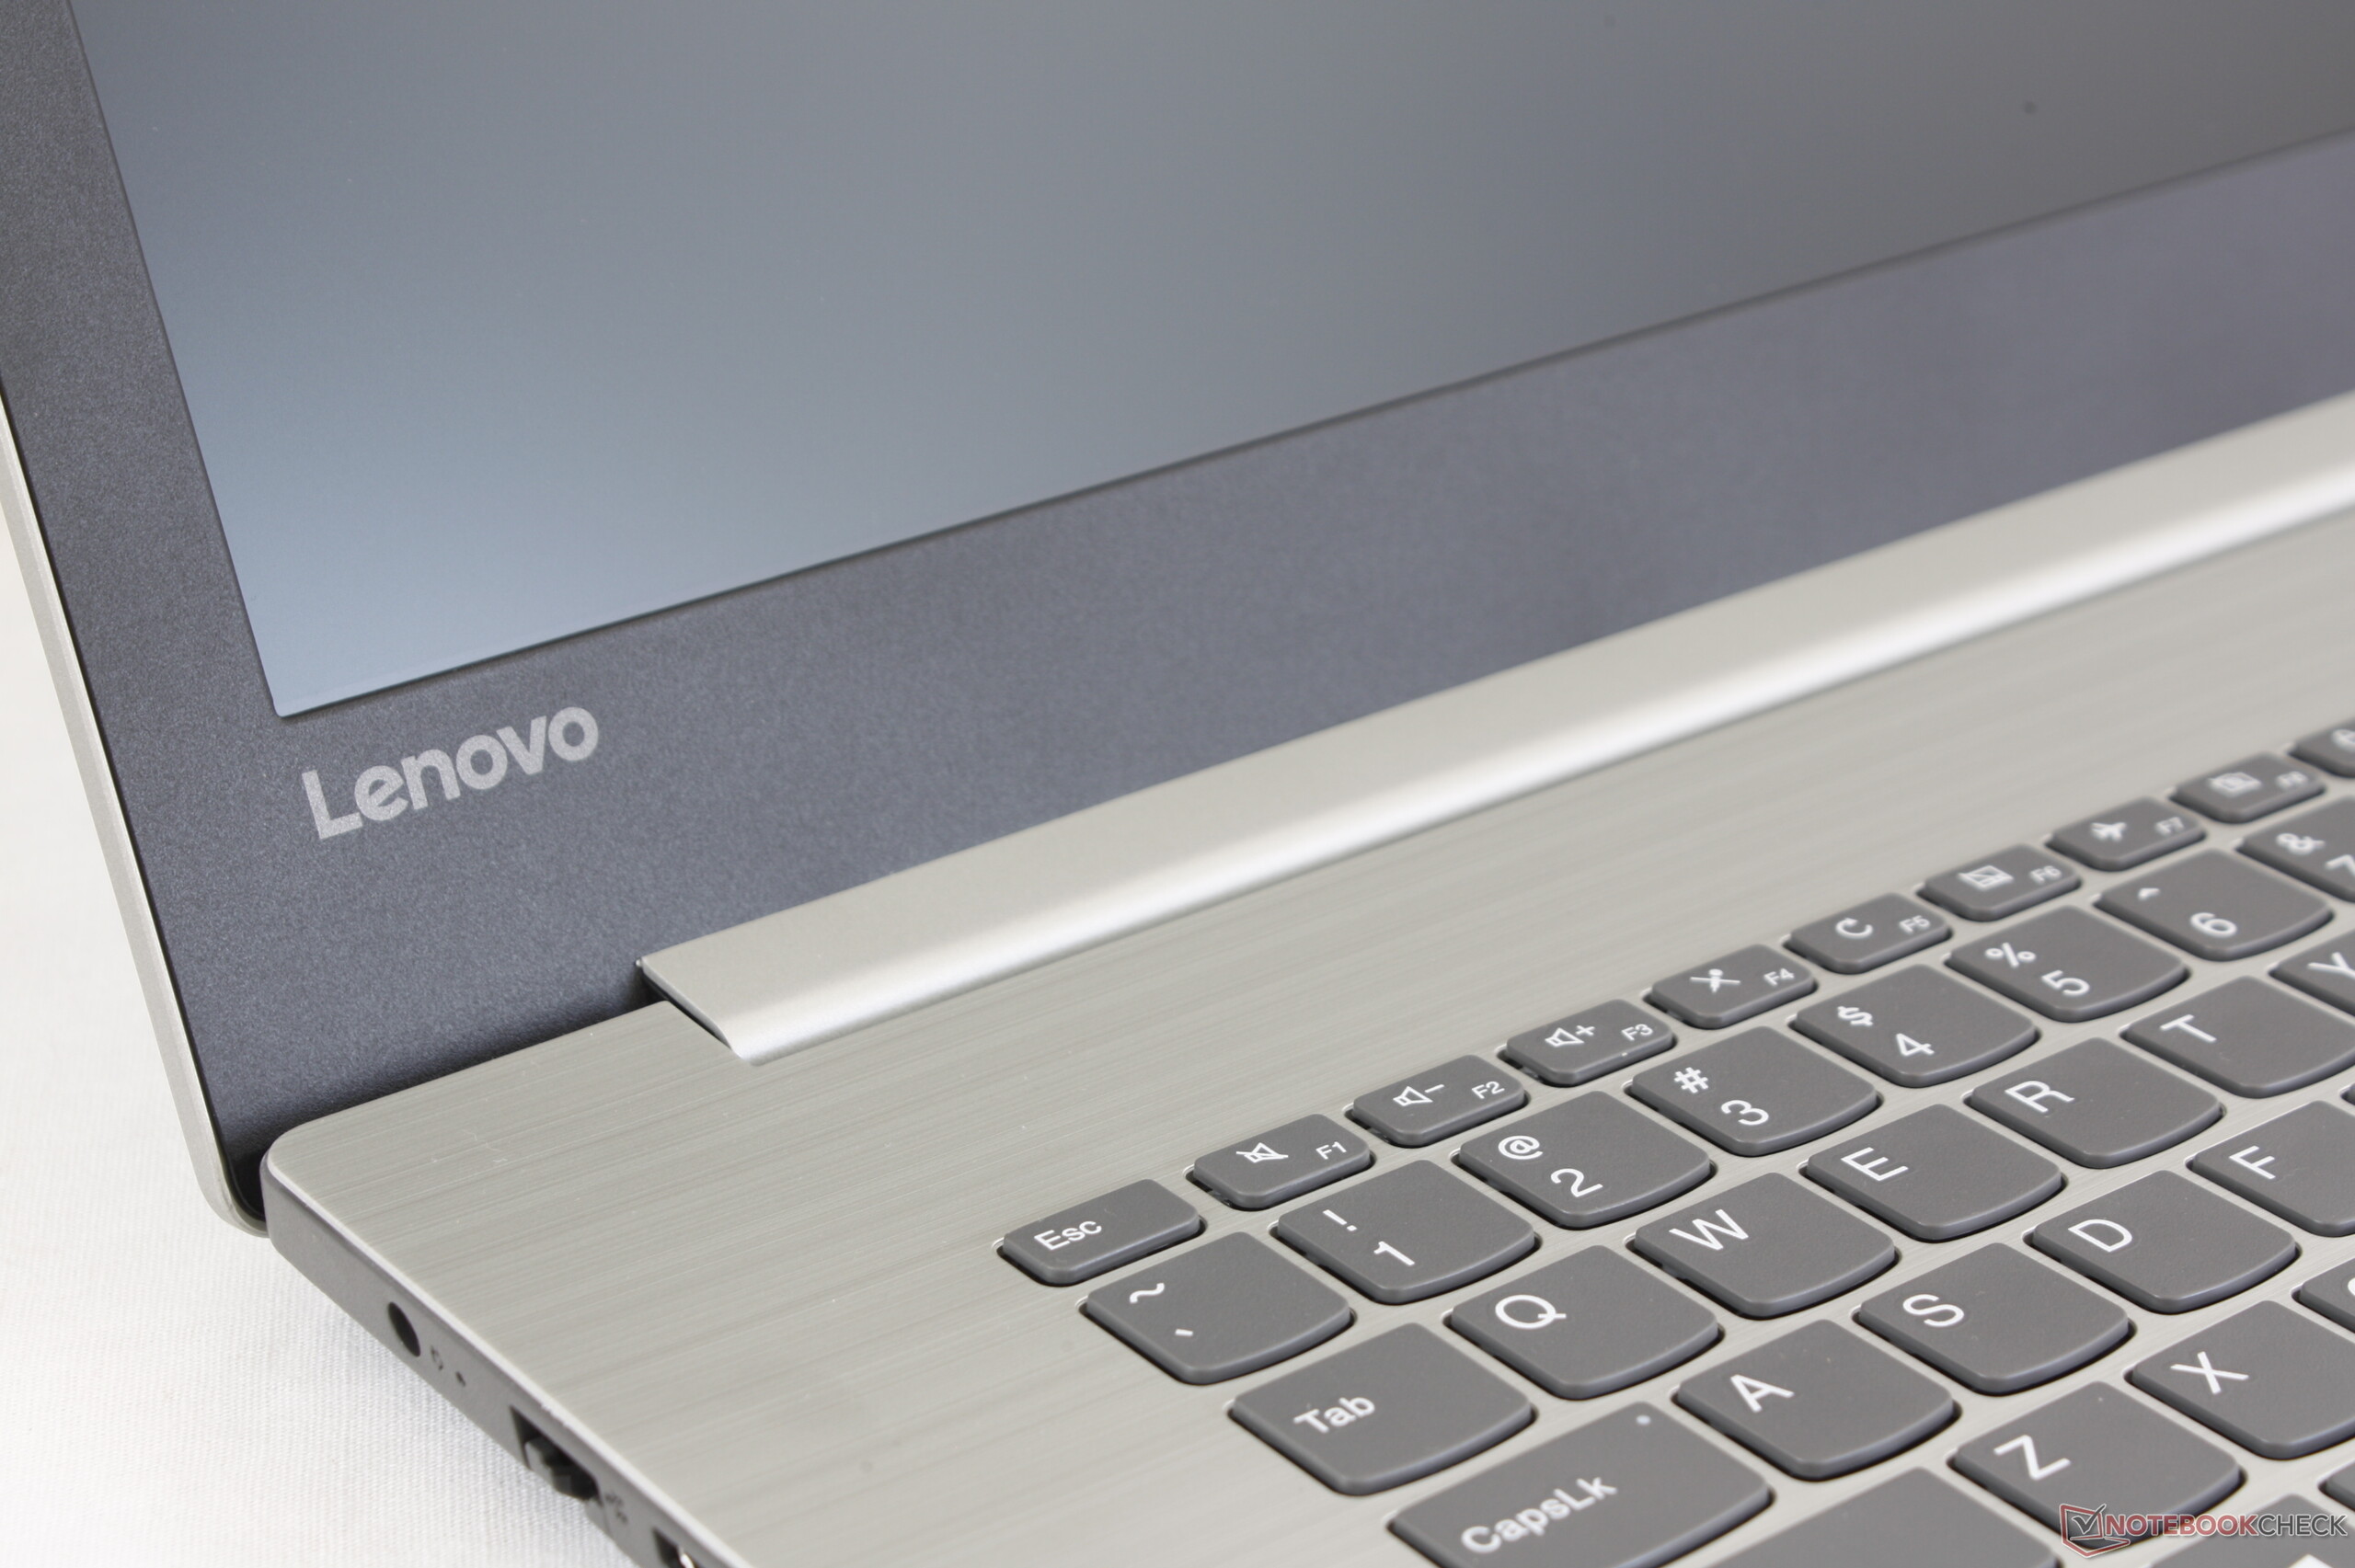
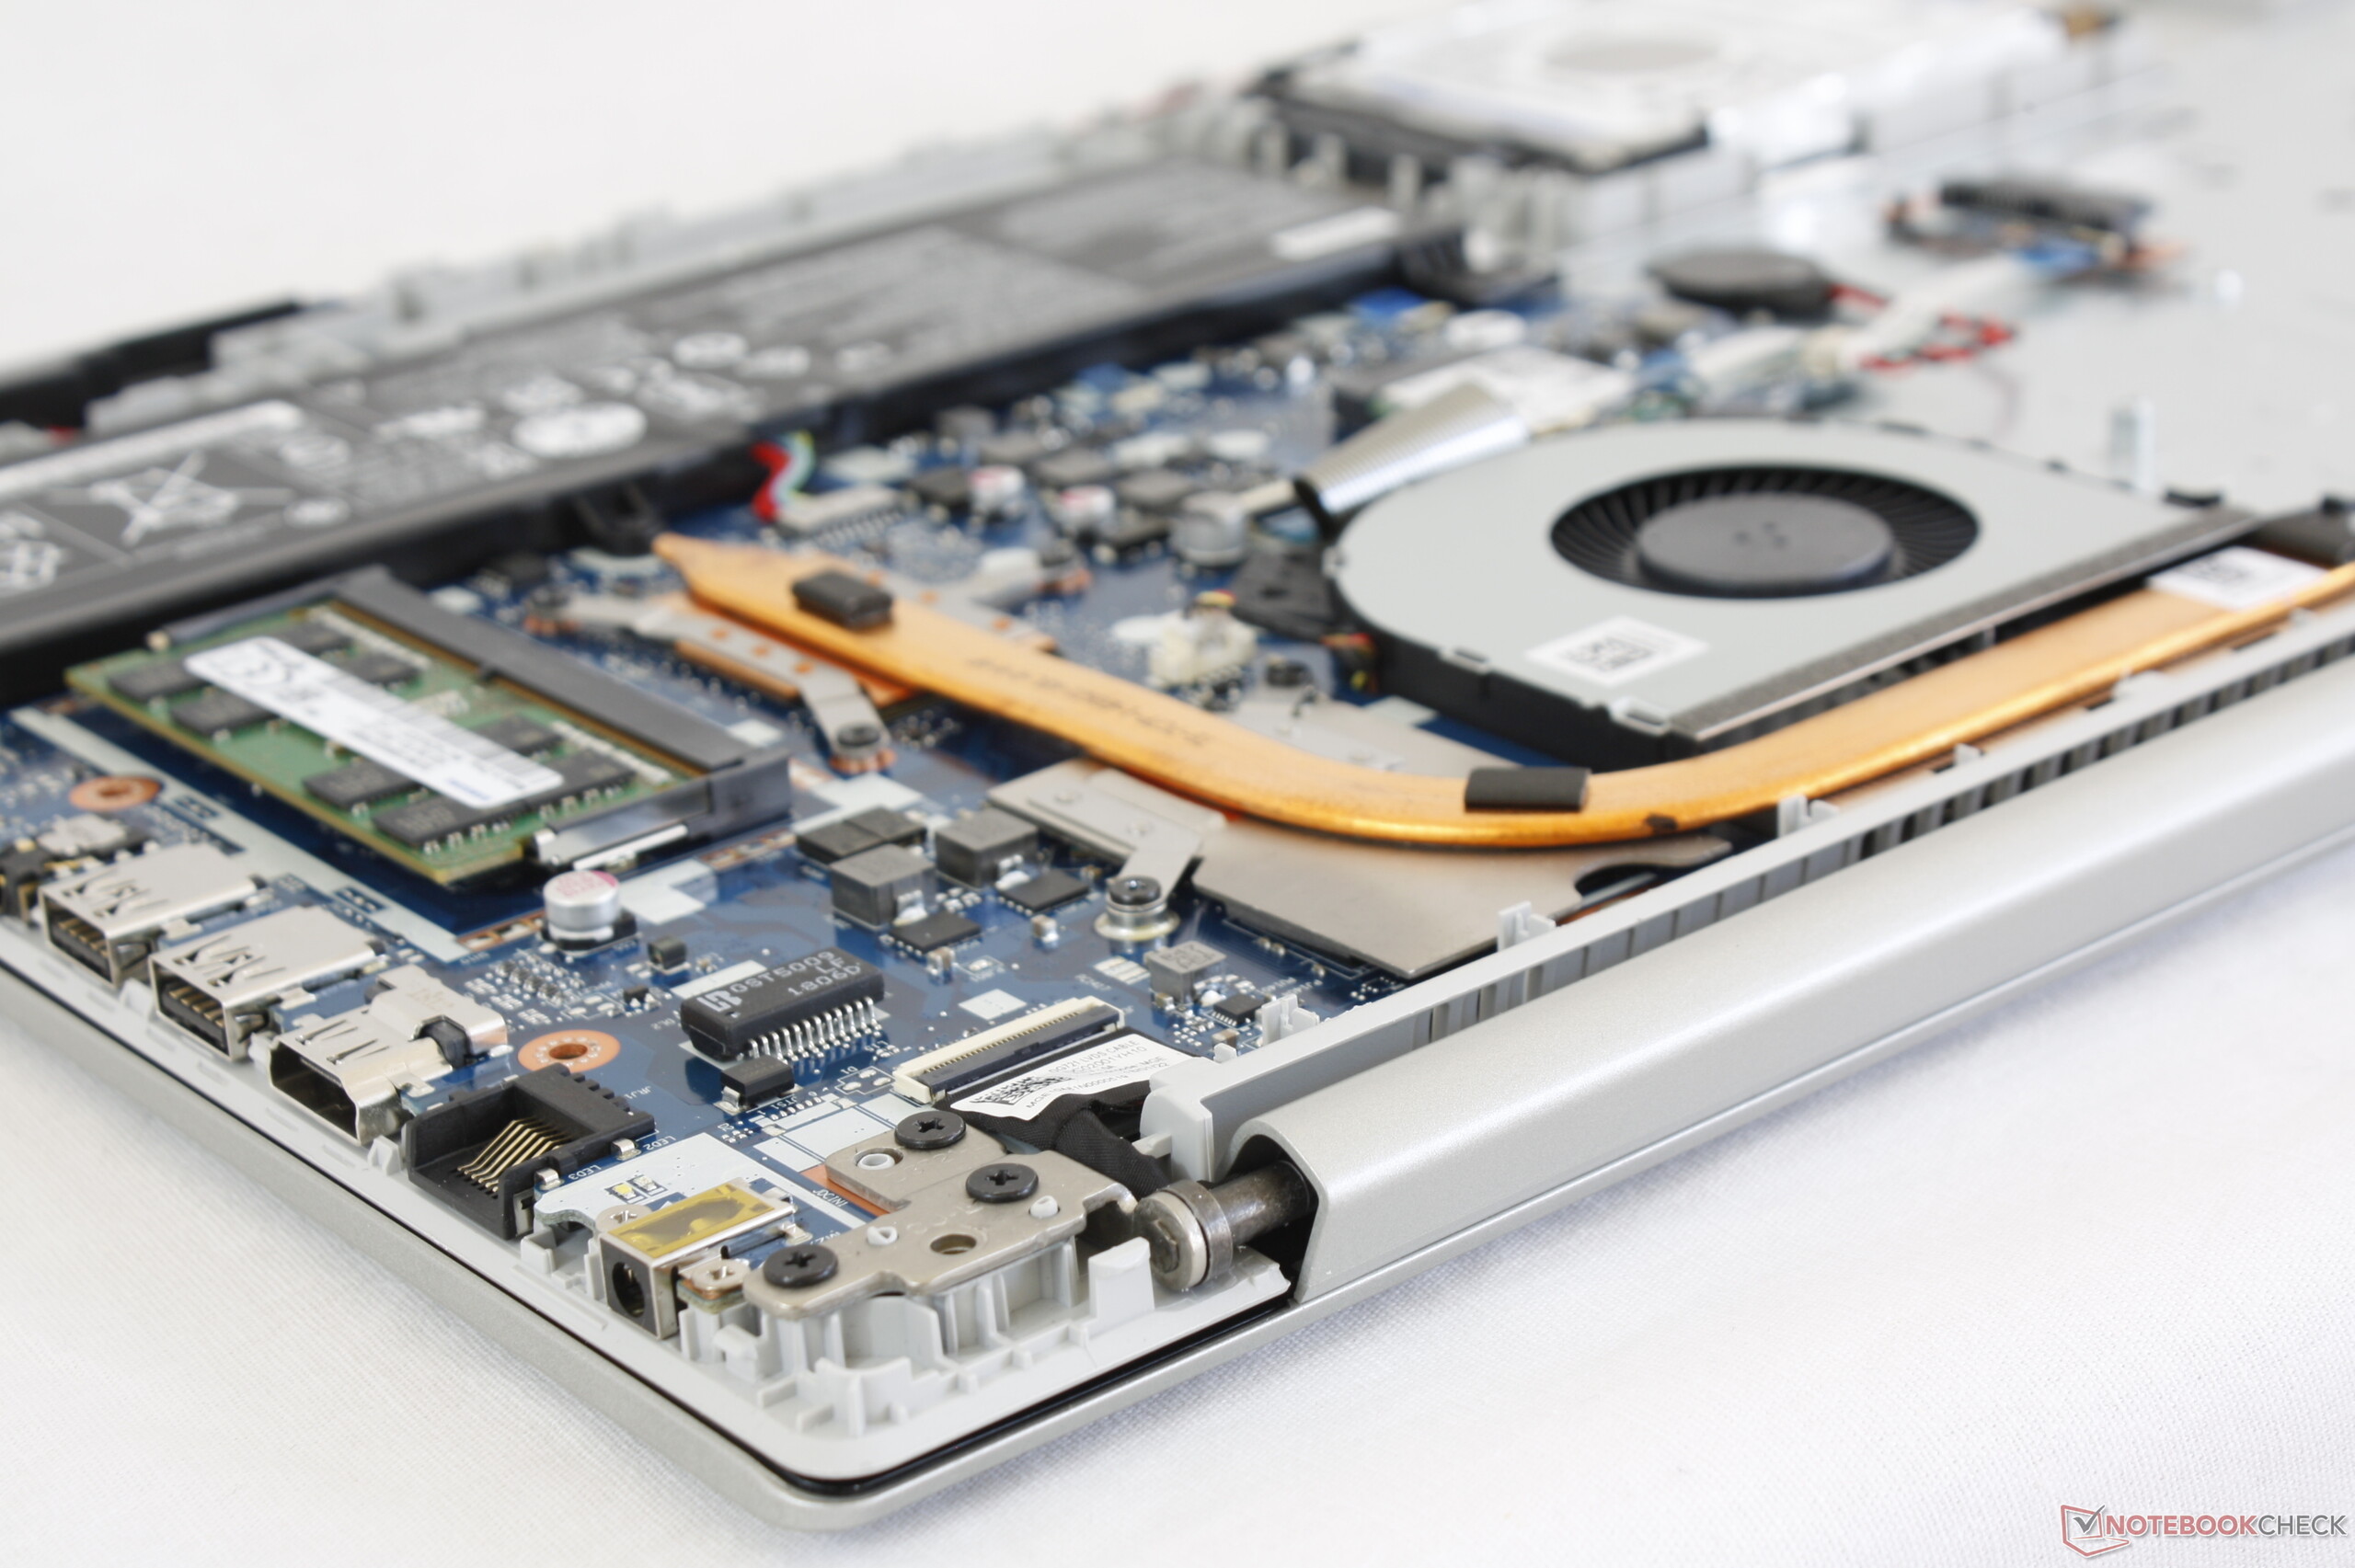
Olhando além da tela horrenda ainda há um bom número de falhas profundas. A curta duração da bateria, a tampa oscilante, o trackpad esponjoso, o chassi com marcos grossos, a memória de um só canal e o desempenho lento do HD, são altos preços a serem pagos.
Por falar em preços, nossa configuração particular pode ser encontrada por cerca de $800 no varejo. Isso é superfaturado para um modelo que pertence à família IdeaPad 300, de última geração, da Lenovo. Portáteis significativamente mais potentes com CPU Core i5-8300H, GPU GTX 1050 e tela 1080p podem ser encontrados por cerca do mesmo preço incluindo o MSI GV72, Asus Vivobook F510, Asus TUF FX504, ou o HP Pavilion Gaming 15.
Fique longe desta configuração. Seu preço de varejo é muito alto, considerando a terrível tela e tampa oscilante. Se você tem $800 para gastar, recomendamos os muitos portáteis GTX 1050 do mercado que oferecem desempenho significativamente mais rápido e mais recursos do que o que temos aqui.
Lenovo IdeaPad 330-17IKB 81DM
- 03/19/2019 v6 (old)
Allen Ngo
Price comparison
