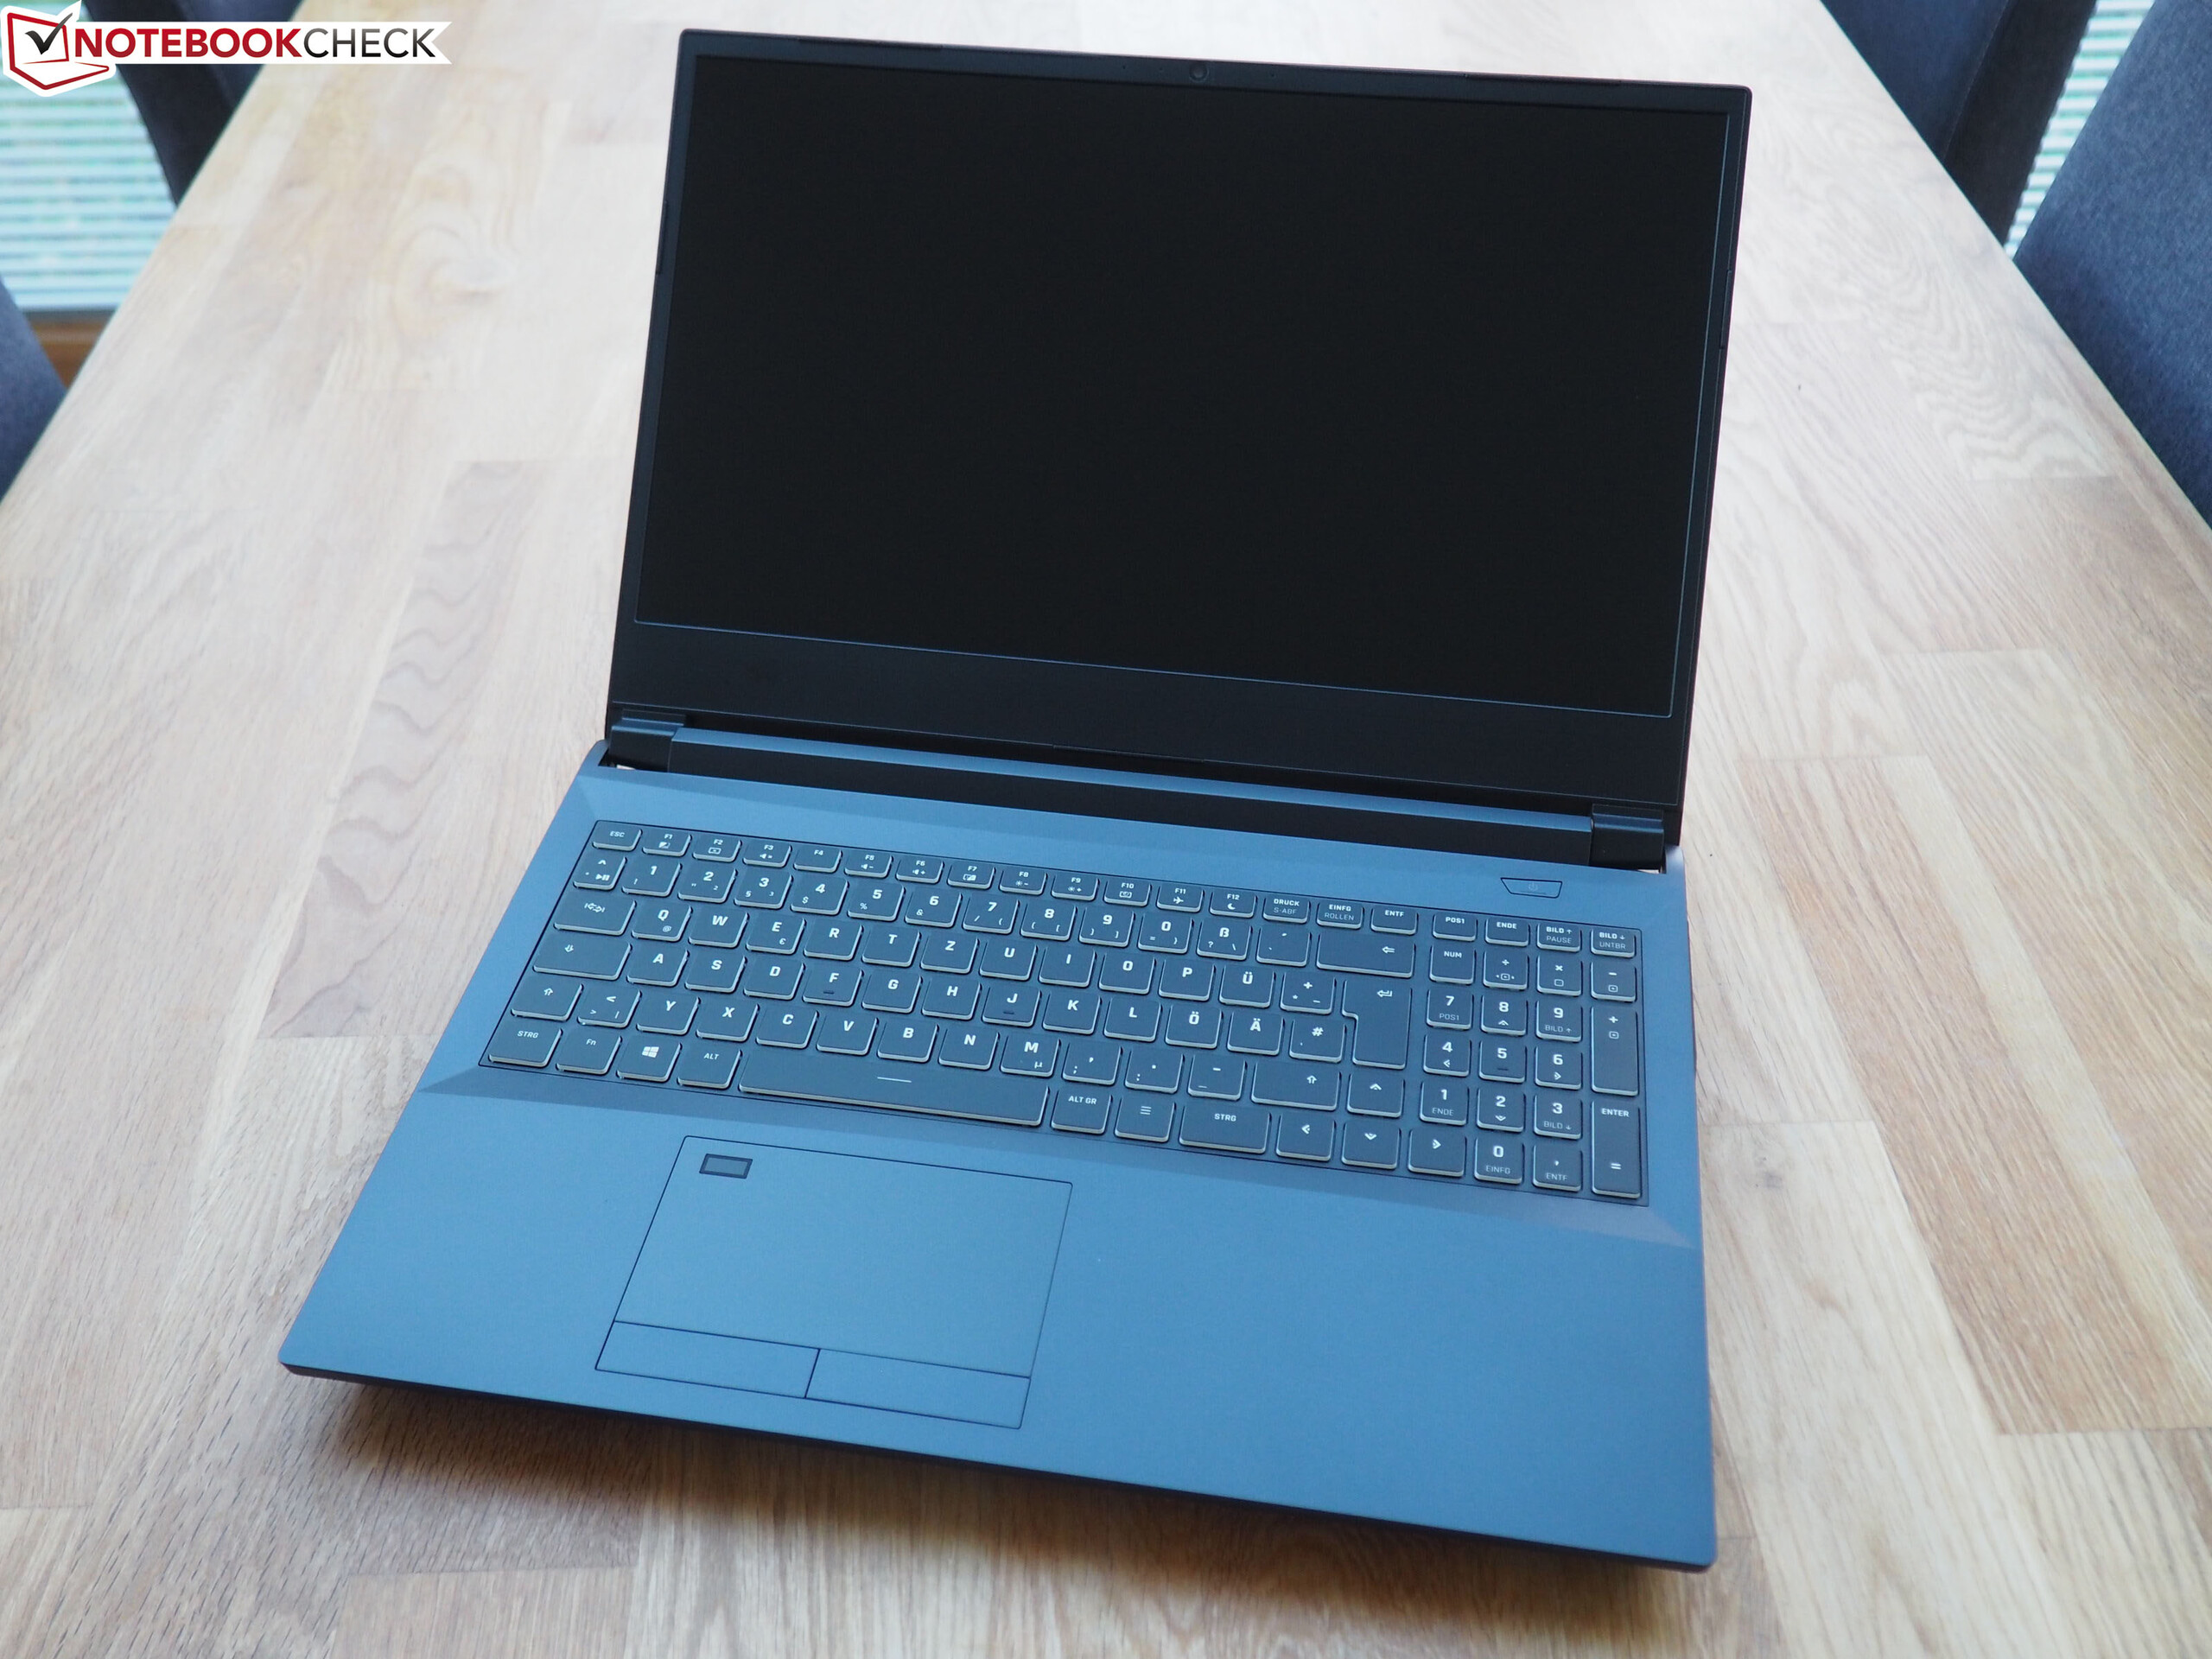
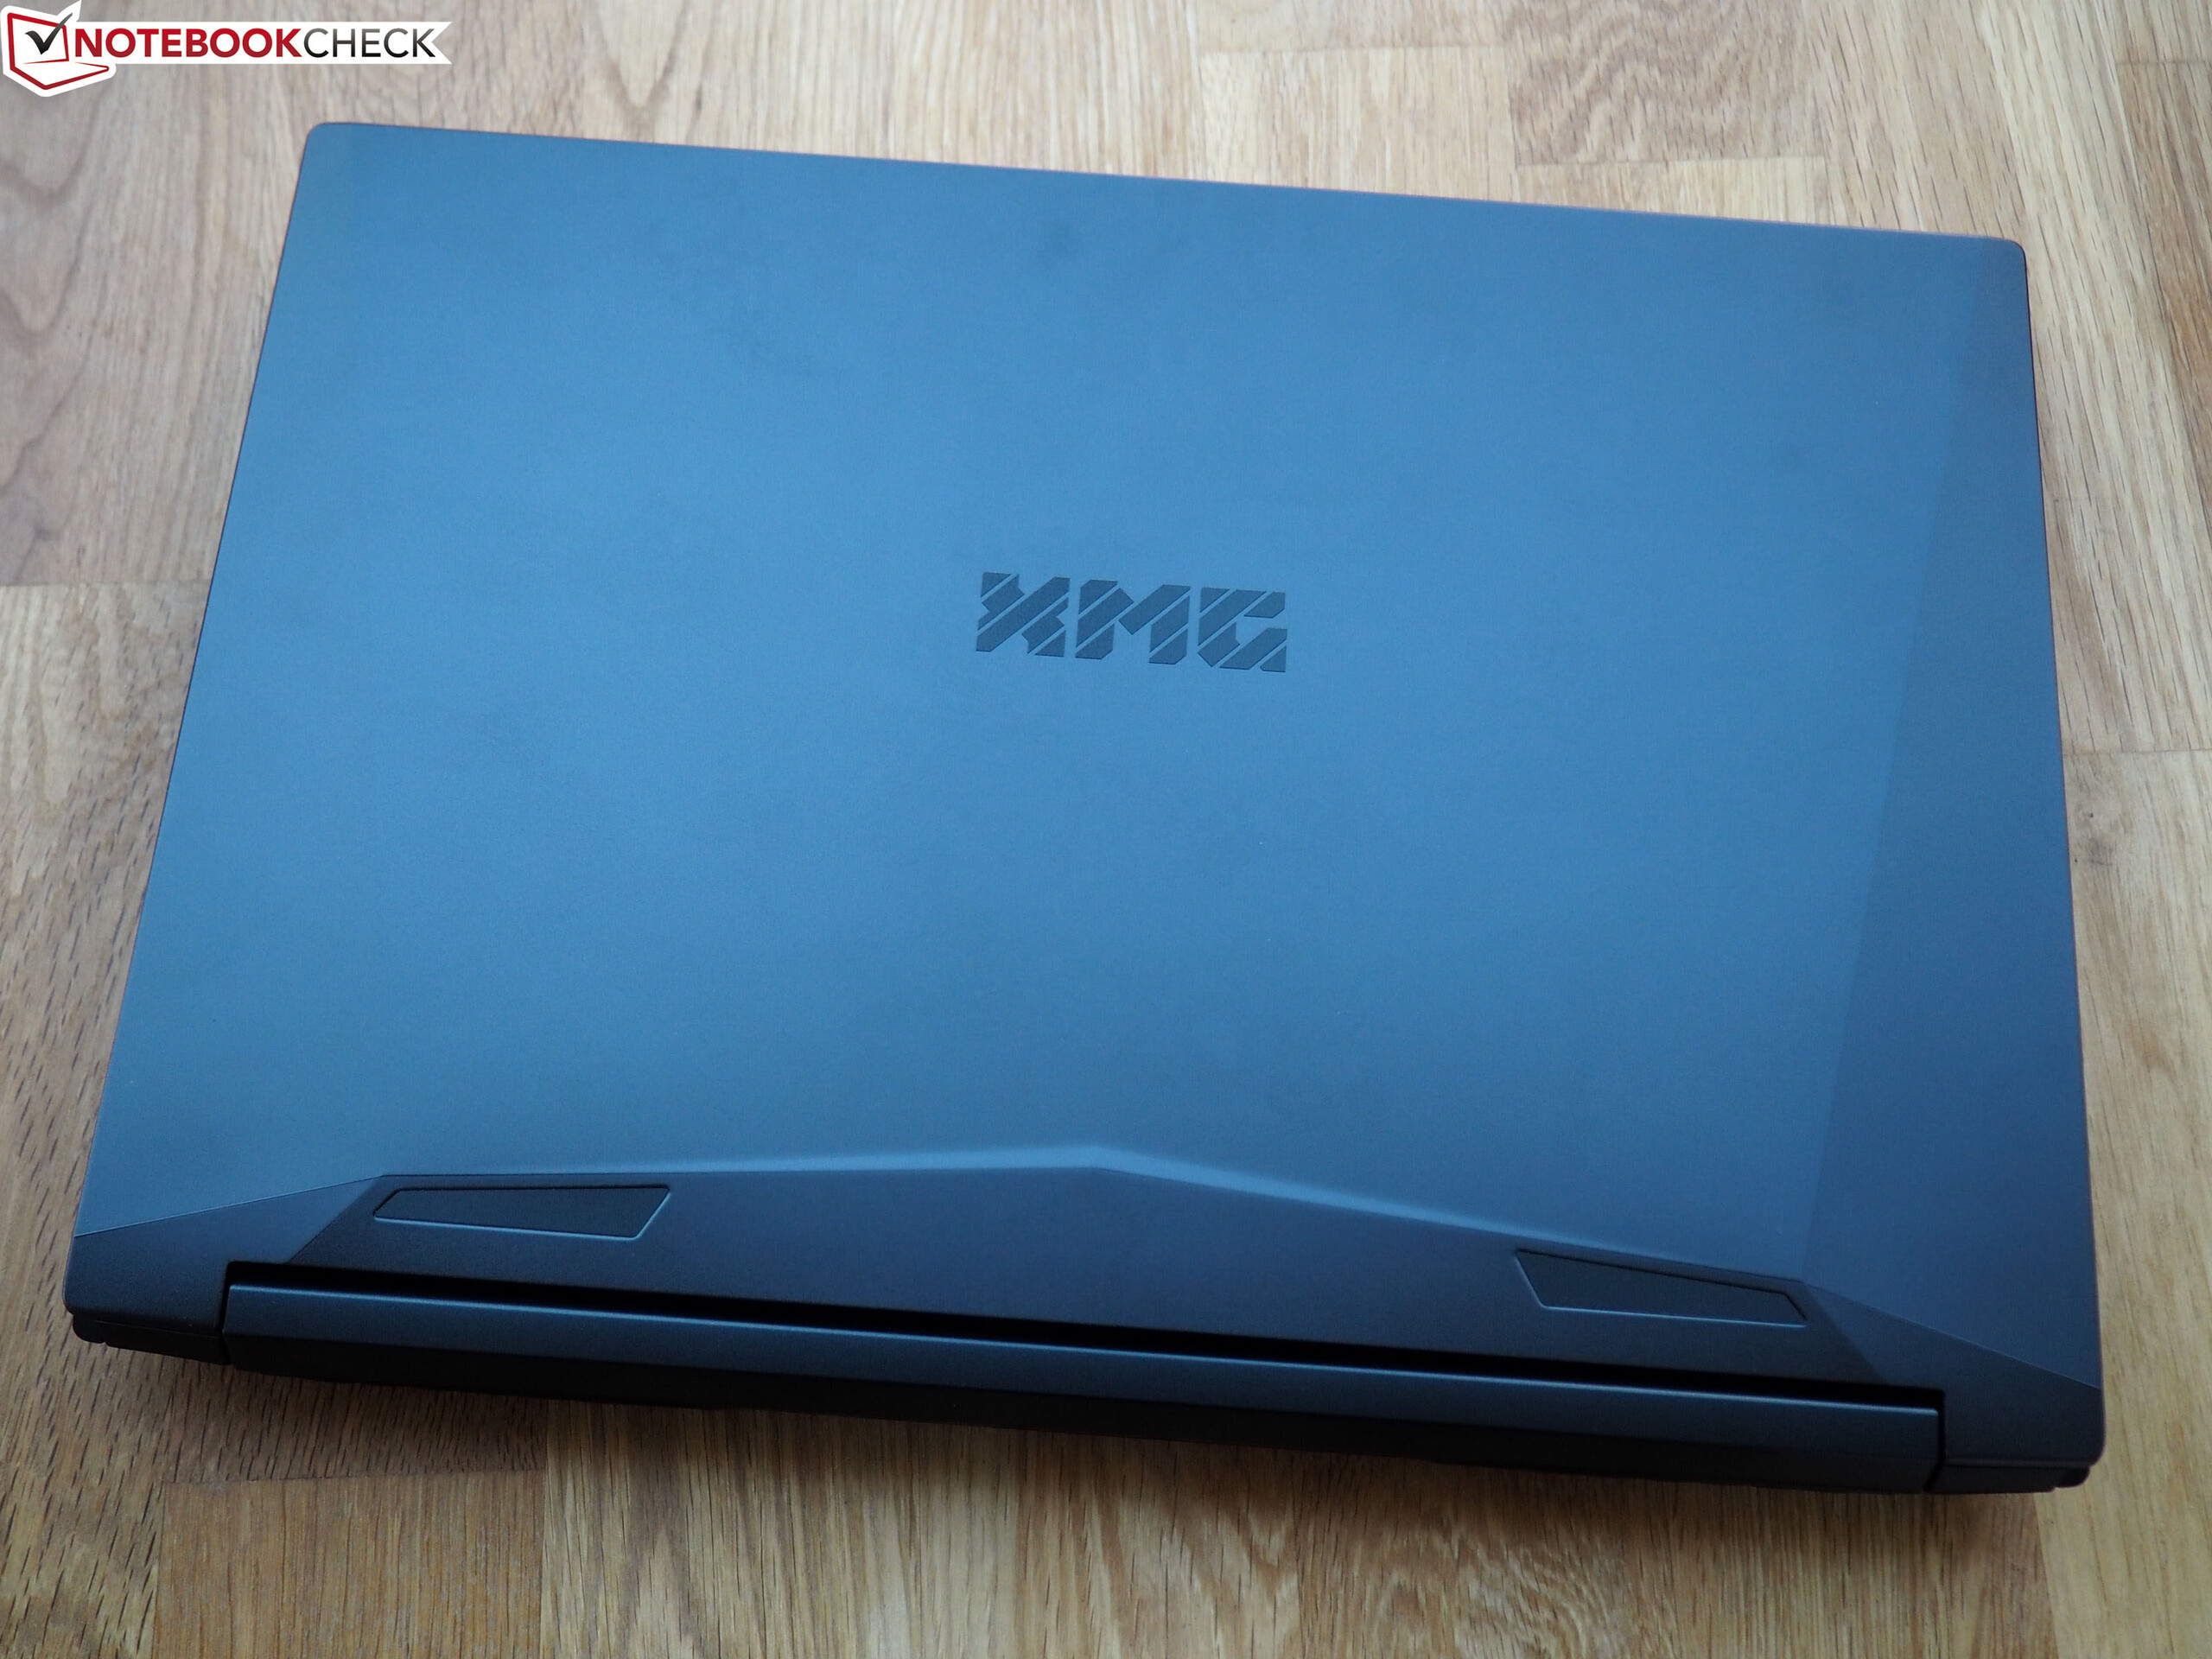
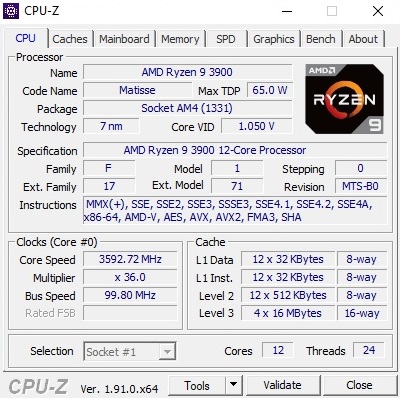
Breve Análise do Portátil Schenker XMG Apex 15 (Clevo NH57AF1): Extremamente rápido, extremamente barulhento
Avaliação | Data | Modelo | Peso | Altura | Size | Resolução | Preço |
|---|---|---|---|---|---|---|---|
| 81.2 % v7 (old) | 05/2020 | Schenker XMG Apex 15 NH57AF1 R9 3900, GeForce RTX 2070 Mobile | 2.7 kg | 32.5 mm | 15.60" | 1920x1080 | |
| 87 % v6 (old) | 03/2019 | Schenker XMG Ultra 15 Turing i7-9700K, GeForce RTX 2070 Mobile | 3.5 kg | 38 mm | 15.60" | 1920x1080 | |
| 85.9 % v6 (old) | Eurocom Nightsky RX15 i9-9980HK, GeForce RTX 2070 Mobile | 2.5 kg | 29.9 mm | 15.60" | 3840x2160 | ||
| 84.7 % v7 (old) | 12/2019 | MSI GE65 Raider 9SF-049US i9-9880H, GeForce RTX 2070 Mobile | 2.3 kg | 26.9 mm | 15.60" | 1920x1080 | |
| 86 % v6 (old) | 06/2019 | Asus Strix Scar III G531GW i9-9880H, GeForce RTX 2070 Mobile | 2.3 kg | 25 mm | 15.60" | 1920x1080 |
| Networking | |
| iperf3 transmit AX12 | |
| Schenker XMG Apex 15 NH57AF1 | |
| Eurocom Nightsky RX15 | |
| Asus Strix Scar III G531GW | |
| Schenker XMG Ultra 15 Turing | |
| iperf3 receive AX12 | |
| Schenker XMG Apex 15 NH57AF1 | |
| Schenker XMG Ultra 15 Turing | |
| Eurocom Nightsky RX15 | |
| Asus Strix Scar III G531GW | |


| |||||||||||||||||||||||||
iluminação: 84 %
iluminação com acumulador: 317 cd/m²
Contraste: 1132:1 (Preto: 0.28 cd/m²)
ΔE ColorChecker Calman: 3.52 | ∀{0.5-29.43 Ø4.73}
calibrated: 2.49
ΔE Greyscale Calman: 2.81 | ∀{0.09-98 Ø4.97}
91% sRGB (Argyll 1.6.3 3D)
67% AdobeRGB 1998 (Argyll 1.6.3 3D)
66.8% AdobeRGB 1998 (Argyll 3D)
91.3% sRGB (Argyll 3D)
67.3% Display P3 (Argyll 3D)
Gamma: 2.54
CCT: 6877 K
| Schenker XMG Apex 15 NH57AF1 AU Optronics B156HAN (AUO80ED), IPS, 1920x1080, 15.6" | Schenker XMG Ultra 15 Turing AU Optronics B156HAN07.0 (AUO70ED), IPS, 1920x1080, 15.6" | Eurocom Nightsky RX15 Samsung SDCA029, OLED, 3840x2160, 15.6" | MSI GE65 Raider 9SF-049US Sharp LQ156M1JW03, IPS, 1920x1080, 15.6" | Asus Strix Scar III G531GW Sharp LQ156M1JW09 (SHP14D3), IPS, 1920x1080, 15.6" | |
|---|---|---|---|---|---|
| Display | -0% | 35% | 6% | 2% | |
| Display P3 Coverage (%) | 67.3 | 66.1 -2% | 99.9 48% | 69.3 3% | 66.2 -2% |
| sRGB Coverage (%) | 91.3 | 92.6 1% | 100 10% | 98.9 8% | 96.5 6% |
| AdobeRGB 1998 Coverage (%) | 66.8 | 67.1 0% | 99.1 48% | 70.7 6% | 67.5 1% |
| Response Times | -7% | 82% | 13% | 1% | |
| Response Time Grey 50% / Grey 80% * (ms) | 17.6 ? | 17.6 ? -0% | 2.4 ? 86% | 13.2 ? 25% | 17.2 ? 2% |
| Response Time Black / White * (ms) | 11.2 ? | 12.8 ? -14% | 2.6 ? 77% | 11.2 ? -0% | 11.2 ? -0% |
| PWM Frequency (Hz) | 59.5 ? | 23150 ? | 24040 ? | ||
| Screen | -5% | -16% | 8% | 12% | |
| Brightness middle (cd/m²) | 317 | 263 -17% | 414.9 31% | 277.4 -12% | 266 -16% |
| Brightness (cd/m²) | 316 | 264 -16% | 404 28% | 264 -16% | 252 -20% |
| Brightness Distribution (%) | 84 | 89 6% | 88 5% | 90 7% | 88 5% |
| Black Level * (cd/m²) | 0.28 | 0.17 39% | 0.24 14% | 0.27 4% | |
| Contrast (:1) | 1132 | 1547 37% | 1156 2% | 985 -13% | |
| Colorchecker dE 2000 * | 3.52 | 4.45 -26% | 7.58 -115% | 1.51 57% | 1.81 49% |
| Colorchecker dE 2000 max. * | 6.93 | 8.33 -20% | 14.85 -114% | 4.93 29% | 3.23 53% |
| Colorchecker dE 2000 calibrated * | 2.49 | 1.93 22% | 1.77 29% | 1.03 59% | |
| Greyscale dE 2000 * | 2.81 | 4.77 -70% | 2.9 -3% | 3.7 -32% | 2.44 13% |
| Gamma | 2.54 87% | 2.52 87% | 2.05 107% | 2.23 99% | 2.42 91% |
| CCT | 6877 95% | 7767 84% | 6538 99% | 7061 92% | 7005 93% |
| Color Space (Percent of AdobeRGB 1998) (%) | 67 | 60 -10% | 88.2 32% | 65.1 -3% | 62 -7% |
| Color Space (Percent of sRGB) (%) | 91 | 93 2% | 100 10% | 99.1 9% | 97 7% |
| Média Total (Programa/Configurações) | -4% /
-4% | 34% /
11% | 9% /
8% | 5% /
9% |
* ... menor é melhor
Exibir tempos de resposta
| ↔ Tempo de resposta preto para branco | ||
|---|---|---|
| 11.2 ms ... ascensão ↗ e queda ↘ combinadas | ↗ 6 ms ascensão | 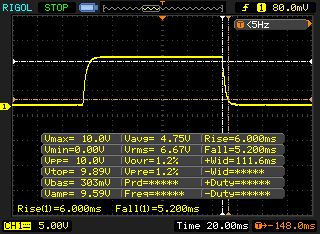 |
| ↘ 5.2 ms queda | ||
| A tela mostra boas taxas de resposta em nossos testes, mas pode ser muito lenta para jogadores competitivos. Em comparação, todos os dispositivos testados variam de 0.1 (mínimo) a 240 (máximo) ms. » 30 % de todos os dispositivos são melhores. Isso significa que o tempo de resposta medido é melhor que a média de todos os dispositivos testados (19.9 ms). | ||
| ↔ Tempo de resposta 50% cinza a 80% cinza | ||
| 17.6 ms ... ascensão ↗ e queda ↘ combinadas | ↗ 9.2 ms ascensão | 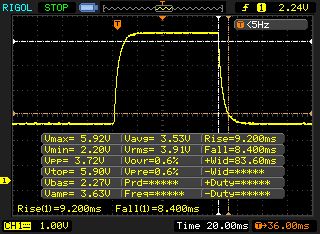 |
| ↘ 8.4 ms queda | ||
| A tela mostra boas taxas de resposta em nossos testes, mas pode ser muito lenta para jogadores competitivos. Em comparação, todos os dispositivos testados variam de 0.165 (mínimo) a 636 (máximo) ms. » 31 % de todos os dispositivos são melhores. Isso significa que o tempo de resposta medido é melhor que a média de todos os dispositivos testados (31.1 ms). | ||
Cintilação da tela / PWM (modulação por largura de pulso)
| Tela tremeluzindo / PWM não detectado | 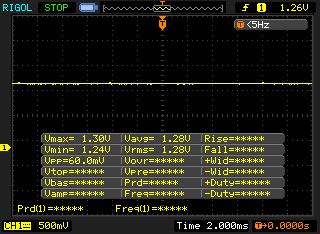 | ||
[pwm_comparison] Em comparação: 52 % de todos os dispositivos testados não usam PWM para escurecer a tela. Se PWM foi detectado, uma média de 7794 (mínimo: 5 - máximo: 343500) Hz foi medida. | |||
| Cinebench R15 | |
| CPU Single 64Bit | |
| Média da turma Gaming (188.8 - 343, n=111, últimos 2 anos) | |
| Schenker XMG Ultra 15 Turing | |
| Eurocom Nightsky RX15 | |
| MSI GE65 Raider 9SF-049US | |
| Schenker XMG Apex 15 NH57AF1 | |
| Asus Strix Scar III G531GW | |
| CPU Multi 64Bit | |
| Média da turma Gaming (1578 - 6271, n=111, últimos 2 anos) | |
| Schenker XMG Apex 15 NH57AF1 | |
| Eurocom Nightsky RX15 | |
| MSI GE65 Raider 9SF-049US | |
| Schenker XMG Ultra 15 Turing | |
| Asus Strix Scar III G531GW | |
| Blender - v2.79 BMW27 CPU | |
| Eurocom Nightsky RX15 | |
| Schenker XMG Apex 15 NH57AF1 | |
| Média da turma Gaming (80 - 330, n=109, últimos 2 anos) | |
| 7-Zip 18.03 | |
| 7z b 4 -mmt1 | |
| Média da turma Gaming (4199 - 7436, n=110, últimos 2 anos) | |
| Eurocom Nightsky RX15 | |
| Schenker XMG Apex 15 NH57AF1 | |
| 7z b 4 | |
| Média da turma Gaming (33491 - 148086, n=110, últimos 2 anos) | |
| Schenker XMG Apex 15 NH57AF1 | |
| Eurocom Nightsky RX15 | |
| Cinebench R20 | |
| CPU (Single Core) | |
| Média da turma Gaming (442 - 895, n=111, últimos 2 anos) | |
| Schenker XMG Apex 15 NH57AF1 | |
| Eurocom Nightsky RX15 | |
| MSI GE65 Raider 9SF-049US | |
| CPU (Multi Core) | |
| Média da turma Gaming (4029 - 16108, n=111, últimos 2 anos) | |
| Schenker XMG Apex 15 NH57AF1 | |
| Eurocom Nightsky RX15 | |
| MSI GE65 Raider 9SF-049US | |
| Geekbench 5.5 | |
| Single-Core | |
| Média da turma Gaming (986 - 2474, n=110, últimos 2 anos) | |
| Schenker XMG Apex 15 NH57AF1 | |
| Multi-Core | |
| Média da turma Gaming (6460 - 27010, n=110, últimos 2 anos) | |
| Schenker XMG Apex 15 NH57AF1 | |
| HWBOT x265 Benchmark v2.2 - 4k Preset | |
| Média da turma Gaming (11.5 - 44.3, n=110, últimos 2 anos) | |
| Schenker XMG Apex 15 NH57AF1 | |
| Eurocom Nightsky RX15 | |
| LibreOffice - 20 Documents To PDF | |
| Schenker XMG Apex 15 NH57AF1 | |
| Média da turma Gaming (19 - 88.8, n=110, últimos 2 anos) | |
| R Benchmark 2.5 - Overall mean | |
| Schenker XMG Apex 15 NH57AF1 | |
| Média da turma Gaming (0.3439 - 0.759, n=111, últimos 2 anos) | |
* ... menor é melhor
| PCMark 10 - Score | |
| Média da turma Gaming (5828 - 11574, n=95, últimos 2 anos) | |
| Schenker XMG Apex 15 NH57AF1 | |
| Schenker XMG Ultra 15 Turing | |
| MSI GE65 Raider 9SF-049US | |
| Eurocom Nightsky RX15 | |
| Asus Strix Scar III G531GW | |
| DPC Latencies / LatencyMon - interrupt to process latency (max), Web, Youtube, Prime95 | |
| Schenker XMG Apex 15 NH57AF1 | |
* ... menor é melhor
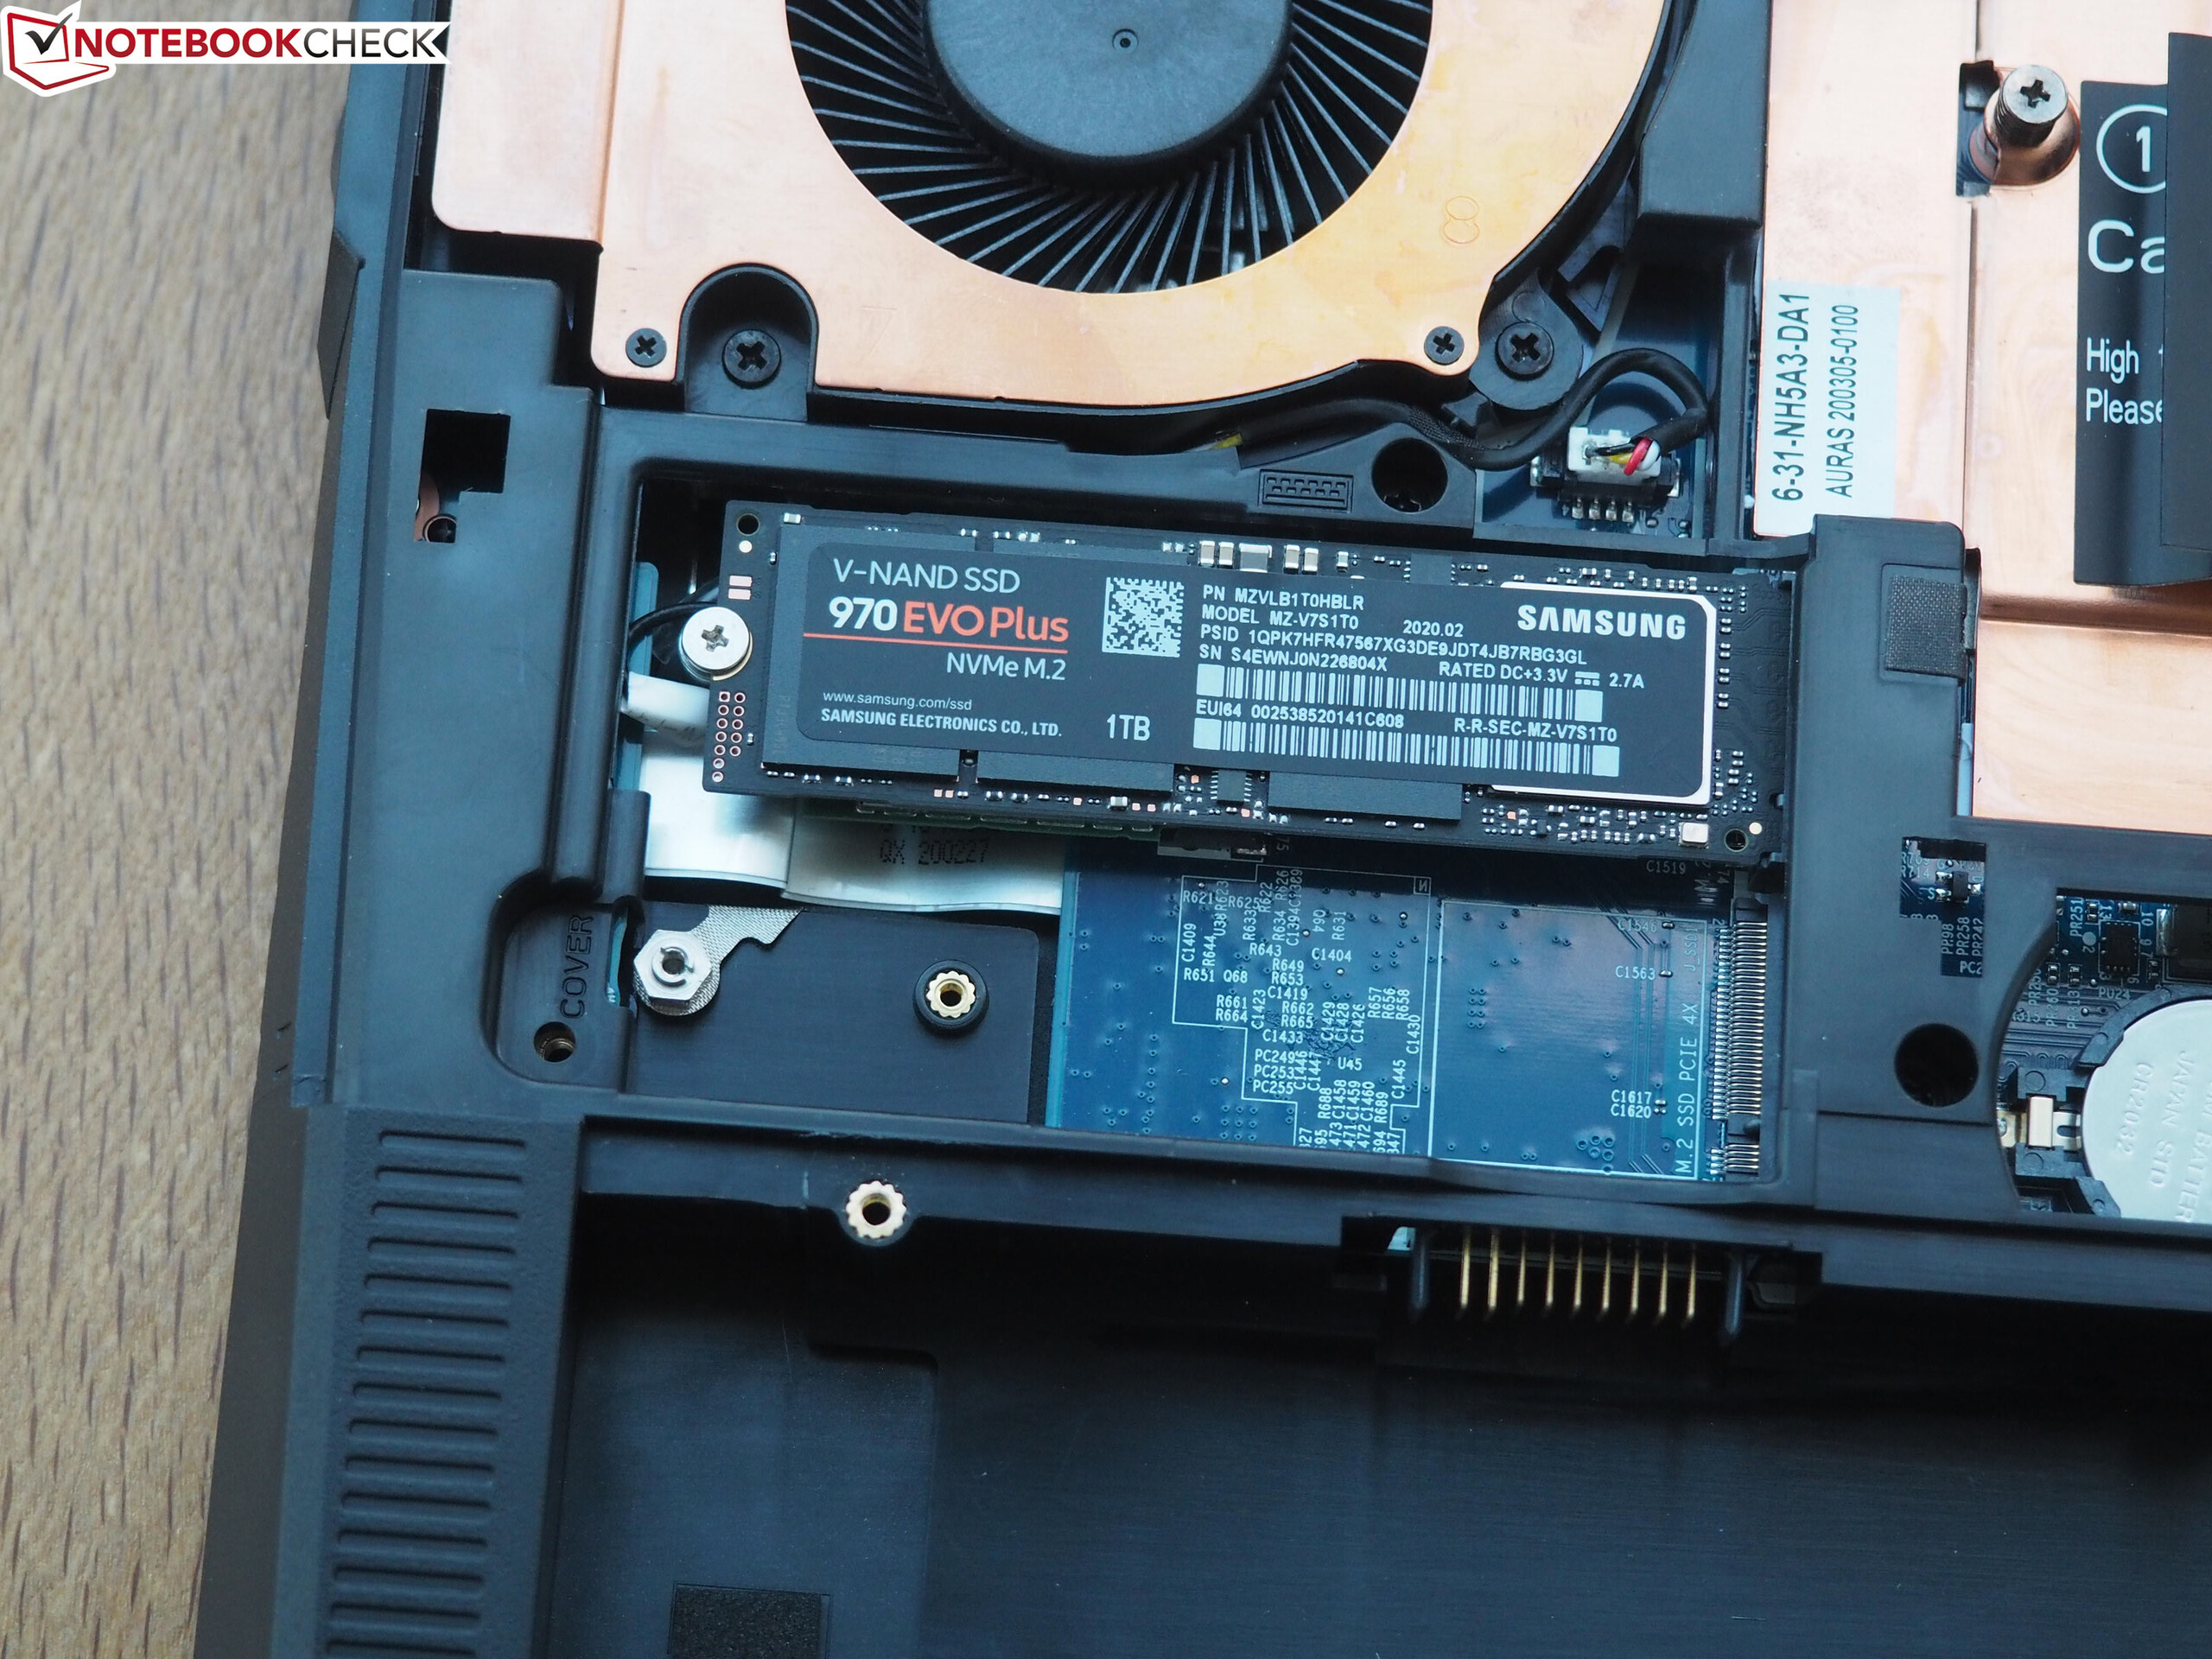
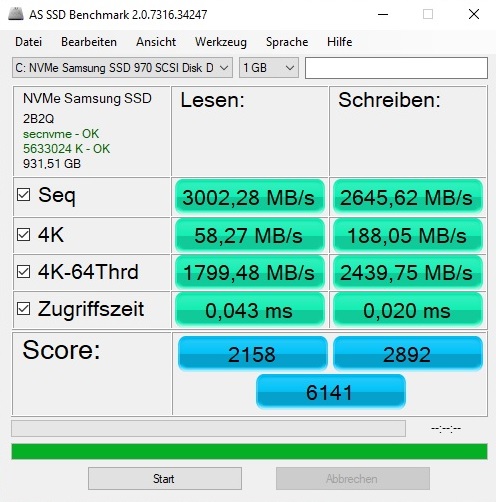
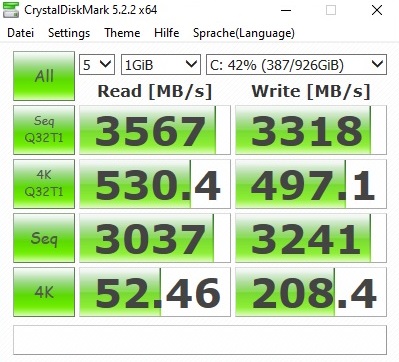
| Schenker XMG Apex 15 NH57AF1 Samsung SSD 970 EVO Plus 1TB | Schenker XMG Ultra 15 Turing Samsung SSD 970 EVO Plus 1TB | Eurocom Nightsky RX15 Samsung SSD 970 Pro 512GB | MSI GE65 Raider 9SF-049US Samsung SSD PM981 MZVLB1T0HALR | Asus Strix Scar III G531GW Intel SSD 660p 1TB SSDPEKNW010T8 | |
|---|---|---|---|---|---|
| CrystalDiskMark 5.2 / 6 | -26% | -14% | -21% | -28% | |
| Write 4K (MB/s) | 208.4 | 129.9 -38% | 153 -27% | 125.7 -40% | 135 -35% |
| Read 4K (MB/s) | 52.5 | 47.15 -10% | 60.5 15% | 45.04 -14% | 54.9 5% |
| Write Seq (MB/s) | 3241 | 1840 -43% | 1938 -40% | 2361 -27% | 1649 -49% |
| Read Seq (MB/s) | 3037 | 1775 -42% | 1932 -36% | 1987 -35% | 1449 -52% |
| Write 4K Q32T1 (MB/s) | 497.1 | 294.5 -41% | 482.5 -3% | 407.1 -18% | 508 2% |
| Read 4K Q32T1 (MB/s) | 530 | 373.6 -30% | 594 12% | 537 1% | 559 5% |
| Write Seq Q32T1 (MB/s) | 3318 | 3295 -1% | 2324 -30% | 2398 -28% | 1759 -47% |
| Read Seq Q32T1 (MB/s) | 3567 | 3535 -1% | 3539 -1% | 3309 -7% | 1826 -49% |

| 3DMark 06 Standard Score | 41167 pontos | |
| 3DMark 11 Performance | 23447 pontos | |
| 3DMark Cloud Gate Standard Score | 50713 pontos | |
| 3DMark Fire Strike Score | 18460 pontos | |
| 3DMark Time Spy Score | 8253 pontos | |
Ajuda | ||
| 3DMark | |
| 2560x1440 Port Royal Graphics | |
| Média da turma Gaming (4395 - 17286, n=70, últimos 2 anos) | |
| Schenker XMG Apex 15 NH57AF1 | |
| MSI GE65 Raider 9SF-049US | |
| Eurocom Nightsky RX15 | |
| Schenker XMG Ultra 15 Turing | |
| 2560x1440 Time Spy Graphics | |
| Média da turma Gaming (5012 - 26212, n=119, últimos 2 anos) | |
| MSI GE65 Raider 9SF-049US | |
| Schenker XMG Apex 15 NH57AF1 | |
| Schenker XMG Ultra 15 Turing | |
| Eurocom Nightsky RX15 | |
| Asus Strix Scar III G531GW | |
| 1920x1080 Fire Strike Graphics | |
| Média da turma Gaming (12242 - 62849, n=120, últimos 2 anos) | |
| MSI GE65 Raider 9SF-049US | |
| Schenker XMG Ultra 15 Turing | |
| Schenker XMG Apex 15 NH57AF1 | |
| Eurocom Nightsky RX15 | |
| Asus Strix Scar III G531GW | |
| 3DMark 11 - 1280x720 Performance GPU | |
| Média da turma Gaming (21841 - 80022, n=108, últimos 2 anos) | |
| Schenker XMG Apex 15 NH57AF1 | |
| Schenker XMG Ultra 15 Turing | |
| Eurocom Nightsky RX15 | |
| MSI GE65 Raider 9SF-049US | |
| Asus Strix Scar III G531GW | |
| The Witcher 3 - 1920x1080 Ultra Graphics & Postprocessing (HBAO+) | |
| Média da turma Gaming (95 - 240, n=8, últimos 2 anos) | |
| Eurocom Nightsky RX15 | |
| MSI GE65 Raider 9SF-049US | |
| Schenker XMG Apex 15 NH57AF1 | |
| Schenker XMG Ultra 15 Turing | |
| Asus Strix Scar III G531GW | |
| baixo | média | alto | ultra | |
|---|---|---|---|---|
| GTA V (2015) | 179 | 172 | 160 | 87 |
| The Witcher 3 (2015) | 142 | 74.5 | ||
| Dota 2 Reborn (2015) | 152 | 136 | 131 | 124 |
| X-Plane 11.11 (2018) | 112 | 102 | 82.9 | |
| Shadow of the Tomb Raider (2018) | 107 | 97 | ||
| Battlefield V (2018) | 136 | 124 | ||
| Borderlands 3 (2019) | 81.4 | 63.3 | ||
| Escape from Tarkov (2020) | 120 | 104 | ||
| Hunt Showdown (2020) | 101 | |||
| Doom Eternal (2020) | 161 | 157 | ||
| Gears Tactics (2020) | 119 | 85.8 |
Barulho
| Ocioso |
| 35 / 36 / 39 dB |
| Carga |
| 59 / 63 dB |
 | ||
30 dB silencioso 40 dB(A) audível 50 dB(A) ruidosamente alto |
||
min: | ||
| Schenker XMG Apex 15 NH57AF1 R9 3900, GeForce RTX 2070 Mobile | Schenker XMG Ultra 15 Turing i7-9700K, GeForce RTX 2070 Mobile | Eurocom Nightsky RX15 i9-9980HK, GeForce RTX 2070 Mobile | MSI GE65 Raider 9SF-049US i9-9880H, GeForce RTX 2070 Mobile | Asus Strix Scar III G531GW i9-9880H, GeForce RTX 2070 Mobile | Média da turma Gaming | |
|---|---|---|---|---|---|---|
| Noise | 7% | 15% | 13% | 7% | 22% | |
| desligado / ambiente * (dB) | 30 | 30 -0% | 28.2 6% | 28.8 4% | 29 3% | 24.1 ? 20% |
| Idle Minimum * (dB) | 35 | 32 9% | 28.2 19% | 33 6% | 30 14% | 25.8 ? 26% |
| Idle Average * (dB) | 36 | 33 8% | 28.2 22% | 33 8% | 37 -3% | 27.4 ? 24% |
| Idle Maximum * (dB) | 39 | 36 8% | 31.7 19% | 33.1 15% | 39 -0% | 30 ? 23% |
| Load Average * (dB) | 59 | 55 7% | 53.7 9% | 38 36% | 54 8% | 43 ? 27% |
| Witcher 3 ultra * (dB) | 62 | 57 8% | 53.7 13% | 52.9 15% | 54 13% | |
| Load Maximum * (dB) | 63 | 59 6% | 53.7 15% | 57.8 8% | 54 14% | 54 ? 14% |
* ... menor é melhor
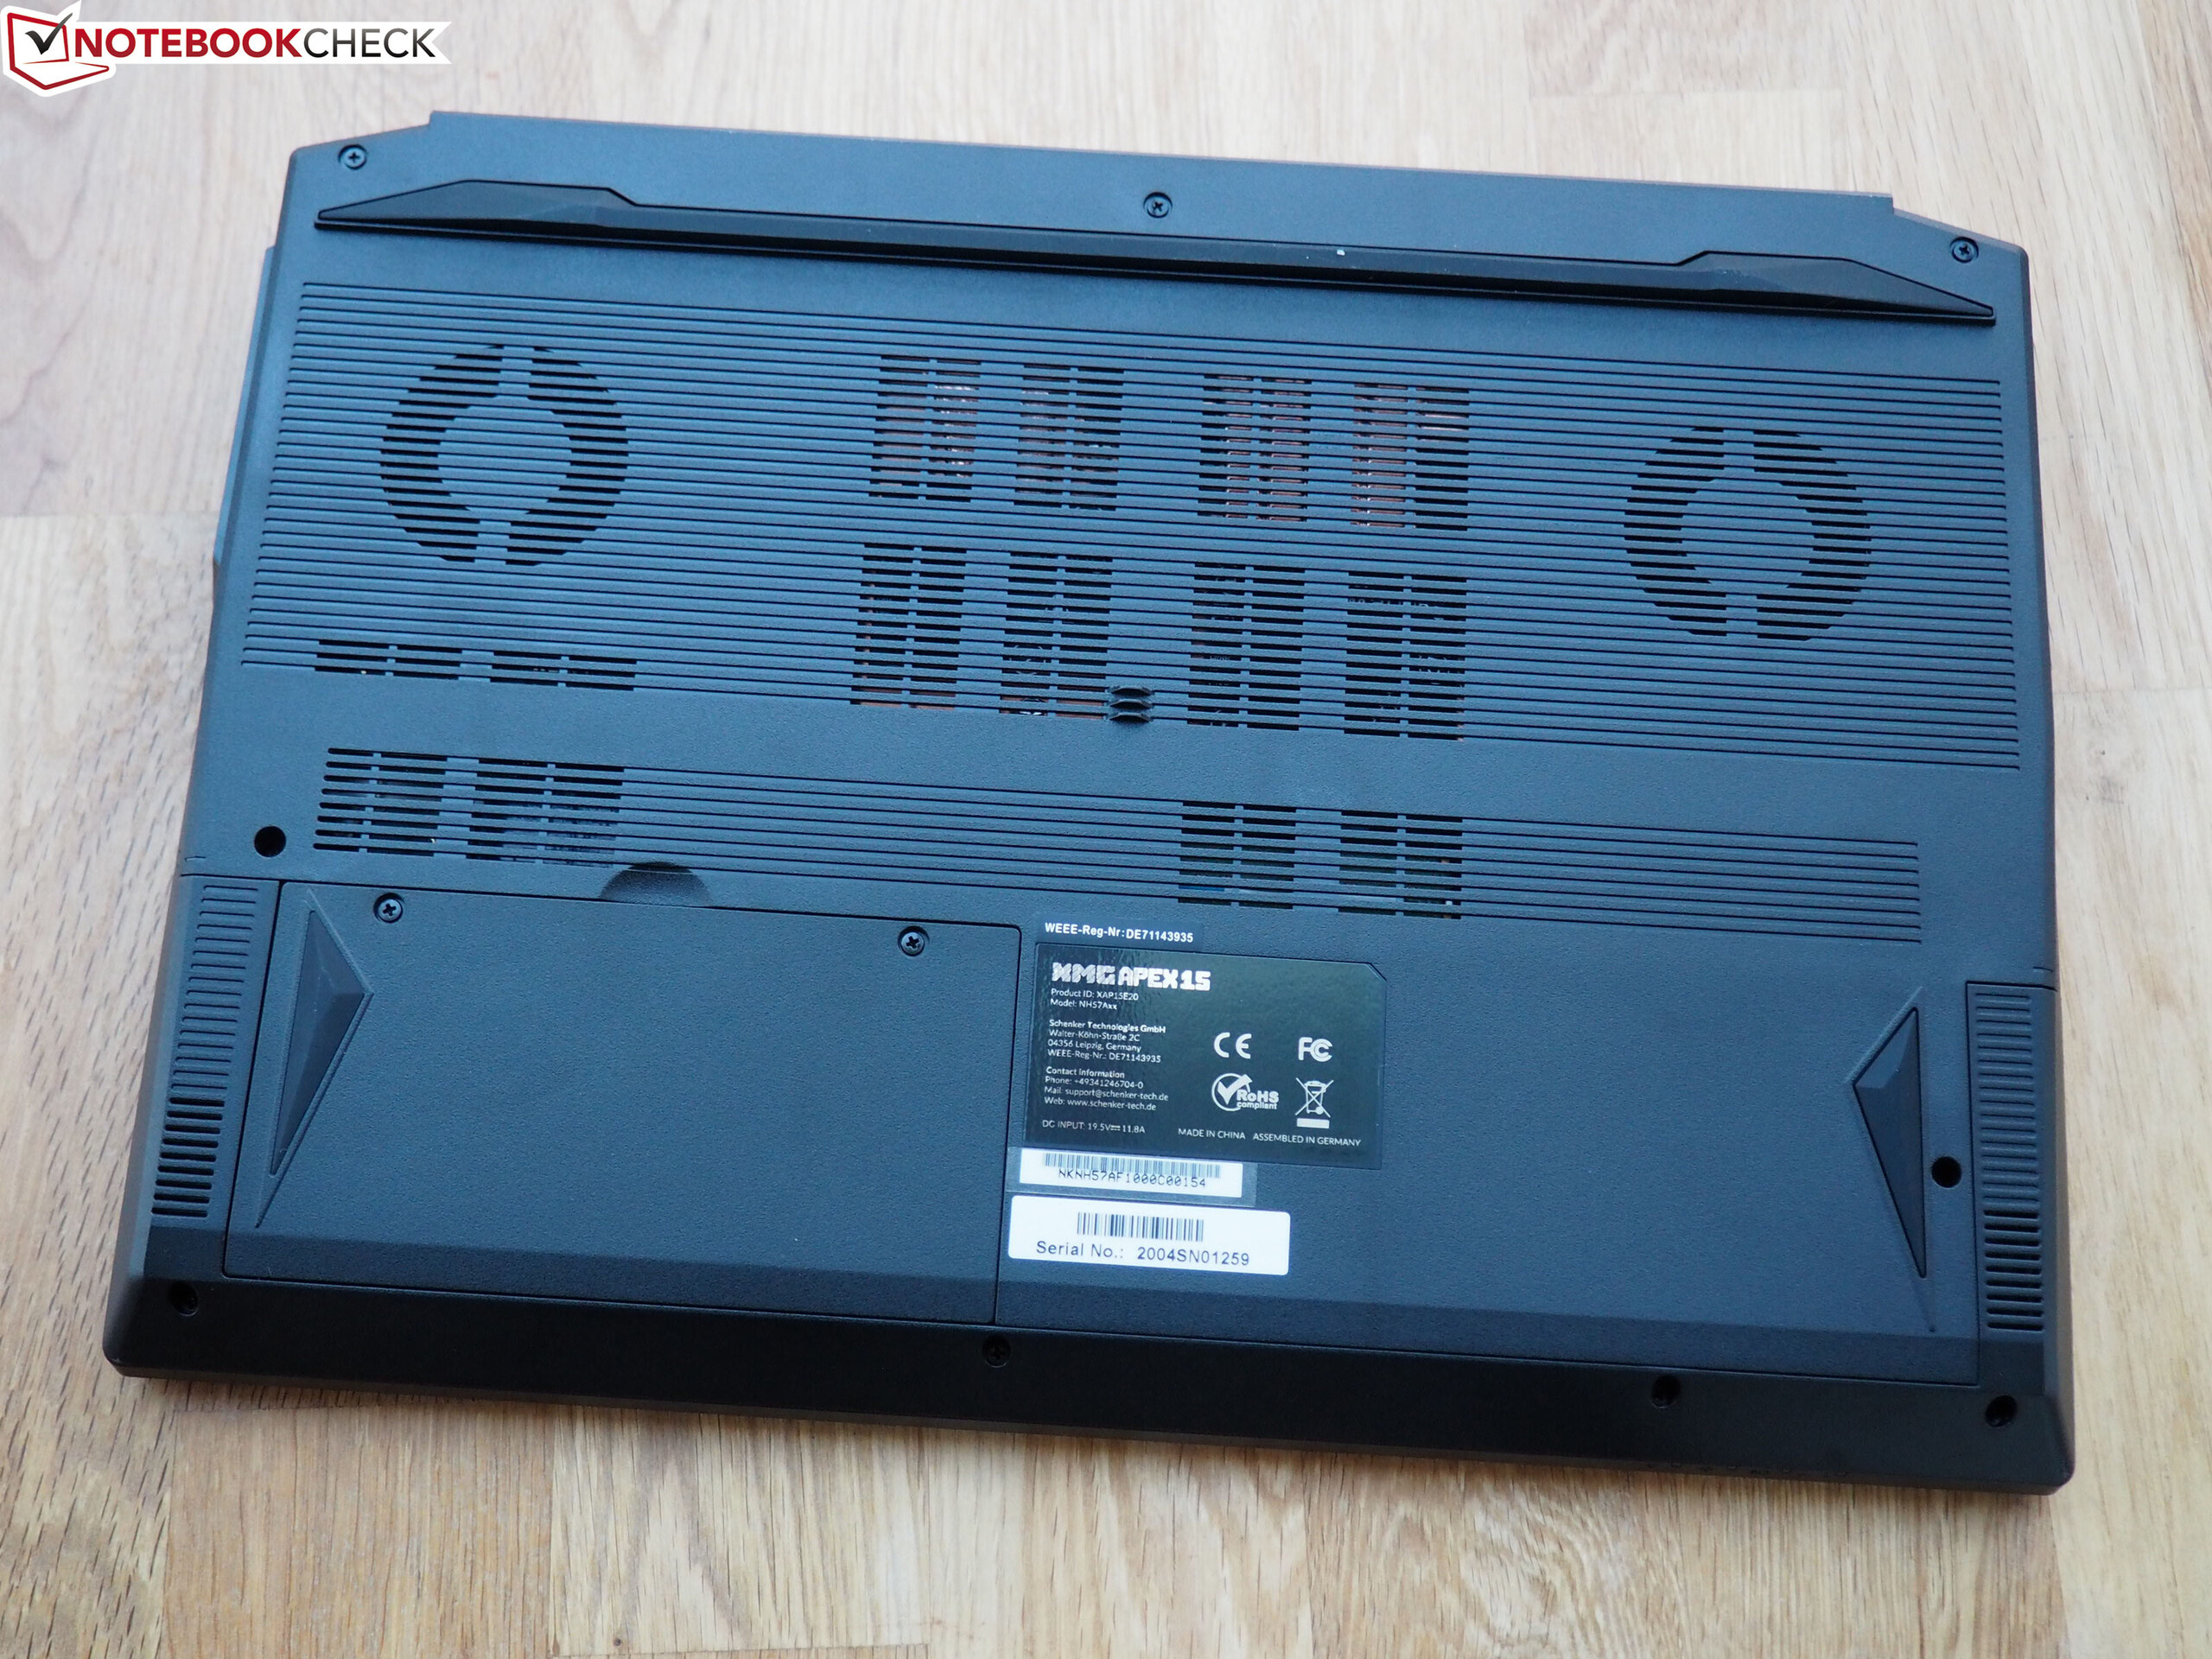
(±) A temperatura máxima no lado superior é 44 °C / 111 F, em comparação com a média de 40.4 °C / 105 F , variando de 21.2 a 68.8 °C para a classe Gaming.
(-) A parte inferior aquece até um máximo de 48 °C / 118 F, em comparação com a média de 43.2 °C / 110 F
(+) Em uso inativo, a temperatura média para o lado superior é 30.6 °C / 87 F, em comparação com a média do dispositivo de 33.9 °C / ### class_avg_f### F.
(±) Jogando The Witcher 3, a temperatura média para o lado superior é 37.6 °C / 100 F, em comparação com a média do dispositivo de 33.9 °C / ## #class_avg_f### F.
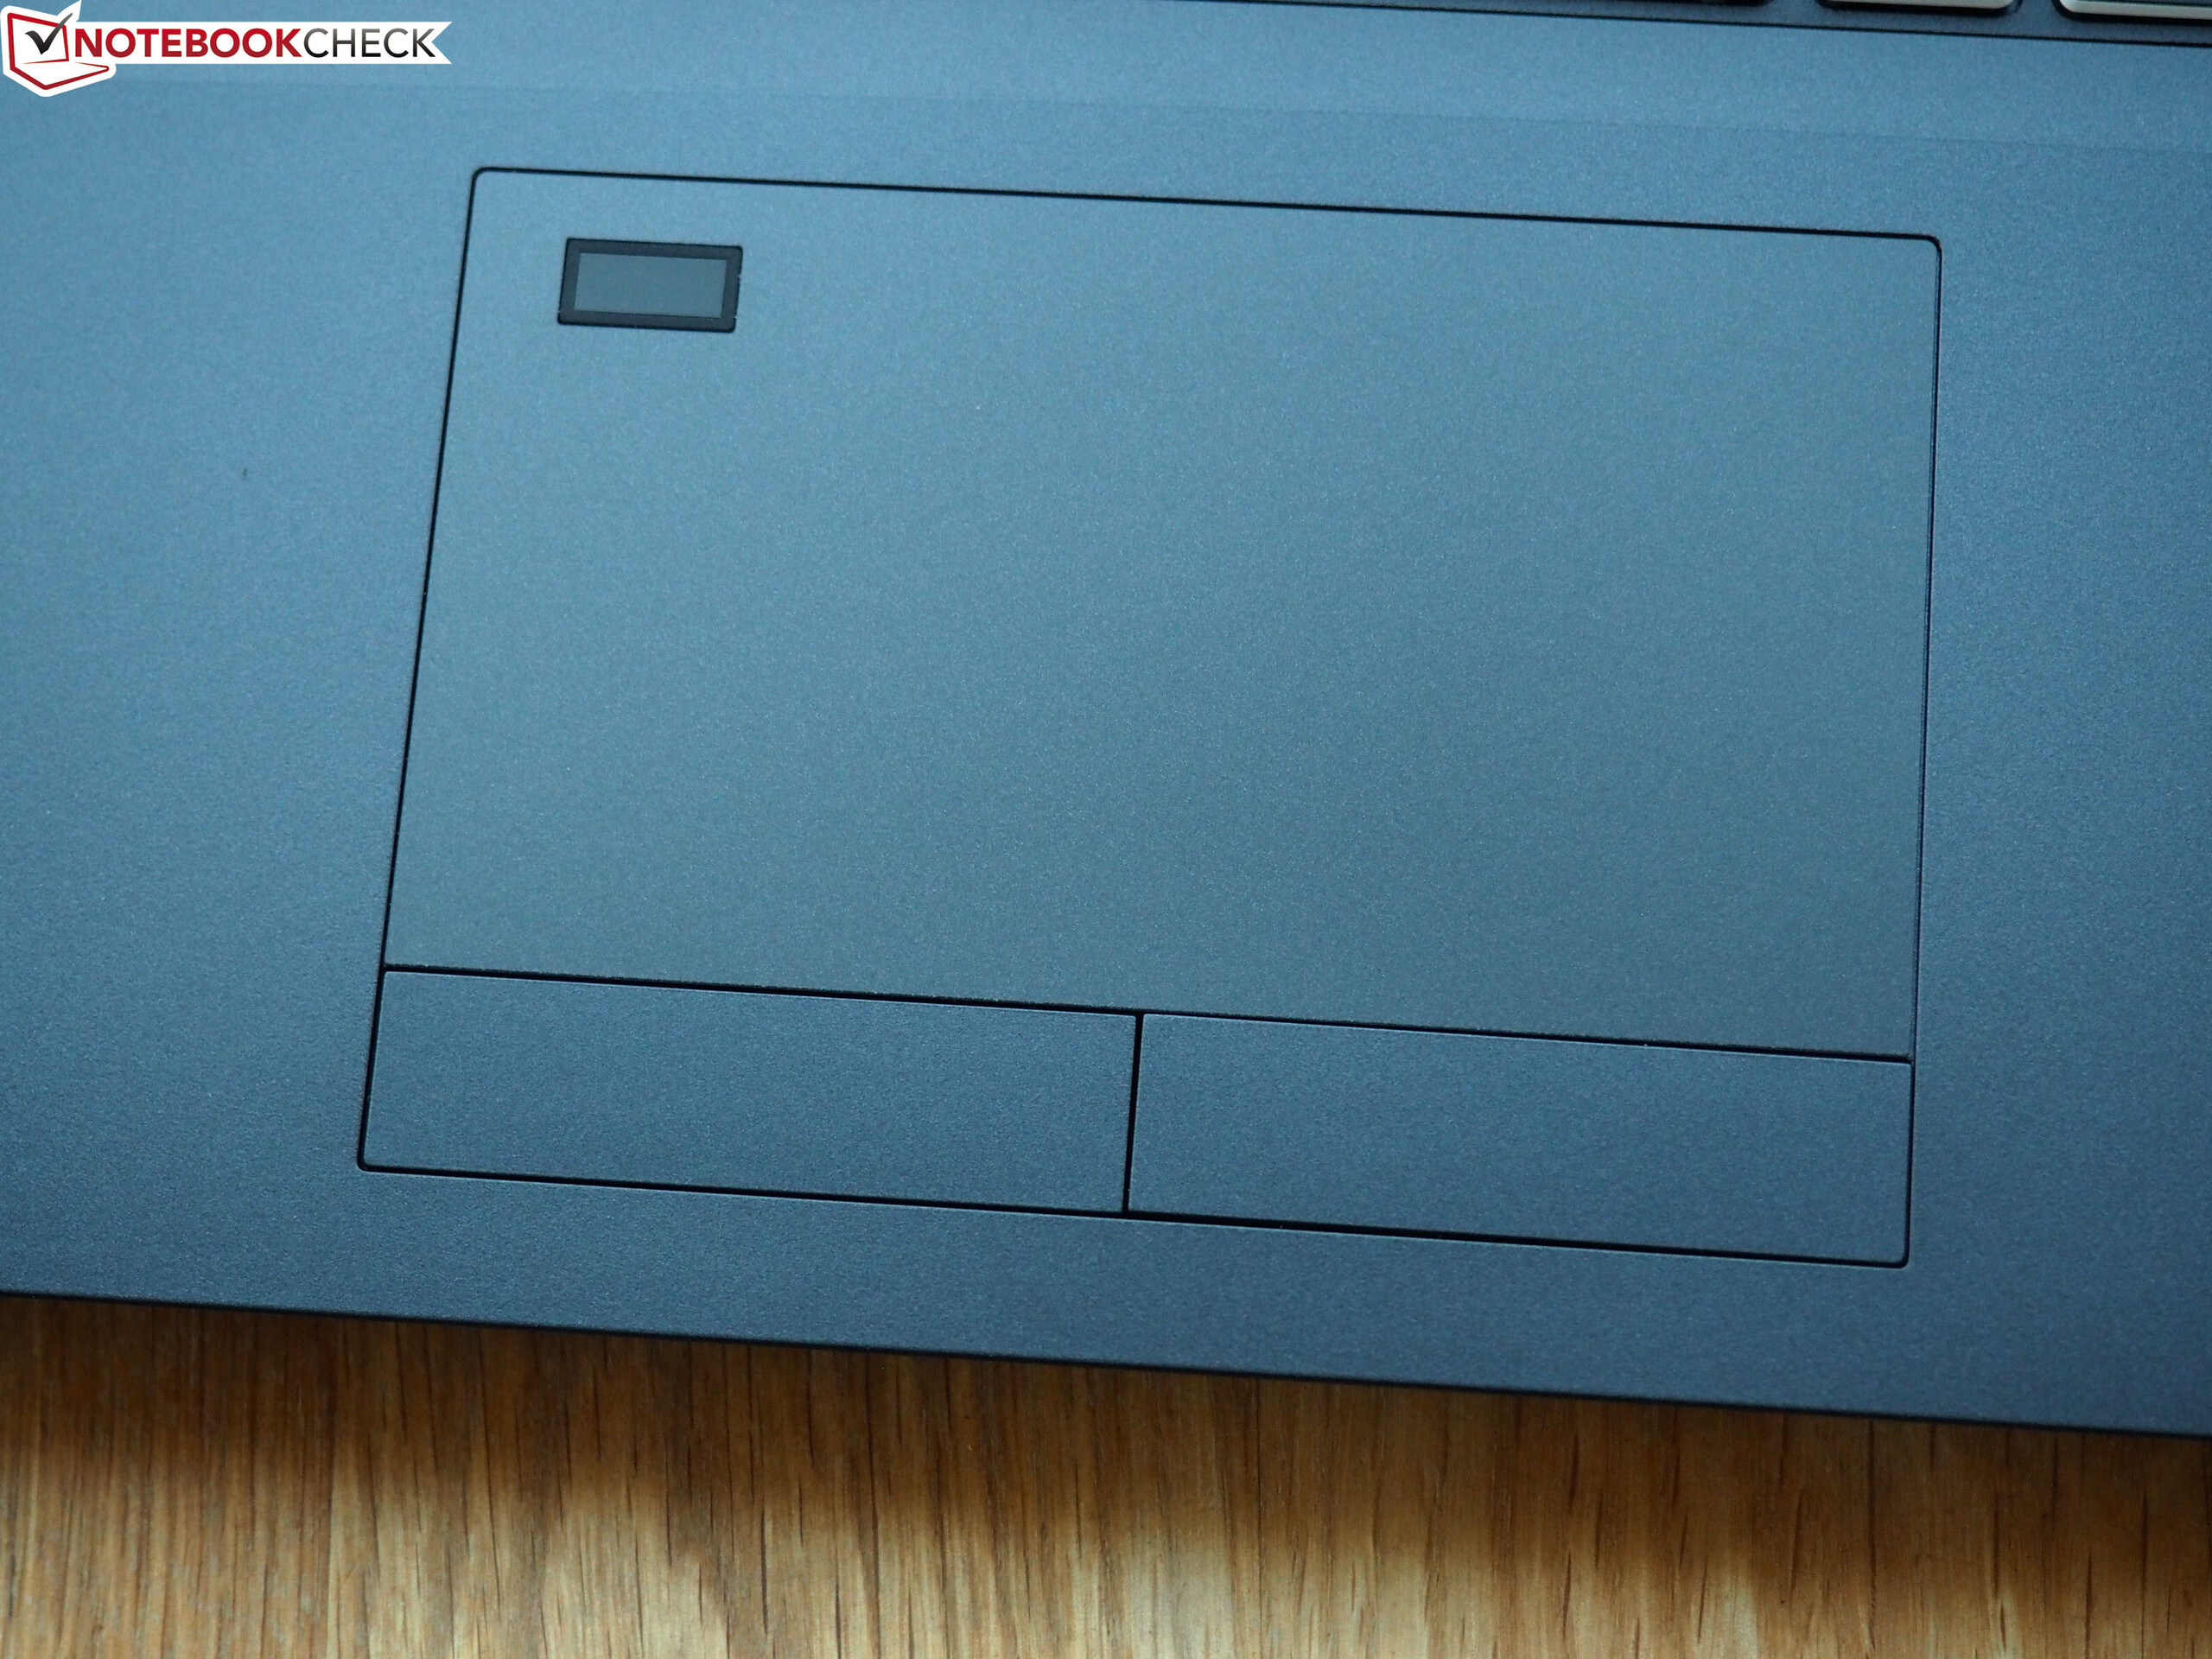
(+) Os apoios para as mãos e o touchpad estão atingindo a temperatura máxima da pele (34 °C / 93.2 F) e, portanto, não estão quentes.
(-) A temperatura média da área do apoio para as mãos de dispositivos semelhantes foi 28.8 °C / 83.8 F (-5.2 °C / -9.4 F).
| Schenker XMG Apex 15 NH57AF1 R9 3900, GeForce RTX 2070 Mobile | Schenker XMG Ultra 15 Turing i7-9700K, GeForce RTX 2070 Mobile | Eurocom Nightsky RX15 i9-9980HK, GeForce RTX 2070 Mobile | MSI GE65 Raider 9SF-049US i9-9880H, GeForce RTX 2070 Mobile | Asus Strix Scar III G531GW i9-9880H, GeForce RTX 2070 Mobile | Média da turma Gaming | |
|---|---|---|---|---|---|---|
| Heat | 9% | -1% | -1% | 2% | 5% | |
| Maximum Upper Side * (°C) | 44 | 45 -2% | 40.2 9% | 45 -2% | 51 -16% | 45.2 ? -3% |
| Maximum Bottom * (°C) | 48 | 48 -0% | 53 -10% | 53 -10% | 49 -2% | 48 ? -0% |
| Idle Upper Side * (°C) | 33 | 30 9% | 34.2 -4% | 31.2 5% | 30 9% | 31.1 ? 6% |
| Idle Bottom * (°C) | 41 | 30 27% | 39.6 3% | 39 5% | 35 15% | 34.2 ? 17% |
* ... menor é melhor
Schenker XMG Apex 15 NH57AF1 análise de áudio
(±) | o volume do alto-falante é médio, mas bom (###valor### dB)
Graves 100 - 315Hz
(-) | quase nenhum baixo - em média 20.7% menor que a mediana
(±) | a linearidade dos graves é média (12.8% delta para a frequência anterior)
Médios 400 - 2.000 Hz
(±) | médios mais altos - em média 7.4% maior que a mediana
(±) | a linearidade dos médios é média (8% delta para frequência anterior)
Altos 2 - 16 kHz
(+) | agudos equilibrados - apenas 4% longe da mediana
(±) | a linearidade dos máximos é média (7.2% delta para frequência anterior)
Geral 100 - 16.000 Hz
(±) | a linearidade do som geral é média (23.5% diferença em relação à mediana)
Comparado com a mesma classe
» 85% de todos os dispositivos testados nesta classe foram melhores, 5% semelhantes, 10% piores
» O melhor teve um delta de 6%, a média foi 18%, o pior foi 132%
Comparado com todos os dispositivos testados
» 70% de todos os dispositivos testados foram melhores, 6% semelhantes, 24% piores
» O melhor teve um delta de 4%, a média foi 24%, o pior foi 134%
Schenker XMG Ultra 15 Turing análise de áudio
(±) | o volume do alto-falante é médio, mas bom (###valor### dB)
Graves 100 - 315Hz
(±) | graves reduzidos - em média 11.1% menor que a mediana
(±) | a linearidade dos graves é média (12.7% delta para a frequência anterior)
Médios 400 - 2.000 Hz
(+) | médios equilibrados - apenas 1.9% longe da mediana
(+) | médios são lineares (4.3% delta para frequência anterior)
Altos 2 - 16 kHz
(+) | agudos equilibrados - apenas 3.6% longe da mediana
(+) | os máximos são lineares (3.3% delta da frequência anterior)
Geral 100 - 16.000 Hz
(+) | o som geral é linear (14.5% diferença em relação à mediana)
Comparado com a mesma classe
» 27% de todos os dispositivos testados nesta classe foram melhores, 7% semelhantes, 66% piores
» O melhor teve um delta de 6%, a média foi 18%, o pior foi 132%
Comparado com todos os dispositivos testados
» 18% de todos os dispositivos testados foram melhores, 4% semelhantes, 78% piores
» O melhor teve um delta de 4%, a média foi 24%, o pior foi 134%
| desligado | |
| Ocioso | |
| Carga |
|
Key:
min: | |
| Schenker XMG Apex 15 NH57AF1 R9 3900, GeForce RTX 2070 Mobile | Schenker XMG Ultra 15 Turing i7-9700K, GeForce RTX 2070 Mobile | Eurocom Nightsky RX15 i9-9980HK, GeForce RTX 2070 Mobile | MSI GE65 Raider 9SF-049US i9-9880H, GeForce RTX 2070 Mobile | Asus Strix Scar III G531GW i9-9880H, GeForce RTX 2070 Mobile | Média da turma Gaming | |
|---|---|---|---|---|---|---|
| Power Consumption | 19% | 37% | 42% | 28% | 46% | |
| Idle Minimum * (Watt) | 55 | 35 36% | 12.6 77% | 15 73% | 29 47% | 13.2 ? 76% |
| Idle Average * (Watt) | 59 | 39 34% | 21.4 64% | 18.5 69% | 32 46% | 18.9 ? 68% |
| Idle Maximum * (Watt) | 63 | 47 25% | 34.4 45% | 20.2 68% | 37 41% | 24.3 ? 61% |
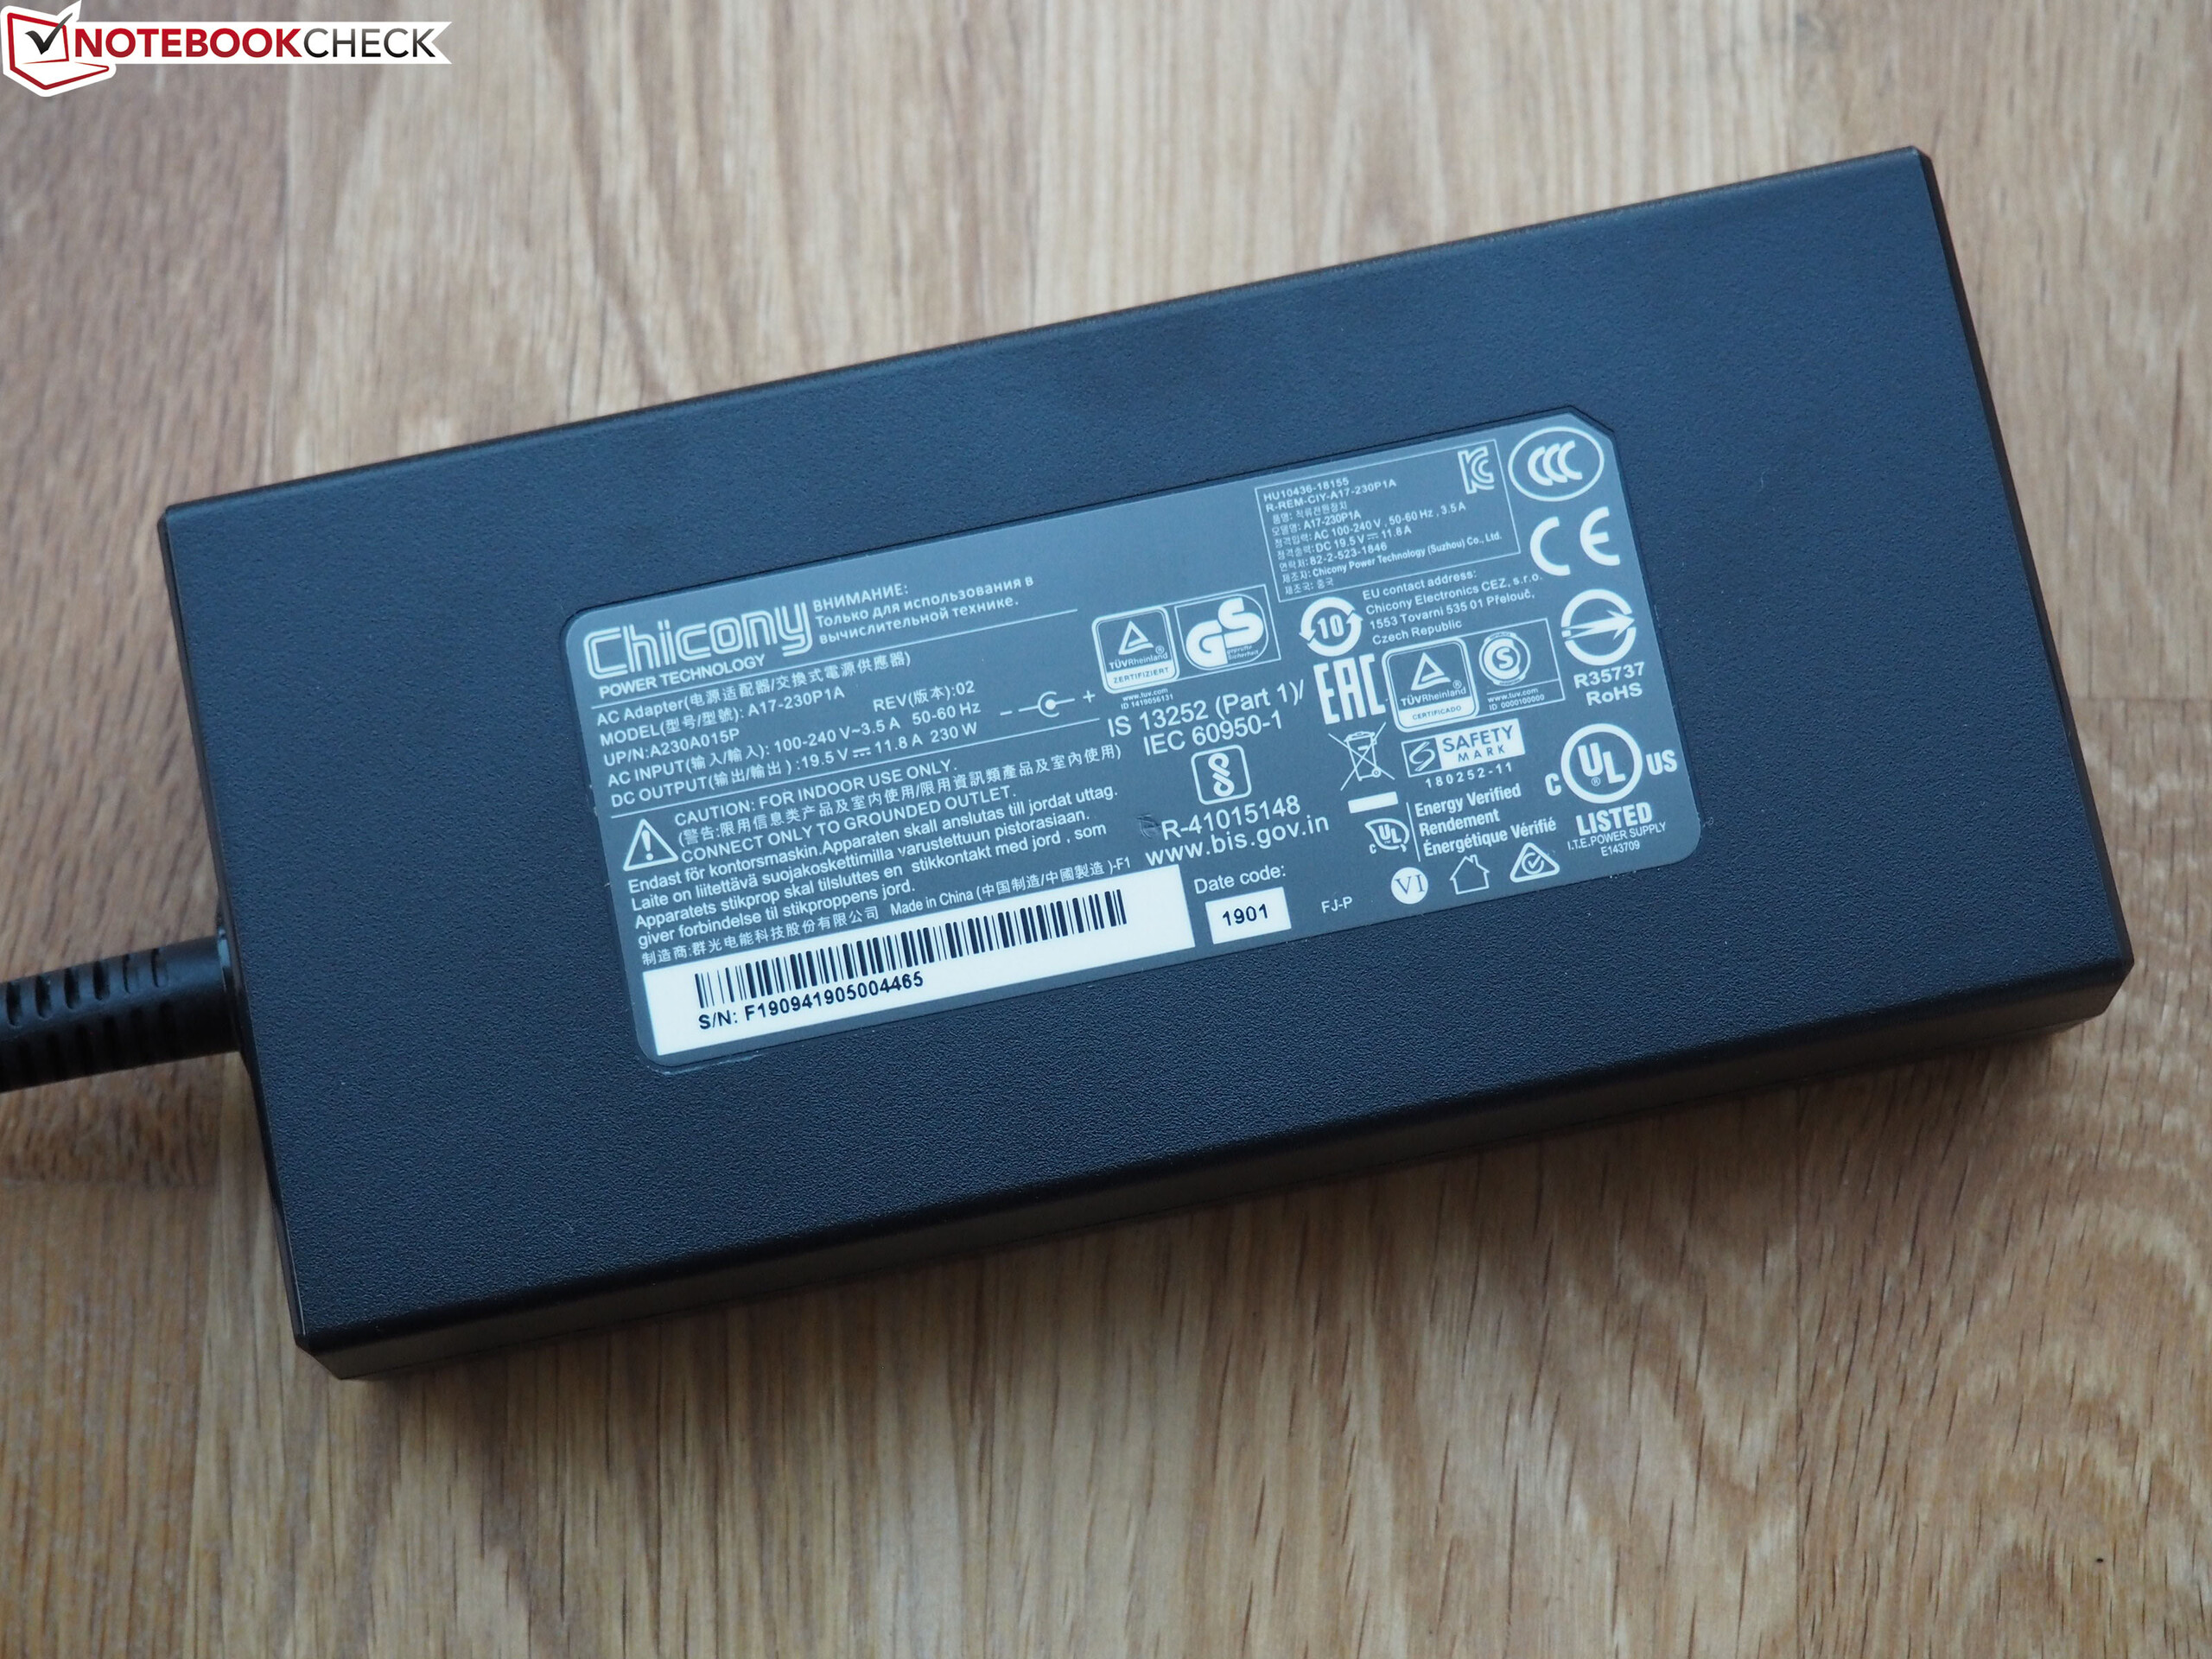
| Load Average * (Watt) | 141 | 117 17% | 123.2 13% | 110.9 21% | 157 -11% | 108 ? 23% |
| Witcher 3 ultra * (Watt) | 238 | 196 18% | 192.4 19% | 187.3 21% | 173 27% | |
| Load Maximum * (Watt) | 259 | 299 -15% | 246.6 5% | 260 -0% | 217 16% | 254 ? 2% |
* ... menor é melhor
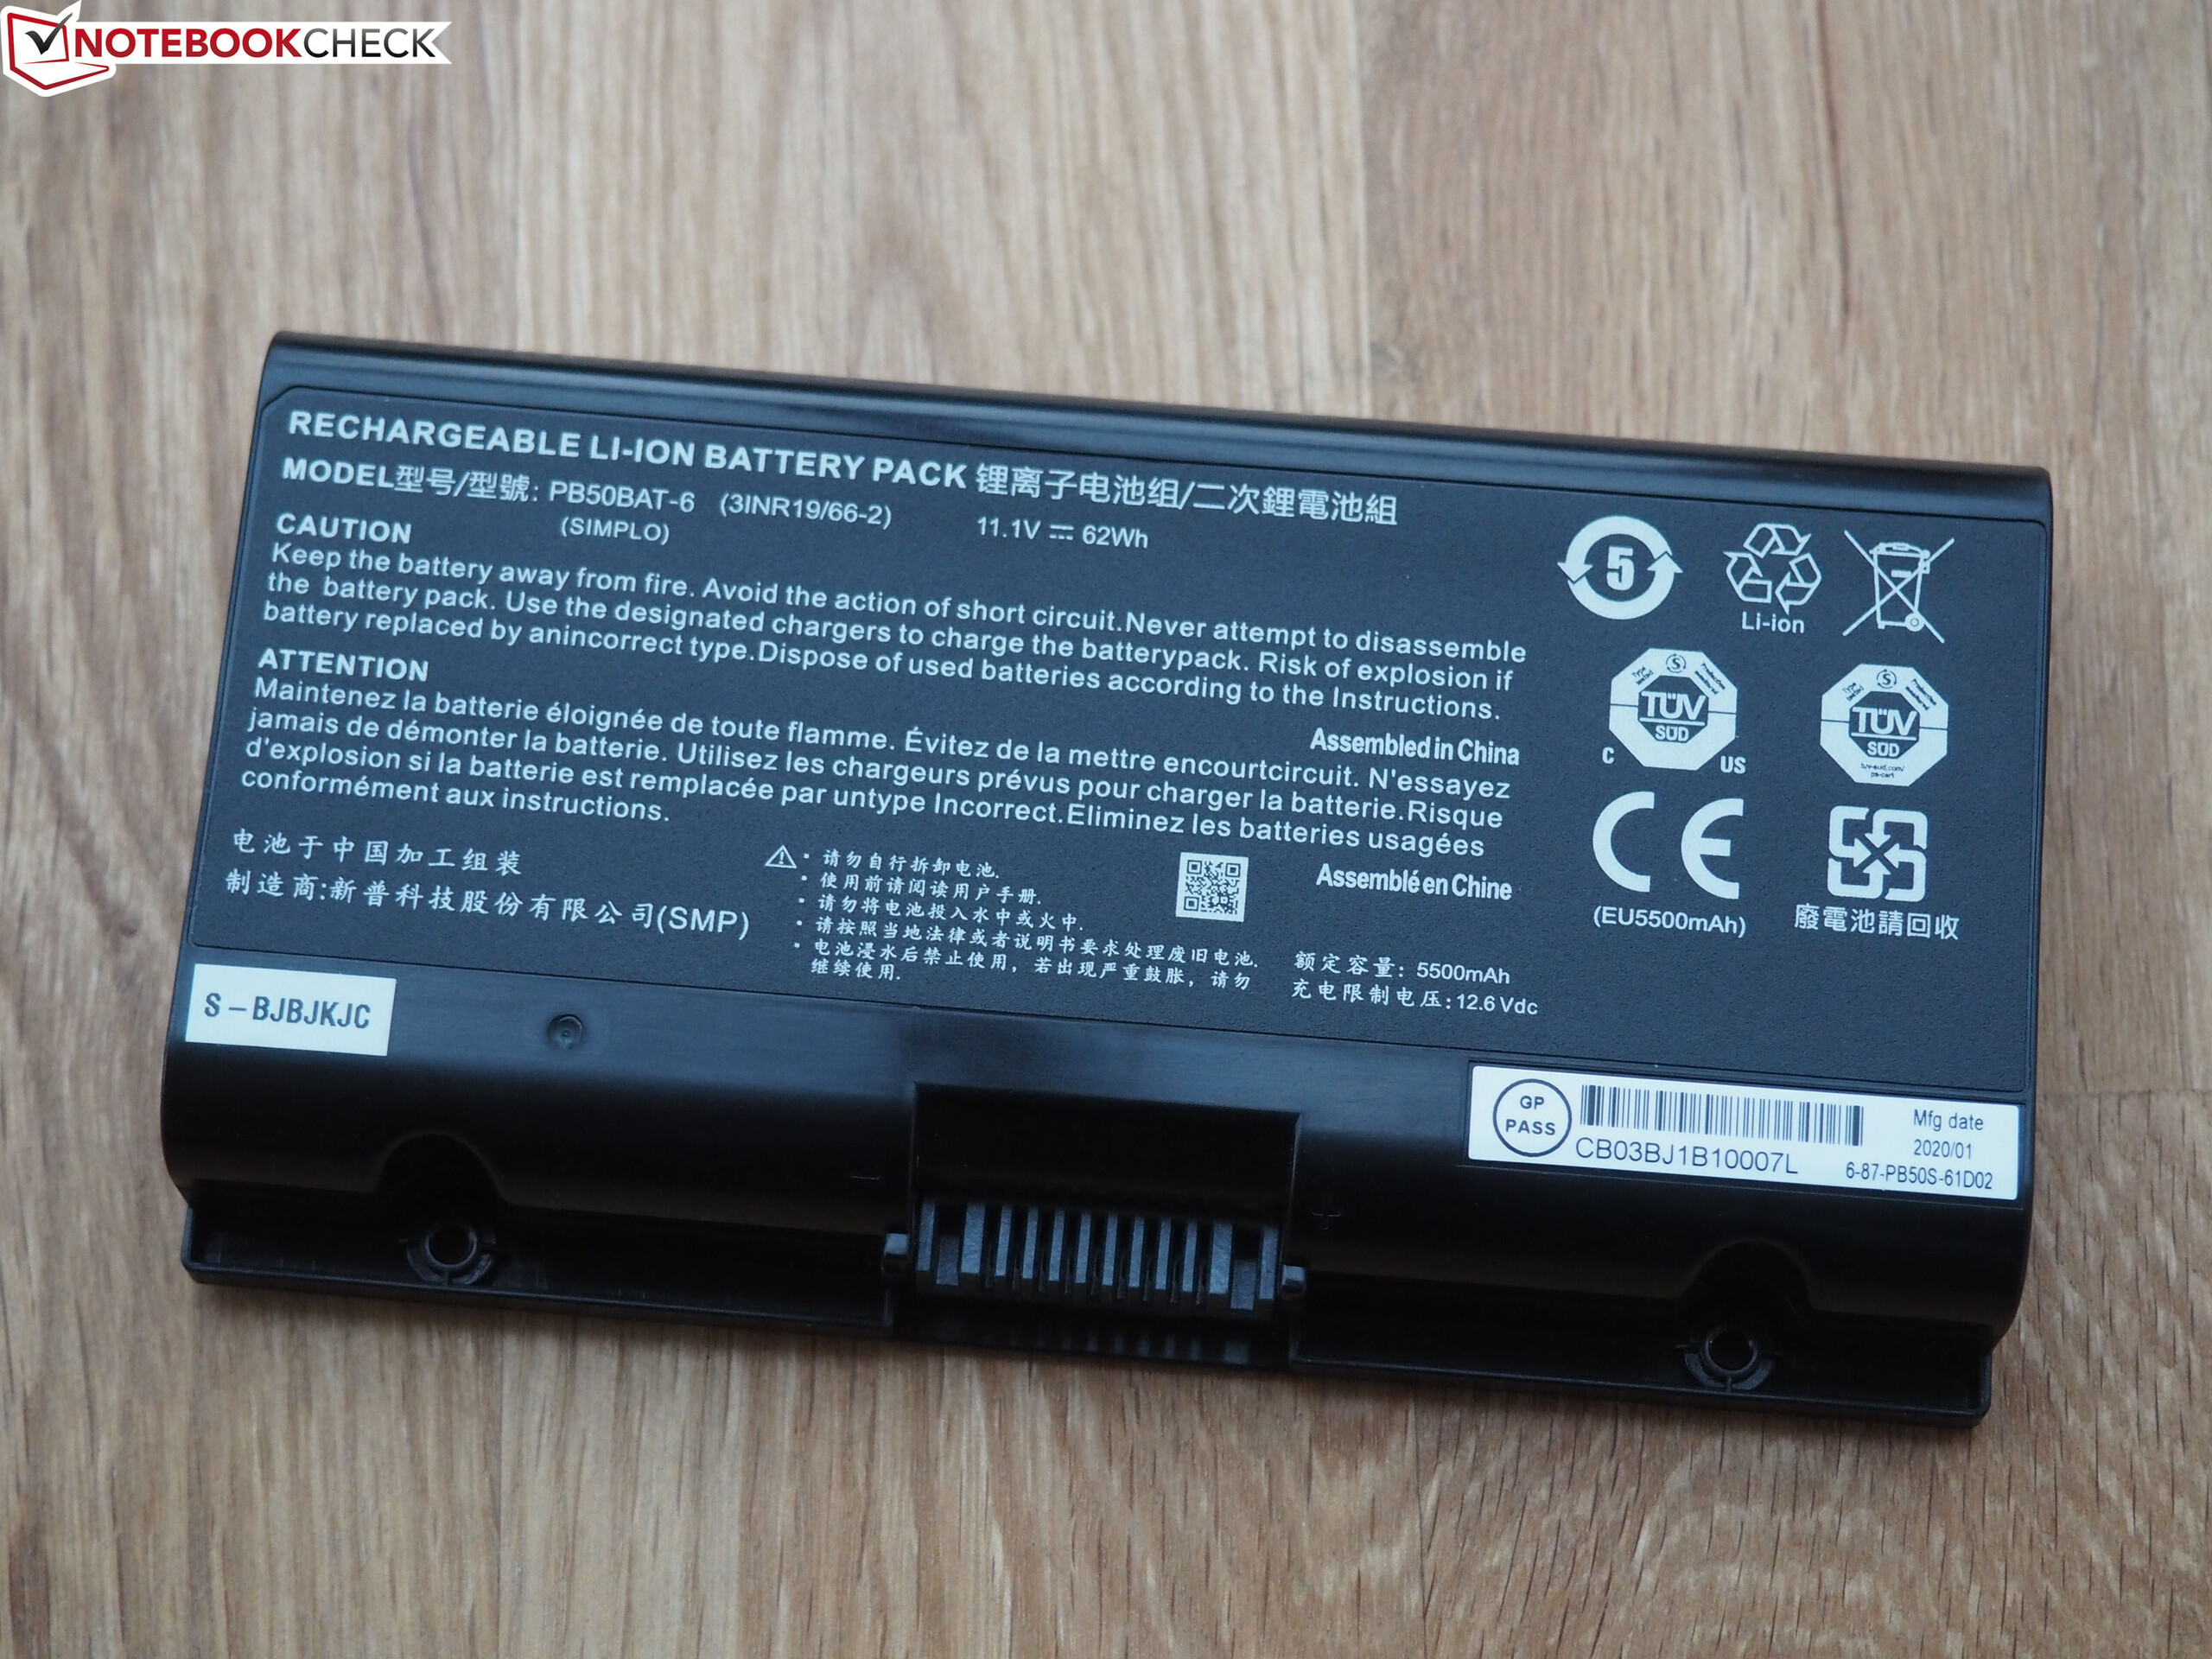
| Schenker XMG Apex 15 NH57AF1 R9 3900, GeForce RTX 2070 Mobile, 62 Wh | Schenker XMG Ultra 15 Turing i7-9700K, GeForce RTX 2070 Mobile, 82 Wh | Eurocom Nightsky RX15 i9-9980HK, GeForce RTX 2070 Mobile, 62 Wh | MSI GE65 Raider 9SF-049US i9-9880H, GeForce RTX 2070 Mobile, 51 Wh | Asus Strix Scar III G531GW i9-9880H, GeForce RTX 2070 Mobile, 66 Wh | Média da turma Gaming | |
|---|---|---|---|---|---|---|
| Duração da bateria | 169% | 240% | 232% | 246% | 474% | |
| Reader / Idle (h) | 1.2 | 3.2 167% | 6.2 417% | 5.5 358% | 8.71 ? 626% | |
| WiFi v1.3 (h) | 1 | 2.6 160% | 3.4 240% | 3.6 260% | 3 200% | 7.02 ? 602% |
| Load (h) | 0.5 | 1.4 180% | 0.6 20% | 1.4 180% | 1.47 ? 194% | |
| H.264 (h) | 2.6 | 8.26 ? |
Pro
Contra
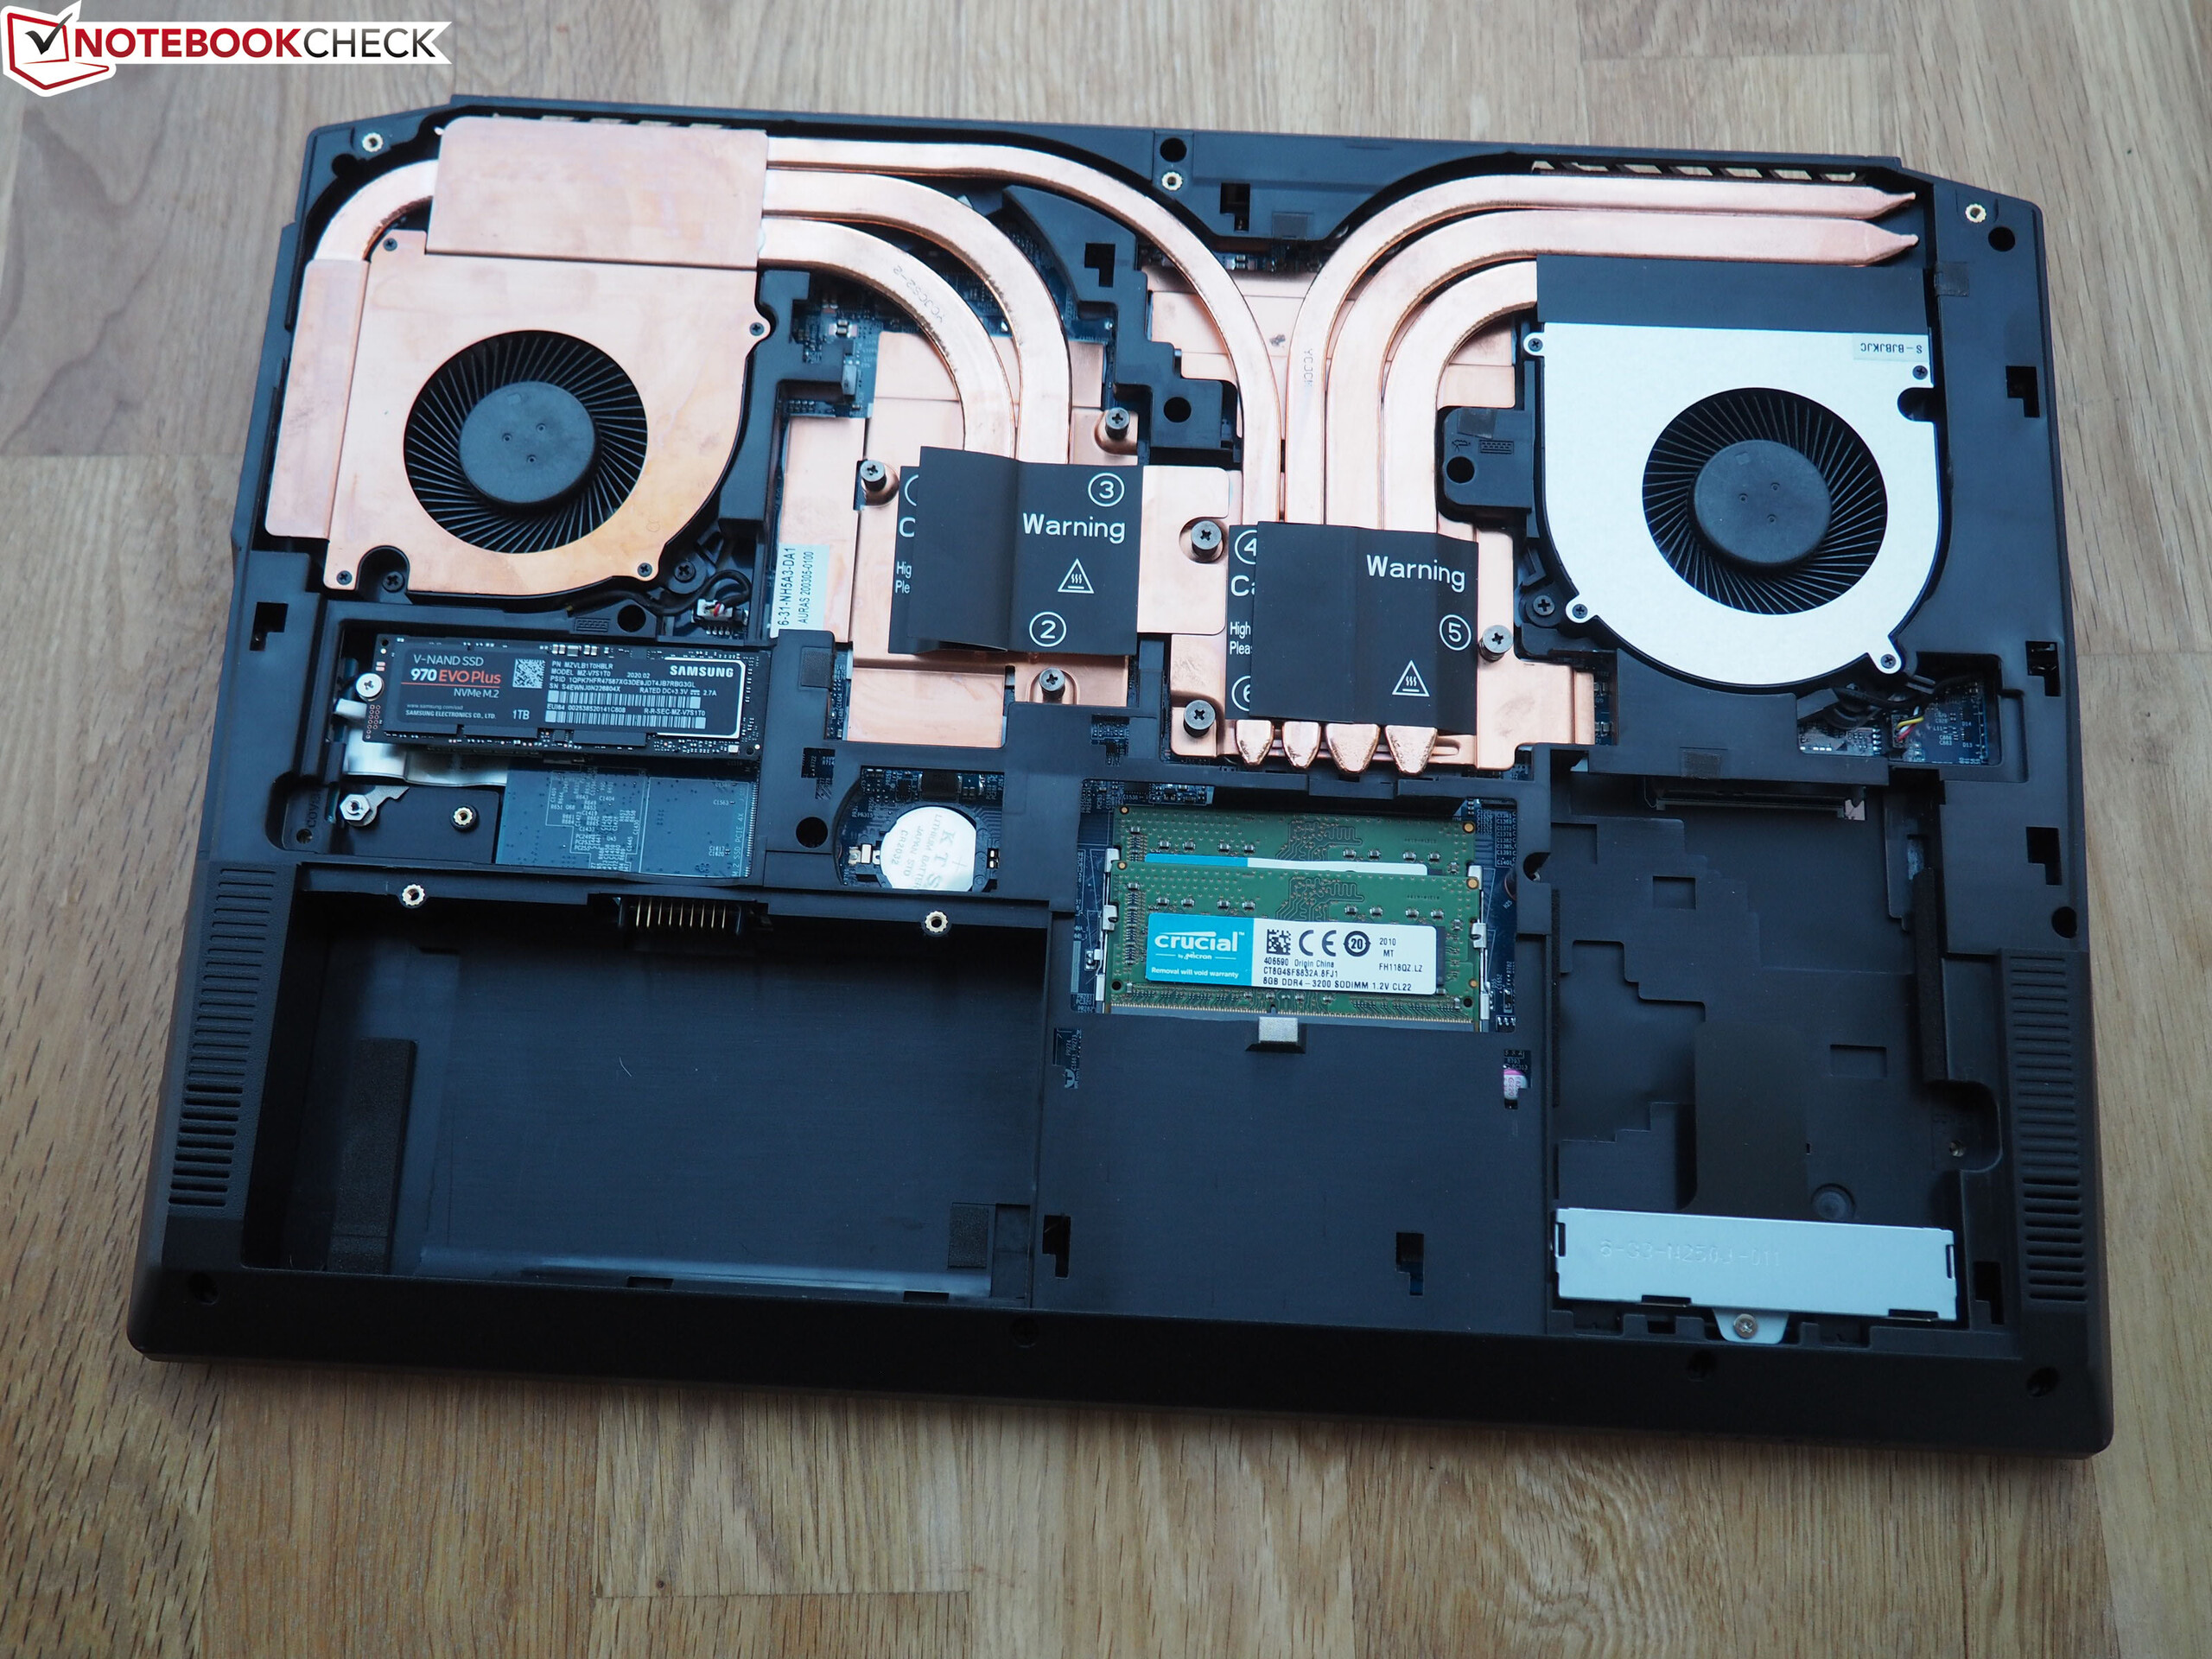
12 núcleos e 24 threads em um portátil: O que parece maravilhoso tem algumas armadilhas no uso diário.
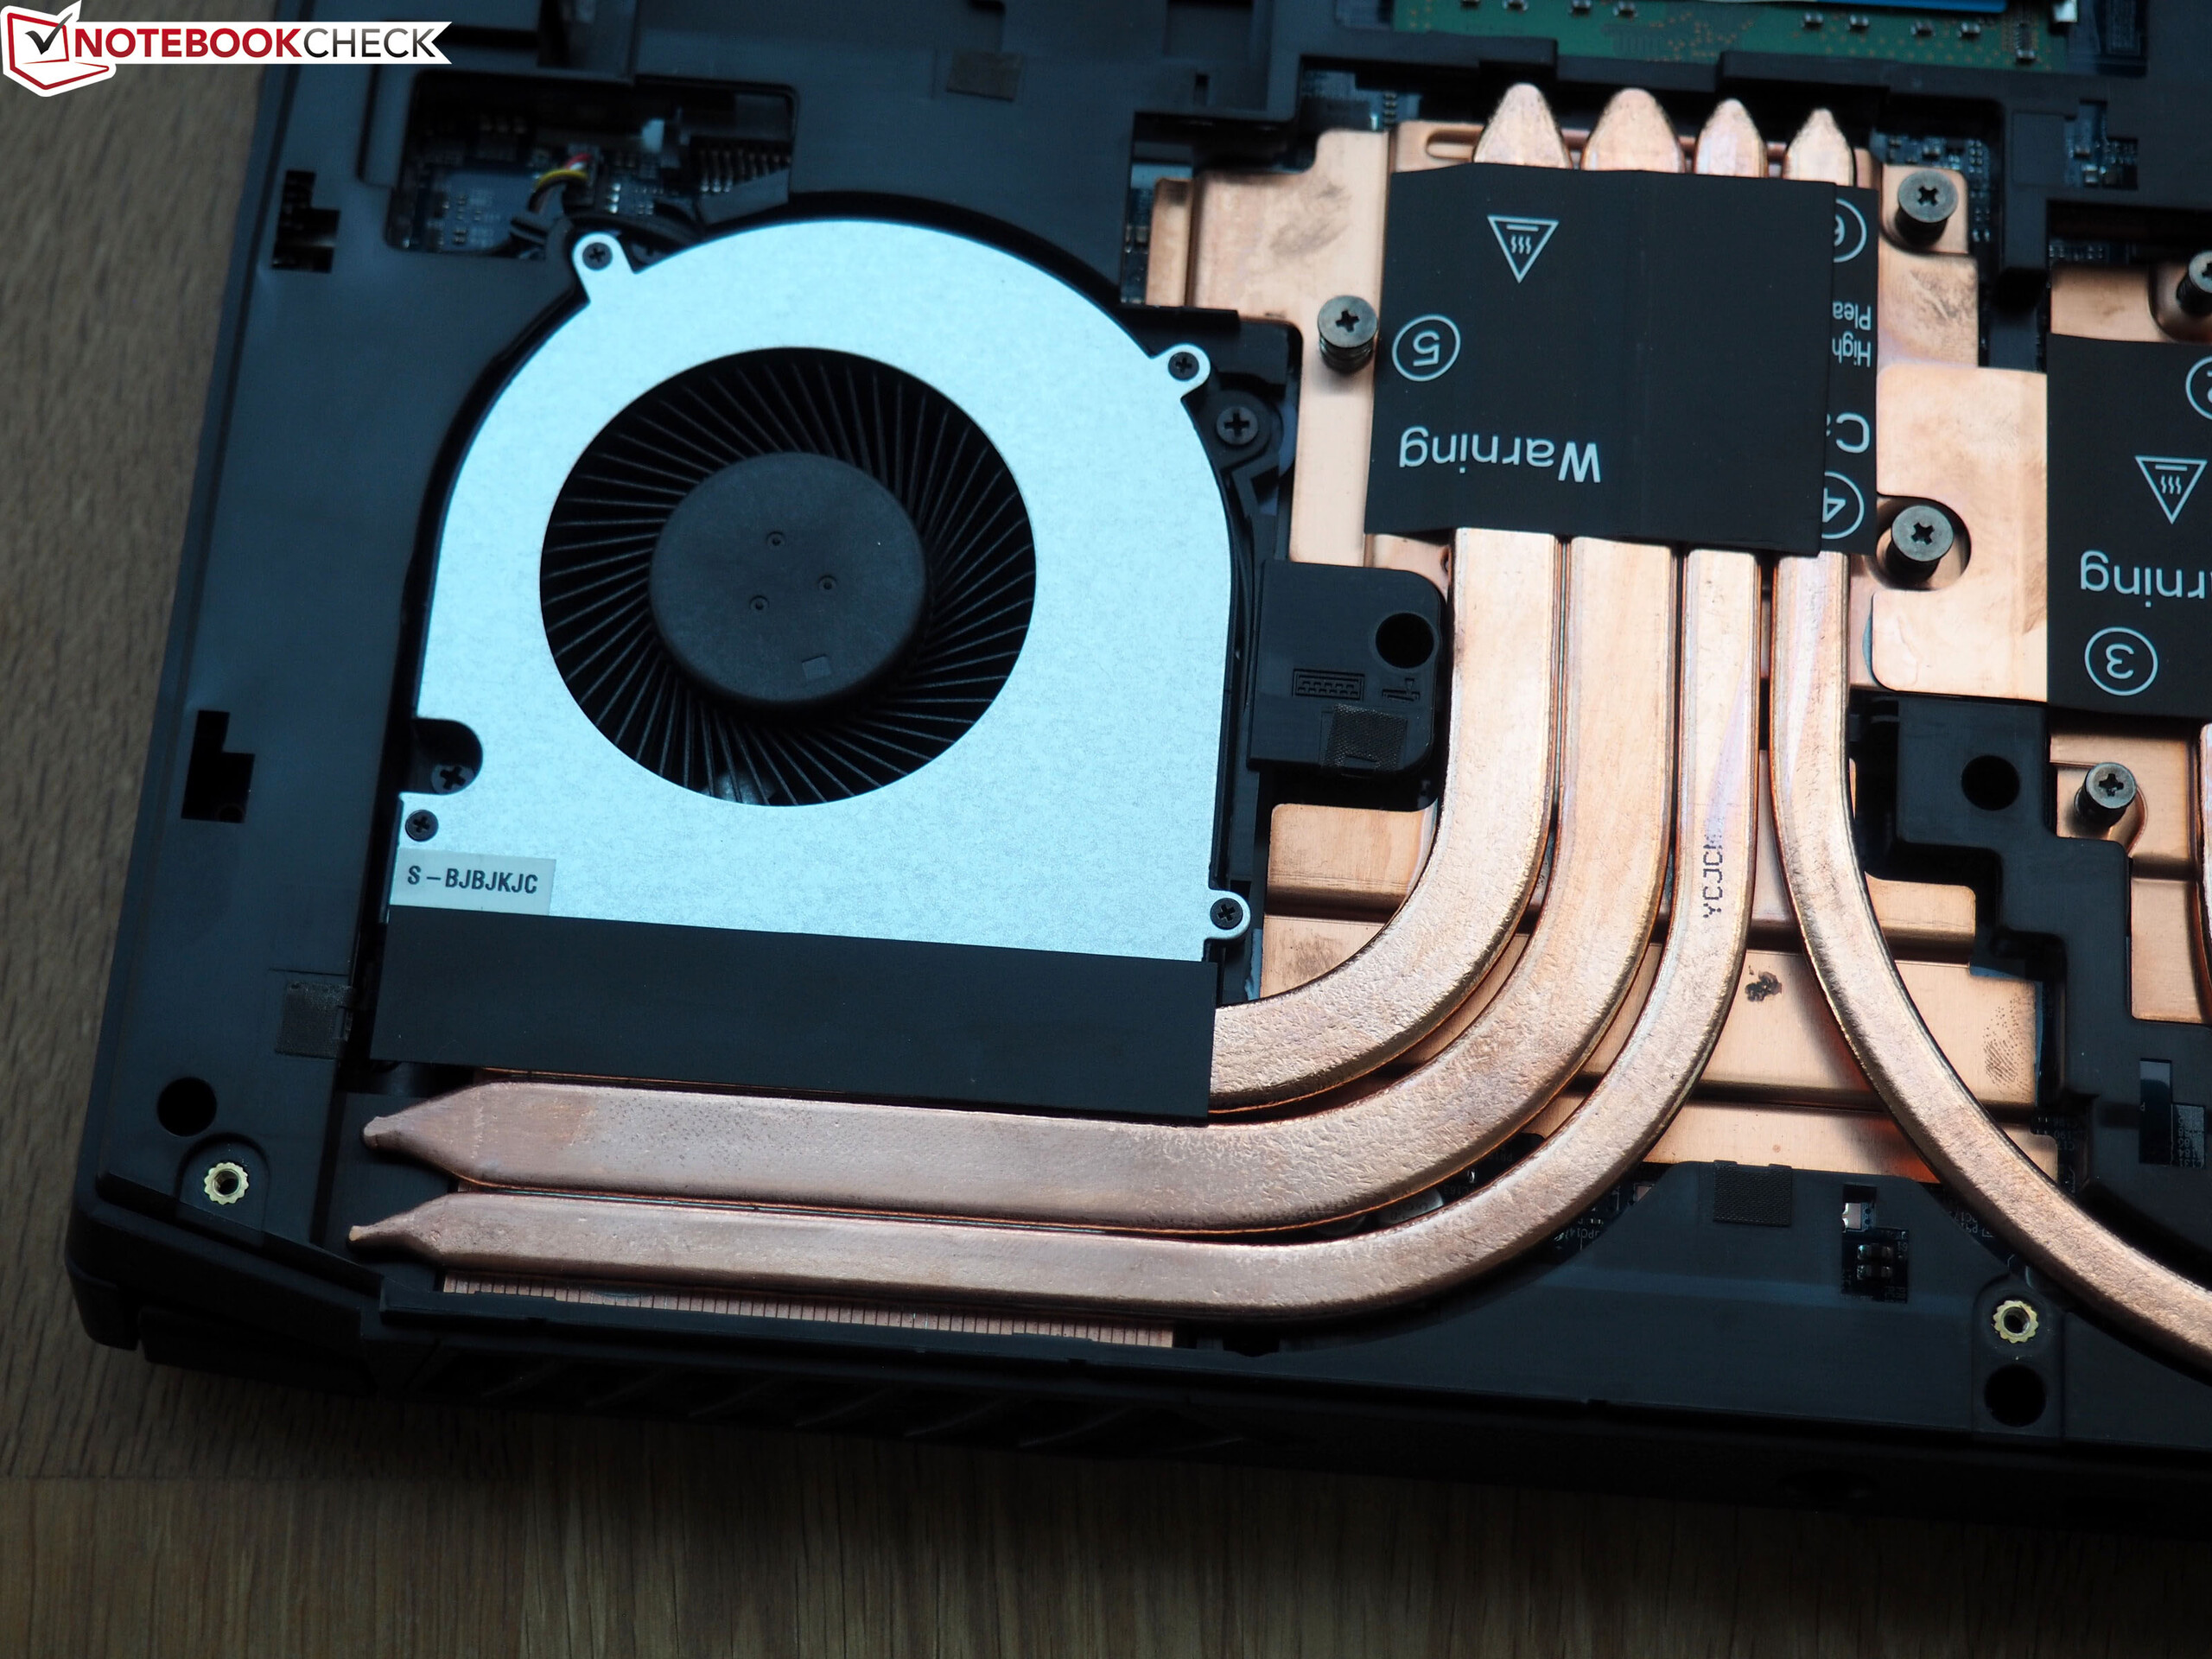
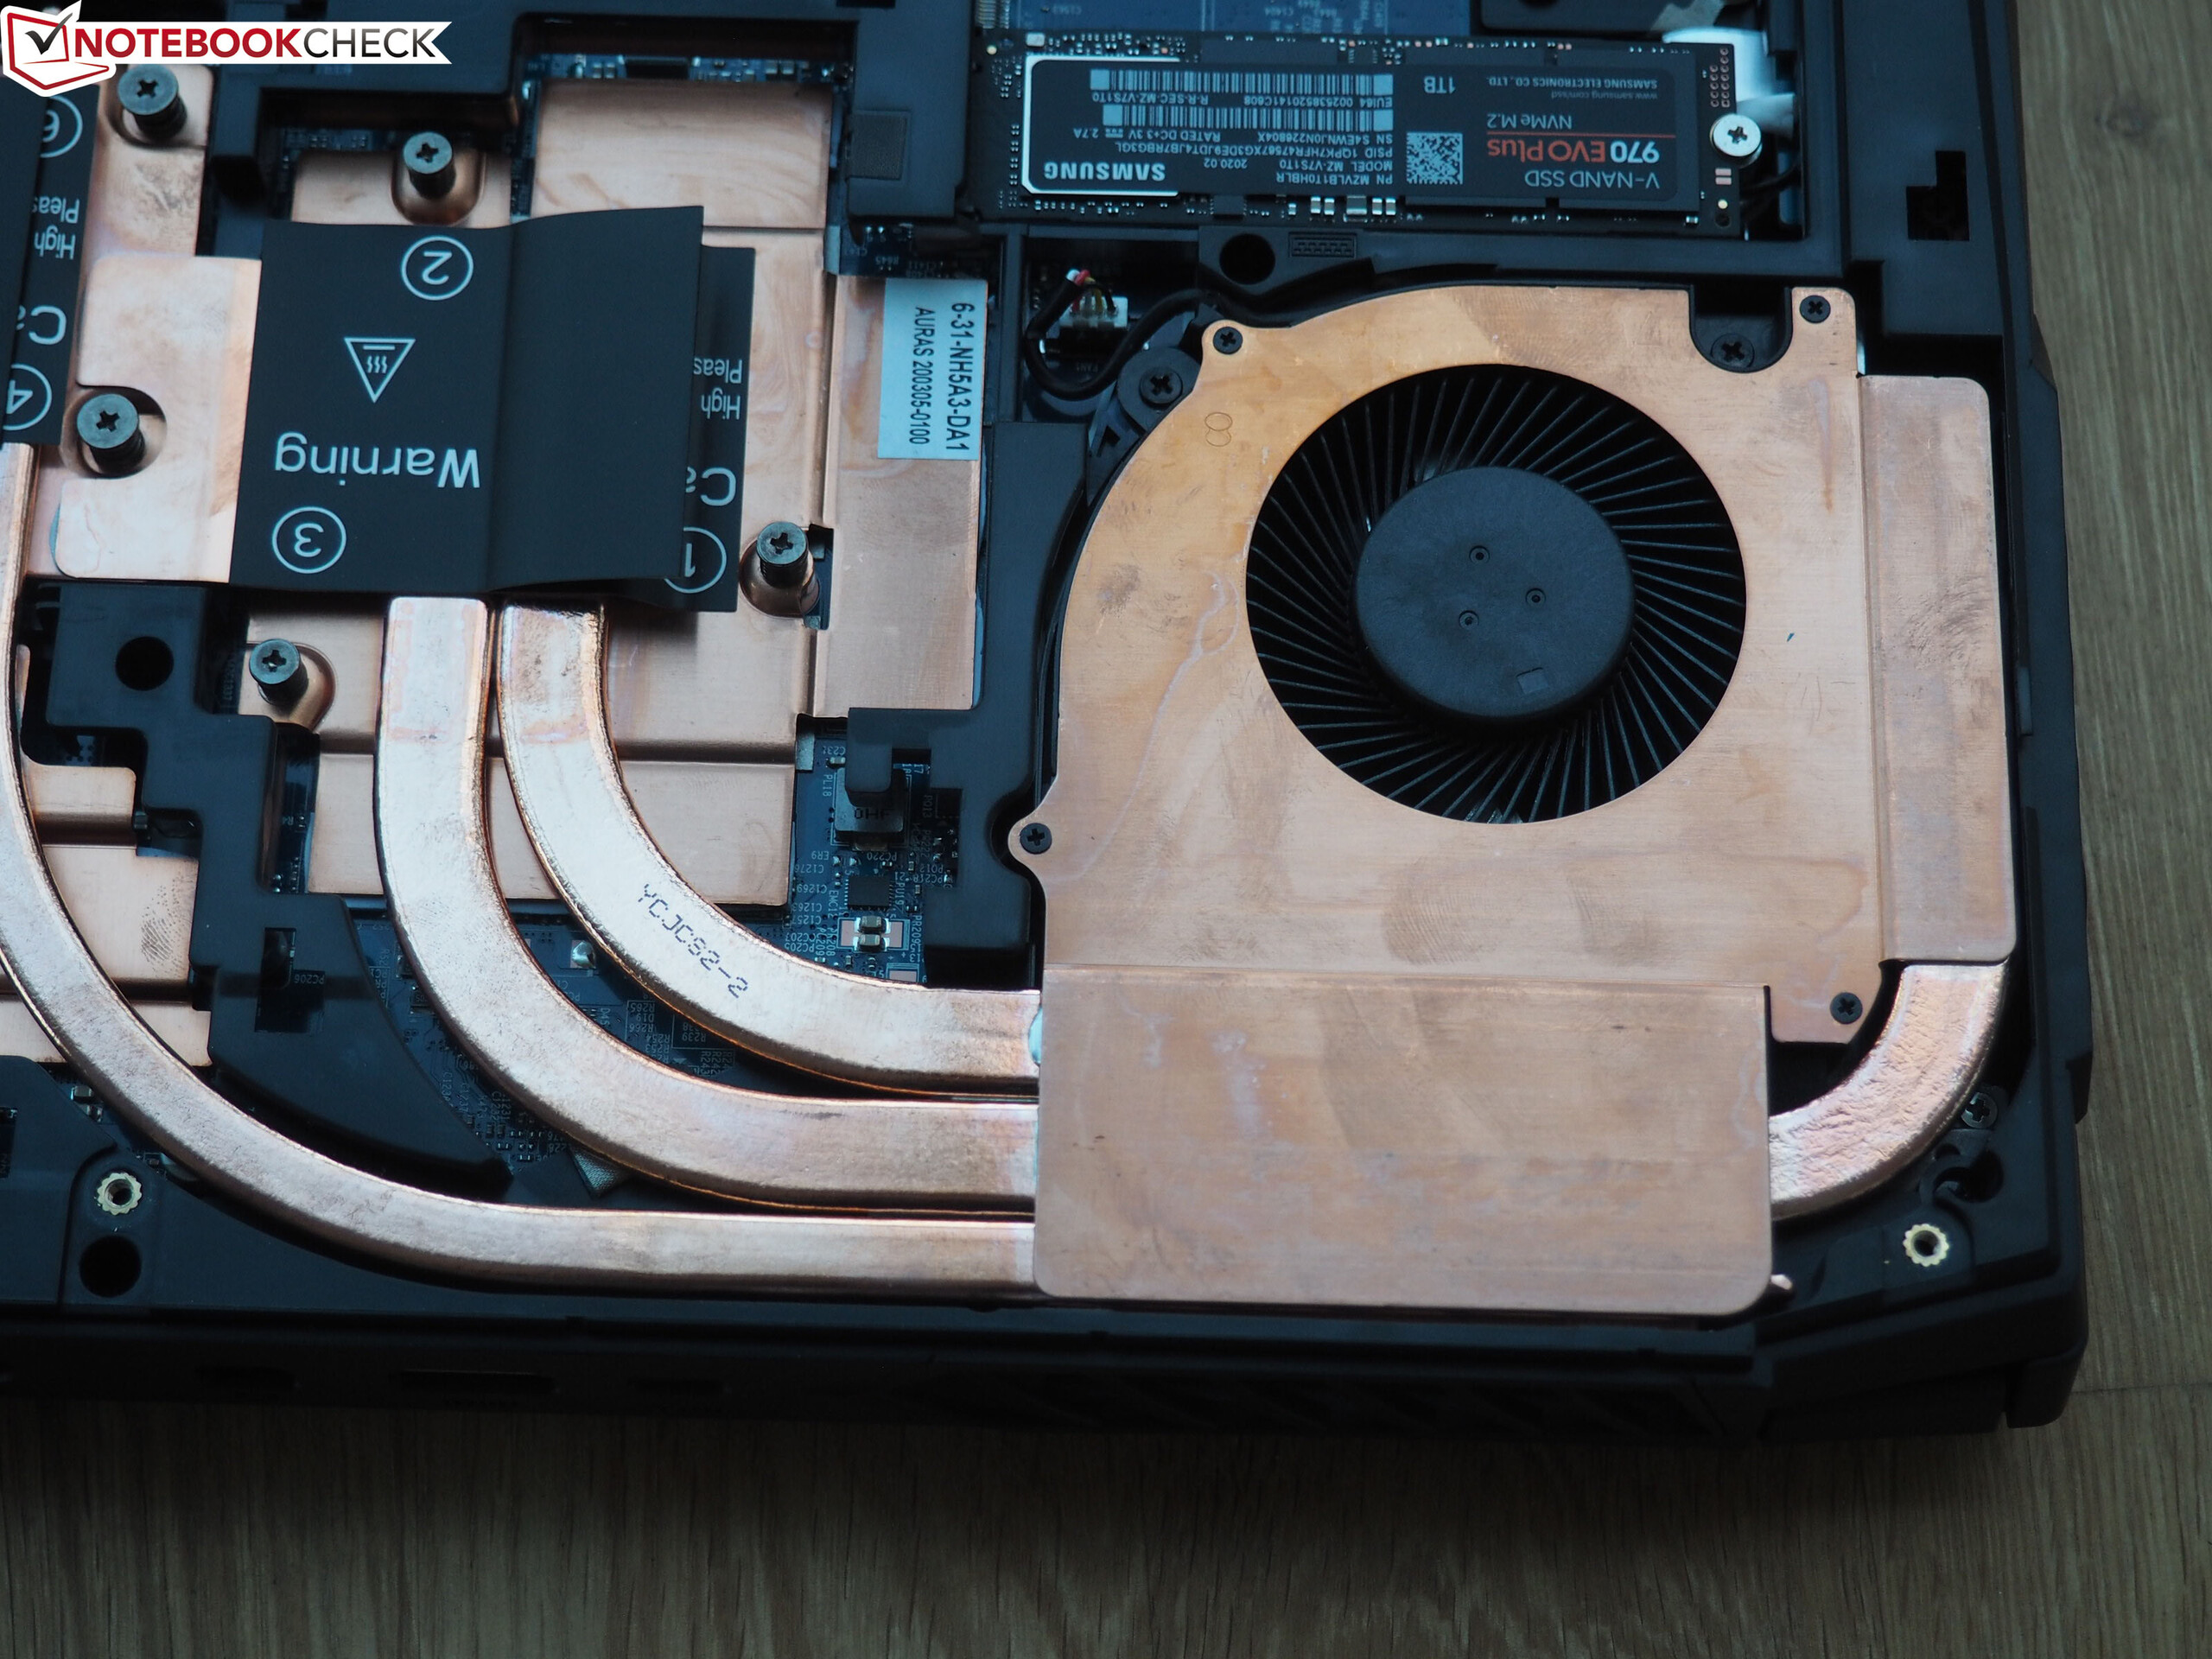
Os escassos mecanismos de economia de energia da CPU AMD significam que o Ryzen 9 3900 é muito barulhento (3000 - 4000 rpm) e quente (60 - 70 °C), ocioso e executando tarefas simples, como assistir a vídeos ou navegar na web. Felizmente, você pode alternar para o modo silencioso.
É por isso que dificilmente podemos recomendar o Apex 15 - embora a Schenker esteja planejando uma atualização do BIOS. Um melhor gerenciamento de energia e controle dos ventiladores de refrigeração (modo de entretenimento e desempenho) tornaria esse novato sofisticado um dispositivo interessante para os fãs da AMD. Não conhecemos nenhum portátil de 15 polegadas que ofereça tanto poder de CPU quanto este. A maioria dos modelos Intel é muito mais lenta.
Schenker XMG Apex 15 NH57AF1
- 05/06/2020 v7 (old)
Florian Glaser
Price comparison