Breve Análise do Portátil Acer Aspire 3 (7200U, HD 620)

| SD Card Reader | |
| average JPG Copy Test (av. of 3 runs) | |
| Fujitsu Lifebook A557 (Toshiba Exceria Pro SDXC 64 GB UHS-II) | |
| Dell Latitude 5580 (Toshiba Exceria Pro SDXC 64 GB UHS-II) | |
| Acer Aspire 3 A315-51-55E4 (Toshiba Exceria Pro SDXC 64 GB UHS-II) | |
| Lenovo ThinkPad E570-20H6S00000 (Toshiba Exceria Pro SDXC 64 GB UHS-II) | |
| HP Pavilion 14-al103ng (Toshiba Exceria Pro SDXC 64 GB UHS-II) | |
| maximum AS SSD Seq Read Test (1GB) | |
| Dell Latitude 5580 (Toshiba Exceria Pro SDXC 64 GB UHS-II) | |
| Fujitsu Lifebook A557 (Toshiba Exceria Pro SDXC 64 GB UHS-II) | |
| HP Pavilion 14-al103ng (Toshiba Exceria Pro SDXC 64 GB UHS-II) | |
| Acer Aspire 3 A315-51-55E4 (Toshiba Exceria Pro SDXC 64 GB UHS-II) | |
| Lenovo ThinkPad E570-20H6S00000 (Toshiba Exceria Pro SDXC 64 GB UHS-II) | |
| Networking | |
| iperf3 transmit AX12 | |
| Fujitsu Lifebook A557 | |
| Dell Latitude 5580 | |
| Lenovo ThinkPad E570-20H6S00000 | |
| Acer Aspire 3 A315-51-55E4 | |
| HP Pavilion 14-al103ng | |
| iperf3 receive AX12 | |
| Fujitsu Lifebook A557 | |
| Dell Latitude 5580 | |
| Lenovo ThinkPad E570-20H6S00000 | |
| Acer Aspire 3 A315-51-55E4 | |
| HP Pavilion 14-al103ng | |
| |||||||||||||||||||||||||
iluminação: 87 %
iluminação com acumulador: 241 cd/m²
Contraste: 524:1 (Preto: 0.46 cd/m²)
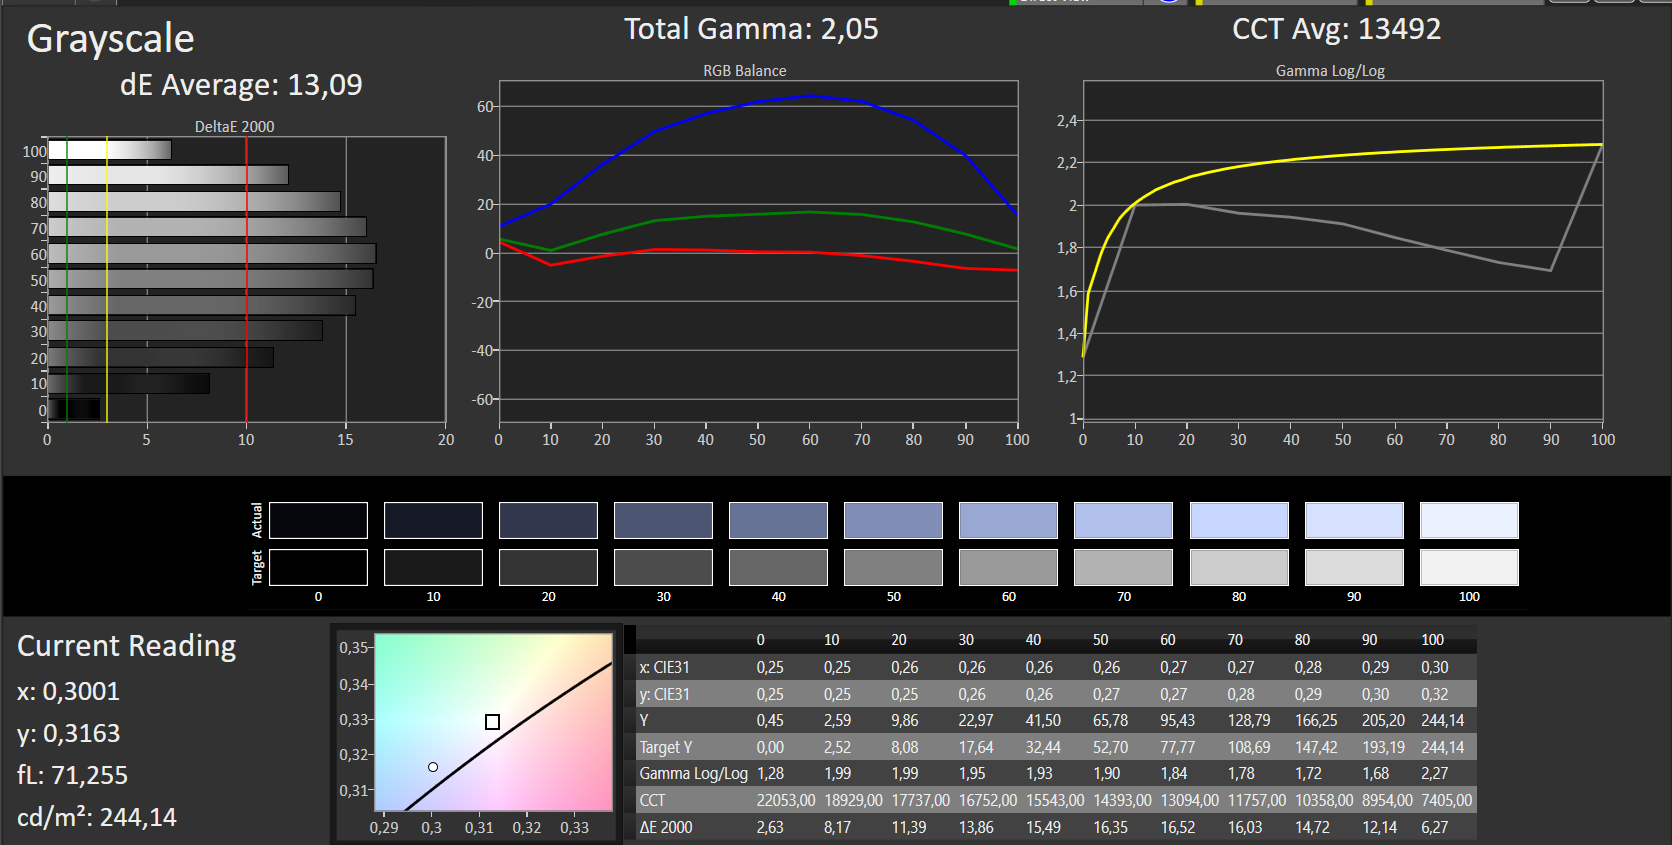
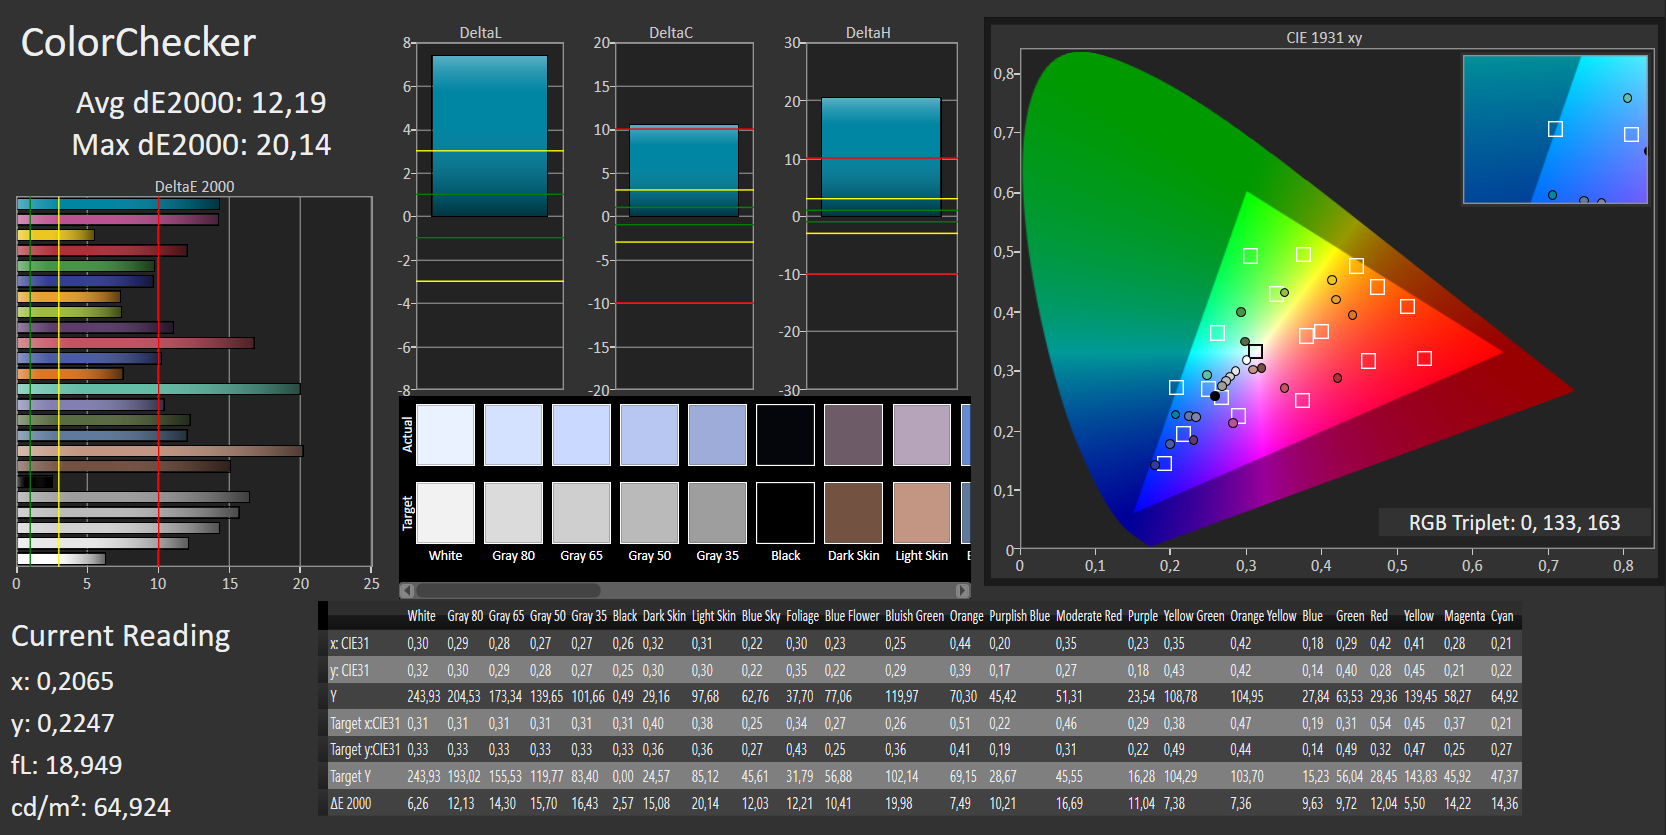
ΔE ColorChecker Calman: 3.4 | ∀{0.5-29.43 Ø4.71}
ΔE Greyscale Calman: 1.7 | ∀{0.09-98 Ø4.96}
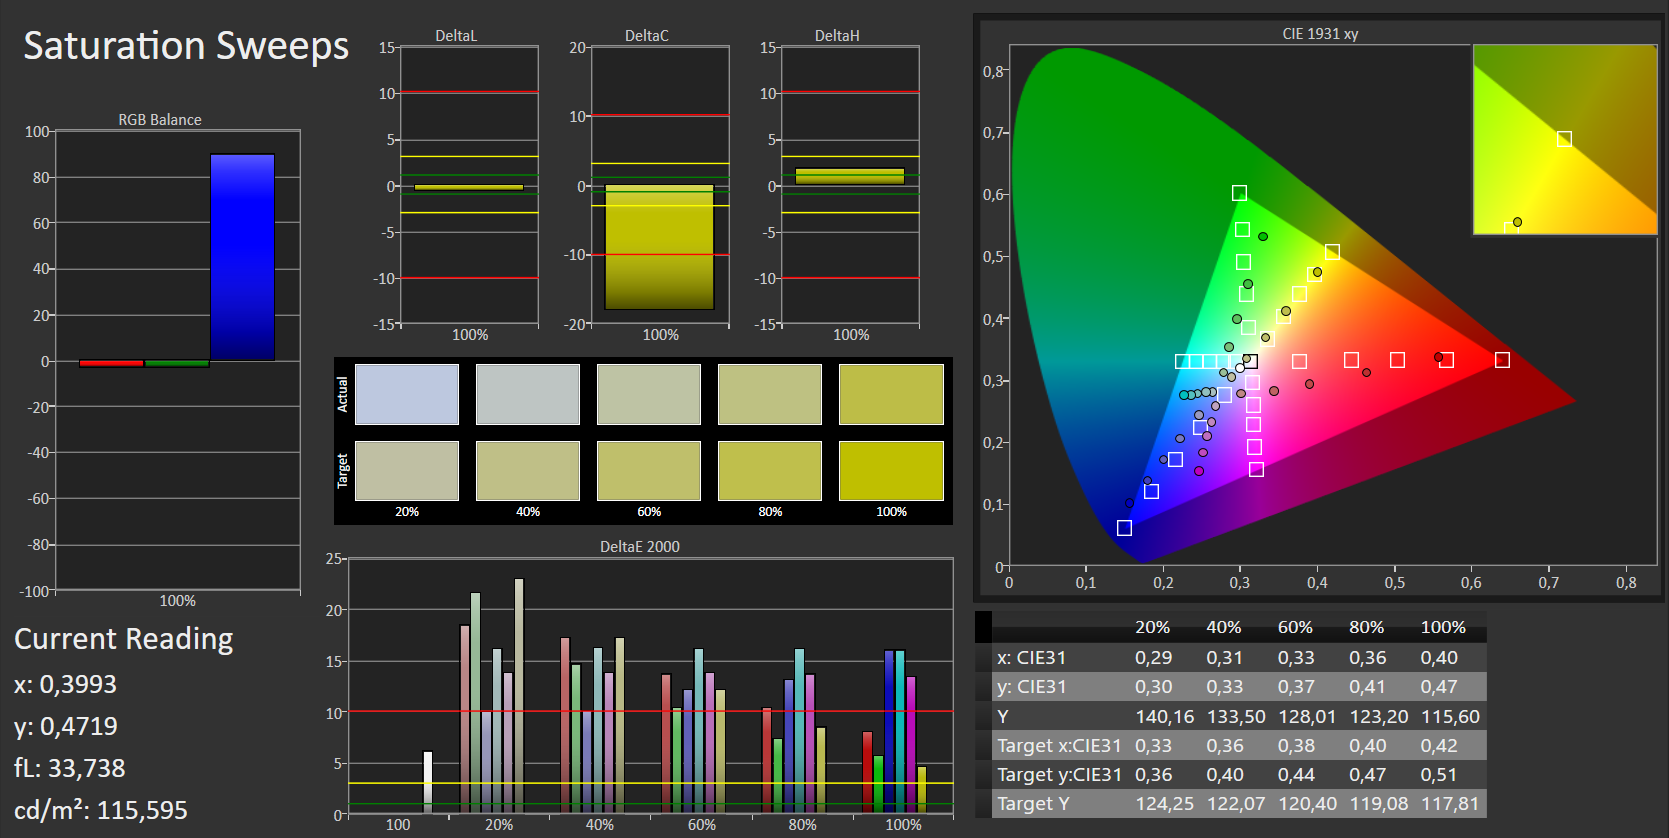
54% sRGB (Argyll 1.6.3 3D)
34% AdobeRGB 1998 (Argyll 1.6.3 3D)
37.17% AdobeRGB 1998 (Argyll 3D)
54.1% sRGB (Argyll 3D)
35.97% Display P3 (Argyll 3D)
Gamma: 2.36
CCT: 6750 K
| Acer Aspire 3 A315-51-55E4 AU Optronics AUO38ED, , 1920x1080, 15.6" | Dell Latitude 5580 1366x768, 15.6" | Fujitsu Lifebook A557 BOE NV156FHM-N42, , 1920x1080, 15.6" | Lenovo ThinkPad E570-20H6S00000 AUO B156HAN04.4, , 1920x1080, 15.6" | HP Pavilion 14-al103ng AU Optronics, , 1920x1080, 14" | |
|---|---|---|---|---|---|
| Display | 12% | 16% | 7% | 2% | |
| Display P3 Coverage (%) | 35.97 | 40.13 12% | 41.85 16% | 38.65 7% | 36.58 2% |
| sRGB Coverage (%) | 54.1 | 60 11% | 62.9 16% | 58 7% | 54.9 1% |
| AdobeRGB 1998 Coverage (%) | 37.17 | 41.5 12% | 43.24 16% | 39.94 7% | 37.79 2% |
| Response Times | -58% | -109% | -58% | -73% | |
| Response Time Grey 50% / Grey 80% * (ms) | 44 ? | 30 ? 32% | 55 ? -25% | 44.8 ? -2% | 53 ? -20% |
| Response Time Black / White * (ms) | 12 ? | 29.6 ? -147% | 35 ? -192% | 25.6 ? -113% | 27 ? -125% |
| PWM Frequency (Hz) | 201.6 ? | 200 ? | |||
| Screen | -113% | 17% | -2% | -1% | |
| Brightness middle (cd/m²) | 241 | 238 -1% | 287 19% | 242 0% | 200 -17% |
| Brightness (cd/m²) | 229 | 216 -6% | 260 14% | 243 6% | 191 -17% |
| Brightness Distribution (%) | 87 | 83 -5% | 83 -5% | 75 -14% | 90 3% |
| Black Level * (cd/m²) | 0.46 | 0.53 -15% | 0.22 52% | 0.24 48% | 0.14 70% |
| Contrast (:1) | 524 | 449 -14% | 1305 149% | 1008 92% | 1429 173% |
| Colorchecker dE 2000 * | 3.4 | 10.8 -218% | 4.21 -24% | 4.65 -37% | 5.06 -49% |
| Colorchecker dE 2000 max. * | 7.61 | 29.3 -285% | 8.81 -16% | 9.64 -27% | 10.91 -43% |
| Greyscale dE 2000 * | 1.7 | 12.1 -612% | 2.68 -58% | 3.39 -99% | 3.94 -132% |
| Gamma | 2.36 93% | 2.25 98% | 2.5 88% | 2.7 81% | 2.41 91% |
| CCT | 6750 96% | 14344 45% | 6066 107% | 6246 104% | 6159 106% |
| Color Space (Percent of AdobeRGB 1998) (%) | 34 | 38.3 13% | 40 18% | 36.69 8% | 35 3% |
| Color Space (Percent of sRGB) (%) | 54 | 59.9 11% | 63 17% | 57.66 7% | 55 2% |
| Média Total (Programa/Configurações) | -53% /
-81% | -25% /
-0% | -18% /
-7% | -24% /
-10% |
* ... menor é melhor
Exibir tempos de resposta
| ↔ Tempo de resposta preto para branco | ||
|---|---|---|
| 12 ms ... ascensão ↗ e queda ↘ combinadas | ↗ 8 ms ascensão | 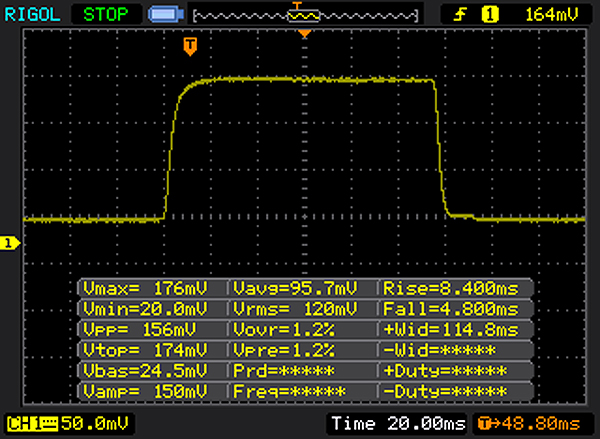 |
| ↘ 4 ms queda | ||
| A tela mostra boas taxas de resposta em nossos testes, mas pode ser muito lenta para jogadores competitivos. Em comparação, todos os dispositivos testados variam de 0.1 (mínimo) a 240 (máximo) ms. » 32 % de todos os dispositivos são melhores. Isso significa que o tempo de resposta medido é melhor que a média de todos os dispositivos testados (19.8 ms). | ||
| ↔ Tempo de resposta 50% cinza a 80% cinza | ||
| 44 ms ... ascensão ↗ e queda ↘ combinadas | ↗ 22 ms ascensão | 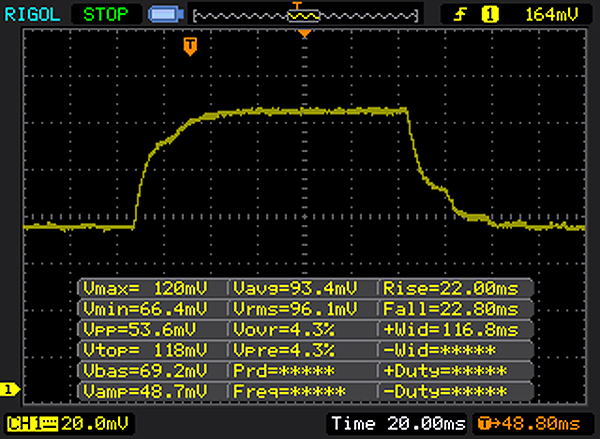 |
| ↘ 22 ms queda | ||
| A tela mostra taxas de resposta lentas em nossos testes e será insatisfatória para os jogadores. Em comparação, todos os dispositivos testados variam de 0.165 (mínimo) a 636 (máximo) ms. » 73 % de todos os dispositivos são melhores. Isso significa que o tempo de resposta medido é pior que a média de todos os dispositivos testados (31 ms). | ||
Cintilação da tela / PWM (modulação por largura de pulso)
| Tela tremeluzindo / PWM não detectado | ||
[pwm_comparison] Em comparação: 52 % de todos os dispositivos testados não usam PWM para escurecer a tela. Se PWM foi detectado, uma média de 7757 (mínimo: 5 - máximo: 343500) Hz foi medida. | ||
| Cinebench R15 | |
| CPU Single 64Bit | |
| HP Pavilion 14-al103ng | |
| Lenovo ThinkPad E570-20H6S00000 | |
| Fujitsu Lifebook A557 | |
| Dell Latitude 5580 | |
| Acer Aspire 3 A315-51-55E4 | |
| CPU Multi 64Bit | |
| Fujitsu Lifebook A557 | |
| HP Pavilion 14-al103ng | |
| Lenovo ThinkPad E570-20H6S00000 | |
| Dell Latitude 5580 | |
| Acer Aspire 3 A315-51-55E4 | |
| PCMark 8 | |
| Home Score Accelerated v2 | |
| Fujitsu Lifebook A557 | |
| Lenovo ThinkPad E570-20H6S00000 | |
| Dell Latitude 5580 | |
| Acer Aspire 3 A315-51-55E4 | |
| HP Pavilion 14-al103ng | |
| Work Score Accelerated v2 | |
| Fujitsu Lifebook A557 | |
| Lenovo ThinkPad E570-20H6S00000 | |
| Acer Aspire 3 A315-51-55E4 | |
| Dell Latitude 5580 | |
| PCMark 8 Home Score Accelerated v2 | 3295 pontos | |
| PCMark 8 Work Score Accelerated v2 | 4541 pontos | |
Ajuda | ||
| Acer Aspire 3 A315-51-55E4 Micron 1100 MTFDDAV256TBN | Dell Latitude 5580 Seagate ST500LM021-1KJ15 | Fujitsu Lifebook A557 Samsung MZ7TN512HDHP-00000 | Lenovo ThinkPad E570-20H6S00000 Toshiba THNSF5256GPUK | HP Pavilion 14-al103ng Western Digital Scorpio Blue WD5000LPCX-24C6HT0 | |
|---|---|---|---|---|---|
| CrystalDiskMark 3.0 | -90% | 8% | 57% | -91% | |
| Read Seq (MB/s) | 485.8 | 132.3 -73% | 504 4% | 1140 135% | 113.3 -77% |
| Write Seq (MB/s) | 456.1 | 131.1 -71% | 503 10% | 468.1 3% | 110.2 -76% |
| Read 512 (MB/s) | 328 | 27.04 -92% | 393.6 20% | 759 131% | 30.83 -91% |
| Write 512 (MB/s) | 446.8 | 56.6 -87% | 413.6 -7% | 414 -7% | 47.13 -89% |
| Read 4k (MB/s) | 26.95 | 0.459 -98% | 36.98 37% | 34.3 27% | 0.34 -99% |
| Write 4k (MB/s) | 86.7 | 0.812 -99% | 92.1 6% | 123.4 42% | 0.981 -99% |
| Read 4k QD32 (MB/s) | 245.9 | 1.1 -100% | 277.6 13% | 530 116% | 0.72 -100% |
| Write 4k QD32 (MB/s) | 300.2 | 0.828 -100% | 250.6 -17% | 319.2 6% | 1.026 -100% |

| 3DMark 11 - 1280x720 Performance GPU | |
| Lenovo ThinkPad E570-20H6S00000 | |
| Fujitsu Lifebook A557 | |
| HP Pavilion 14-al103ng | |
| Dell Latitude 5580 | |
| Acer Aspire 3 A315-51-55E4 | |
| 3DMark | |
| 1280x720 Cloud Gate Standard Graphics | |
| Lenovo ThinkPad E570-20H6S00000 | |
| Fujitsu Lifebook A557 | |
| Dell Latitude 5580 | |
| Acer Aspire 3 A315-51-55E4 | |
| 1920x1080 Fire Strike Graphics | |
| Lenovo ThinkPad E570-20H6S00000 | |
| Fujitsu Lifebook A557 | |
| Dell Latitude 5580 | |
| Acer Aspire 3 A315-51-55E4 | |
| 3DMark 11 Performance | 1146 pontos | |
| 3DMark Cloud Gate Standard Score | 5046 pontos | |
| 3DMark Fire Strike Score | 566 pontos | |
Ajuda | ||
| BioShock Infinite | |
| 1920x1080 Ultra Preset, DX11 (DDOF) | |
| HP Pavilion 14-al103ng | |
| Fujitsu Lifebook A557 | |
| Acer Aspire 3 A315-51-55E4 | |
| 1366x768 High Preset | |
| HP Pavilion 14-al103ng | |
| Fujitsu Lifebook A557 | |
| Acer Aspire 3 A315-51-55E4 | |
| 1366x768 Medium Preset | |
| Dell Latitude 5580 | |
| Fujitsu Lifebook A557 | |
| HP Pavilion 14-al103ng | |
| Acer Aspire 3 A315-51-55E4 | |
| 1280x720 Very Low Preset | |
| Dell Latitude 5580 | |
| HP Pavilion 14-al103ng | |
| Fujitsu Lifebook A557 | |
| Acer Aspire 3 A315-51-55E4 | |
| Thief | |
| 1920x1080 Very High Preset AA:FXAA & High SS AF:8x | |
| Acer Aspire 3 A315-51-55E4 | |
| 1366x768 High Preset AA:FXAA & Low SS AF:4x | |
| Acer Aspire 3 A315-51-55E4 | |
| 1366x768 Normal Preset AA:FX | |
| Acer Aspire 3 A315-51-55E4 | |
| 1024x768 Very Low Preset | |
| Acer Aspire 3 A315-51-55E4 | |
| Rise of the Tomb Raider | |
| 1920x1080 Very High Preset AA:FX AF:16x | |
| Acer Aspire 3 A315-51-55E4 | |
| 1920x1080 High Preset AA:FX AF:4x | |
| Fujitsu Lifebook A557 | |
| Acer Aspire 3 A315-51-55E4 | |
| 1366x768 Medium Preset AF:2x | |
| Dell Latitude 5580 | |
| Fujitsu Lifebook A557 | |
| Acer Aspire 3 A315-51-55E4 | |
| 1024x768 Lowest Preset | |
| Dell Latitude 5580 | |
| Acer Aspire 3 A315-51-55E4 | |
| Fujitsu Lifebook A557 | |
| baixo | média | alto | ultra | |
|---|---|---|---|---|
| BioShock Infinite (2013) | 34.63 | 20.7 | 16.76 | 5.46 |
| Thief (2014) | 16.6 | 9.9 | 8.3 | 3.8 |
| Rise of the Tomb Raider (2016) | 15.84 | 8.94 | 4.64 | 3.61 |
Barulho
| Ocioso |
| 30.2 / 30.2 / 31.2 dB |
| HDD |
| 0 dB |
| Carga |
| 34.5 / 34.5 dB |
 | ||
30 dB silencioso 40 dB(A) audível 50 dB(A) ruidosamente alto |
||
min: | ||
(+) A temperatura máxima no lado superior é 37.7 °C / 100 F, em comparação com a média de 34.3 °C / 94 F , variando de 21.2 a 62.5 °C para a classe Office.
(+) A parte inferior aquece até um máximo de 35.4 °C / 96 F, em comparação com a média de 36.8 °C / 98 F
(+) Em uso inativo, a temperatura média para o lado superior é 24.9 °C / 77 F, em comparação com a média do dispositivo de 29.5 °C / ### class_avg_f### F.
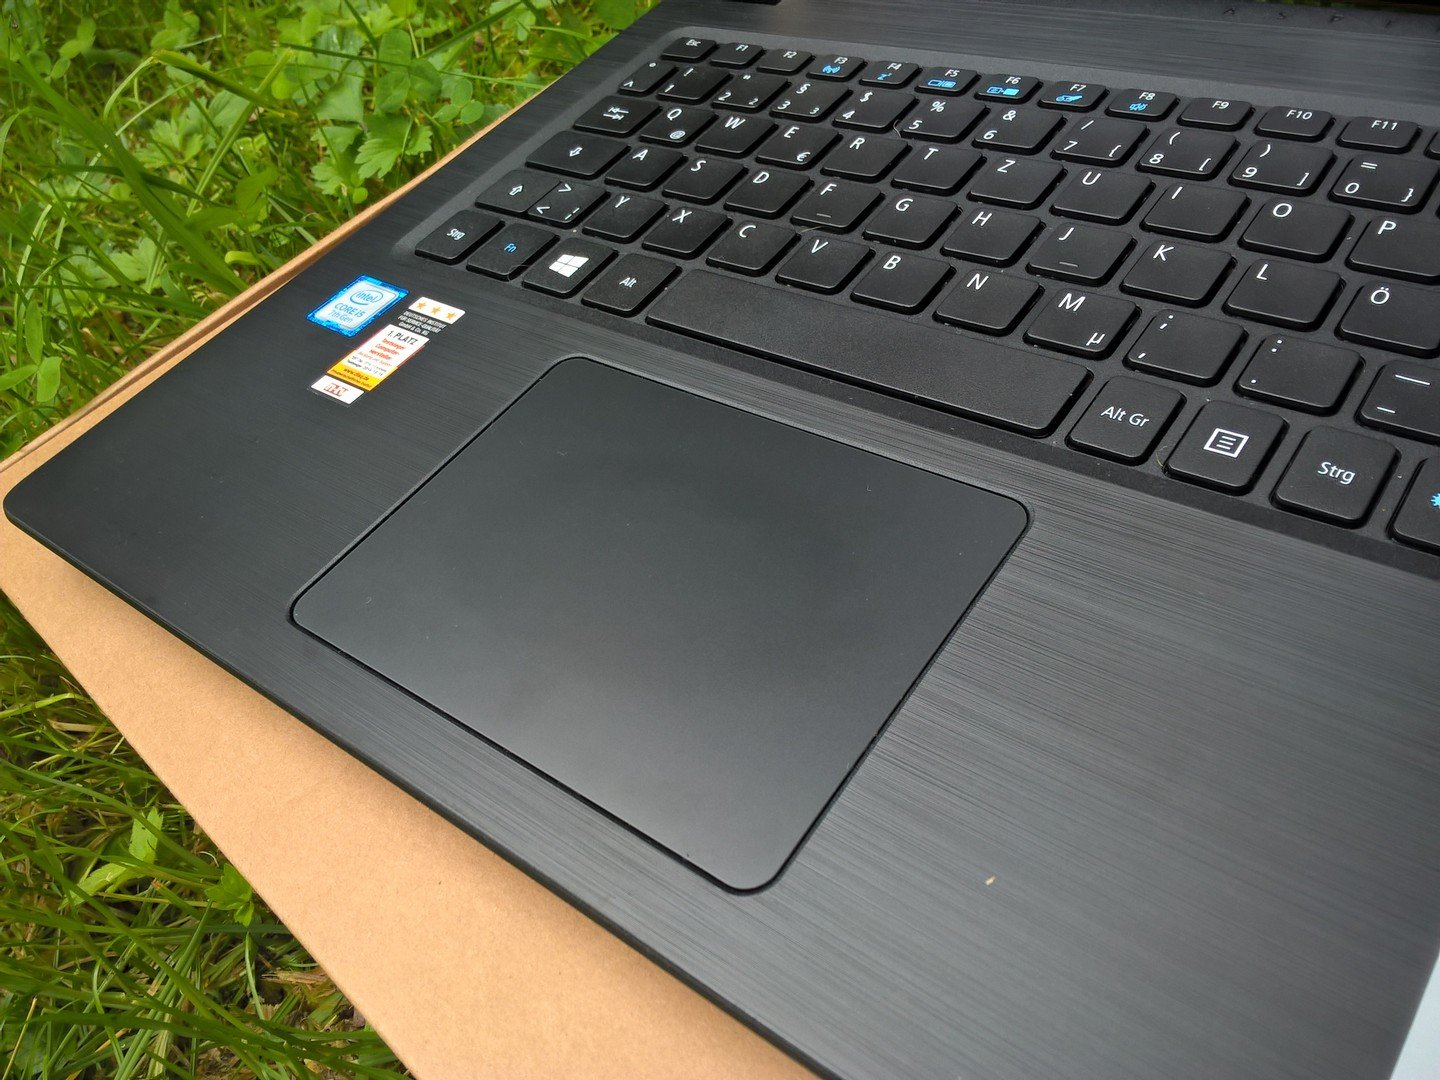
(+) Os apoios para as mãos e o touchpad são mais frios que a temperatura da pele, com um máximo de 23.2 °C / 73.8 F e, portanto, são frios ao toque.
(+) A temperatura média da área do apoio para as mãos de dispositivos semelhantes foi 27.5 °C / 81.5 F (+4.3 °C / 7.7 F).
Acer Aspire 3 A315-51-55E4 análise de áudio
(±) | o volume do alto-falante é médio, mas bom (###valor### dB)
Graves 100 - 315Hz
(-) | quase nenhum baixo - em média 23.3% menor que a mediana
(±) | a linearidade dos graves é média (9.3% delta para a frequência anterior)
Médios 400 - 2.000 Hz
(±) | médios mais altos - em média 7.4% maior que a mediana
(±) | a linearidade dos médios é média (13.3% delta para frequência anterior)
Altos 2 - 16 kHz
(+) | agudos equilibrados - apenas 3.6% longe da mediana
(±) | a linearidade dos máximos é média (7.5% delta para frequência anterior)
Geral 100 - 16.000 Hz
(±) | a linearidade do som geral é média (27.9% diferença em relação à mediana)
Comparado com a mesma classe
» 87% de todos os dispositivos testados nesta classe foram melhores, 3% semelhantes, 10% piores
» O melhor teve um delta de 7%, a média foi 21%, o pior foi 53%
Comparado com todos os dispositivos testados
» 85% de todos os dispositivos testados foram melhores, 3% semelhantes, 12% piores
» O melhor teve um delta de 4%, a média foi 23%, o pior foi 134%
Apple MacBook 12 (Early 2016) 1.1 GHz análise de áudio
(+) | os alto-falantes podem tocar relativamente alto (###valor### dB)
Graves 100 - 315Hz
(±) | graves reduzidos - em média 11.3% menor que a mediana
(±) | a linearidade dos graves é média (14.2% delta para a frequência anterior)
Médios 400 - 2.000 Hz
(+) | médios equilibrados - apenas 2.4% longe da mediana
(+) | médios são lineares (5.5% delta para frequência anterior)
Altos 2 - 16 kHz
(+) | agudos equilibrados - apenas 2% longe da mediana
(+) | os máximos são lineares (4.5% delta da frequência anterior)
Geral 100 - 16.000 Hz
(+) | o som geral é linear (10.2% diferença em relação à mediana)
Comparado com a mesma classe
» 7% de todos os dispositivos testados nesta classe foram melhores, 2% semelhantes, 90% piores
» O melhor teve um delta de 5%, a média foi 18%, o pior foi 53%
Comparado com todos os dispositivos testados
» 5% de todos os dispositivos testados foram melhores, 1% semelhantes, 94% piores
» O melhor teve um delta de 4%, a média foi 23%, o pior foi 134%
Lenovo ThinkPad E570-20H6S00000 análise de áudio
(±) | o volume do alto-falante é médio, mas bom (###valor### dB)
Graves 100 - 315Hz
(-) | quase nenhum baixo - em média 16.8% menor que a mediana
(-) | graves não são lineares (16.4% delta para frequência anterior)
Médios 400 - 2.000 Hz
(±) | médios mais altos - em média 5.1% maior que a mediana
(±) | a linearidade dos médios é média (9.5% delta para frequência anterior)
Altos 2 - 16 kHz
(+) | agudos equilibrados - apenas 2.7% longe da mediana
(+) | os máximos são lineares (6.5% delta da frequência anterior)
Geral 100 - 16.000 Hz
(±) | a linearidade do som geral é média (19.6% diferença em relação à mediana)
Comparado com a mesma classe
» 64% de todos os dispositivos testados nesta classe foram melhores, 7% semelhantes, 29% piores
» O melhor teve um delta de 5%, a média foi 17%, o pior foi 45%
Comparado com todos os dispositivos testados
» 49% de todos os dispositivos testados foram melhores, 7% semelhantes, 44% piores
» O melhor teve um delta de 4%, a média foi 23%, o pior foi 134%
HP Pavilion 14-al103ng análise de áudio
(±) | o volume do alto-falante é médio, mas bom (###valor### dB)
Graves 100 - 315Hz
(-) | quase nenhum baixo - em média 29.2% menor que a mediana
(±) | a linearidade dos graves é média (7.9% delta para a frequência anterior)
Médios 400 - 2.000 Hz
(+) | médios equilibrados - apenas 2.1% longe da mediana
(+) | médios são lineares (6.2% delta para frequência anterior)
Altos 2 - 16 kHz
(±) | máximos mais altos - em média 5.3% maior que a mediana
(±) | a linearidade dos máximos é média (7.9% delta para frequência anterior)
Geral 100 - 16.000 Hz
(±) | a linearidade do som geral é média (24.5% diferença em relação à mediana)
Comparado com a mesma classe
» 71% de todos os dispositivos testados nesta classe foram melhores, 8% semelhantes, 21% piores
» O melhor teve um delta de 7%, a média foi 21%, o pior foi 53%
Comparado com todos os dispositivos testados
» 74% de todos os dispositivos testados foram melhores, 6% semelhantes, 20% piores
» O melhor teve um delta de 4%, a média foi 23%, o pior foi 134%
Fujitsu Lifebook A557 análise de áudio
(-) | alto-falantes não muito altos (###valor### dB)
Graves 100 - 315Hz
(-) | quase nenhum baixo - em média 26.8% menor que a mediana
(+) | o baixo é linear (6.2% delta para a frequência anterior)
Médios 400 - 2.000 Hz
(±) | médios mais altos - em média 6.8% maior que a mediana
(-) | médios não são lineares (15% delta para frequência anterior)
Altos 2 - 16 kHz
(+) | agudos equilibrados - apenas 3.5% longe da mediana
(±) | a linearidade dos máximos é média (8.7% delta para frequência anterior)
Geral 100 - 16.000 Hz
(-) | o som geral não é linear (33.6% diferença em relação à mediana)
Comparado com a mesma classe
» 96% de todos os dispositivos testados nesta classe foram melhores, 2% semelhantes, 3% piores
» O melhor teve um delta de 7%, a média foi 21%, o pior foi 53%
Comparado com todos os dispositivos testados
» 92% de todos os dispositivos testados foram melhores, 1% semelhantes, 6% piores
» O melhor teve um delta de 4%, a média foi 23%, o pior foi 134%
Dell Latitude 5580 análise de áudio
(-) | alto-falantes não muito altos (###valor### dB)
Graves 100 - 315Hz
(±) | graves reduzidos - em média 12.5% menor que a mediana
(±) | a linearidade dos graves é média (10.4% delta para a frequência anterior)
Médios 400 - 2.000 Hz
(+) | médios equilibrados - apenas 4.6% longe da mediana
(±) | a linearidade dos médios é média (8.9% delta para frequência anterior)
Altos 2 - 16 kHz
(±) | máximos mais altos - em média 5.1% maior que a mediana
(±) | a linearidade dos máximos é média (9.9% delta para frequência anterior)
Geral 100 - 16.000 Hz
(±) | a linearidade do som geral é média (24.6% diferença em relação à mediana)
Comparado com a mesma classe
» 73% de todos os dispositivos testados nesta classe foram melhores, 7% semelhantes, 20% piores
» O melhor teve um delta de 7%, a média foi 21%, o pior foi 53%
Comparado com todos os dispositivos testados
» 75% de todos os dispositivos testados foram melhores, 5% semelhantes, 20% piores
» O melhor teve um delta de 4%, a média foi 23%, o pior foi 134%
| desligado | |
| Ocioso | |
| Carga |
|
Key:
min: | |
| Acer Aspire 3 A315-51-55E4 i5-7200U, HD Graphics 620, Micron 1100 MTFDDAV256TBN, TN LED, 1920x1080, 15.6" | Dell Latitude 5580 i5-7200U, HD Graphics 620, Seagate ST500LM021-1KJ15, TN LED, 1366x768, 15.6" | Fujitsu Lifebook A557 i5-7200U, HD Graphics 620, Samsung MZ7TN512HDHP-00000, a-Si TFT-LCD , LCM, 1920x1080, 15.6" | Lenovo ThinkPad E570-20H6S00000 i5-7200U, GeForce GTX 950M, Toshiba THNSF5256GPUK, IPS LED, 1920x1080, 15.6" | HP Pavilion 14-al103ng i5-7200U, HD Graphics 620, Western Digital Scorpio Blue WD5000LPCX-24C6HT0, IPS, 1920x1080, 14" | |
|---|---|---|---|---|---|
| Power Consumption | 7% | 10% | -32% | -10% | |
| Idle Minimum * (Watt) | 4.1 | 3.5 15% | 2.9 29% | 2.8 32% | 5.5 -34% |
| Idle Average * (Watt) | 7.5 | 6 20% | 6.4 15% | 6.3 16% | 8.2 -9% |
| Idle Maximum * (Watt) | 8.9 | 7.3 18% | 6.9 22% | 6.9 22% | 8.9 -0% |
| Load Average * (Watt) | 28.1 | 30.8 -10% | 31.8 -13% | 51.6 -84% | 29.1 -4% |
| Load Maximum * (Watt) | 28.3 | 31 -10% | 29 -2% | 69.7 -146% | 29.4 -4% |
* ... menor é melhor
| Acer Aspire 3 A315-51-55E4 i5-7200U, HD Graphics 620, 37 Wh | Dell Latitude 5580 i5-7200U, HD Graphics 620, 68 Wh | Fujitsu Lifebook A557 i5-7200U, HD Graphics 620, 49 Wh | Lenovo ThinkPad E570-20H6S00000 i5-7200U, GeForce GTX 950M, 41 Wh | |
|---|---|---|---|---|
| Duração da bateria | 62% | 34% | 31% | |
| Reader / Idle (h) | 14.3 | 18.4 29% | 16.5 15% | 14.7 3% |
| WiFi v1.3 (h) | 5.8 | 11.6 100% | 8.8 52% | 7.7 33% |
| Load (h) | 1.4 | 2.2 57% | 1.9 36% | 2.2 57% |
| H.264 (h) | 7.6 |
Pro
Contra
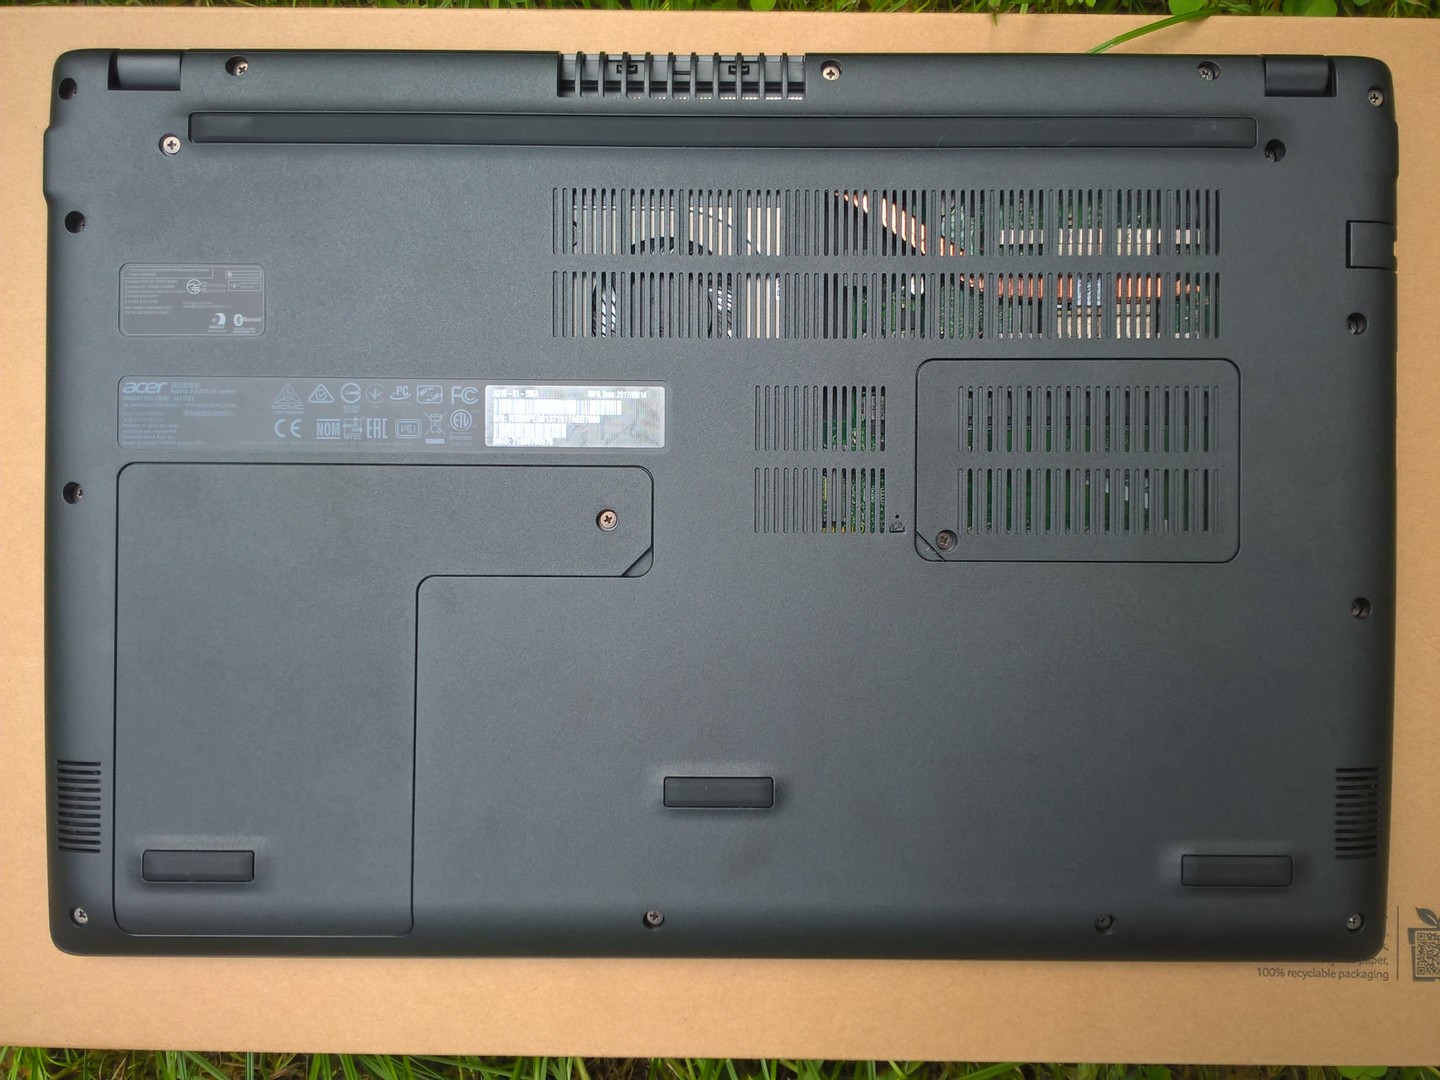
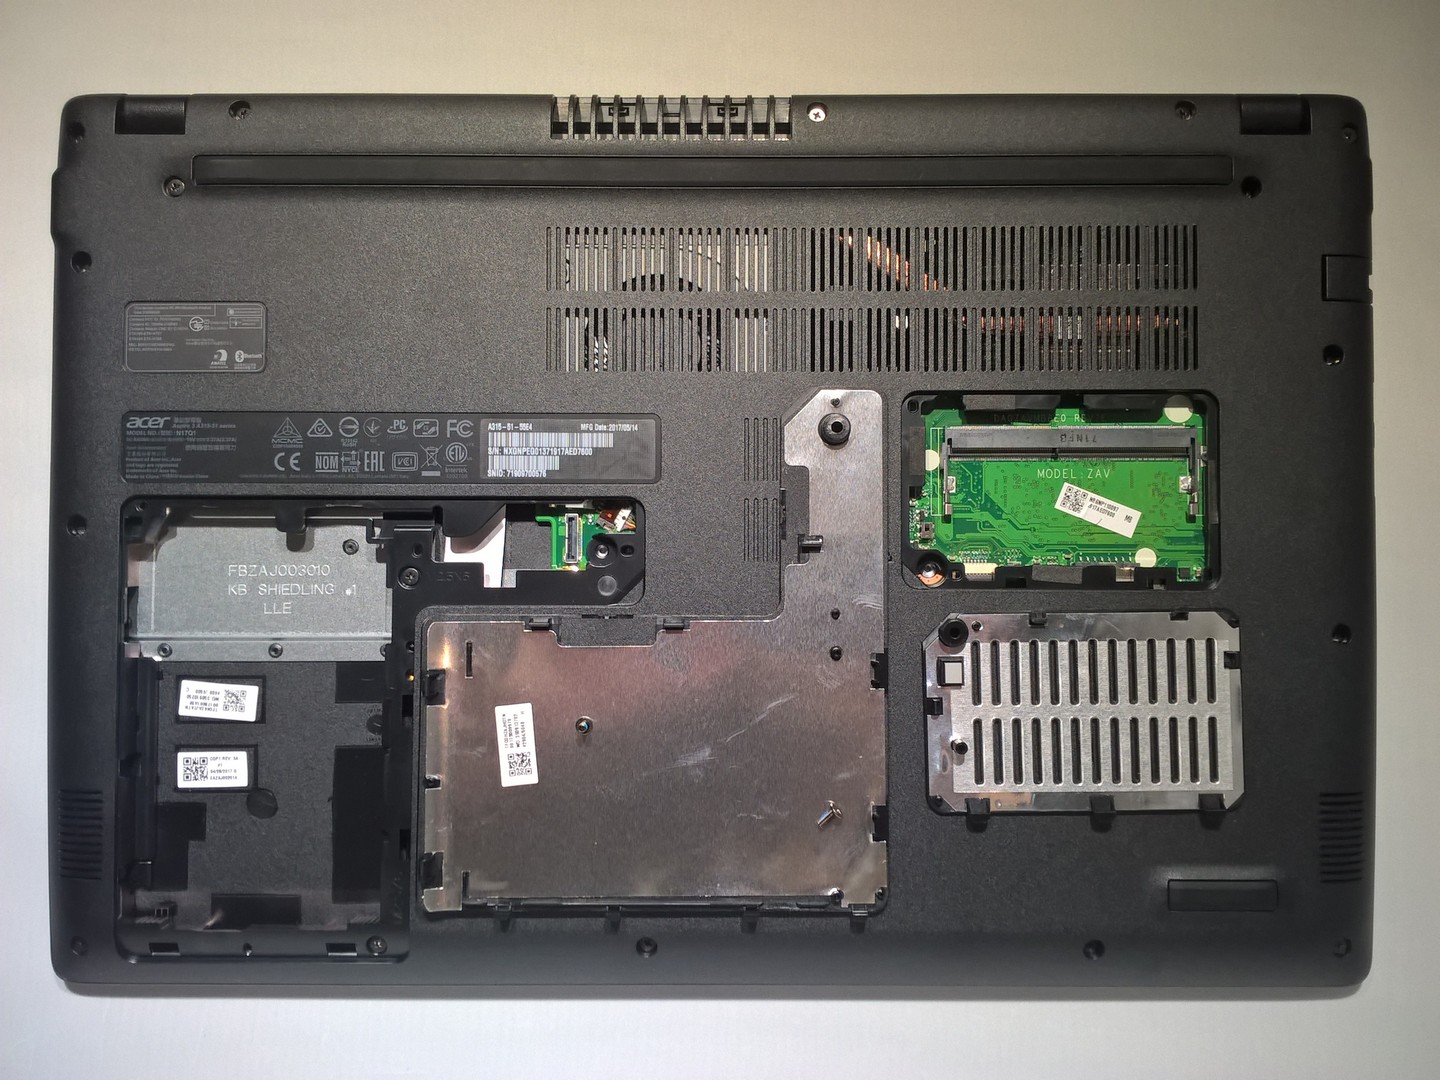
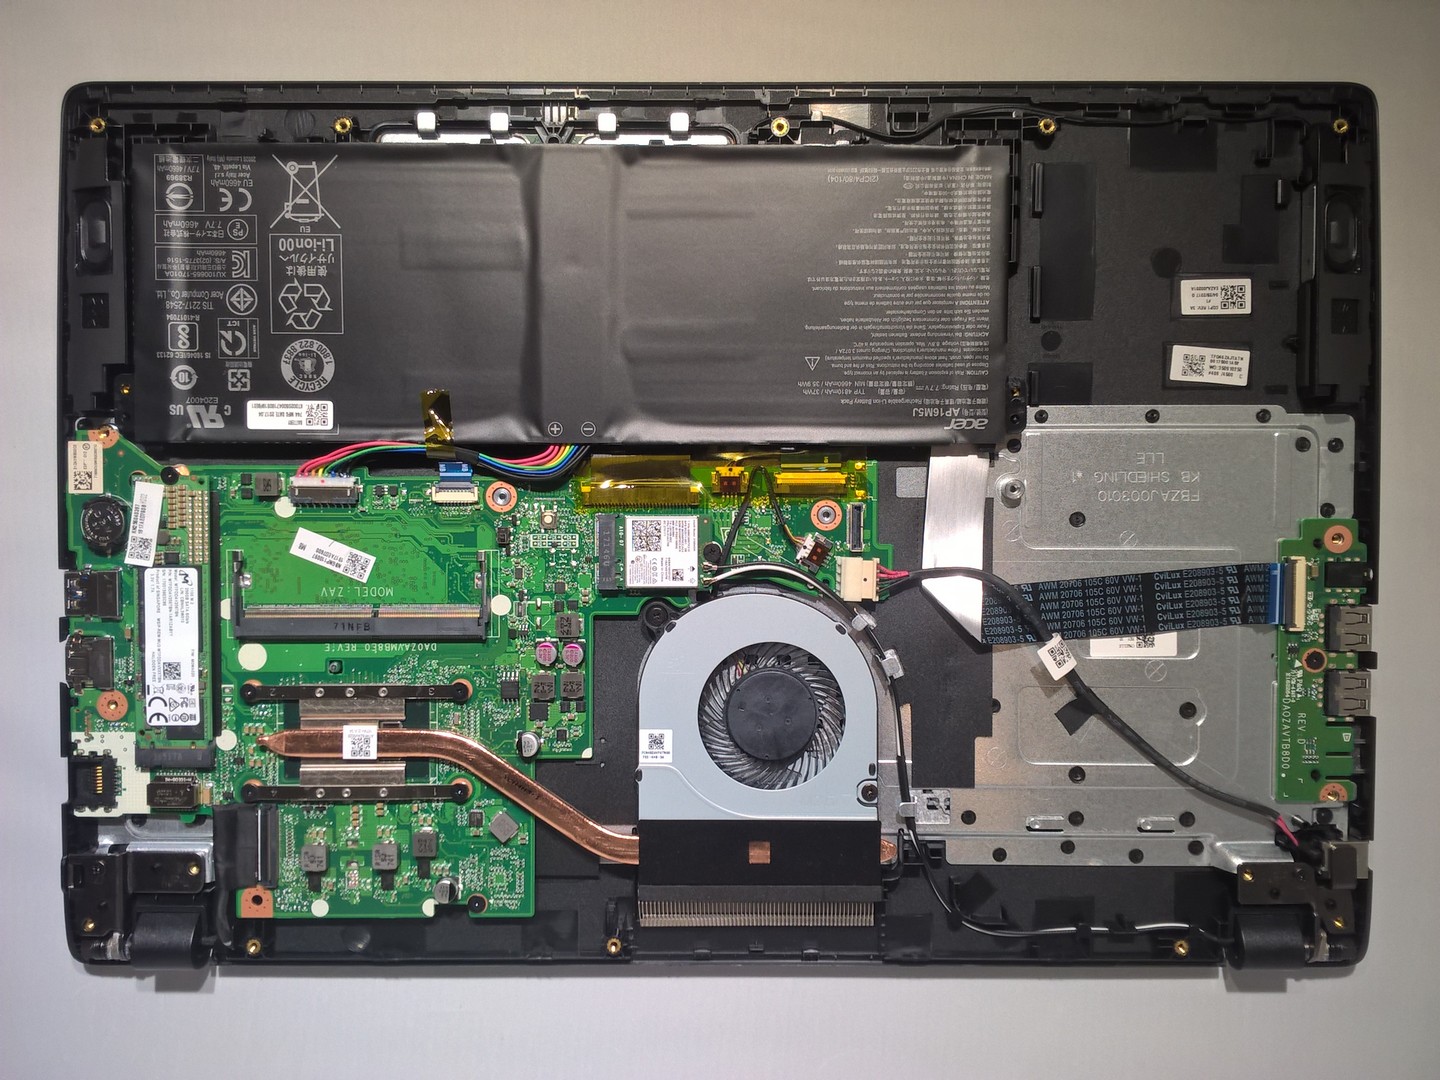
O Aspire 3 da Acer é um bom aparelho de nível de entrada que pode gerir mais do que apenas processos simples no uso diário e sabe como lidar com multitarefas. Pode até ser usado para algum processamento de imagem simples, mas, além disso, você não deve esperar muito do portátil. Gostamos das possibilidades de atualização que as escotilhas de manutenção oferecem para o armazenamento e a RAM, mas a bateria não deve "cair" para fora da carcaça quando você remove a tampa inferior. Isso pode causar danos no ou dentro do aparelho.
O Aspire 3 é um bom aparelho de nível de entrada que é adequado para a maioria das atividades diárias.
O Aspire 3 é um candidato adequado para quem procura um portátil acessível de 15 polegadas com desempenho suficiente e potencial de atualização. Se você for usar seu aparelho muito longe de uma tomada ou ao viajar, pode ter alguns problemas com o tempo de duração da bateria.
Acer Aspire 3 A315-51-55E4
- 09/06/2017 v6 (old)
Mike Wobker