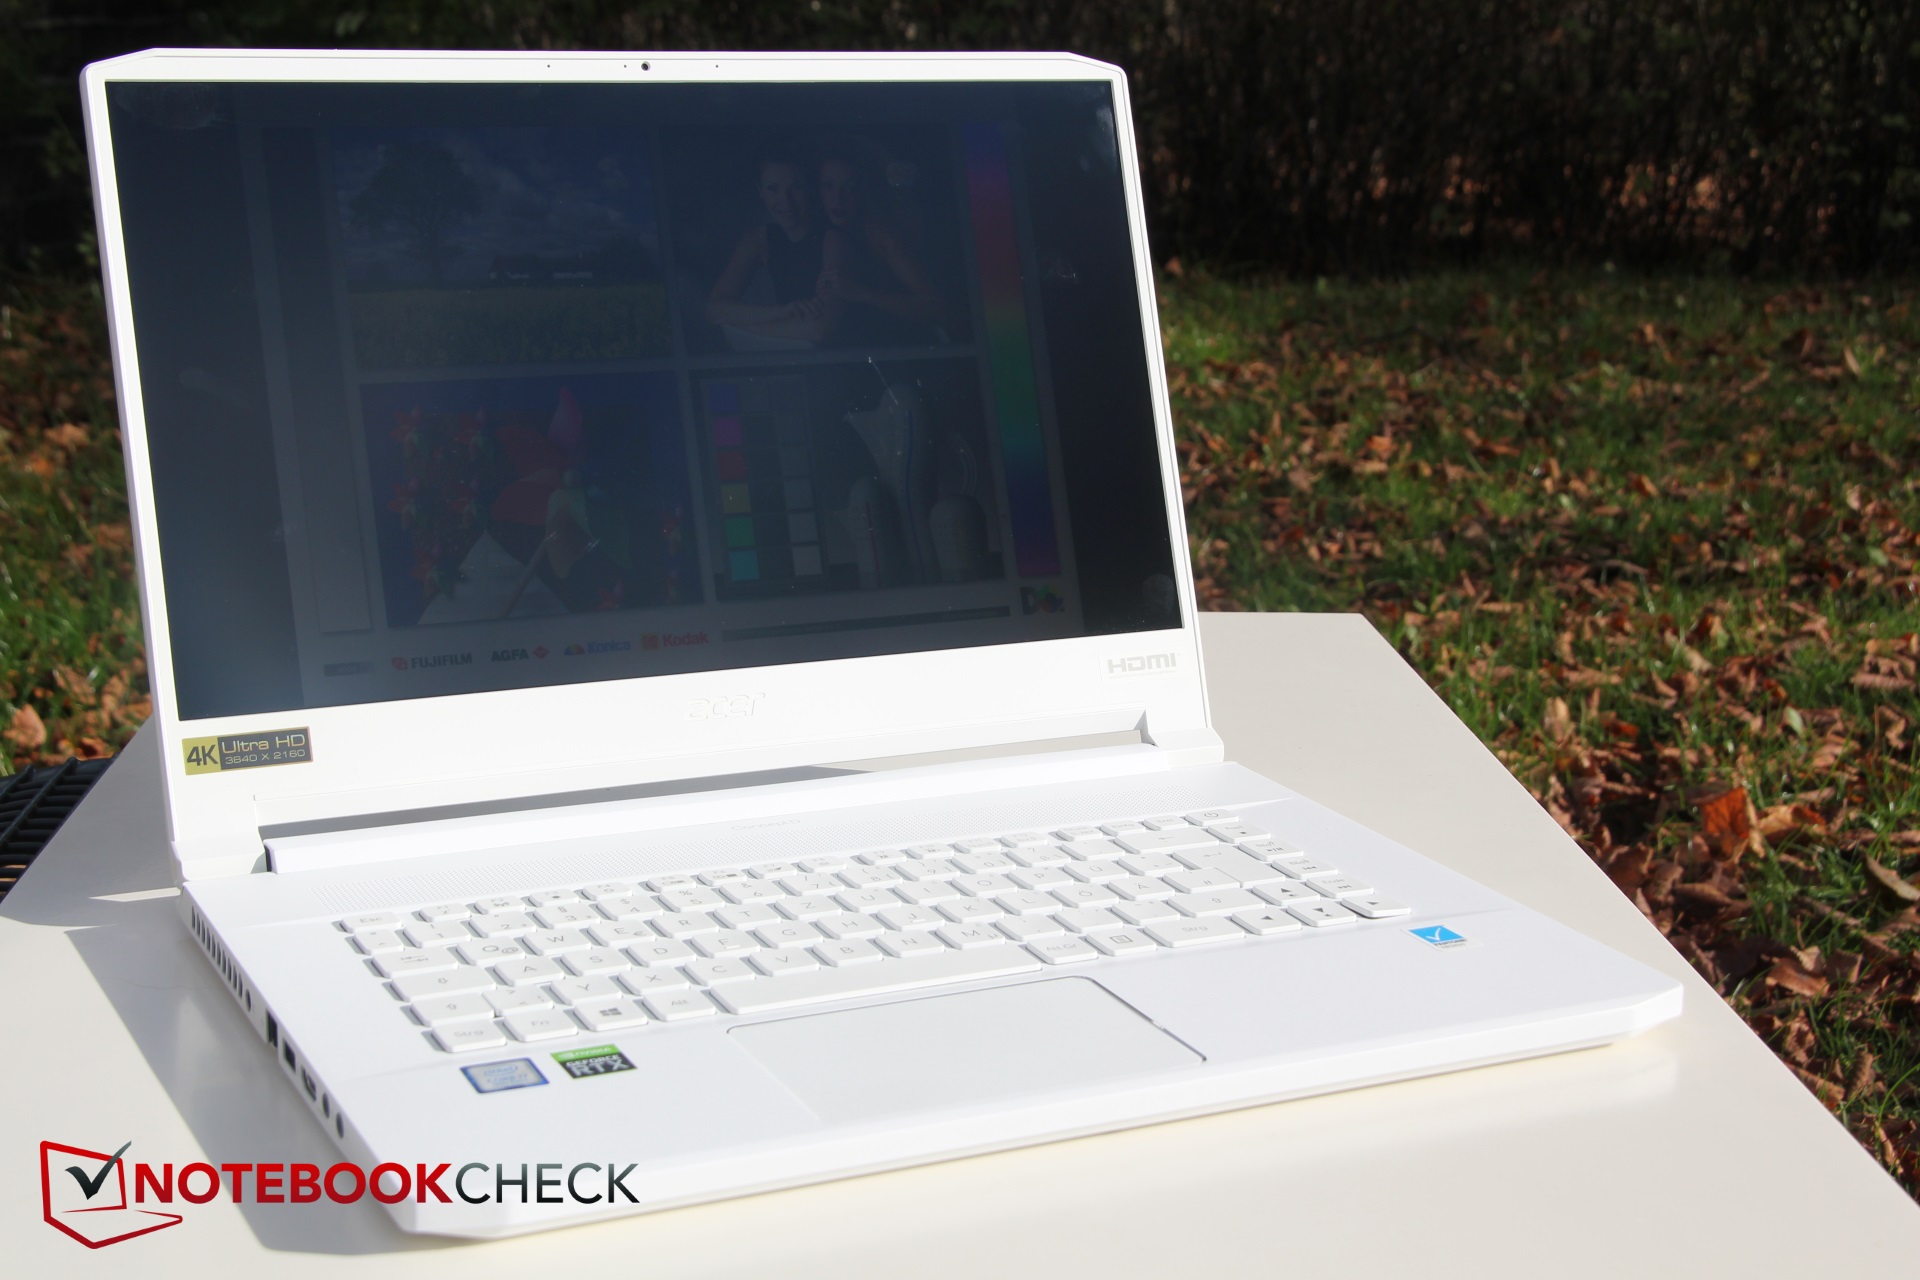
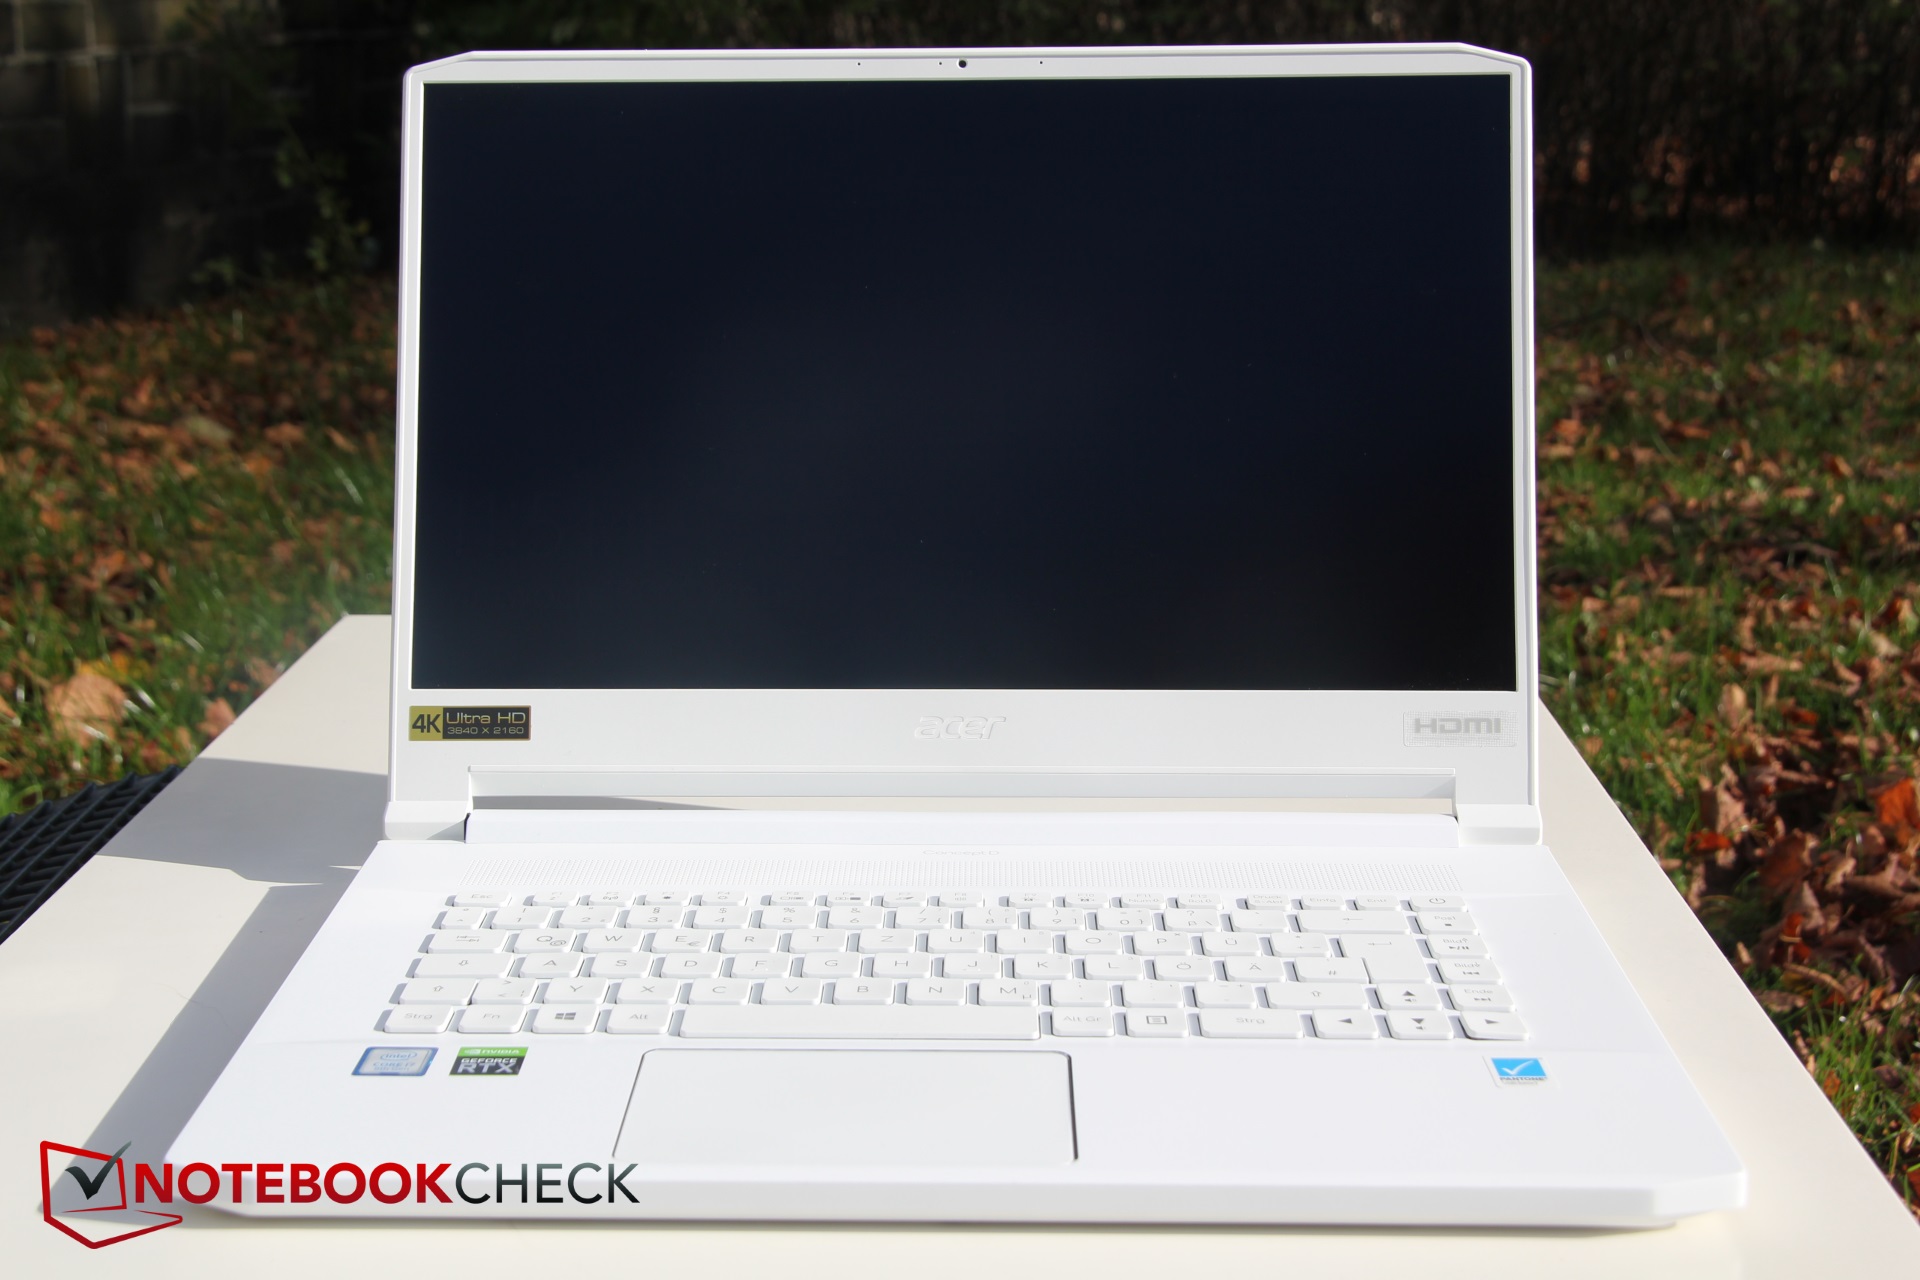
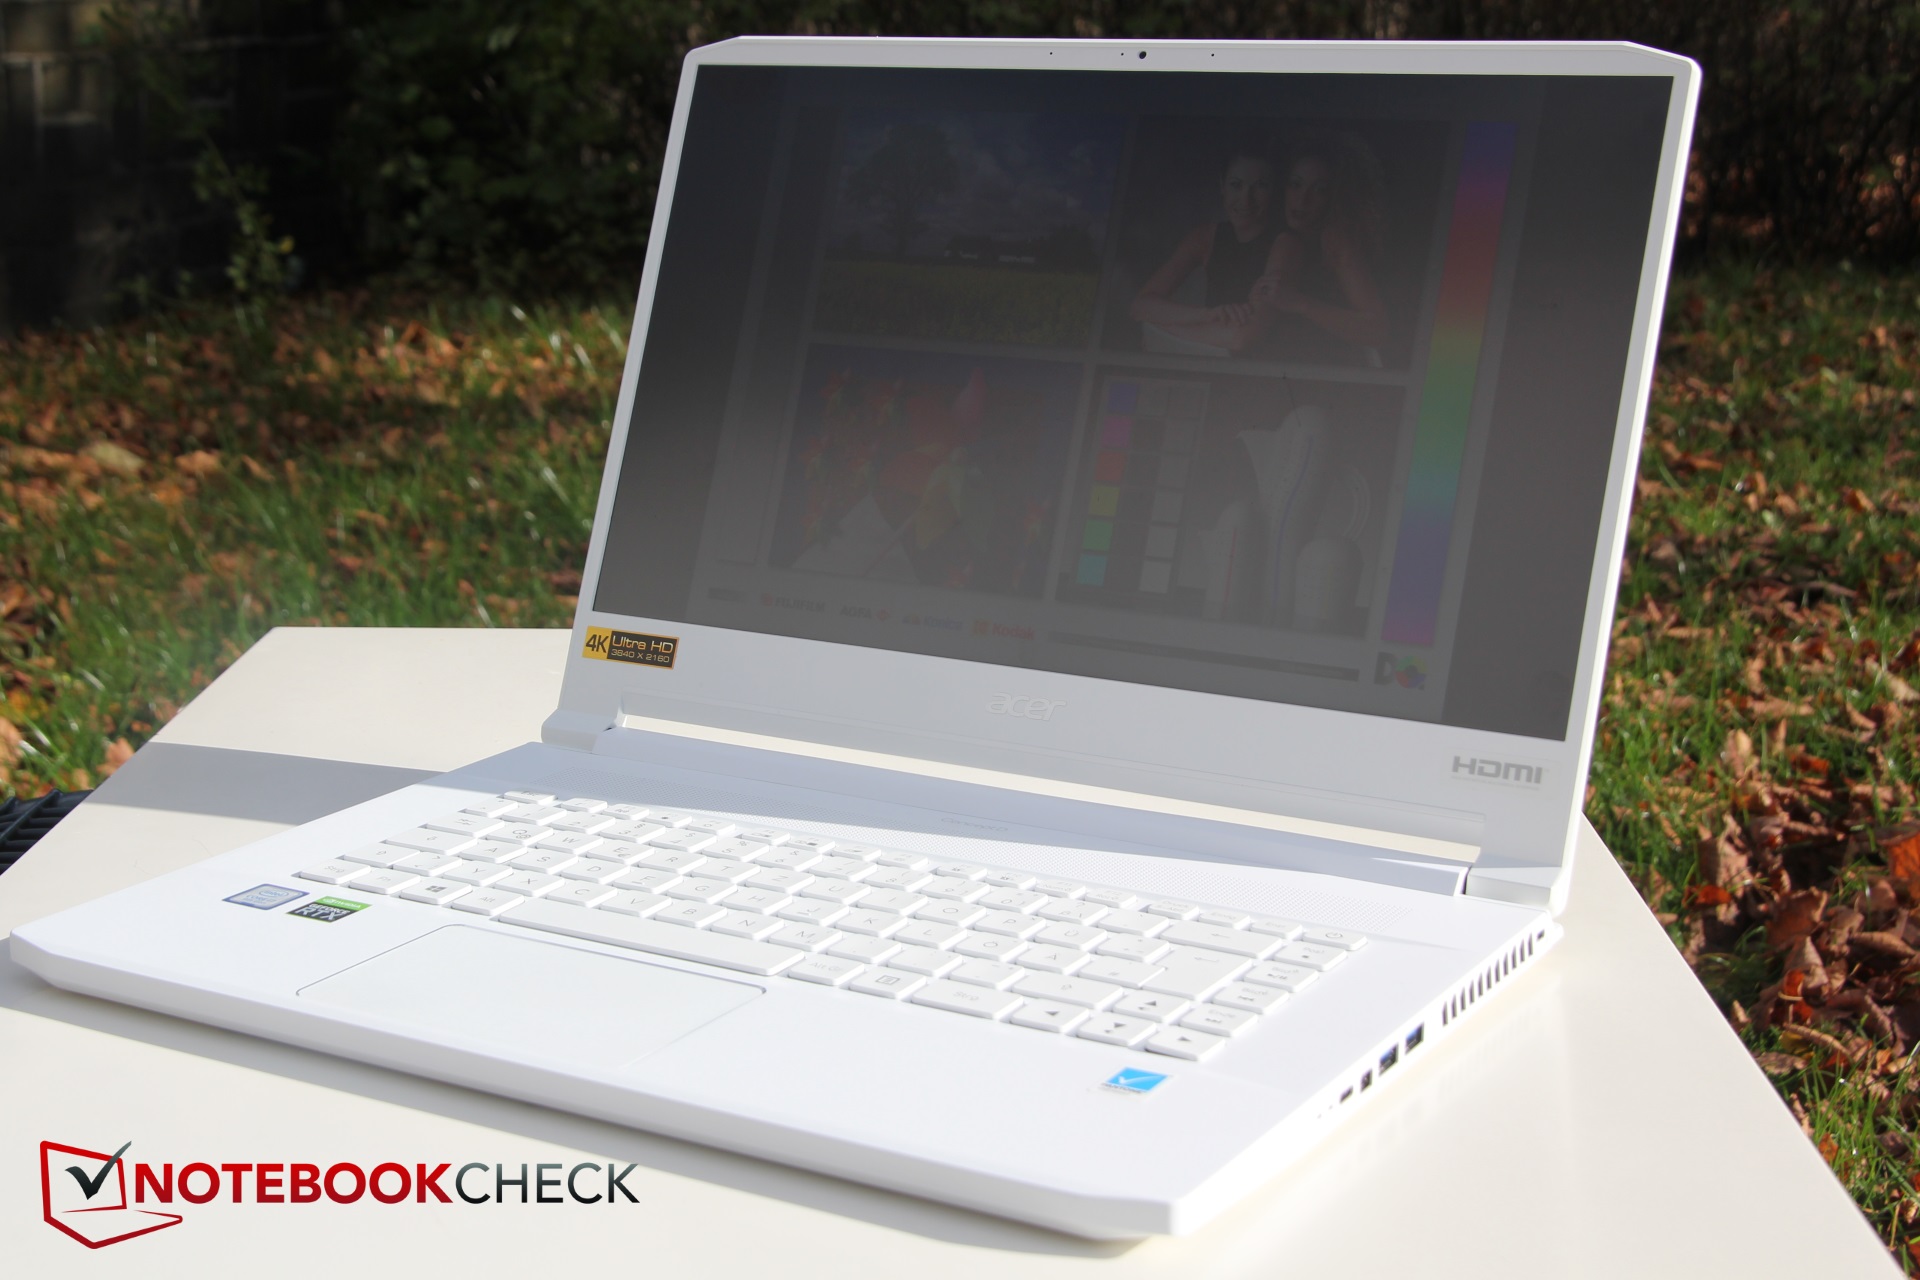
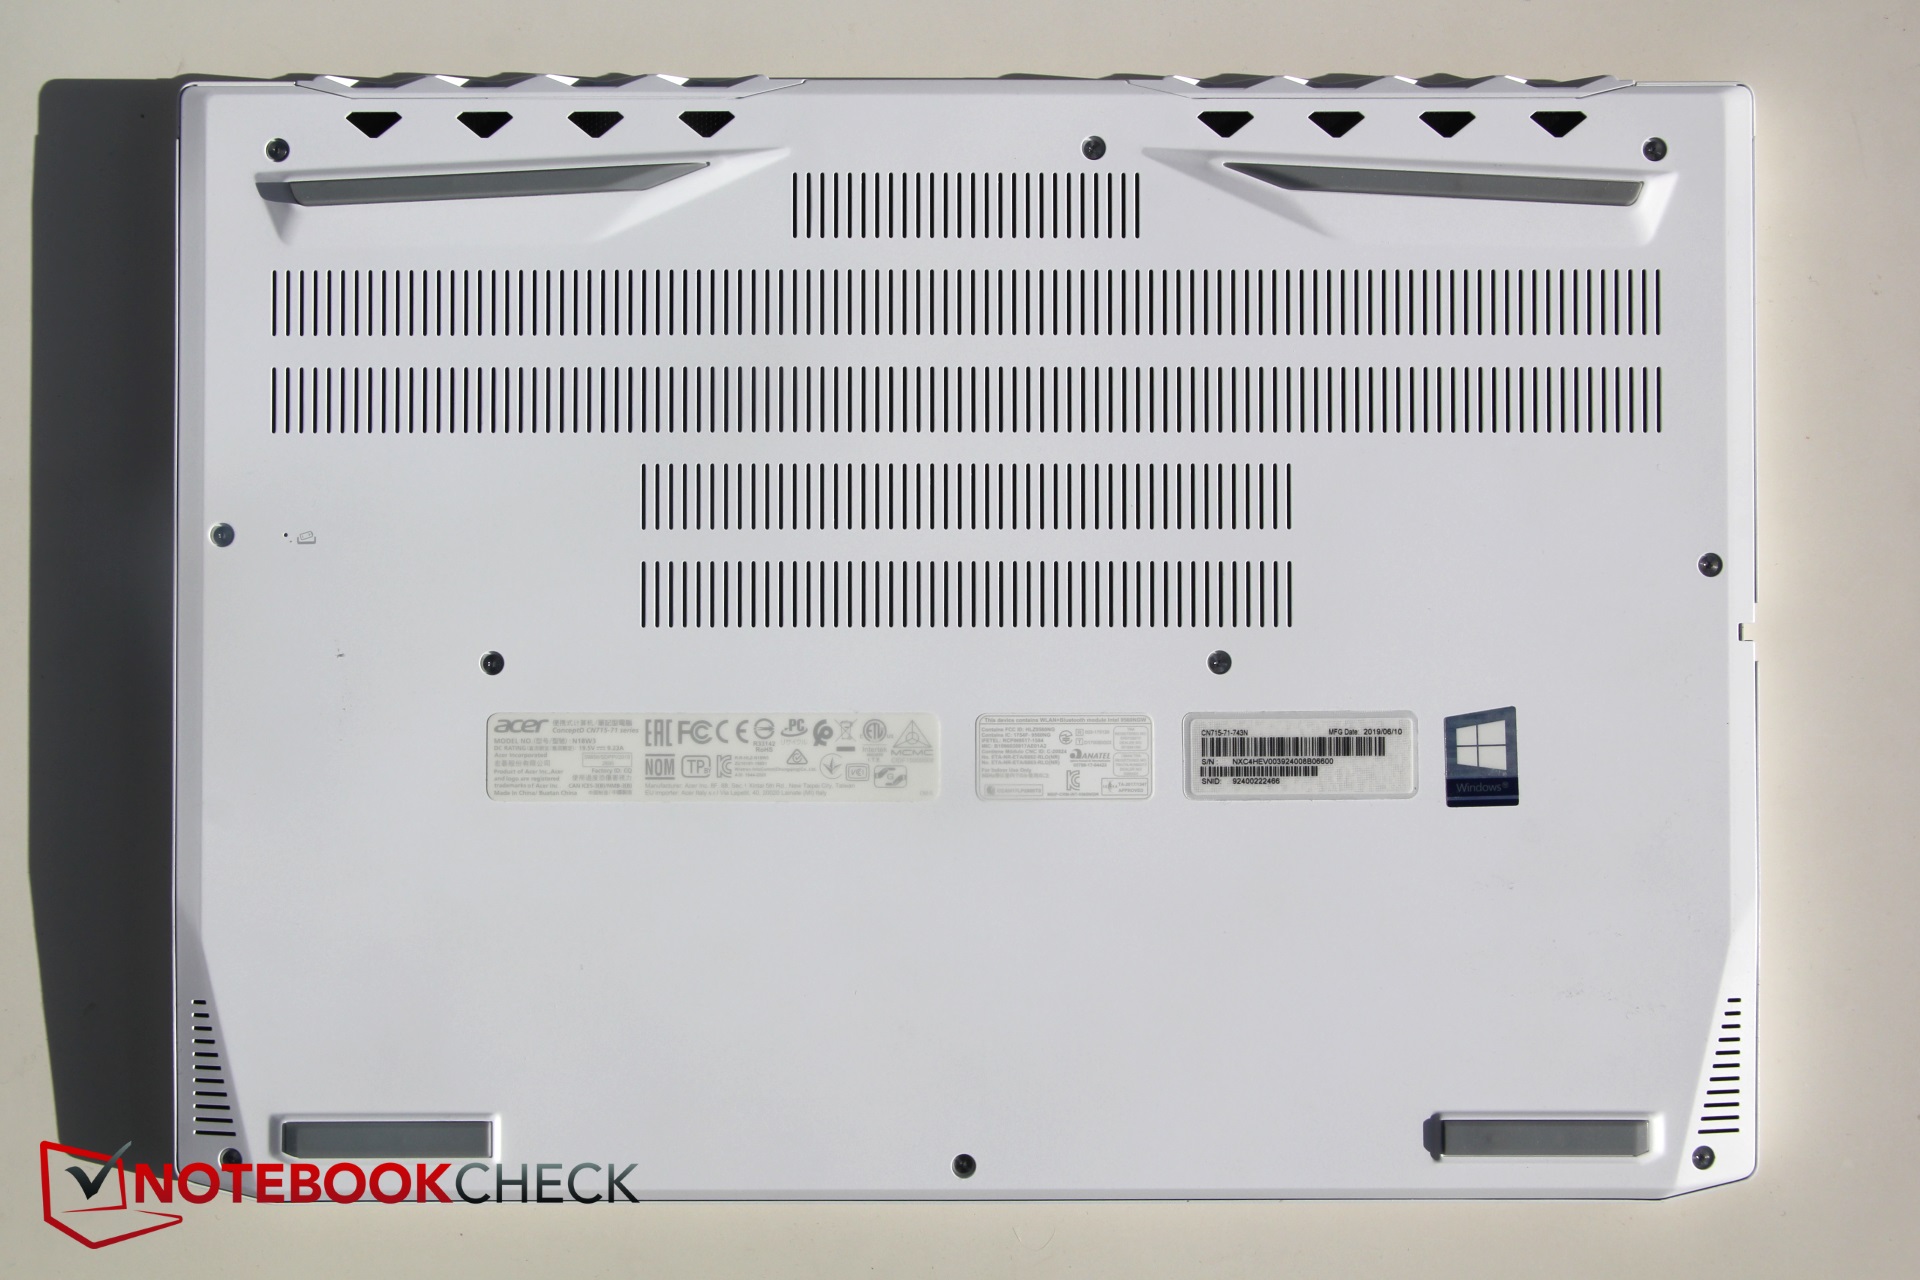
Breve Análise do Portátil Acer ConceptD 7: CPU Intel topo de linha com comportamento de limitação
Avaliação | Data | Modelo | Peso | Altura | Size | Resolução | Preço |
|---|---|---|---|---|---|---|---|
| 87.3 % v7 (old) | 11/2019 | Acer ConceptD 7 CN715-71-743N i7-9750H, GeForce RTX 2060 Mobile | 2.2 kg | 17.9 mm | 15.60" | 3840x2160 | |
| 85.7 % v6 (old) | 08/2019 | Lenovo Legion Y540-15IRH i7-9750H, GeForce RTX 2060 Mobile | 2.3 kg | 26 mm | 15.60" | 1920x1080 | |
| 80.8 % v7 (old) | 10/2019 | MSI GL65 9SEK i7-9750H, GeForce RTX 2060 Mobile | 2.3 kg | 27.5 mm | 15.60" | 1920x1080 | |
| 84.4 % v7 (old) | 08/2019 | Asus Strix GL531GV-PB74 i7-9750H, GeForce RTX 2060 Mobile | 2.4 kg | 25.9 mm | 15.60" | 1920x1080 | |
| 89.4 % v6 (old) | 08/2019 | Razer Blade Pro 17 RTX 2060 i7-9750H, GeForce RTX 2060 Mobile | 2.8 kg | 19.9 mm | 17.30" | 1920x1080 | |
| 84.2 % v7 (old) | 09/2019 | Razer Blade 15 GTX 1660 Ti i7-9750H, GeForce GTX 1660 Ti Mobile | 2.1 kg | 19.9 mm | 15.60" | 1920x1080 |
| Networking | |
| iperf3 transmit AX12 | |
| Lenovo Legion Y540-15IRH | |
| Razer Blade 15 GTX 1660 Ti | |
| Acer ConceptD 7 CN715-71-743N | |
| MSI GL65 9SEK | |
| iperf3 receive AX12 | |
| Lenovo Legion Y540-15IRH | |
| Razer Blade 15 GTX 1660 Ti | |
| MSI GL65 9SEK | |
| Acer ConceptD 7 CN715-71-743N | |

| |||||||||||||||||||||||||
iluminação: 84 %
iluminação com acumulador: 370 cd/m²
Contraste: 1327:1 (Preto: 0.275 cd/m²)
ΔE ColorChecker Calman: 0.99 | ∀{0.5-29.43 Ø4.73}
calibrated: 1.01
ΔE Greyscale Calman: 1.29 | ∀{0.09-98 Ø4.97}
100% sRGB (Argyll 1.6.3 3D)
88% AdobeRGB 1998 (Argyll 1.6.3 3D)
99% AdobeRGB 1998 (Argyll 3D)
100% sRGB (Argyll 3D)
85.7% Display P3 (Argyll 3D)
Gamma: 2.2
CCT: 6548 K
| Acer ConceptD 7 CN715-71-743N AU Optronics AUO31EB, IPS, 3840x2160, 15.6" | Lenovo Legion Y540-15IRH BOE NV156FHM-N4G (BOE084D), IPS, 1920x1080, 15.6" | MSI GL65 9SEK AU Optronics B156HAN13.0, IPS, 1920x1080, 15.6" | Asus Strix GL531GV-PB74 Panda LM156LF-GL02, IPS, 1920x1080, 15.6" | Razer Blade Pro 17 RTX 2060 AU Optronics B173HAN04.0, IPS, 1920x1080, 17.3" | Razer Blade 15 GTX 1660 Ti BOE NV156FHM-N4K, IPS, 1920x1080, 15.6" | |
|---|---|---|---|---|---|---|
| Display | -22% | -55% | -50% | -26% | -22% | |
| Display P3 Coverage (%) | 85.7 | 64.5 -25% | 36.63 -57% | 40.13 -53% | 61.1 -29% | 65.3 -24% |
| sRGB Coverage (%) | 100 | 91.6 -8% | 55 -45% | 60.3 -40% | 89.4 -11% | 91.8 -8% |
| AdobeRGB 1998 Coverage (%) | 99 | 65.9 -33% | 37.85 -62% | 41.48 -58% | 62.5 -37% | 66.5 -33% |
| Response Times | 75% | 23% | 31% | 79% | 70% | |
| Response Time Grey 50% / Grey 80% * (ms) | 49 ? | 8.8 ? 82% | 26.4 ? 46% | 26 ? 47% | 6.8 ? 86% | 13.6 ? 72% |
| Response Time Black / White * (ms) | 30 ? | 10 ? 67% | 30 ? -0% | 25.6 ? 15% | 8.8 ? 71% | 10 ? 67% |
| PWM Frequency (Hz) | 200 ? | |||||
| Screen | -78% | -181% | -195% | -51% | -102% | |
| Brightness middle (cd/m²) | 365 | 284 -22% | 277.3 -24% | 290.1 -21% | 300.4 -18% | 312.7 -14% |
| Brightness (cd/m²) | 357 | 277 -22% | 256 -28% | 274 -23% | 289 -19% | 305 -15% |
| Brightness Distribution (%) | 84 | 87 4% | 86 2% | 86 2% | 93 11% | 90 7% |
| Black Level * (cd/m²) | 0.275 | 0.3 -9% | 0.2 27% | 0.54 -96% | 0.32 -16% | 0.27 2% |
| Contrast (:1) | 1327 | 947 -29% | 1387 5% | 537 -60% | 939 -29% | 1158 -13% |
| Colorchecker dE 2000 * | 0.99 | 3.53 -257% | 5.25 -430% | 5.16 -421% | 2.32 -134% | 4.57 -362% |
| Colorchecker dE 2000 max. * | 1.89 | 6.11 -223% | 19.43 -928% | 18.09 -857% | 3.81 -102% | 6.81 -260% |
| Colorchecker dE 2000 calibrated * | 1.01 | 1.81 -79% | 4.39 -335% | 4.35 -331% | 2.95 -192% | 2.91 -188% |
| Greyscale dE 2000 * | 1.29 | 3.56 -176% | 3.5 -171% | 4.4 -241% | 1.5 -16% | 4.3 -233% |
| Gamma | 2.2 100% | 2.47 89% | 2.1 105% | 2.1 105% | 2.3 96% | 2.29 96% |
| CCT | 6548 99% | 7257 90% | 6895 94% | 7362 88% | 6764 96% | 7098 92% |
| Color Space (Percent of AdobeRGB 1998) (%) | 88 | 59 -33% | 35 -60% | 38.1 -57% | 57.4 -35% | 59.4 -32% |
| Color Space (Percent of sRGB) (%) | 100 | 91 -9% | 55 -45% | 60 -40% | 89 -11% | 91.3 -9% |
| Média Total (Programa/Configurações) | -8% /
-48% | -71% /
-132% | -71% /
-140% | 1% /
-30% | -18% /
-65% |
* ... menor é melhor
Exibir tempos de resposta
| ↔ Tempo de resposta preto para branco | ||
|---|---|---|
| 30 ms ... ascensão ↗ e queda ↘ combinadas | ↗ 17 ms ascensão | 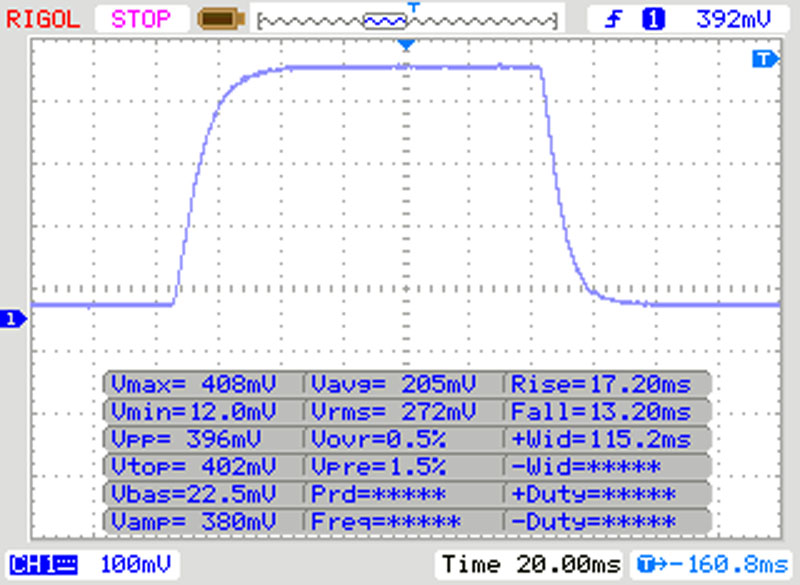 |
| ↘ 13 ms queda | ||
| A tela mostra taxas de resposta lentas em nossos testes e será insatisfatória para os jogadores. Em comparação, todos os dispositivos testados variam de 0.1 (mínimo) a 240 (máximo) ms. » 80 % de todos os dispositivos são melhores. Isso significa que o tempo de resposta medido é pior que a média de todos os dispositivos testados (19.9 ms). | ||
| ↔ Tempo de resposta 50% cinza a 80% cinza | ||
| 49 ms ... ascensão ↗ e queda ↘ combinadas | ↗ 24 ms ascensão | 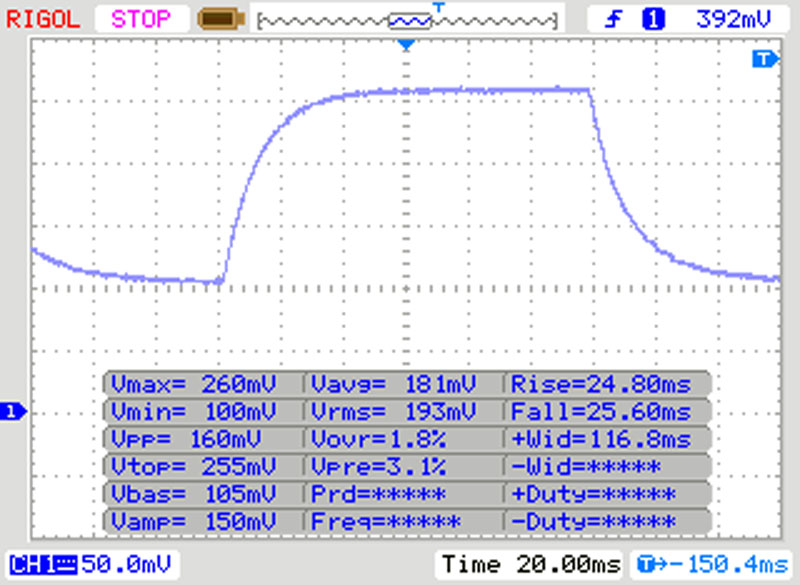 |
| ↘ 25 ms queda | ||
| A tela mostra taxas de resposta lentas em nossos testes e será insatisfatória para os jogadores. Em comparação, todos os dispositivos testados variam de 0.165 (mínimo) a 636 (máximo) ms. » 85 % de todos os dispositivos são melhores. Isso significa que o tempo de resposta medido é pior que a média de todos os dispositivos testados (31.1 ms). | ||
Cintilação da tela / PWM (modulação por largura de pulso)
| Tela tremeluzindo / PWM não detectado | 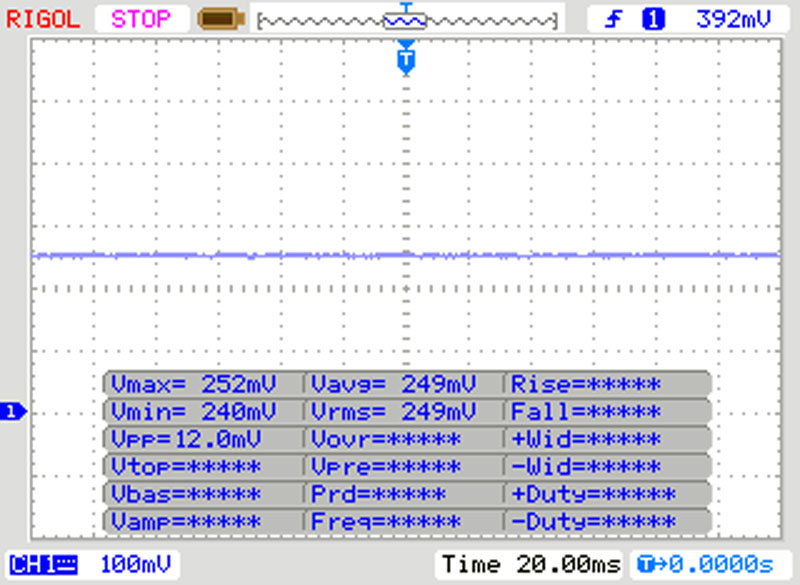 | ||
[pwm_comparison] Em comparação: 52 % de todos os dispositivos testados não usam PWM para escurecer a tela. Se PWM foi detectado, uma média de 7798 (mínimo: 5 - máximo: 343500) Hz foi medida. | |||
| Cinebench R10 | |
| Rendering Single CPUs 64Bit | |
| Média Intel Core i7-9750H (9069 - 9346, n=3) | |
| Acer ConceptD 7 CN715-71-743N | |
| Rendering Multiple CPUs 64Bit | |
| Média Intel Core i7-9750H (37188 - 44238, n=3) | |
| Acer ConceptD 7 CN715-71-743N | |
| PCMark 8 Home Score Accelerated v2 | 3533 pontos | |
| PCMark 8 Work Score Accelerated v2 | 4450 pontos | |
| PCMark 10 Score | 5449 pontos | |
Ajuda | ||
| Acer ConceptD 7 CN715-71-743N WDC PC SN720 SDAPNTW-512G | Lenovo Legion Y540-15IRH Samsung PM981a MZVLB1T0HBLR | MSI GL65 9SEK WDC PC SN520 SDAPNUW-512G | Asus Strix GL531GV-PB74 Intel SSD 660p SSDPEKNW512G8 | Razer Blade Pro 17 RTX 2060 Samsung SSD PM981 MZVLB512HAJQ | Razer Blade 15 GTX 1660 Ti Samsung SSD PM981 MZVLB256HAHQ | Média WDC PC SN720 SDAPNTW-512G | |
|---|---|---|---|---|---|---|---|
| CrystalDiskMark 5.2 / 6 | 3% | -12% | -21% | -6% | -6% | -12% | |
| Write 4K (MB/s) | 109 | 131.7 21% | 150.2 38% | 121.9 12% | 124.1 14% | 135 24% | 110 ? 1% |
| Read 4K (MB/s) | 41.33 | 48.06 16% | 43.46 5% | 53.6 30% | 44.75 8% | 41.1 -1% | 36.9 ? -11% |
| Write Seq (MB/s) | 2535 | 1234 -51% | 1412 -44% | 967 -62% | 1292 -49% | 1427 -44% | 1976 ? -22% |
| Read Seq (MB/s) | 1538 | 973 -37% | 1340 -13% | 1461 -5% | 1272 -17% | 1494 -3% | 1710 ? 11% |
| Write 4K Q32T1 (MB/s) | 396.6 | 576 45% | 482.2 22% | 431.4 9% | 514 30% | 494.9 25% | 339 ? -15% |
| Read 4K Q32T1 (MB/s) | 603 | 655 9% | 535 -11% | 337.3 -44% | 596 -1% | 578 -4% | 417 ? -31% |
| Write Seq Q32T1 (MB/s) | 2542 | 3012 18% | 1454 -43% | 972 -62% | 1892 -26% | 1417 -44% | 2218 ? -13% |
| Read Seq Q32T1 (MB/s) | 3324 | 3481 5% | 1744 -48% | 1727 -48% | 3209 -3% | 3251 -2% | 2940 ? -12% |
| AS SSD | 19% | -31% | -24% | 2% | -23% | -12% | |
| Seq Read (MB/s) | 2785 | 1954 -30% | 1315 -53% | 1280 -54% | 1810 -35% | 1829 -34% | 2544 ? -9% |
| Seq Write (MB/s) | 2364 | 2484 5% | 1378 -42% | 905 -62% | 1797 -24% | 1315 -44% | 2034 ? -14% |
| 4K Read (MB/s) | 43.39 | 56.7 31% | 25.31 -42% | 48.73 12% | 48.43 12% | 51.3 18% | 36.5 ? -16% |
| 4K Write (MB/s) | 101.8 | 124.3 22% | 118.2 16% | 107 5% | 106 4% | 106 4% | 110.8 ? 9% |
| 4K-64 Read (MB/s) | 1257 | 1599 27% | 839 -33% | 321.1 -74% | 1156 -8% | 917 -27% | 1112 ? -12% |
| 4K-64 Write (MB/s) | 1473 | 1883 28% | 720 -51% | 761 -48% | 1748 19% | 1212 -18% | 1222 ? -17% |
| Access Time Read * (ms) | 0.073 | 0.039 47% | 0.116 -59% | 0.058 21% | 0.057 22% | 0.063 14% | 0.0965 ? -32% |
| Access Time Write * (ms) | 0.036 | 0.03 17% | 0.091 -153% | 0.046 -28% | 0.035 3% | 0.104 -189% | 0.04212 ? -17% |
| Score Read (Points) | 1579 | 1851 17% | 996 -37% | 498 -68% | 1385 -12% | 1152 -27% | 1403 ? -11% |
| Score Write (Points) | 1811 | 2256 25% | 976 -46% | 958 -47% | 2033 12% | 1450 -20% | 1536 ? -15% |
| Score Total (Points) | 4181 | 5087 22% | 2485 -41% | 1711 -59% | 4135 -1% | 3177 -24% | 3633 ? -13% |
| Copy ISO MB/s (MB/s) | 1592 | 1279 -20% | 1519 -5% | 1984 25% | 1539 -3% | 1506 ? -5% | |
| Copy Program MB/s (MB/s) | 433.7 | 889 105% | 749 73% | 588 36% | 513 18% | 410 ? -5% | |
| Copy Game MB/s (MB/s) | 1026 | 1218 19% | 943 -8% | 835 -19% | 1150 12% | 894 ? -13% | |
| Média Total (Programa/Configurações) | 11% /
12% | -22% /
-24% | -23% /
-23% | -2% /
-0% | -15% /
-17% | -12% /
-12% |
* ... menor é melhor

| 3DMark 11 Performance | 16394 pontos | |
| 3DMark Cloud Gate Standard Score | 25480 pontos | |
| 3DMark Fire Strike Score | 13724 pontos | |
Ajuda | ||
| The Witcher 3 | |
| 1920x1080 High Graphics & Postprocessing (Nvidia HairWorks Off) | |
| Razer Blade Pro 17 RTX 2060 | |
| MSI GL65 9SEK | |
| Asus Strix GL531GV-PB74 | |
| Média NVIDIA GeForce RTX 2060 Mobile (74.4 - 131, n=33) | |
| Acer ConceptD 7 CN715-71-743N | |
| Razer Blade 15 GTX 1660 Ti | |
| Média da turma Multimedia (22 - 224, n=13, últimos 2 anos) | |
| 1920x1080 Ultra Graphics & Postprocessing (HBAO+) | |
| Razer Blade Pro 17 RTX 2060 | |
| Asus Strix GL531GV-PB74 | |
| Média NVIDIA GeForce RTX 2060 Mobile (50.6 - 74, n=40) | |
| MSI GL65 9SEK | |
| Acer ConceptD 7 CN715-71-743N | |
| Lenovo Legion Y540-15IRH | |
| Razer Blade 15 GTX 1660 Ti | |
| Média da turma Multimedia (11 - 121, n=13, últimos 2 anos) | |
| 3840x2160 High Graphics & Postprocessing (Nvidia HairWorks Off) | |
| Média da turma Multimedia (61 - 71, n=2, últimos 2 anos) | |
| Acer ConceptD 7 CN715-71-743N | |
| Média NVIDIA GeForce RTX 2060 Mobile (30.4 - 41.3, n=4) | |
| 3840x2160 Ultra Graphics & Postprocessing (HBAO+) | |
| Acer ConceptD 7 CN715-71-743N | |
| Média NVIDIA GeForce RTX 2060 Mobile (n=1) | |
| Rise of the Tomb Raider | |
| 1366x768 Medium Preset AF:2x | |
| Acer ConceptD 7 CN715-71-743N | |
| Média NVIDIA GeForce RTX 2060 Mobile (124 - 160, n=2) | |
| 1920x1080 High Preset AA:FX AF:4x | |
| Acer ConceptD 7 CN715-71-743N | |
| Média NVIDIA GeForce RTX 2060 Mobile (n=1) | |
| 1920x1080 Very High Preset AA:FX AF:16x | |
| Acer ConceptD 7 CN715-71-743N | |
| Média NVIDIA GeForce RTX 2060 Mobile (83.9 - 88, n=3) | |
| Lenovo Legion Y540-15IRH | |
| 3840x2160 High Preset AA:FX AF:4x | |
| Acer ConceptD 7 CN715-71-743N | |
| Média NVIDIA GeForce RTX 2060 Mobile (n=1) | |
| Doom | |
| 1920x1080 Medium Preset | |
| Acer ConceptD 7 CN715-71-743N | |
| Média NVIDIA GeForce RTX 2060 Mobile (n=1) | |
| 1920x1080 High Preset AA:FX | |
| Média NVIDIA GeForce RTX 2060 Mobile (125 - 159, n=2) | |
| Acer ConceptD 7 CN715-71-743N | |
| 1920x1080 Ultra Preset AA:SM | |
| Média NVIDIA GeForce RTX 2060 Mobile (117 - 151, n=2) | |
| Acer ConceptD 7 CN715-71-743N | |
| 3840x2160 High Preset AA:FX | |
| Média NVIDIA GeForce RTX 2060 Mobile (50 - 55.7, n=2) | |
| Acer ConceptD 7 CN715-71-743N | |
| baixo | média | alto | ultra | 4K | |
|---|---|---|---|---|---|
| The Witcher 3 (2015) | 251 | 182 | 107 | 57 | 38 |
| Dota 2 Reborn (2015) | 144 | 131 | 123 | 117 | |
| Rise of the Tomb Raider (2016) | 202 | 160 | 107 | 88 | 39 |
| Doom (2016) | 138 | 134 | 125 | 117 | 50 |
| X-Plane 11.11 (2018) | 89.4 | 83.4 | 67.2 |
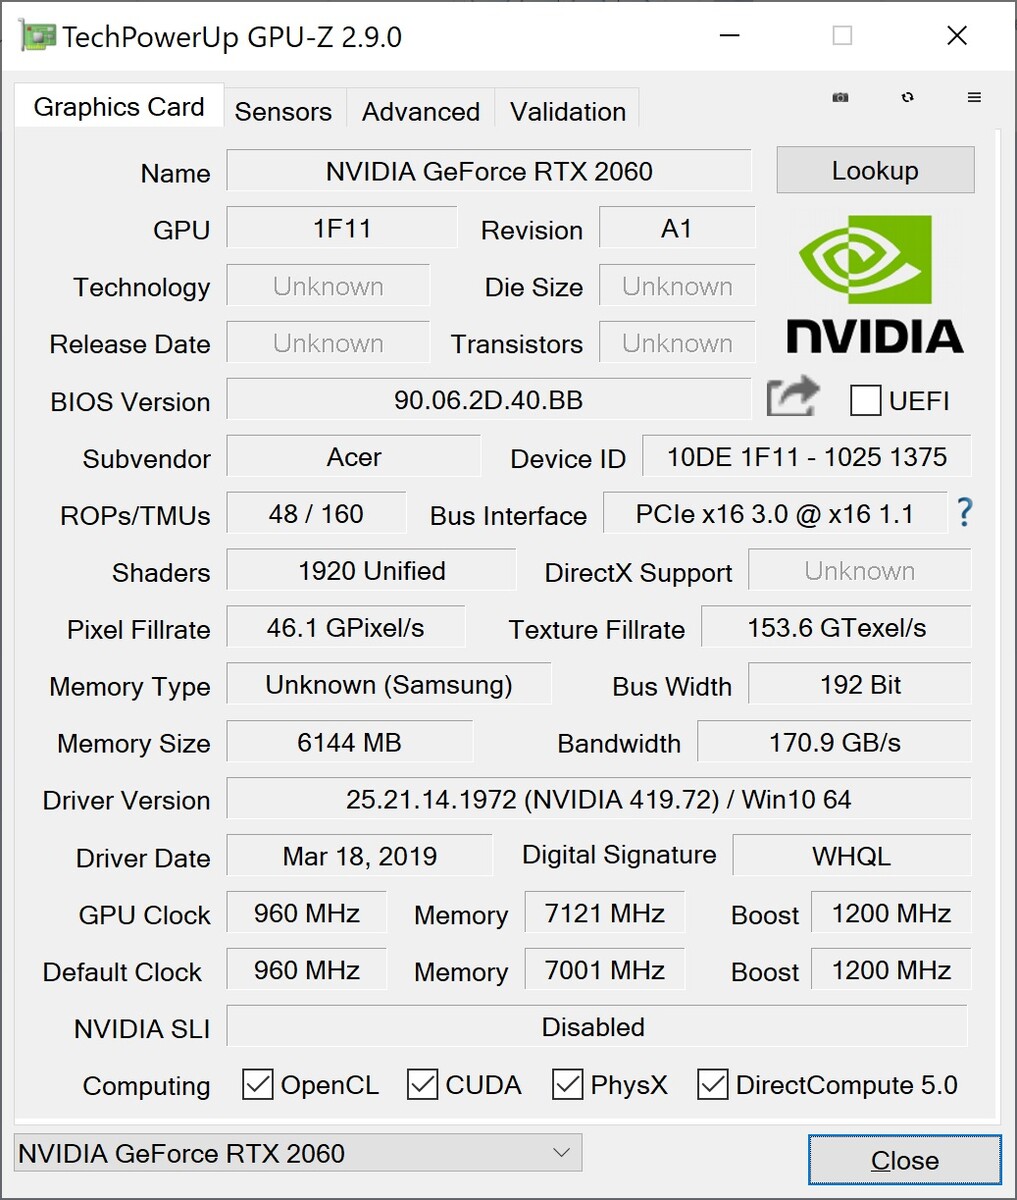
| Acer ConceptD 7 CN715-71-743N GeForce RTX 2060 Mobile, i7-9750H, WDC PC SN720 SDAPNTW-512G | Lenovo Legion Y540-15IRH GeForce RTX 2060 Mobile, i7-9750H, Samsung PM981a MZVLB1T0HBLR | MSI GL65 9SEK GeForce RTX 2060 Mobile, i7-9750H, WDC PC SN520 SDAPNUW-512G | Asus Strix GL531GV-PB74 GeForce RTX 2060 Mobile, i7-9750H, Intel SSD 660p SSDPEKNW512G8 | Razer Blade Pro 17 RTX 2060 GeForce RTX 2060 Mobile, i7-9750H, Samsung SSD PM981 MZVLB512HAJQ | Razer Blade 15 GTX 1660 Ti GeForce GTX 1660 Ti Mobile, i7-9750H, Samsung SSD PM981 MZVLB256HAHQ | |
|---|---|---|---|---|---|---|
| Noise | -6% | -10% | -5% | 0% | -2% | |
| desligado / ambiente * (dB) | 30.4 | 30 1% | 28.1 8% | 28.2 7% | 28.2 7% | 28.5 6% |
| Idle Minimum * (dB) | 30.6 | 30 2% | 31.4 -3% | 28.8 6% | 28.2 8% | 30.3 1% |
| Idle Average * (dB) | 30.6 | 32 -5% | 31.5 -3% | 31.4 -3% | 28.2 8% | 30.5 -0% |
| Idle Maximum * (dB) | 30.6 | 34 -11% | 33.5 -9% | 33.3 -9% | 28.2 8% | 30.5 -0% |
| Load Average * (dB) | 44 | 44 -0% | 49.3 -12% | 46.2 -5% | 43 2% | 41 7% |
| Witcher 3 ultra * (dB) | 43.9 | 48 -9% | 51.3 -17% | 50.5 -15% | 48.4 -10% | 48 -9% |
| Load Maximum * (dB) | 44.2 | 52 -18% | 58 -31% | 51.3 -16% | 53.4 -21% | 51.9 -17% |
* ... menor é melhor
Barulho
| Ocioso |
| 30.6 / 30.6 / 30.6 dB |
| Carga |
| 44 / 44.2 dB |
 | ||
30 dB silencioso 40 dB(A) audível 50 dB(A) ruidosamente alto |
||
min: | ||
(±) A temperatura máxima no lado superior é 44.6 °C / 112 F, em comparação com a média de 36.8 °C / 98 F , variando de 21 a 71 °C para a classe Multimedia.
(-) A parte inferior aquece até um máximo de 57.2 °C / 135 F, em comparação com a média de 39.1 °C / 102 F
(+) Em uso inativo, a temperatura média para o lado superior é 25.5 °C / 78 F, em comparação com a média do dispositivo de 31.3 °C / ### class_avg_f### F.
(-) Jogando The Witcher 3, a temperatura média para o lado superior é 38.5 °C / 101 F, em comparação com a média do dispositivo de 31.3 °C / ## #class_avg_f### F.
(-) Os apoios para as mãos e o touchpad podem ficar muito quentes ao toque, com um máximo de 41 °C / 105.8 F.
(-) A temperatura média da área do apoio para as mãos de dispositivos semelhantes foi 28.7 °C / 83.7 F (-12.3 °C / -22.1 F).
| Acer ConceptD 7 CN715-71-743N GeForce RTX 2060 Mobile, i7-9750H, WDC PC SN720 SDAPNTW-512G | Lenovo Legion Y540-15IRH GeForce RTX 2060 Mobile, i7-9750H, Samsung PM981a MZVLB1T0HBLR | MSI GL65 9SEK GeForce RTX 2060 Mobile, i7-9750H, WDC PC SN520 SDAPNUW-512G | Asus Strix GL531GV-PB74 GeForce RTX 2060 Mobile, i7-9750H, Intel SSD 660p SSDPEKNW512G8 | Razer Blade Pro 17 RTX 2060 GeForce RTX 2060 Mobile, i7-9750H, Samsung SSD PM981 MZVLB512HAJQ | Razer Blade 15 GTX 1660 Ti GeForce GTX 1660 Ti Mobile, i7-9750H, Samsung SSD PM981 MZVLB256HAHQ | |
|---|---|---|---|---|---|---|
| Heat | -24% | -24% | -5% | 2% | -23% | |
| Maximum Upper Side * (°C) | 44.6 | 47 -5% | 49 -10% | 43.4 3% | 40.6 9% | 52 -17% |
| Maximum Bottom * (°C) | 57.2 | 60 -5% | 54.2 5% | 49.2 14% | 45.4 21% | 52.2 9% |
| Idle Upper Side * (°C) | 27.4 | 37 -35% | 40.4 -47% | 30.8 -12% | 30 -9% | 38 -39% |
| Idle Bottom * (°C) | 27.6 | 41 -49% | 40 -45% | 34 -23% | 31 -12% | 40.4 -46% |
* ... menor é melhor
Acer ConceptD 7 CN715-71-743N análise de áudio
(-) | alto-falantes não muito altos (###valor### dB)
Graves 100 - 315Hz
(±) | graves reduzidos - em média 13.3% menor que a mediana
(-) | graves não são lineares (17% delta para frequência anterior)
Médios 400 - 2.000 Hz
(+) | médios equilibrados - apenas 3.9% longe da mediana
(+) | médios são lineares (6.9% delta para frequência anterior)
Altos 2 - 16 kHz
(+) | agudos equilibrados - apenas 3.2% longe da mediana
(±) | a linearidade dos máximos é média (7.2% delta para frequência anterior)
Geral 100 - 16.000 Hz
(±) | a linearidade do som geral é média (17.3% diferença em relação à mediana)
Comparado com a mesma classe
» 49% de todos os dispositivos testados nesta classe foram melhores, 7% semelhantes, 43% piores
» O melhor teve um delta de 5%, a média foi 17%, o pior foi 45%
Comparado com todos os dispositivos testados
» 32% de todos os dispositivos testados foram melhores, 8% semelhantes, 59% piores
» O melhor teve um delta de 4%, a média foi 24%, o pior foi 134%
Apple MacBook 12 (Early 2016) 1.1 GHz análise de áudio
(+) | os alto-falantes podem tocar relativamente alto (###valor### dB)
Graves 100 - 315Hz
(±) | graves reduzidos - em média 11.3% menor que a mediana
(±) | a linearidade dos graves é média (14.2% delta para a frequência anterior)
Médios 400 - 2.000 Hz
(+) | médios equilibrados - apenas 2.4% longe da mediana
(+) | médios são lineares (5.5% delta para frequência anterior)
Altos 2 - 16 kHz
(+) | agudos equilibrados - apenas 2% longe da mediana
(+) | os máximos são lineares (4.5% delta da frequência anterior)
Geral 100 - 16.000 Hz
(+) | o som geral é linear (10.2% diferença em relação à mediana)
Comparado com a mesma classe
» 7% de todos os dispositivos testados nesta classe foram melhores, 2% semelhantes, 91% piores
» O melhor teve um delta de 5%, a média foi 18%, o pior foi 53%
Comparado com todos os dispositivos testados
» 5% de todos os dispositivos testados foram melhores, 1% semelhantes, 94% piores
» O melhor teve um delta de 4%, a média foi 24%, o pior foi 134%
| desligado | |
| Ocioso | |
| Carga |
|
Key:
min: | |
| Acer ConceptD 7 CN715-71-743N i7-9750H, GeForce RTX 2060 Mobile, WDC PC SN720 SDAPNTW-512G, IPS, 3840x2160, 15.6" | MSI GL65 9SEK i7-9750H, GeForce RTX 2060 Mobile, WDC PC SN520 SDAPNUW-512G, IPS, 1920x1080, 15.6" | Asus Strix GL531GV-PB74 i7-9750H, GeForce RTX 2060 Mobile, Intel SSD 660p SSDPEKNW512G8, IPS, 1920x1080, 15.6" | Razer Blade Pro 17 RTX 2060 i7-9750H, GeForce RTX 2060 Mobile, Samsung SSD PM981 MZVLB512HAJQ, IPS, 1920x1080, 17.3" | Razer Blade 15 GTX 1660 Ti i7-9750H, GeForce GTX 1660 Ti Mobile, Samsung SSD PM981 MZVLB256HAHQ, IPS, 1920x1080, 15.6" | Lenovo Legion Y540-15IRH i7-9750H, GeForce RTX 2060 Mobile, Samsung PM981a MZVLB1T0HBLR, IPS, 1920x1080, 15.6" | Média NVIDIA GeForce RTX 2060 Mobile | Média da turma Multimedia | |
|---|---|---|---|---|---|---|---|---|
| Power Consumption | -141% | -27% | -42% | -61% | -36% | -23% | 32% | |
| Idle Minimum * (Watt) | 7.6 | 41 -439% | 10.9 -43% | 16 -111% | 18.7 -146% | 15 -97% | 11.5 ? -51% | 5.71 ? 25% |
| Idle Average * (Watt) | 13.6 | 45.3 -233% | 14.7 -8% | 21.7 -60% | 30.7 -126% | 20 -47% | 16.5 ? -21% | 10.1 ? 26% |
| Idle Maximum * (Watt) | 18.2 | 47.1 -159% | 32.4 -78% | 26.1 -43% | 33.9 -86% | 33 -81% | 23.7 ? -30% | 12.4 ? 32% |
| Load Average * (Watt) | 102 | 94.9 7% | 121.9 -20% | 105.6 -4% | 93.4 8% | 88 14% | 107.5 ? -5% | 65 ? 36% |
| Witcher 3 ultra * (Watt) | 144 | 149.4 -4% | 143.5 -0% | 161.8 -12% | 158.9 -10% | 128 11% | ||
| Load Maximum * (Watt) | 183 | 214.2 -17% | 209.6 -15% | 225.3 -23% | 195.3 -7% | 213 -16% | 199.7 ? -9% | 112.2 ? 39% |
* ... menor é melhor
| Acer ConceptD 7 CN715-71-743N i7-9750H, GeForce RTX 2060 Mobile, 84 Wh | MSI GL65 9SEK i7-9750H, GeForce RTX 2060 Mobile, 51 Wh | Lenovo Legion Y540-15IRH i7-9750H, GeForce RTX 2060 Mobile, 57 Wh | Asus Strix GL531GV-PB74 i7-9750H, GeForce RTX 2060 Mobile, 66 Wh | Razer Blade Pro 17 RTX 2060 i7-9750H, GeForce RTX 2060 Mobile, 70 Wh | Razer Blade 15 GTX 1660 Ti i7-9750H, GeForce GTX 1660 Ti Mobile, 65 Wh | Média da turma Multimedia | |
|---|---|---|---|---|---|---|---|
| Duração da bateria | -54% | -55% | -78% | -48% | -36% | 70% | |
| Reader / Idle (h) | 13.7 | 4.4 -68% | 3.9 -72% | 25.2 ? 84% | |||
| H.264 (h) | 6.5 | 16.4 ? 152% | |||||
| WiFi v1.3 (h) | 8.6 | 3.8 -56% | 3.2 -63% | 1.9 -78% | 4.5 -48% | 5.5 -36% | 12 ? 40% |
| Load (h) | 1.6 | 1 -37% | 1.1 -31% | 1.675 ? 5% |
Pro
Contra
Veredicto - Excelente tela, baixo desempenho
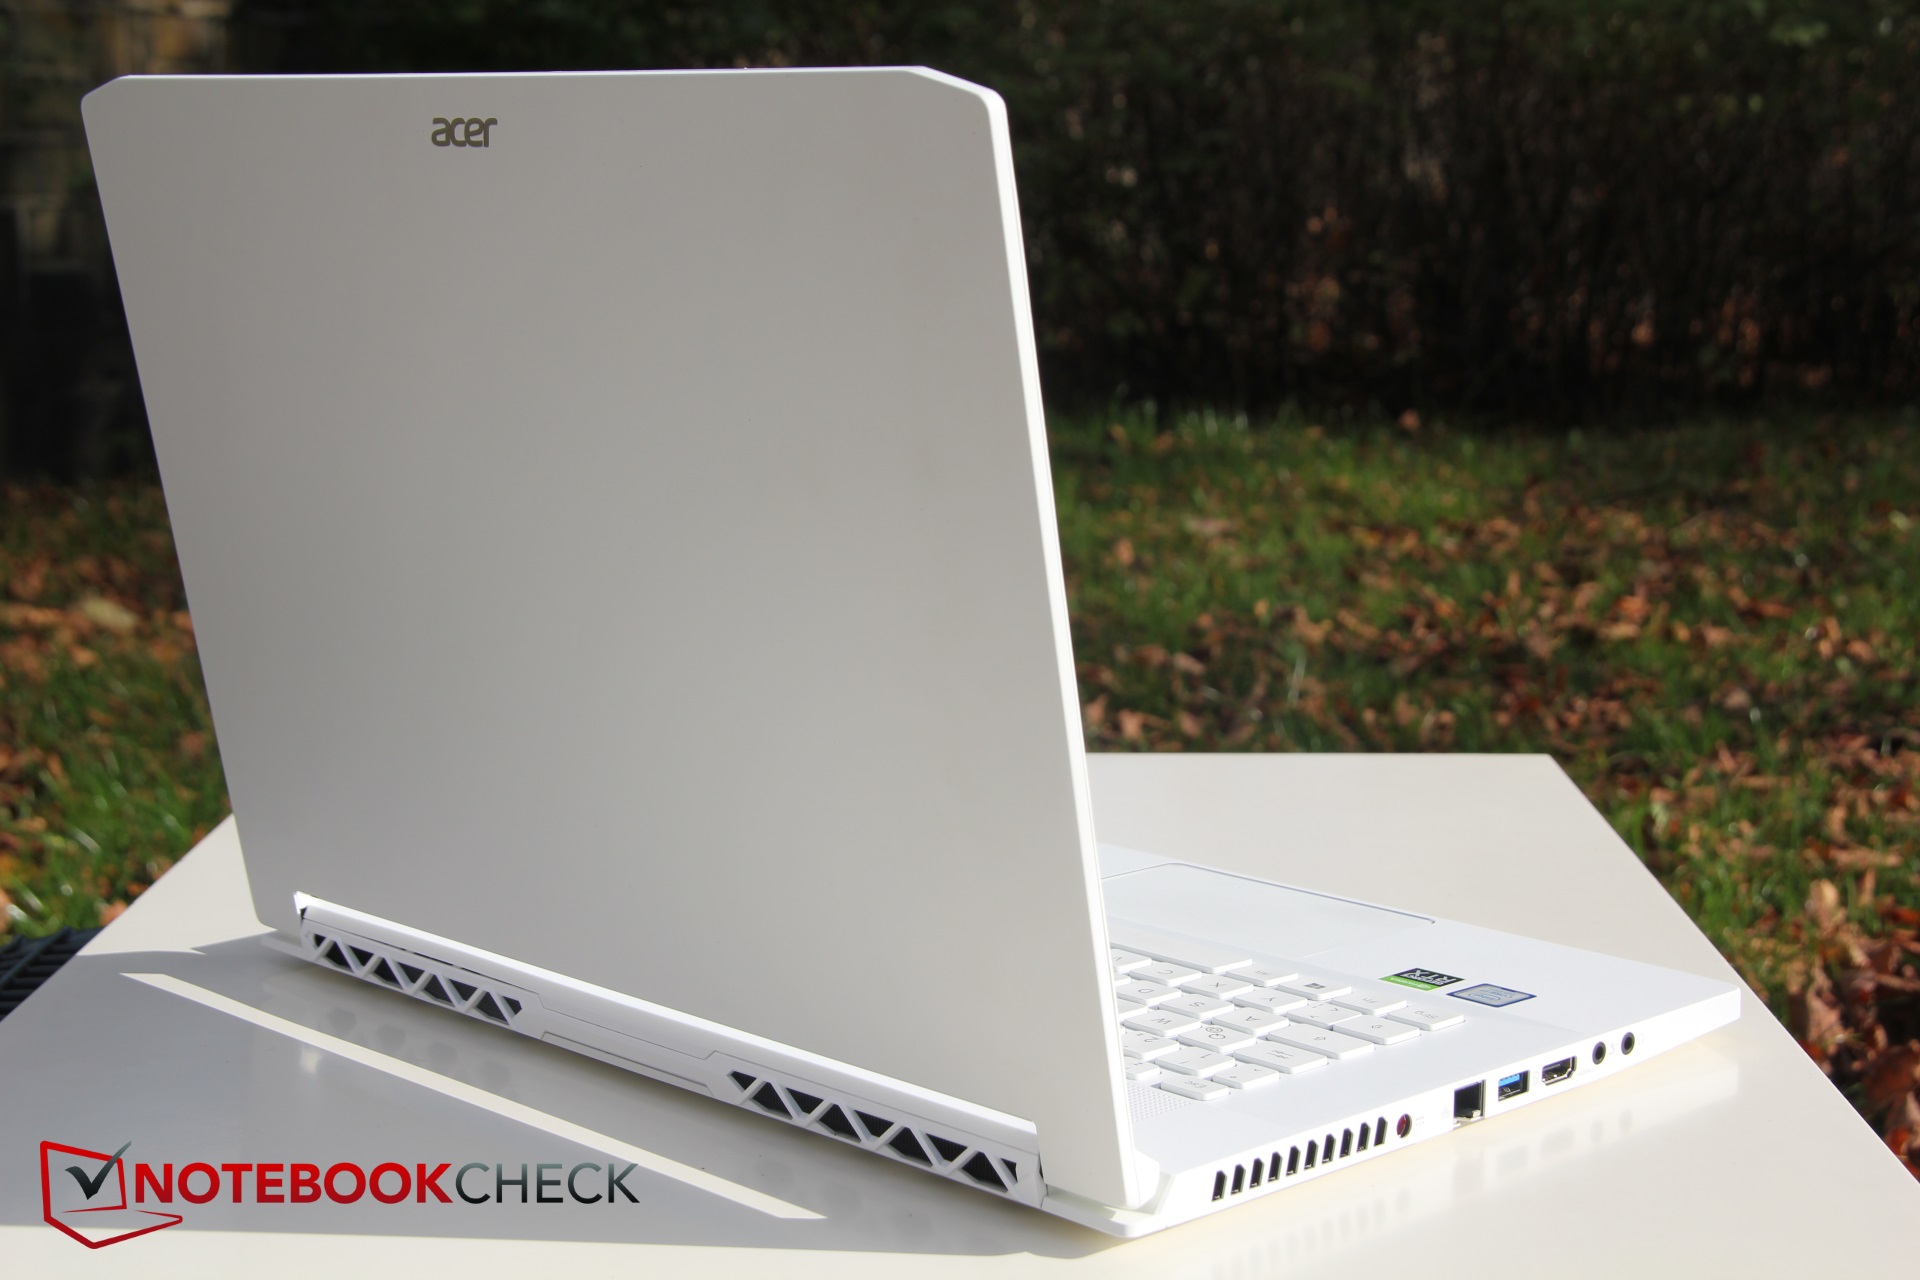
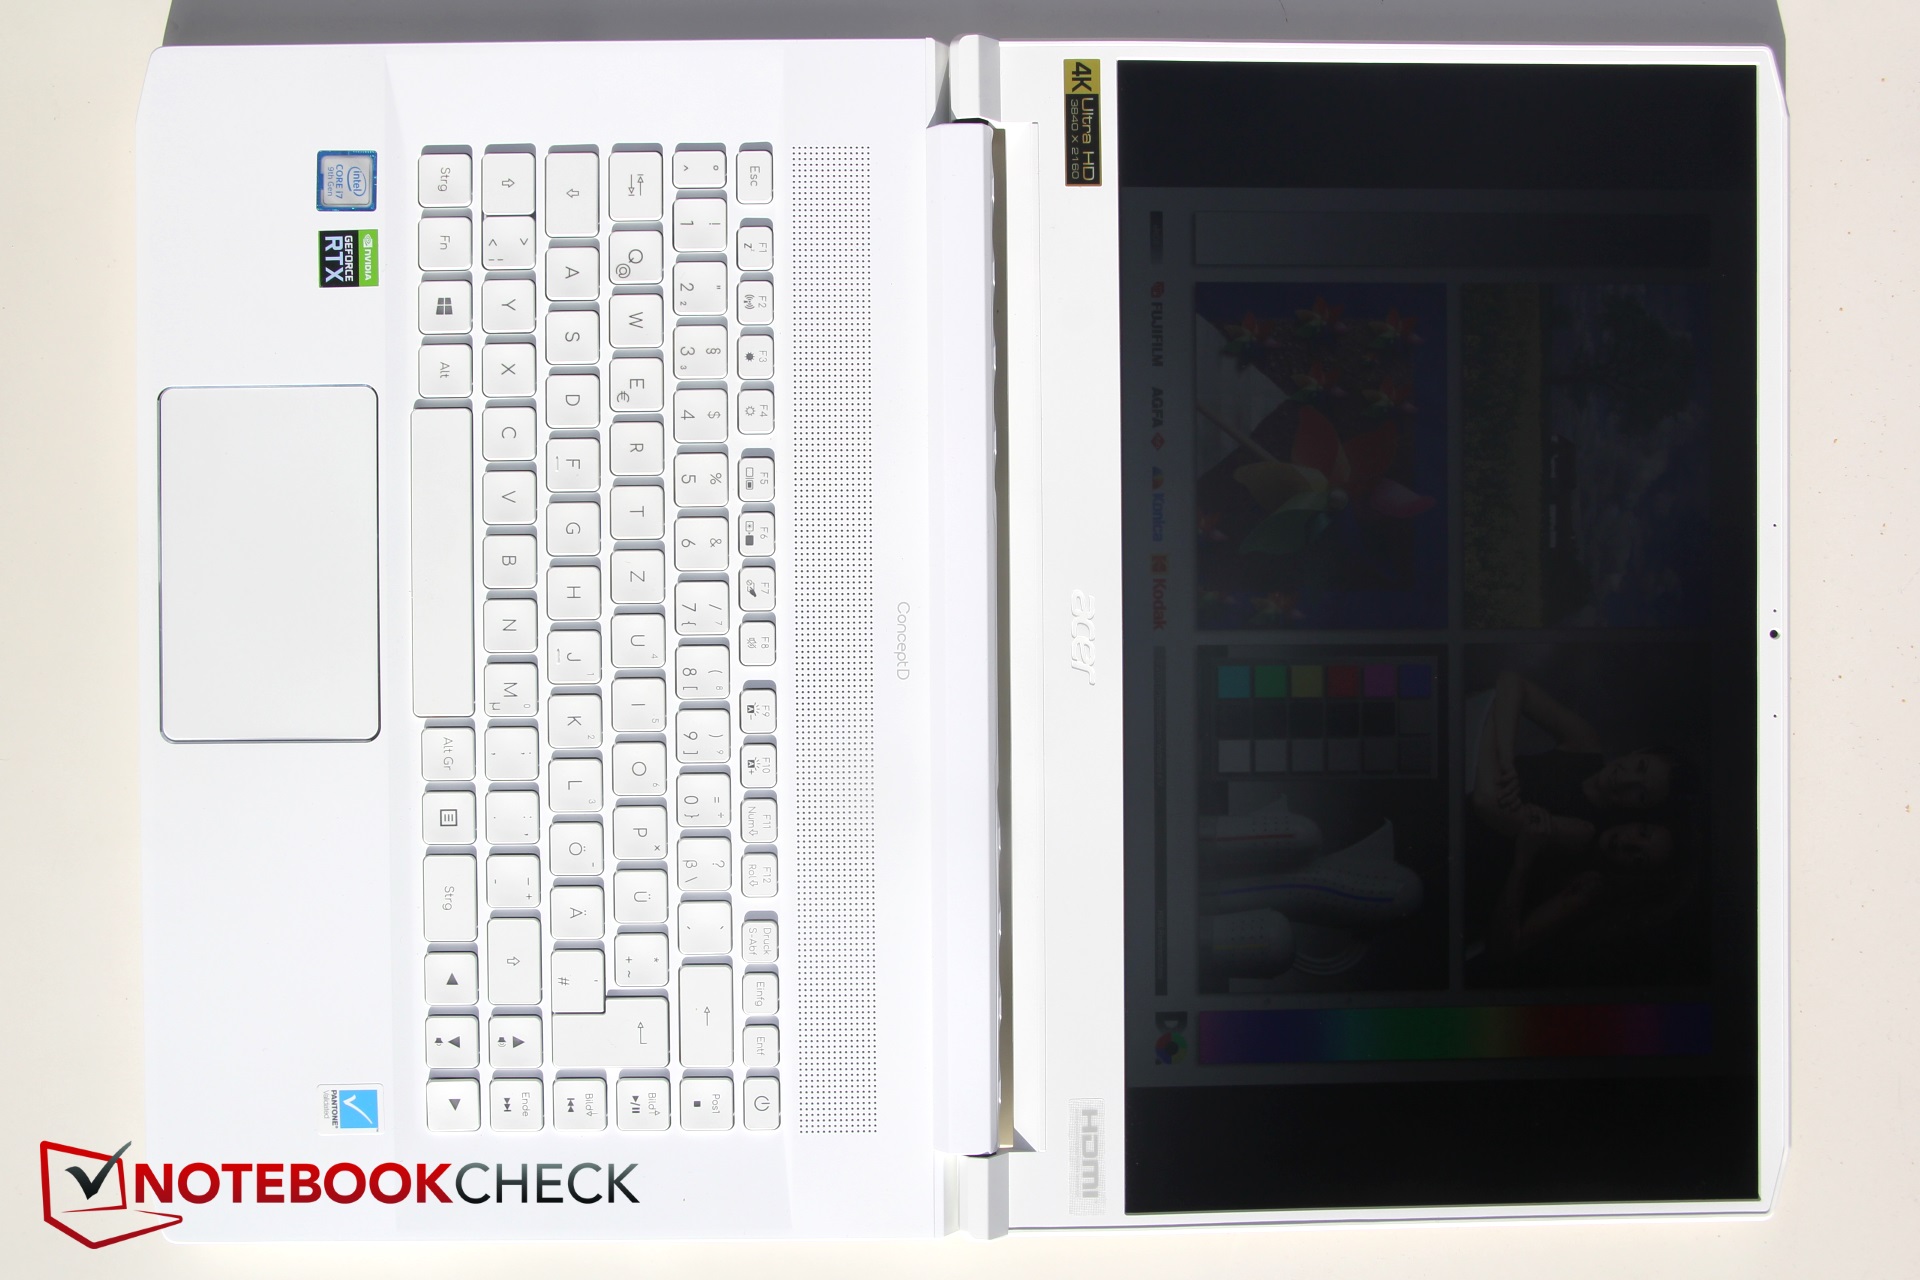
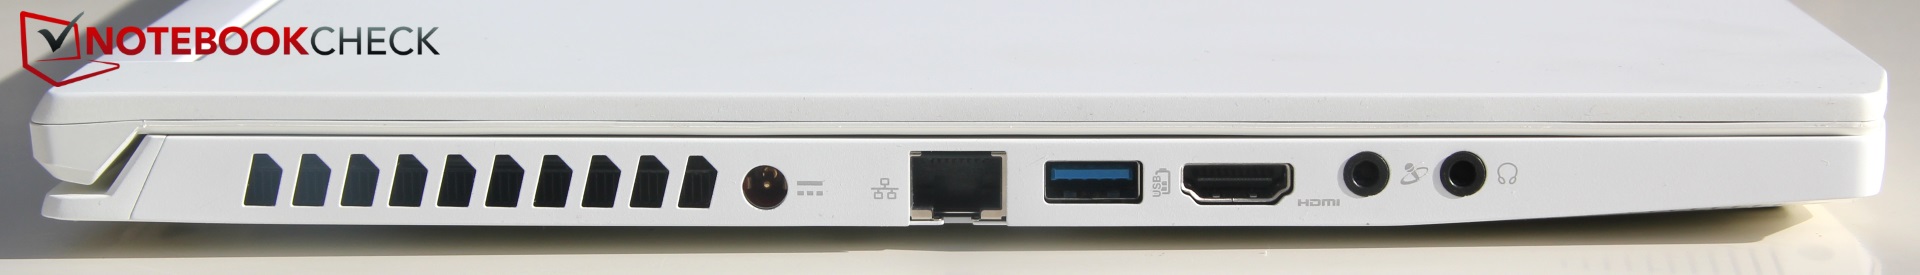
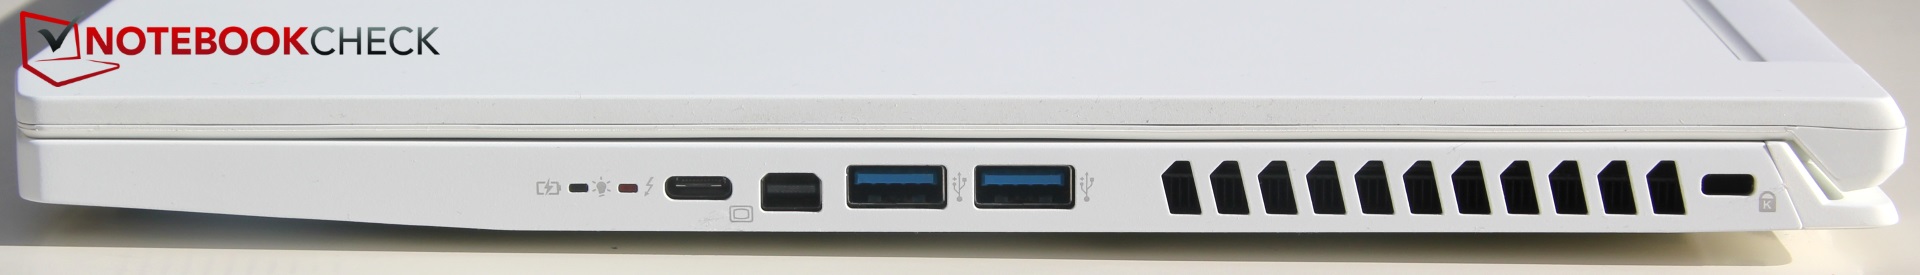
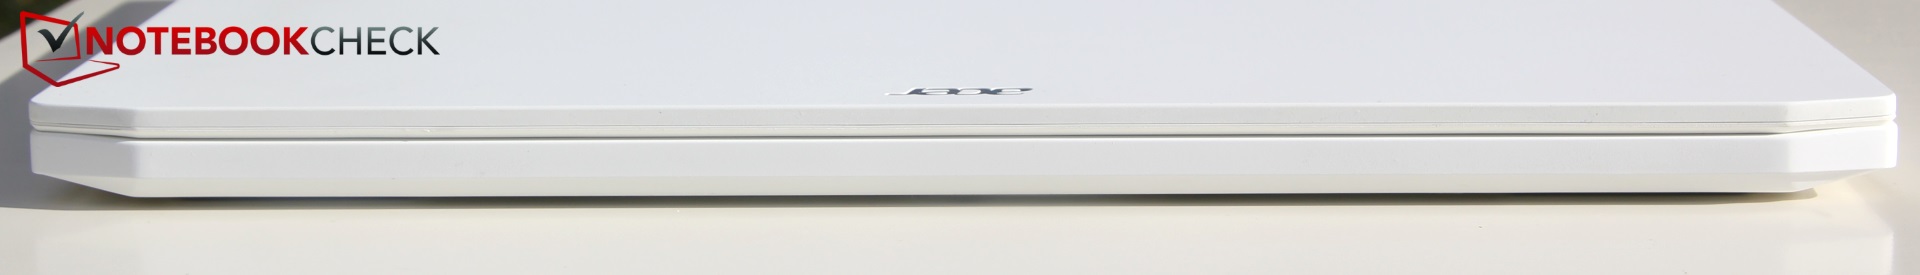
O ConceptD da Acer é anunciado como um sistema multimídia de alto desempenho para criadores. Os resultados de nossa análise apenas confirmam parcialmente essa afirmação, dado que a Acer faz alguns recortes. Por mais de 2.000 Euros (~US$ 2.204), os compradores menos sensíveis ao preço recebem um portátil multimídia elegante com aparência premium que, considerando seus fortes recursos, é bastante compacto e leve. Além disso, ele permanece frio, silencioso e o consumo de energia também é mais do que razoável.
No entanto, o último deriva de componentes com desempenho bastante ruim. A CPU, em particular, se limita bastante, o desenvolvimento de calor reduz ainda mais o desempenho devido ao chassi pequeno e no modo de bateria, e o poder da computação sofre outro grande golpe.
Aqueles que escolhem seu sistema multimídia puramente com base nas proezas do hardware são melhor atendidos por concorrentes menos dispendiosos. Com sua tela 4K brilhante, que oferece uma boa taxa de contraste e uma cobertura muito boa do espaço de cores, o ConceptD ainda tem um ás na manga, já que a maioria dos outros portáteis multimídia não pode competir nesse sentido. Aqui, precisam ser feitas compensações.
O ConceptD7 é elegante, silencioso, frio, econômico e oferece uma aparência e um toque premium. A tela 4K, que oferece alta cobertura do espaço de cores, pode ser um fator decisivo na decisão de compra de criadores. No entanto, o desempenho do Acer é decepcionante com a forte limitação da CPU, levando a um sistema significativamente mais lento em comparação com os concorrentes.
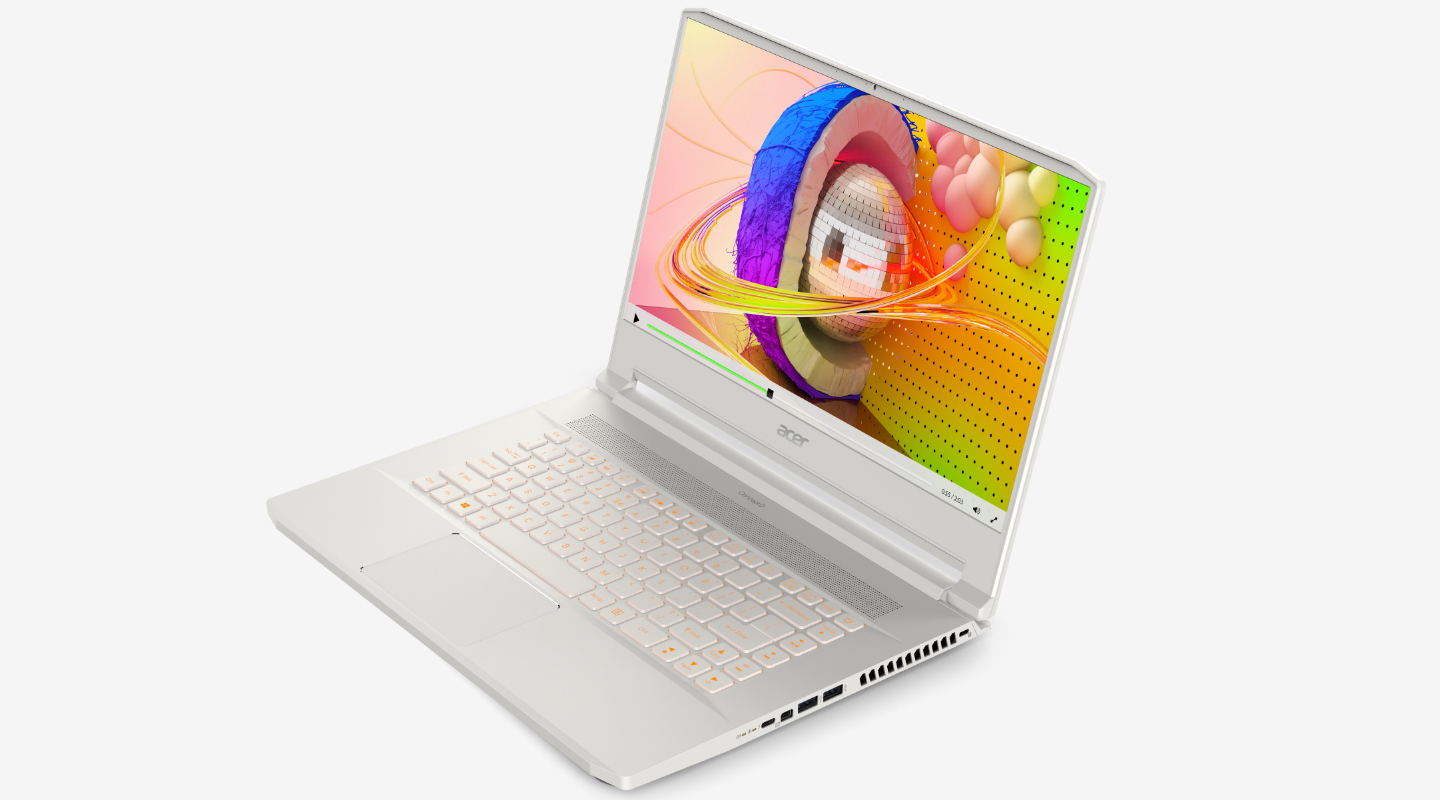
Acer ConceptD 7 CN715-71-743N
- 05/21/2020 v7 (old)
Christian Hintze
Price comparison
