Breve Análise do Portátil Razer Blade Pro 17 RTX 2060: Como se compara com o RTX 2080 Max-Q?

| SD Card Reader | |
| average JPG Copy Test (av. of 3 runs) | |
| Razer Blade Pro 17 RTX 2060 (Toshiba Exceria Pro SDXC 64 GB UHS-II) | |
| Razer Blade Pro 2017 (Toshiba Exceria Pro SDXC 64 GB UHS-II) | |
| maximum AS SSD Seq Read Test (1GB) | |
| Razer Blade Pro 17 RTX 2060 (Toshiba Exceria Pro SDXC 64 GB UHS-II) | |
| Razer Blade Pro 2017 (Toshiba Exceria Pro SDXC 64 GB UHS-II) | |
| |||||||||||||||||||||||||
iluminação: 93 %
iluminação com acumulador: 300.4 cd/m²
Contraste: 939:1 (Preto: 0.32 cd/m²)
ΔE ColorChecker Calman: 2.32 | ∀{0.5-29.43 Ø4.72}
calibrated: 2.95
ΔE Greyscale Calman: 1.5 | ∀{0.09-98 Ø4.97}
89% sRGB (Argyll 1.6.3 3D)
57.4% AdobeRGB 1998 (Argyll 1.6.3 3D)
62.5% AdobeRGB 1998 (Argyll 3D)
89.4% sRGB (Argyll 3D)
61.1% Display P3 (Argyll 3D)
Gamma: 2.3
CCT: 6764 K
| Razer Blade Pro 17 RTX 2060 AU Optronics B173HAN04.0, IPS, 17.3", 1920x1080 | Asus Zephyrus S GX701GX B173HAN04.0 (AUO409D), IPS, 17.3", 1920x1080 | MSI GS75 Stealth 9SG Chi Mei N173HCE-G33 (CMN175C), IPS, 17.3", 1920x1080 | Asus ASUS ROG Strix SCAR III G731GW-XB74 AU Optronics AUO409D, IPS, 17.3", 1920x1080 | Razer Blade Pro 2017 Sharp LQ173D1JW33 (SHP145A), IGZO, 17.3", 3840x2160 | Acer Predator Helios 500 PH517-51-93LS B173ZAN01.0, IPS LED, 17.3", 3840x2160 | |
|---|---|---|---|---|---|---|
| Display | 1% | 4% | -0% | 39% | 38% | |
| Display P3 Coverage (%) | 61.1 | 62.9 3% | 62.6 2% | 61.9 1% | 88.9 45% | 86.7 42% |
| sRGB Coverage (%) | 89.4 | 87.8 -2% | 93.5 5% | 86.3 -3% | 100 12% | 100 12% |
| AdobeRGB 1998 Coverage (%) | 62.5 | 63.9 2% | 64.7 4% | 62.9 1% | 99.7 60% | 99.4 59% |
| Response Times | -8% | -10% | -19% | -565% | -303% | |
| Response Time Grey 50% / Grey 80% * (ms) | 6.8 ? | 7.2 ? -6% | 7.2 ? -6% | 7.2 ? -6% | 60.8 ? -794% | 36 ? -429% |
| Response Time Black / White * (ms) | 8.8 ? | 9.6 ? -9% | 10 ? -14% | 11.6 ? -32% | 38.4 ? -336% | 24.4 ? -177% |
| PWM Frequency (Hz) | 25510 ? | 204.9 ? | ||||
| Screen | 7% | 17% | -34% | -45% | -15% | |
| Brightness middle (cd/m²) | 300.4 | 288 -4% | 366 22% | 297.4 -1% | 230 -23% | 366 22% |
| Brightness (cd/m²) | 289 | 287 -1% | 343 19% | 306 6% | 207 -28% | 349 21% |
| Brightness Distribution (%) | 93 | 91 -2% | 91 -2% | 80 -14% | 83 -11% | 86 -8% |
| Black Level * (cd/m²) | 0.32 | 0.2 37% | 0.29 9% | 0.31 3% | 0.2 37% | 0.46 -44% |
| Contrast (:1) | 939 | 1440 53% | 1262 34% | 959 2% | 1150 22% | 796 -15% |
| Colorchecker dE 2000 * | 2.32 | 2.33 -0% | 1.51 35% | 4.08 -76% | 5.62 -142% | 2.9 -25% |
| Colorchecker dE 2000 max. * | 3.81 | 5.34 -40% | 3.22 15% | 6.88 -81% | 10.24 -169% | 5.4 -42% |
| Colorchecker dE 2000 calibrated * | 2.95 | 2.47 16% | 0.71 76% | 4 -36% | 3.1 -5% | |
| Greyscale dE 2000 * | 1.5 | 1.19 21% | 1.93 -29% | 4 -167% | 4.54 -203% | 3.5 -133% |
| Gamma | 2.3 96% | 2.41 91% | 2.38 92% | 2.259 97% | 2.36 93% | 2.37 93% |
| CCT | 6764 96% | 6710 97% | 6881 94% | 7205 90% | 6625 98% | 6616 98% |
| Color Space (Percent of AdobeRGB 1998) (%) | 57.4 | 57 -1% | 60 5% | 56 -2% | 88 53% | 88.1 53% |
| Color Space (Percent of sRGB) (%) | 89 | 88 -1% | 94 6% | 86 -3% | 100 12% | 100 12% |
| Média Total (Programa/Configurações) | 0% /
4% | 4% /
11% | -18% /
-26% | -190% /
-98% | -93% /
-41% |
* ... menor é melhor
Exibir tempos de resposta
| ↔ Tempo de resposta preto para branco | ||
|---|---|---|
| 8.8 ms ... ascensão ↗ e queda ↘ combinadas | ↗ 4.4 ms ascensão | 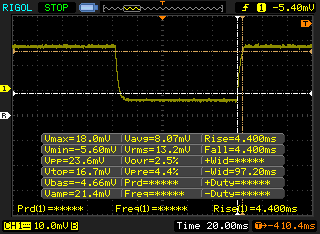 |
| ↘ 4.4 ms queda | ||
| A tela mostra taxas de resposta rápidas em nossos testes e deve ser adequada para jogos. Em comparação, todos os dispositivos testados variam de 0.1 (mínimo) a 240 (máximo) ms. » 24 % de todos os dispositivos são melhores. Isso significa que o tempo de resposta medido é melhor que a média de todos os dispositivos testados (19.8 ms). | ||
| ↔ Tempo de resposta 50% cinza a 80% cinza | ||
| 6.8 ms ... ascensão ↗ e queda ↘ combinadas | ↗ 3.6 ms ascensão | 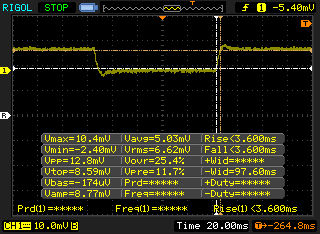 |
| ↘ 3.2 ms queda | ||
| A tela mostra taxas de resposta muito rápidas em nossos testes e deve ser muito adequada para jogos em ritmo acelerado. Em comparação, todos os dispositivos testados variam de 0.165 (mínimo) a 636 (máximo) ms. » 20 % de todos os dispositivos são melhores. Isso significa que o tempo de resposta medido é melhor que a média de todos os dispositivos testados (31 ms). | ||
Cintilação da tela / PWM (modulação por largura de pulso)
| Tela tremeluzindo / PWM não detectado | 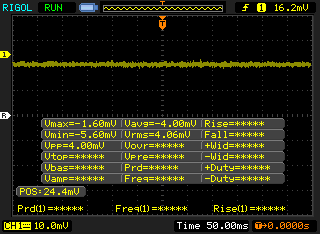 | ||
[pwm_comparison] Em comparação: 52 % de todos os dispositivos testados não usam PWM para escurecer a tela. Se PWM foi detectado, uma média de 7772 (mínimo: 5 - máximo: 343500) Hz foi medida. | |||
| Cinebench R10 | |
| Rendering Multiple CPUs 32Bit | |
| Schenker XMG Ultra 15 Turing | |
| MSI GE75 9SG | |
| Média Intel Core i7-9750H (28251 - 36304, n=13) | |
| Lenovo Legion Y540-17IRH | |
| Asus Strix GL703VM-DB74 | |
| Rendering Single 32Bit | |
| Schenker XMG Ultra 15 Turing | |
| MSI GE75 9SG | |
| Média Intel Core i7-9750H (6659 - 7214, n=13) | |
| Lenovo Legion Y540-17IRH | |
| Asus Strix GL703VM-DB74 | |
| wPrime 2.10 - 1024m | |
| Asus Strix GL703VM-DB74 | |
| Média Intel Core i7-9750H (n=1) | |
| MSI GE75 9SG | |
* ... menor é melhor
| PCMark 8 Home Score Accelerated v2 | 4401 pontos | |
| PCMark 8 Work Score Accelerated v2 | 5676 pontos | |
| PCMark 10 Score | 5641 pontos | |
Ajuda | ||
| Razer Blade Pro 17 RTX 2060 Samsung SSD PM981 MZVLB512HAJQ | Asus Zephyrus S GX701GX Samsung SSD PM981 MZVLB1T0HALR | MSI GS75 Stealth 9SG 2x Samsung SSD PM981 MZVLB1T0HALR (RAID 0) | Asus ASUS ROG Strix SCAR III G731GW-XB74 Intel SSD 660p 1TB SSDPEKNW010T8 | Razer Blade Pro 2017 2x Samsung SSD PM951 MZVLV256HCHP (RAID 0) | |
|---|---|---|---|---|---|
| AS SSD | 5% | 6% | -34% | -19% | |
| Seq Read (MB/s) | 1810 | 911 -50% | 2855 58% | 1427 -21% | 2599 44% |
| Seq Write (MB/s) | 1797 | 2347 31% | 2687 50% | 1610 -10% | 588 -67% |
| 4K Read (MB/s) | 48.43 | 53 9% | 30.31 -37% | 25.63 -47% | 37.57 -22% |
| 4K Write (MB/s) | 106 | 122.5 16% | 96.3 -9% | 84.2 -21% | 104.4 -2% |
| 4K-64 Read (MB/s) | 1156 | 1577 36% | 1460 26% | 588 -49% | 1116 -3% |
| 4K-64 Write (MB/s) | 1748 | 1734 -1% | 1224 -30% | 732 -58% | 513 -71% |
| Access Time Read * (ms) | 0.057 | 0.08 -40% | 0.054 5% | 0.054 5% | 0.051 11% |
| Access Time Write * (ms) | 0.035 | 0.031 11% | 0.038 -9% | 0.071 -103% | 0.036 -3% |
| Score Read (Points) | 1385 | 1721 24% | 1776 28% | 756 -45% | 1414 2% |
| Score Write (Points) | 2033 | 2091 3% | 1589 -22% | 978 -52% | 676 -67% |
| Score Total (Points) | 4135 | 4771 15% | 4259 3% | 2134 -48% | 2715 -34% |
| Copy ISO MB/s (MB/s) | 1984 | 2226 12% | 1489 -25% | ||
| Copy Program MB/s (MB/s) | 588 | 426.4 -27% | 514 -13% | ||
| Copy Game MB/s (MB/s) | 835 | 1152 38% | 893 7% |
* ... menor é melhor

| 3DMark 11 | |
| 1280x720 Performance GPU | |
| MSI GE75 9SG | |
| Razer Blade Pro 17 RTX 2080 Max-Q | |
| MSI GS75 Stealth 9SG | |
| Schenker XMG Ultra 15 Turing | |
| MSI RTX 2060 Gaming Z 6G | |
| Razer Blade Pro 2017 | |
| Alienware m15 P79F | |
| Alienware 17 R5 | |
| Razer Blade Pro 17 RTX 2060 | |
| Média NVIDIA GeForce RTX 2060 Mobile (19143 - 24662, n=40) | |
| Lenovo Legion Y540-17IRH | |
| Asus Strix GL703VM-DB74 | |
| MSI GF75 Thin 9SC | |
| 1280x720 Performance Combined | |
| MSI GE75 9SG | |
| Schenker XMG Ultra 15 Turing | |
| MSI RTX 2060 Gaming Z 6G | |
| MSI GS75 Stealth 9SG | |
| Razer Blade Pro 17 RTX 2060 | |
| Razer Blade Pro 17 RTX 2080 Max-Q | |
| MSI GF75 Thin 9SC | |
| Média NVIDIA GeForce RTX 2060 Mobile (1107 - 14726, n=40) | |
| Alienware m15 P79F | |
| Alienware 17 R5 | |
| Lenovo Legion Y540-17IRH | |
| Razer Blade Pro 2017 | |
| Asus Strix GL703VM-DB74 | |
| 3DMark 11 Performance | 18741 pontos | |
| 3DMark Cloud Gate Standard Score | 37458 pontos | |
| 3DMark Fire Strike Score | 15132 pontos | |
| 3DMark Time Spy Score | 6608 pontos | |
Ajuda | ||
| Shadow of the Tomb Raider - 1920x1080 Highest Preset AA:T | |
| MSI GE75 9SG | |
| MSI RTX 2060 Gaming Z 6G | |
| Asus ASUS ROG Strix SCAR III G731GW-XB74 | |
| Alienware m15 P79F | |
| Razer Blade Pro 17 RTX 2060 | |
| Asus Zephyrus S GX701GX | |
| Média NVIDIA GeForce RTX 2060 Mobile (54 - 86, n=22) | |
| Asus ROG Strix G GL731GU-RB74 | |
| MSI GF75 Thin 9SC | |
| The Witcher 3 - 1920x1080 Ultra Graphics & Postprocessing (HBAO+) | |
| MSI GE75 9SG | |
| Razer Blade Pro 17 RTX 2080 Max-Q | |
| Asus Zephyrus S GX701GX | |
| MSI GS75 Stealth 9SG | |
| Schenker XMG Ultra 15 Turing | |
| MSI RTX 2060 Gaming Z 6G | |
| Razer Blade Pro 17 RTX 2060 | |
| Razer Blade Pro 2017 | |
| Alienware m15 P79F | |
| Asus ASUS ROG Strix SCAR III G731GW-XB74 | |
| Acer Predator Helios 500 PH517-51-93LS | |
| Média NVIDIA GeForce RTX 2060 Mobile (50.6 - 74, n=40) | |
| Alienware 17 R5 | |
| Lenovo Legion Y540-17IRH | |
| Asus ROG Strix G GL731GU-RB74 | |
| Asus Strix GL703VM-DB74 | |
| MSI GF75 Thin 9SC | |
| baixo | média | alto | ultra | |
|---|---|---|---|---|
| BioShock Infinite (2013) | 320.8 | 278 | 246.3 | 153.4 |
| The Witcher 3 (2015) | 279.4 | 196.4 | 118.5 | 65 |
| Shadow of the Tomb Raider (2018) | 130 | 97 | 92 | 81 |
| Razer Blade Pro 17 RTX 2060 GeForce RTX 2060 Mobile, i7-9750H, Samsung SSD PM981 MZVLB512HAJQ | Asus Zephyrus S GX701GX GeForce RTX 2080 Max-Q, i7-8750H, Samsung SSD PM981 MZVLB1T0HALR | MSI GS75 Stealth 9SG GeForce RTX 2080 Max-Q, i7-9750H, 2x Samsung SSD PM981 MZVLB1T0HALR (RAID 0) | Asus ASUS ROG Strix SCAR III G731GW-XB74 GeForce RTX 2070 Mobile, i7-9750H, Intel SSD 660p 1TB SSDPEKNW010T8 | Razer Blade Pro 2017 GeForce GTX 1080 Mobile, i7-7820HK, 2x Samsung SSD PM951 MZVLV256HCHP (RAID 0) | Razer Blade Pro 17 RTX 2080 Max-Q GeForce RTX 2080 Max-Q, i7-9750H, Samsung SSD PM981 MZVLB512HAJQ | Acer Predator Helios 500 PH517-51-93LS GeForce GTX 1070 Mobile, i9-8950HK, Liteon CA1-8D512 | |
|---|---|---|---|---|---|---|---|
| Noise | -6% | -9% | -6% | -9% | -2% | 6% | |
| desligado / ambiente * (dB) | 28.2 | 29 -3% | 30 -6% | 28.2 -0% | 30 -6% | 28.2 -0% | 29.4 -4% |
| Idle Minimum * (dB) | 28.2 | 29 -3% | 31 -10% | 28.2 -0% | 30 -6% | 28.2 -0% | 29.4 -4% |
| Idle Average * (dB) | 28.2 | 32 -13% | 32 -13% | 28.5 -1% | 31 -10% | 28.2 -0% | 29.4 -4% |
| Idle Maximum * (dB) | 28.2 | 33 -17% | 38 -35% | 30 -6% | 33 -17% | 30.8 -9% | 30.1 -7% |
| Load Average * (dB) | 43 | 47 -9% | 47 -9% | 51.5 -20% | 43 -0% | 42 2% | 36 16% |
| Witcher 3 ultra * (dB) | 48.4 | 49 -1% | 48 1% | 55.3 -14% | 55 -14% | 51 -5% | 37.6 22% |
| Load Maximum * (dB) | 53.4 | 51 4% | 49 8% | 55.3 -4% | 58 -9% | 53 1% | 42.2 21% |
* ... menor é melhor
Barulho
| Ocioso |
| 28.2 / 28.2 / 28.2 dB |
| Carga |
| 43 / 53.4 dB |
 | ||
30 dB silencioso 40 dB(A) audível 50 dB(A) ruidosamente alto |
||
min: | ||
(±) A temperatura máxima no lado superior é 40.6 °C / 105 F, em comparação com a média de 40.4 °C / 105 F , variando de 21.2 a 68.8 °C para a classe Gaming.
(-) A parte inferior aquece até um máximo de 45.4 °C / 114 F, em comparação com a média de 43.2 °C / 110 F
(+) Em uso inativo, a temperatura média para o lado superior é 28.6 °C / 83 F, em comparação com a média do dispositivo de 33.9 °C / ### class_avg_f### F.
(±) Jogando The Witcher 3, a temperatura média para o lado superior é 32.8 °C / 91 F, em comparação com a média do dispositivo de 33.9 °C / ## #class_avg_f### F.
(+) Os apoios para as mãos e o touchpad são mais frios que a temperatura da pele, com um máximo de 30 °C / 86 F e, portanto, são frios ao toque.
(±) A temperatura média da área do apoio para as mãos de dispositivos semelhantes foi 28.8 °C / 83.8 F (-1.2 °C / -2.2 F).
Razer Blade Pro 17 RTX 2060 análise de áudio
(+) | os alto-falantes podem tocar relativamente alto (###valor### dB)
Graves 100 - 315Hz
(±) | graves reduzidos - em média 9.6% menor que a mediana
(±) | a linearidade dos graves é média (14.4% delta para a frequência anterior)
Médios 400 - 2.000 Hz
(±) | médios mais altos - em média 6.7% maior que a mediana
(+) | médios são lineares (5.1% delta para frequência anterior)
Altos 2 - 16 kHz
(+) | agudos equilibrados - apenas 2.4% longe da mediana
(+) | os máximos são lineares (4.4% delta da frequência anterior)
Geral 100 - 16.000 Hz
(±) | a linearidade do som geral é média (18.1% diferença em relação à mediana)
Comparado com a mesma classe
» 57% de todos os dispositivos testados nesta classe foram melhores, 8% semelhantes, 35% piores
» O melhor teve um delta de 6%, a média foi 18%, o pior foi 132%
Comparado com todos os dispositivos testados
» 38% de todos os dispositivos testados foram melhores, 8% semelhantes, 54% piores
» O melhor teve um delta de 4%, a média foi 24%, o pior foi 134%
Apple MacBook 12 (Early 2016) 1.1 GHz análise de áudio
(+) | os alto-falantes podem tocar relativamente alto (###valor### dB)
Graves 100 - 315Hz
(±) | graves reduzidos - em média 11.3% menor que a mediana
(±) | a linearidade dos graves é média (14.2% delta para a frequência anterior)
Médios 400 - 2.000 Hz
(+) | médios equilibrados - apenas 2.4% longe da mediana
(+) | médios são lineares (5.5% delta para frequência anterior)
Altos 2 - 16 kHz
(+) | agudos equilibrados - apenas 2% longe da mediana
(+) | os máximos são lineares (4.5% delta da frequência anterior)
Geral 100 - 16.000 Hz
(+) | o som geral é linear (10.2% diferença em relação à mediana)
Comparado com a mesma classe
» 7% de todos os dispositivos testados nesta classe foram melhores, 2% semelhantes, 91% piores
» O melhor teve um delta de 5%, a média foi 18%, o pior foi 53%
Comparado com todos os dispositivos testados
» 5% de todos os dispositivos testados foram melhores, 1% semelhantes, 94% piores
» O melhor teve um delta de 4%, a média foi 24%, o pior foi 134%
| desligado | |
| Ocioso | |
| Carga |
|
Key:
min: | |
| Razer Blade Pro 17 RTX 2060 i7-9750H, GeForce RTX 2060 Mobile, Samsung SSD PM981 MZVLB512HAJQ, IPS, 1920x1080, 17.3" | Razer Blade Pro 17 RTX 2080 Max-Q i7-9750H, GeForce RTX 2080 Max-Q, Samsung SSD PM981 MZVLB512HAJQ, IPS, 1920x1080, 17.3" | Asus ASUS ROG Strix SCAR III G731GW-XB74 i7-9750H, GeForce RTX 2070 Mobile, Intel SSD 660p 1TB SSDPEKNW010T8, IPS, 1920x1080, 17.3" | Razer Blade Pro 2017 i7-7820HK, GeForce GTX 1080 Mobile, 2x Samsung SSD PM951 MZVLV256HCHP (RAID 0), IGZO, 3840x2160, 17.3" | Acer Predator Helios 500 PH517-51-93LS i9-8950HK, GeForce GTX 1070 Mobile, Liteon CA1-8D512, IPS LED, 3840x2160, 17.3" | Asus GL704GM-DH74 i7-8750H, GeForce GTX 1060 Mobile, WDC PC SN520 SDAPNUW-256G, IPS, 1920x1080, 17.3" | |
|---|---|---|---|---|---|---|
| Power Consumption | 1% | -16% | -46% | -31% | 8% | |
| Idle Minimum * (Watt) | 16 | 16.2 -1% | 18.2 -14% | 31 -94% | 24.6 -54% | 15.2 5% |
| Idle Average * (Watt) | 21.7 | 20.4 6% | 23 -6% | 36 -66% | 33.1 -53% | 20.4 6% |
| Idle Maximum * (Watt) | 26.1 | 26.1 -0% | 33.1 -27% | 44 -69% | 37.2 -43% | 27.3 -5% |
| Load Average * (Watt) | 105.6 | 96.5 9% | 124.8 -18% | 107 -1% | 124 -17% | 92.9 12% |
| Witcher 3 ultra * (Watt) | 161.8 | 182.9 -13% | 180.8 -12% | 212 -31% | 180 -11% | 143 12% |
| Load Maximum * (Watt) | 225.3 | 214.3 5% | 263 -17% | 258 -15% | 236.5 -5% | 190.6 15% |
* ... menor é melhor
| Razer Blade Pro 17 RTX 2060 i7-9750H, GeForce RTX 2060 Mobile, 70 Wh | Asus Zephyrus S GX701GX i7-8750H, GeForce RTX 2080 Max-Q, 76 Wh | MSI GS75 Stealth 9SG i7-9750H, GeForce RTX 2080 Max-Q, 80.25 Wh | Asus ASUS ROG Strix SCAR III G731GW-XB74 i7-9750H, GeForce RTX 2070 Mobile, 66 Wh | Razer Blade Pro 2017 i7-7820HK, GeForce GTX 1080 Mobile, 99 Wh | Acer Predator Helios 500 PH517-51-93LS i9-8950HK, GeForce GTX 1070 Mobile, 74 Wh | Razer Blade Pro 17 RTX 2080 Max-Q i7-9750H, GeForce RTX 2080 Max-Q, 70 Wh | |
|---|---|---|---|---|---|---|---|
| Duração da bateria | -16% | 33% | -13% | -27% | -36% | 4% | |
| WiFi v1.3 (h) | 4.5 | 3.8 -16% | 6 33% | 3.9 -13% | 3.3 -27% | 2.9 -36% | 4.7 4% |
| Reader / Idle (h) | 5 | 7.7 | 4.2 | 4.2 | 4.9 | ||
| Load (h) | 0.9 | 1.2 | 1.4 | 1.4 | 1.4 |
Pro
Contra
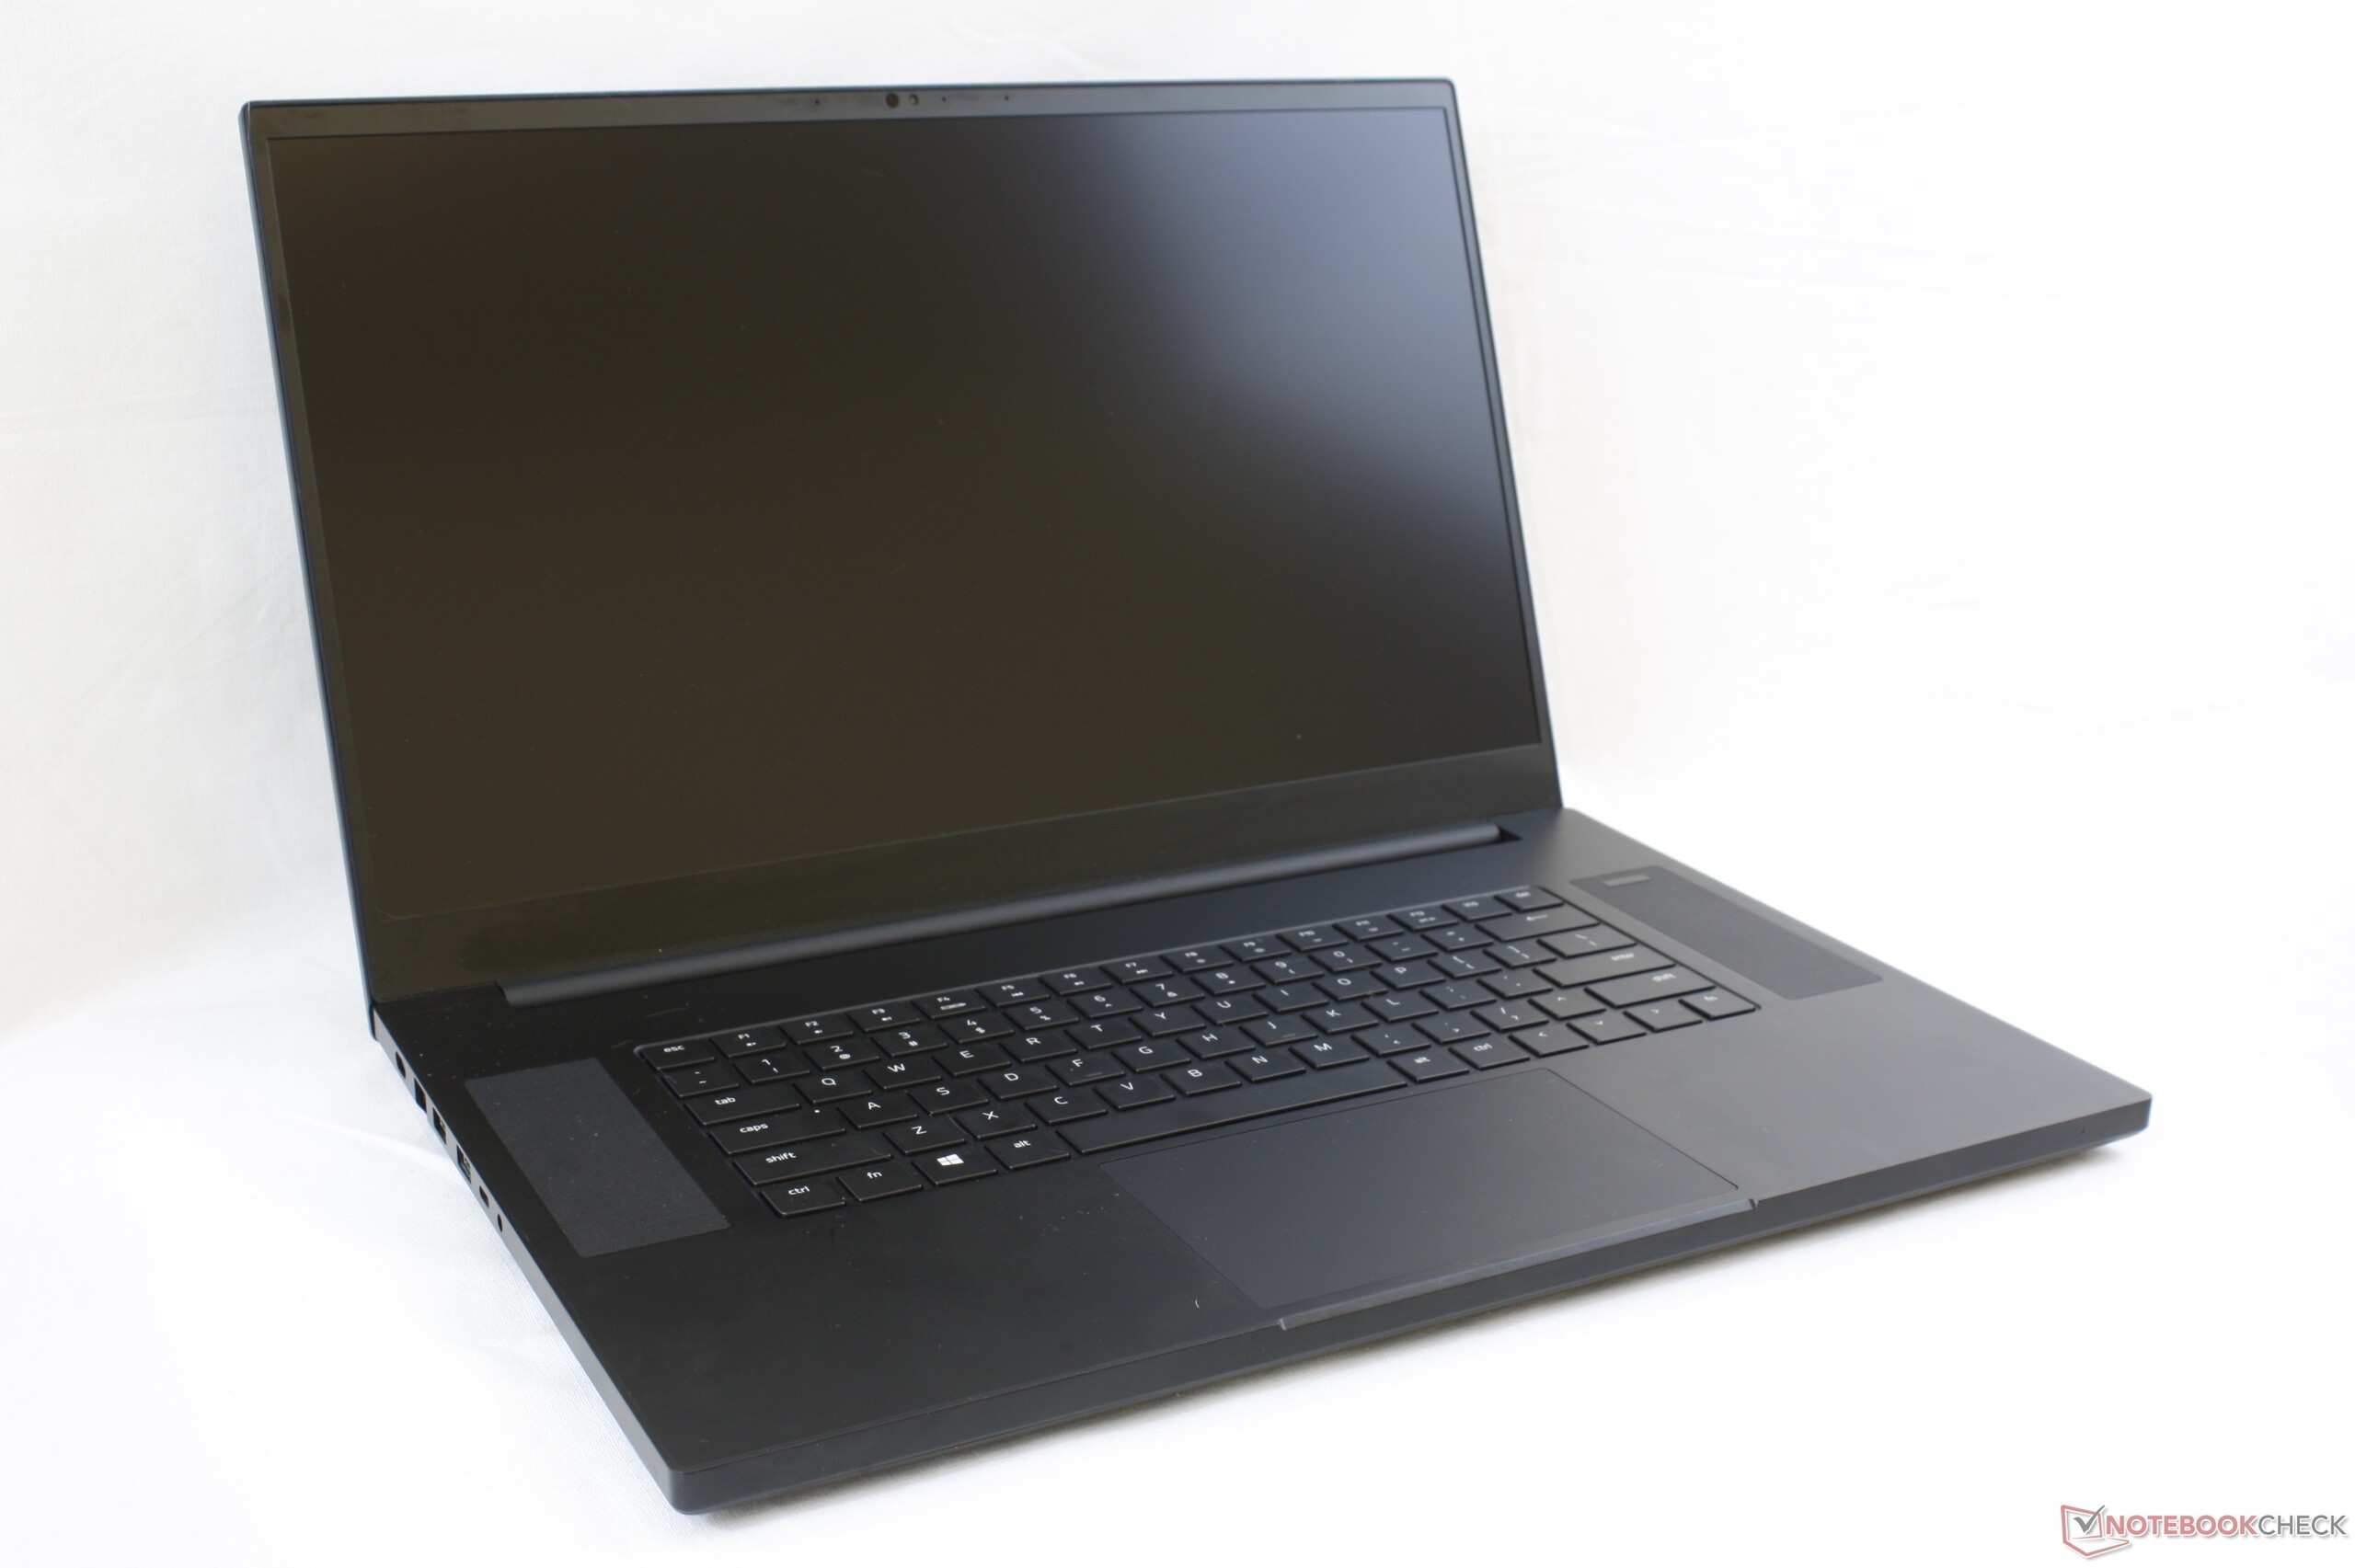
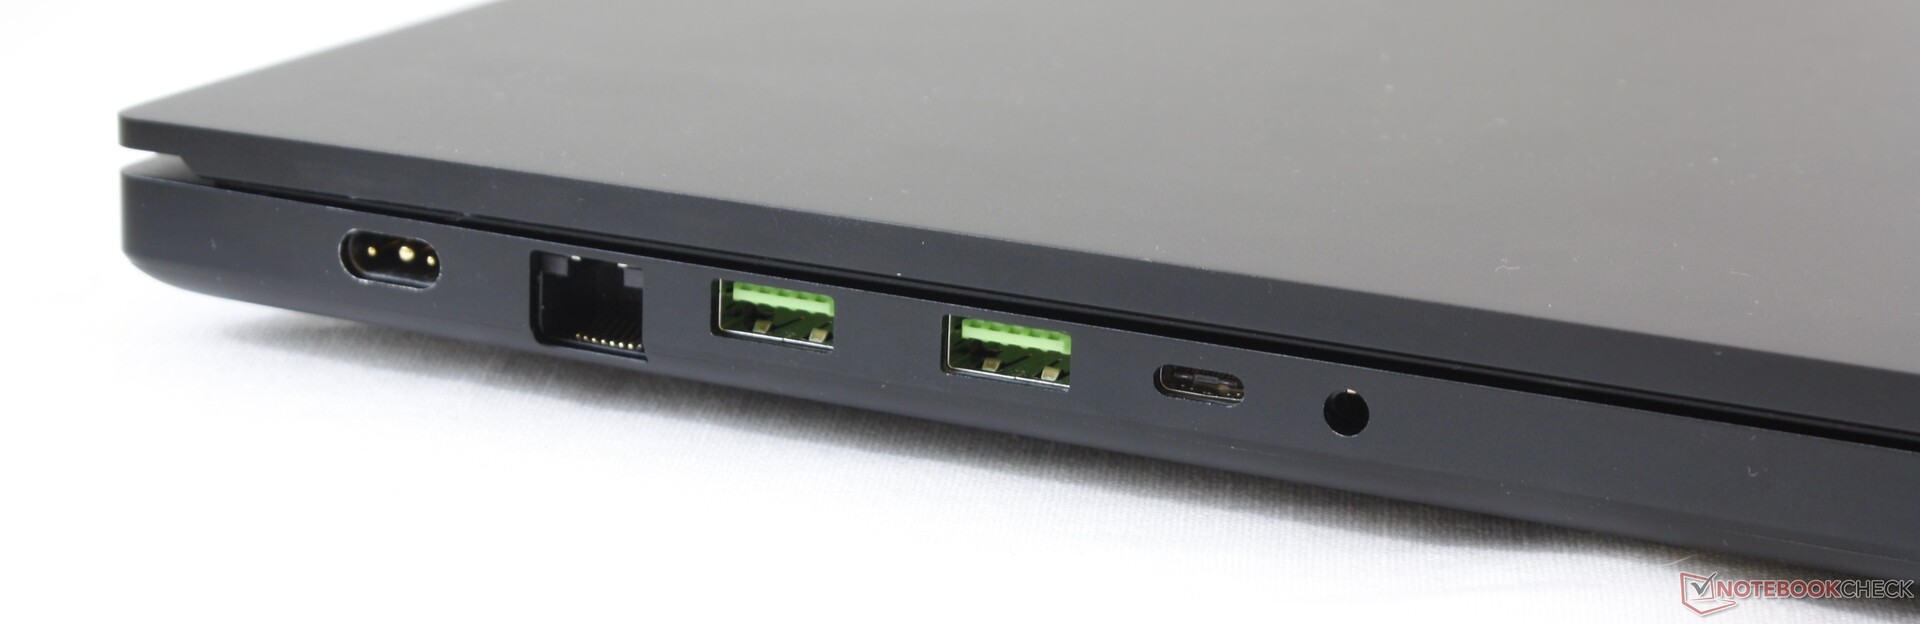
Por $2.500 USD, o Razer Blade Pro 17 RTX 2060 é mais caro que a maioria das alternativas, como o Asus ROG Scar II GL704GV, Zephyrus S GX701GV, ou MSI GS75 todos configuráveis com a mesma GPU. O preço alto vai em direção não apenas ao design minimalista e mais forte do chassi da Razer, mas também ao resfriado da câmara de vapor, leitor de cartões UHS-III, RJ-45 de 2.5 Gbit e conectividade Wi-Fi 6, que são raros em portáteis concorrentes RTX 2060 Pinte o Cinza Blase Spade e todos provavelmente irão confundi-lo com o MacBook Pro por um bom motivo.
Uma vantagem pequena, mas notável, do Blade Pro 17 é que sua GPU RTX 2060 funciona em velocidades mais rápidas do que outros portáteis com a mesma GPU com desempenho um pouco mais rápido nos jogos. A diferença é grande o suficiente para que o desempenho dos jogos chegue perto da RTX 2070 Max-Q o que realmente torna o SKU Blade Pro 17 RTX 2070 Max-Q uma verdadeira barganha. Ao comparar o SKU RTX 2060 ao RTX 2080 Max-Q, este último oferece desempenho 35% mais rápido para um aumento de 13% no consumo de energia. Outros aspectos importantes, como a duração da bateria, o ruído do ventilador e as temperaturas, são quase os mesmos entre os vários SKUs do Blade Pro 17, apesar de suas diferenças no desempenho gráfico.
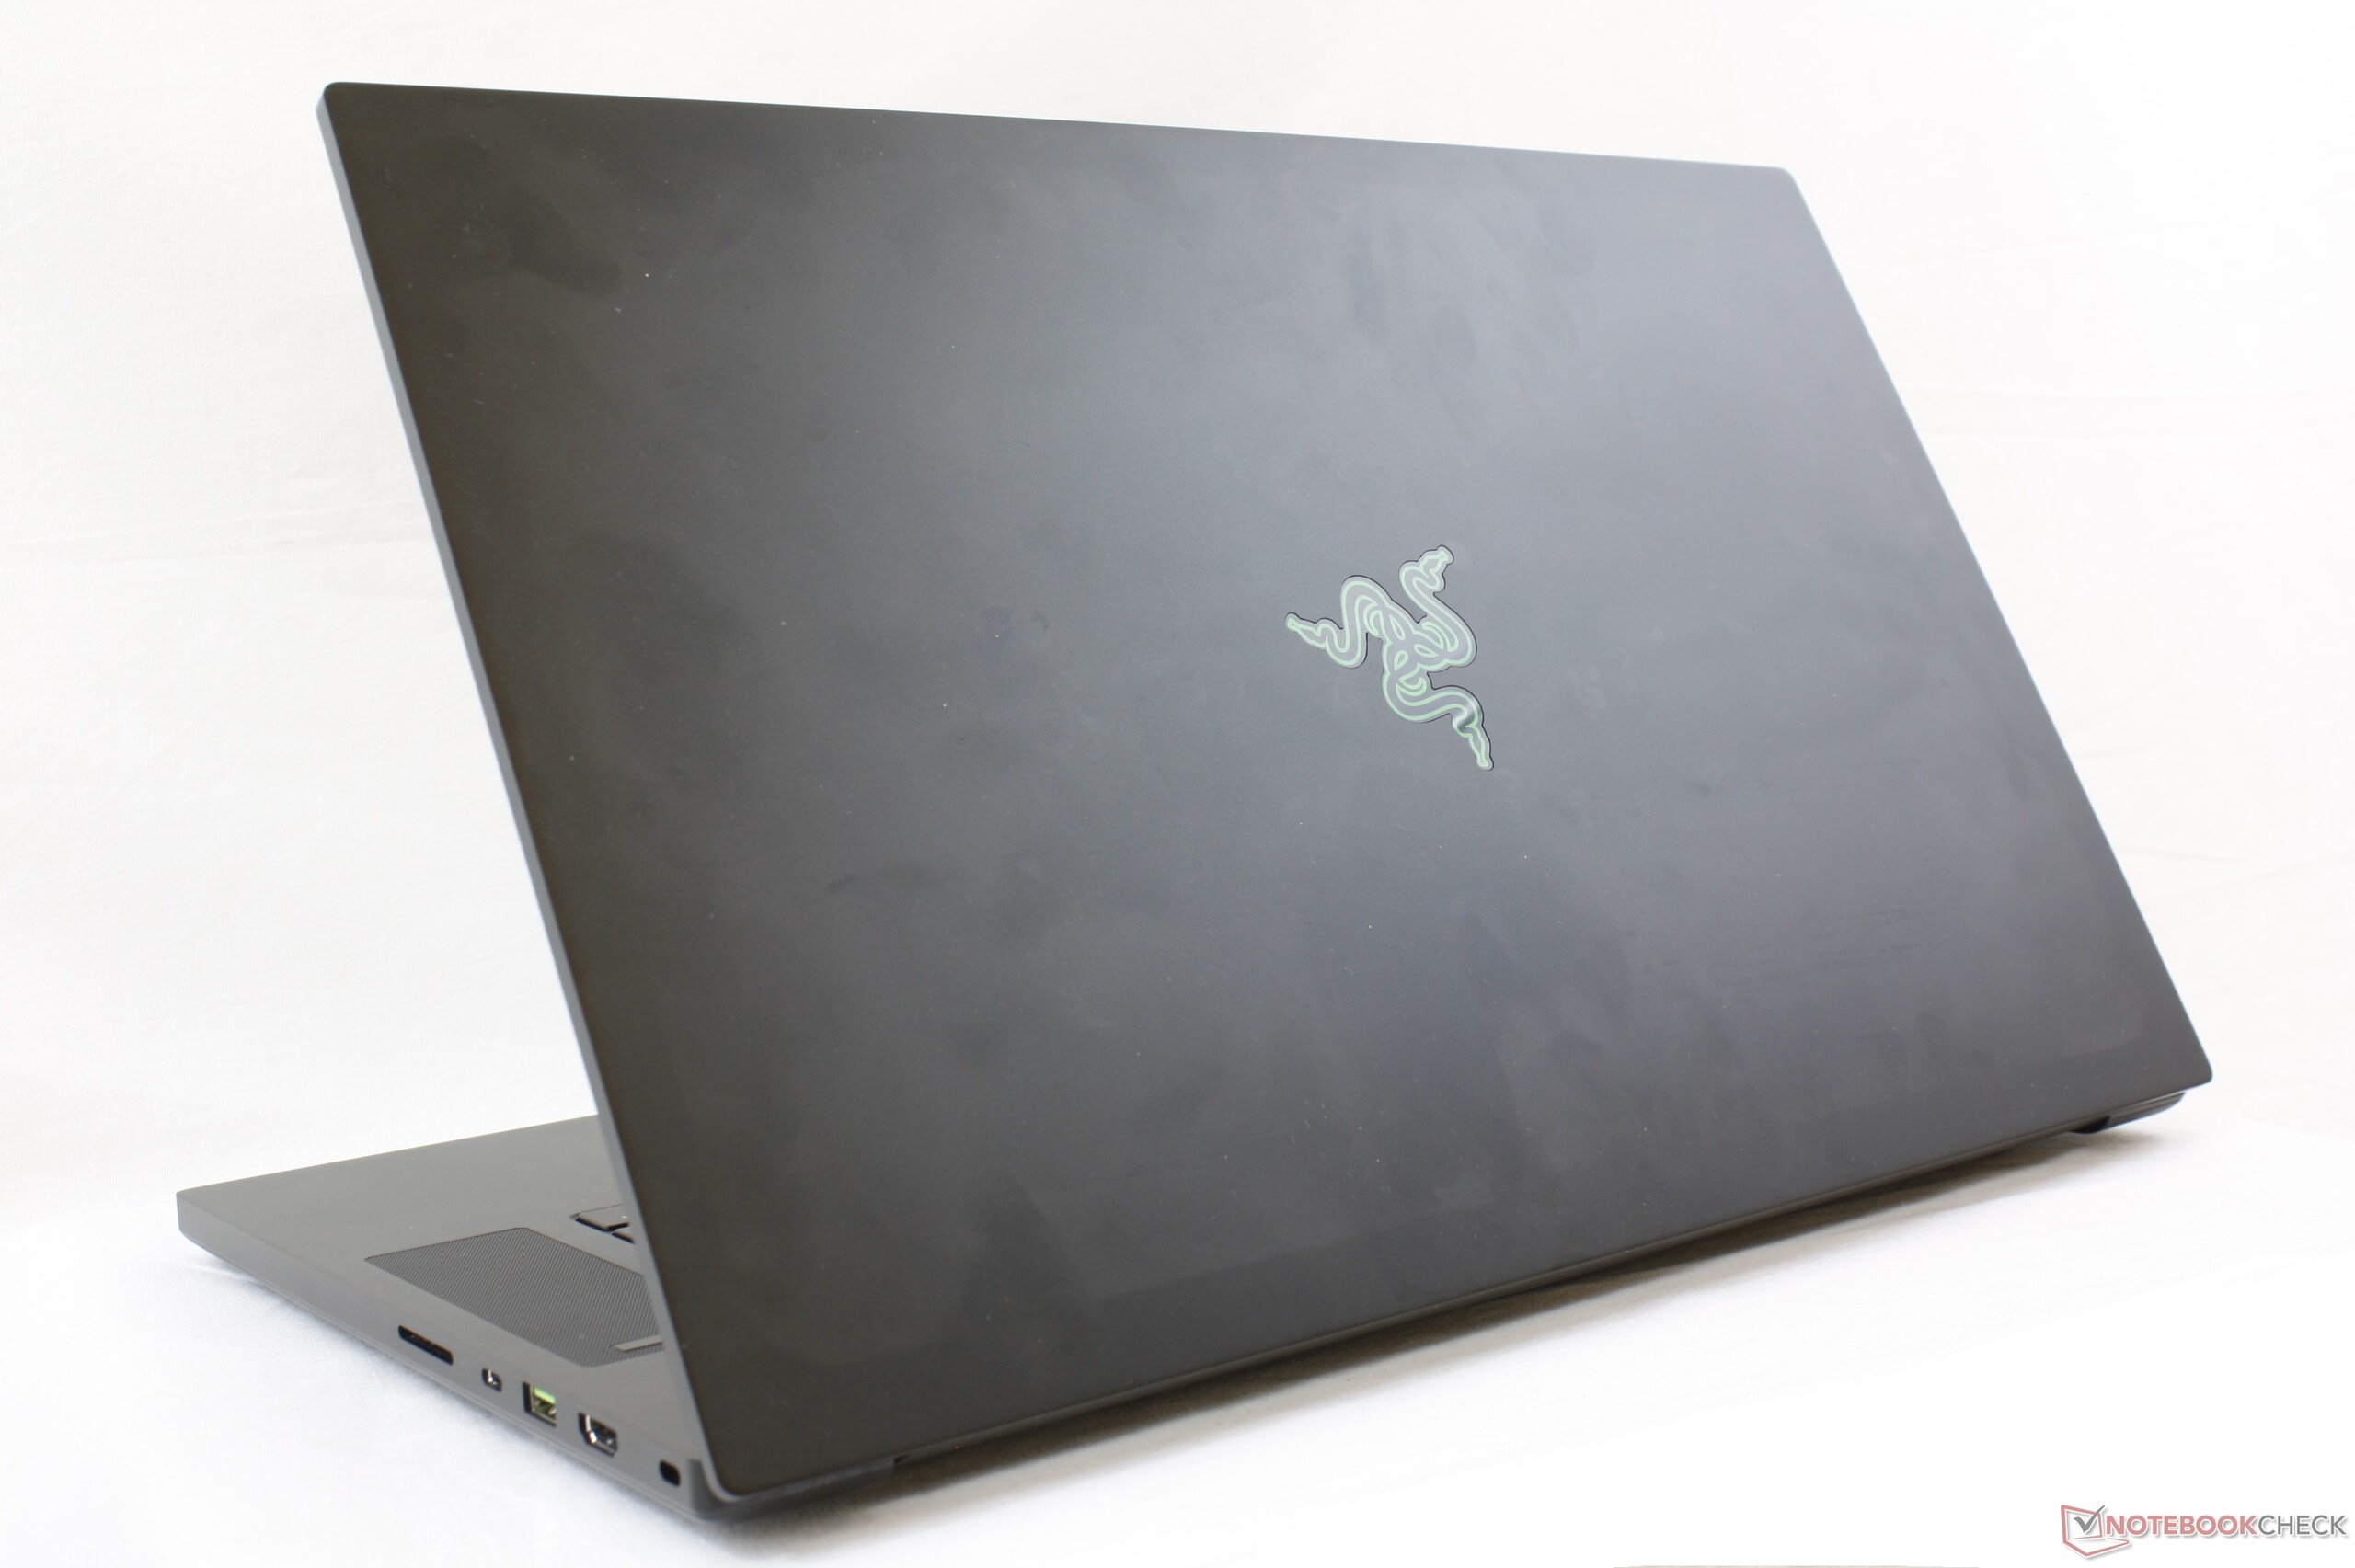
O Blade Pro 17 exibe a GeForce RTX 2060 em seu maior esplendor. Recursos auxiliares como os quatro ventiladores, resfriamento com câmara de vapor, leitor de cartões UHS-III, RJ-45 de 2.5 Gbit, e conectividade Wi-Fi 6 não podem ser encontrados em nenhum outro portátil de jogos com a mesma GPU RTX 2060.
Razer Blade Pro 17 RTX 2060
- 08/05/2019 v6 (old)
Allen Ngo
Price comparison
