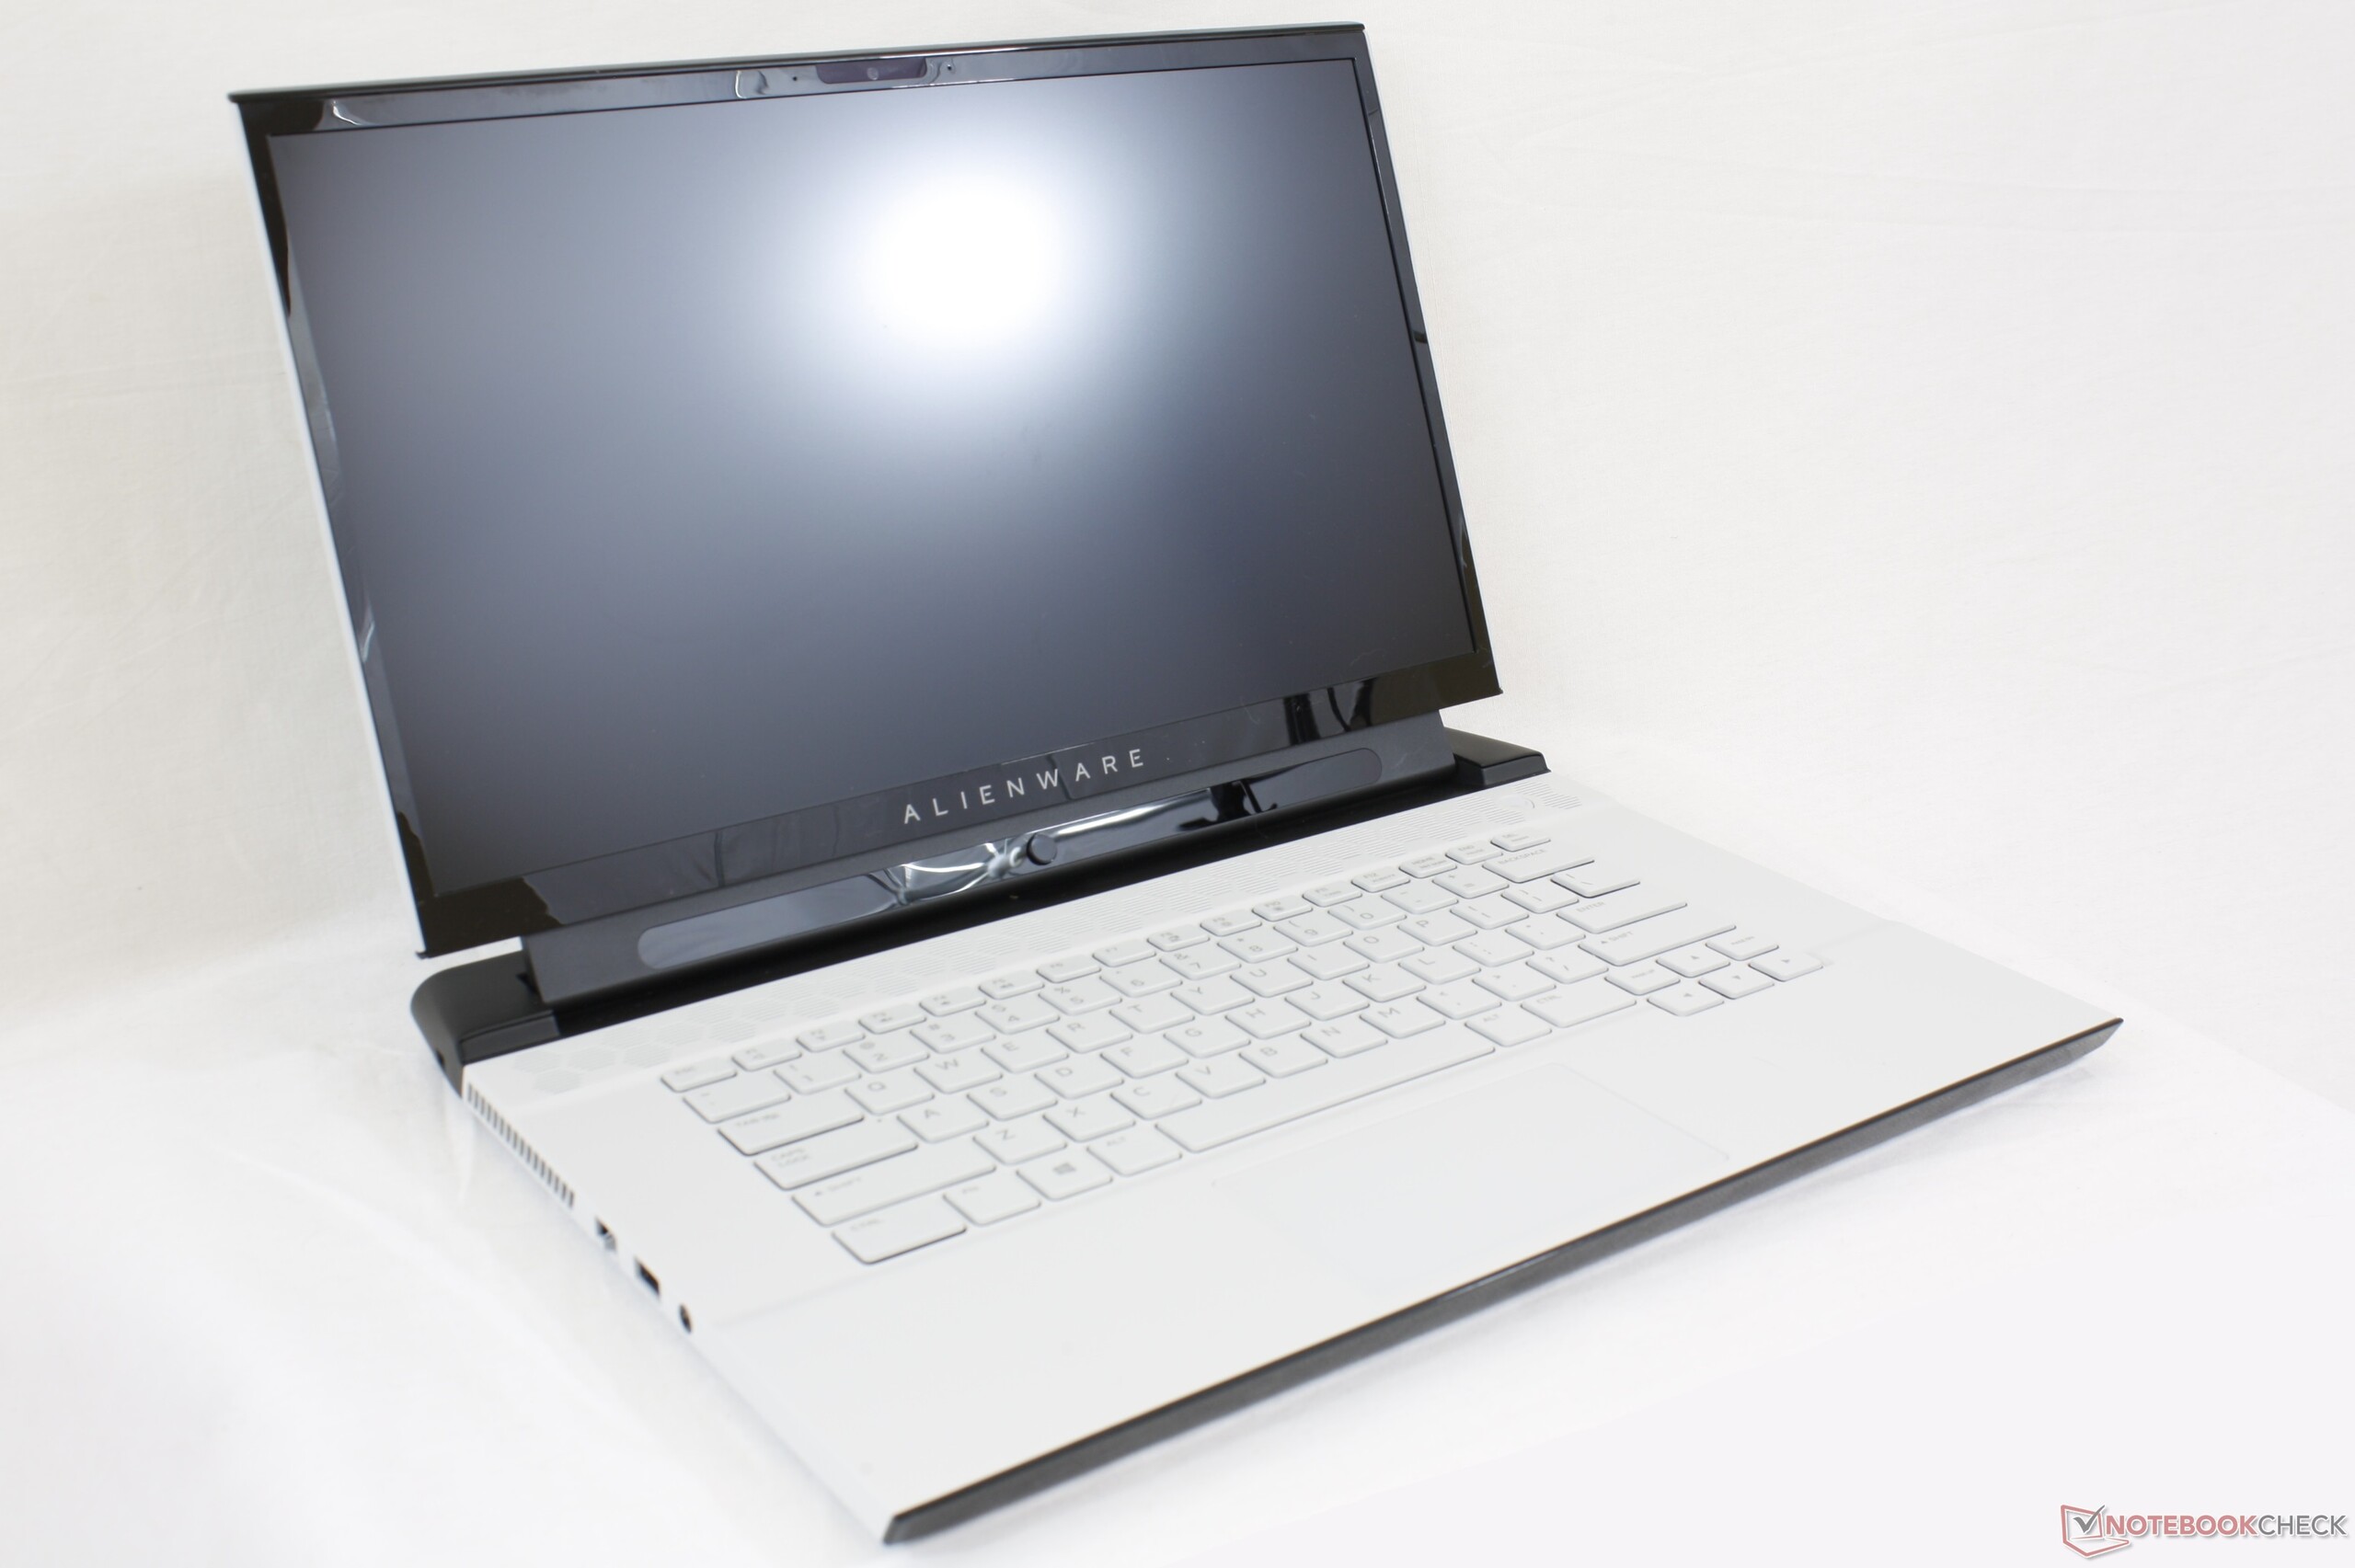
O mini-me do Area-51m: Breve Análise do Portátil Dell Alienware m15 R2
| |||||||||||||||||||||||||
iluminação: 90 %
iluminação com acumulador: 324.2 cd/m²
Contraste: 853:1 (Preto: 0.38 cd/m²)
ΔE ColorChecker Calman: 5.01 | ∀{0.5-29.43 Ø4.71}
calibrated: 1.64
ΔE Greyscale Calman: 7.9 | ∀{0.09-98 Ø4.96}
95.5% sRGB (Argyll 1.6.3 3D)
60.8% AdobeRGB 1998 (Argyll 1.6.3 3D)
65.9% AdobeRGB 1998 (Argyll 3D)
95.1% sRGB (Argyll 3D)
65.3% Display P3 (Argyll 3D)
Gamma: 2.35
CCT: 8455 K
| Alienware m15 R2 P87F Sharp LQ156M1, IPS, 15.6", 1920x1080 | Razer Blade 15 RTX 2080 Max-Q Sharp LQ156M1JW03 (SHP14C5), IPS, 15.6", 1920x1080 | Asus Zephyrus S GX531GX AU Optronics B156HAN08.2, IPS, 15.6", 1920x1080 | MSI GS65 Stealth 9SG Sharp LQ156M1JW03 (SHP14C5), IPS, 15.6", 1920x1080 | Lenovo Legion Y740-15ICHg LP156WFG-SPB2, IPS, 15.6", 1920x1080 | Alienware m15 GTX 1070 Max-Q AU Optronics B156HAN, IPS, 15.6", 1920x1080 | |
|---|---|---|---|---|---|---|
| Display | 3% | -0% | 4% | -3% | -4% | |
| Display P3 Coverage (%) | 65.3 | 66.9 2% | 65.6 0% | 67.6 4% | 63.5 -3% | 63.5 -3% |
| sRGB Coverage (%) | 95.1 | 98.1 3% | 92.2 -3% | 97.5 3% | 92.4 -3% | 89.4 -6% |
| AdobeRGB 1998 Coverage (%) | 65.9 | 68.5 4% | 66.9 2% | 68.9 5% | 64.7 -2% | 64.5 -2% |
| Response Times | 2% | 24% | -10% | -33% | -23% | |
| Response Time Grey 50% / Grey 80% * (ms) | 16.4 ? | 12.8 ? 22% | 7 ? 57% | 13.6 ? 17% | 18.8 ? -15% | 18 ? -10% |
| Response Time Black / White * (ms) | 8.8 ? | 10.4 ? -18% | 9.6 ? -9% | 12 ? -36% | 13.2 ? -50% | 12 ? -36% |
| PWM Frequency (Hz) | 23810 ? | 23810 ? | 23260 ? | |||
| Screen | 24% | 13% | 25% | 6% | 5% | |
| Brightness middle (cd/m²) | 324.2 | 293 -10% | 323.6 0% | 282.3 -13% | 320.4 -1% | 353.6 9% |
| Brightness (cd/m²) | 304 | 270 -11% | 315 4% | 269 -12% | 298 -2% | 346 14% |
| Brightness Distribution (%) | 90 | 87 -3% | 91 1% | 90 0% | 85 -6% | 86 -4% |
| Black Level * (cd/m²) | 0.38 | 0.29 24% | 0.29 24% | 0.32 16% | 0.42 -11% | 0.3 21% |
| Contrast (:1) | 853 | 1010 18% | 1116 31% | 882 3% | 763 -11% | 1179 38% |
| Colorchecker dE 2000 * | 5.01 | 1.69 66% | 3.31 34% | 1.17 77% | 3.21 36% | 4.55 9% |
| Colorchecker dE 2000 max. * | 12.7 | 3.37 73% | 5.74 55% | 3.29 74% | 5.54 56% | 7.91 38% |
| Colorchecker dE 2000 calibrated * | 1.64 | 1.24 24% | 2.73 -66% | 1.06 35% | 2.36 -44% | 3.37 -105% |
| Greyscale dE 2000 * | 7.9 | 2.3 71% | 2.9 63% | 1.3 84% | 3.6 54% | 4.1 48% |
| Gamma | 2.35 94% | 2.3 96% | 2.29 96% | 2.2 100% | 2.27 97% | 2.27 97% |
| CCT | 8455 77% | 6758 96% | 6765 96% | 6643 98% | 6503 100% | 7434 87% |
| Color Space (Percent of AdobeRGB 1998) (%) | 60.8 | 63 4% | 59.7 -2% | 63.8 5% | 59 -3% | 57.9 -5% |
| Color Space (Percent of sRGB) (%) | 95.5 | 98.5 3% | 91.8 -4% | 97.5 2% | 92 -4% | 88.9 -7% |
| Média Total (Programa/Configurações) | 10% /
17% | 12% /
12% | 6% /
17% | -10% /
-1% | -7% /
-0% |
* ... menor é melhor
Exibir tempos de resposta
| ↔ Tempo de resposta preto para branco | ||
|---|---|---|
| 8.8 ms ... ascensão ↗ e queda ↘ combinadas | ↗ 4.4 ms ascensão | 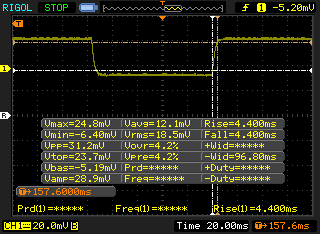 |
| ↘ 4.4 ms queda | ||
| A tela mostra taxas de resposta rápidas em nossos testes e deve ser adequada para jogos. Em comparação, todos os dispositivos testados variam de 0.1 (mínimo) a 240 (máximo) ms. » 25 % de todos os dispositivos são melhores. Isso significa que o tempo de resposta medido é melhor que a média de todos os dispositivos testados (19.8 ms). | ||
| ↔ Tempo de resposta 50% cinza a 80% cinza | ||
| 16.4 ms ... ascensão ↗ e queda ↘ combinadas | ↗ 7.6 ms ascensão | 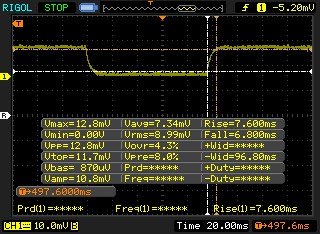 |
| ↘ 6.8 ms queda | ||
| A tela mostra boas taxas de resposta em nossos testes, mas pode ser muito lenta para jogadores competitivos. Em comparação, todos os dispositivos testados variam de 0.165 (mínimo) a 636 (máximo) ms. » 31 % de todos os dispositivos são melhores. Isso significa que o tempo de resposta medido é melhor que a média de todos os dispositivos testados (31 ms). | ||
Cintilação da tela / PWM (modulação por largura de pulso)
| Tela tremeluzindo/PWM detectado | 23810 Hz | ≤ 24 % configuração de brilho | 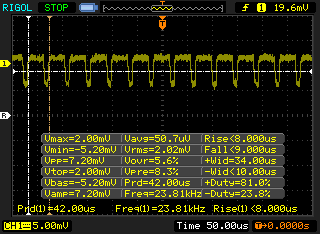 |
A luz de fundo da tela pisca em 23810 Hz (pior caso, por exemplo, utilizando PWM) Cintilação detectada em uma configuração de brilho de 24 % e abaixo. Não deve haver cintilação ou PWM acima desta configuração de brilho. A frequência de 23810 Hz é bastante alta, então a maioria dos usuários sensíveis ao PWM não deve notar nenhuma oscilação. [pwm_comparison] Em comparação: 52 % de todos os dispositivos testados não usam PWM para escurecer a tela. Se PWM foi detectado, uma média de 7757 (mínimo: 5 - máximo: 343500) Hz foi medida. | |||
| Cinebench R15 | |
| CPU Single 64Bit | |
| Alienware Area-51m i9-9900K RTX 2080 | |
| Eurocom Nightsky RX15 | |
| Alienware m17 P37E | |
| MSI GE75 9SG | |
| Média Intel Core i7-9750H (170 - 194, n=82) | |
| Alienware m15 R2 P87F | |
| MSI GF63 8RC-040XPL | |
| Lenovo Legion Y540-17IRH | |
| Alienware m15 P79F | |
| Asus VivoBook S15 S532F | |
| Asus FX503VM-EH73 | |
| Asus ROG Zephyrus G15 GA502DU | |
| CPU Multi 64Bit | |
| Alienware Area-51m i9-9900K RTX 2080 | |
| Eurocom Nightsky RX15 | |
| MSI GE75 9SG | |
| Alienware m17 P37E | |
| Alienware m15 P79F | |
| Média Intel Core i7-9750H (952 - 1306, n=85) | |
| Alienware m15 R2 P87F | |
| Lenovo Legion Y540-17IRH | |
| MSI GF63 8RC-040XPL | |
| Asus ROG Zephyrus G15 GA502DU | |
| Asus FX503VM-EH73 | |
| Asus VivoBook S15 S532F | |
| PCMark 8 Home Score Accelerated v2 | 4207 pontos | |
| PCMark 8 Work Score Accelerated v2 | 5706 pontos | |
| PCMark 10 Score | 5374 pontos | |
Ajuda | ||
| Alienware m15 R2 P87F 2x Toshiba XG6 KXG60ZNV512G (RAID 0) | Alienware m15 P79F Toshiba XG5 KXG50ZNV512G | Razer Blade 15 RTX 2080 Max-Q Samsung SSD PM981 MZVLB512HAJQ | Asus Zephyrus S GX531GX Intel SSD 660p SSDPEKNW512G8 | MSI GS65 Stealth 9SG Samsung SSD PM981 MZVLB512HAJQ | Dell Latitude 7400 2-in-1 Toshiba XG6 KXG60ZNV512G | |
|---|---|---|---|---|---|---|
| AS SSD | -12% | 12% | -26% | 20% | -49% | |
| Seq Read (MB/s) | 1925 | 1937 1% | 1832 -5% | 1239 -36% | 2005 4% | 2289 19% |
| Seq Write (MB/s) | 2371 | 1066 -55% | 1864 -21% | 920 -61% | 1580 -33% | 1163 -51% |
| 4K Read (MB/s) | 37.2 | 31.76 -15% | 52.1 40% | 45.74 23% | 49.33 33% | 22.29 -40% |
| 4K Write (MB/s) | 108.9 | 102.6 -6% | 108.3 -1% | 95.7 -12% | 103.8 -5% | 28.92 -73% |
| 4K-64 Read (MB/s) | 1177 | 1140 -3% | 1159 -2% | 322 -73% | 1241 5% | 415.6 -65% |
| 4K-64 Write (MB/s) | 1135 | 938 -17% | 1807 59% | 722 -36% | 1730 52% | 199.5 -82% |
| Access Time Read * (ms) | 0.065 | 0.058 11% | 0.05 23% | 0.073 -12% | 0.054 17% | 0.122 -88% |
| Access Time Write * (ms) | 0.108 | 0.04 63% | 0.034 69% | 0.047 56% | 0.036 67% | 0.143 -32% |
| Score Read (Points) | 1407 | 1366 -3% | 1394 -1% | 492 -65% | 1490 6% | 667 -53% |
| Score Write (Points) | 1481 | 1147 -23% | 2102 42% | 910 -39% | 1991 34% | 345 -77% |
| Score Total (Points) | 3633 | 3168 -13% | 4221 16% | 1654 -54% | 4230 16% | 1300 -64% |
| Copy ISO MB/s (MB/s) | 2073 | 946 -54% | 2083 0% | 1236 -40% | 3025 46% | 1767 -15% |
| Copy Program MB/s (MB/s) | 576 | 452.8 -21% | 496.5 -14% | 703 22% | 713 24% | 379.4 -34% |
| Copy Game MB/s (MB/s) | 1426 | 1013 -29% | 977 -31% | 812 -43% | 1554 9% | 1055 -26% |
* ... menor é melhor

| 3DMark 11 | |
| 1280x720 Performance GPU | |
| Asus ROG Strix RTX 2080 OC | |
| Alienware Area-51m i9-9900K RTX 2080 | |
| Alienware m15 R2 P87F | |
| Média NVIDIA GeForce RTX 2080 Max-Q (23386 - 30910, n=20) | |
| Eurocom Nightsky RX15 | |
| Alienware 15 R3 Max-Q | |
| Medion Erazer X15805 | |
| Asus Strix Hero III G731GV | |
| HP Omen 15-dc0015ng | |
| MSI GT72S-6QEG16SR421BW | |
| 1280x720 Performance Combined | |
| Alienware Area-51m i9-9900K RTX 2080 | |
| Eurocom Nightsky RX15 | |
| Asus ROG Strix RTX 2080 OC | |
| Medion Erazer X15805 | |
| Asus Strix Hero III G731GV | |
| HP Omen 15-dc0015ng | |
| Média NVIDIA GeForce RTX 2080 Max-Q (9212 - 14894, n=20) | |
| Alienware m15 R2 P87F | |
| Alienware 15 R3 Max-Q | |
| MSI GT72S-6QEG16SR421BW | |
| 3DMark 11 Performance | 19885 pontos | |
| 3DMark Cloud Gate Standard Score | 33900 pontos | |
| 3DMark Fire Strike Score | 17504 pontos | |
| 3DMark Time Spy Score | 7785 pontos | |
Ajuda | ||
| Shadow of the Tomb Raider | |
| 1920x1080 Highest Preset AA:T | |
| Alienware Area-51m i9-9900K RTX 2080 | |
| Asus ROG Strix RTX 2080 OC | |
| MSI GE75 9SG | |
| Eurocom Nightsky RX15 | |
| Origin PC EVO16-S i7-9750H RTX 2080 Max-Q | |
| Alienware m15 R2 P87F | |
| Média NVIDIA GeForce RTX 2080 Max-Q (71 - 105, n=8) | |
| Alienware m15 P79F | |
| Asus Strix Hero III G731GV | |
| HP Omen 15-dc0015ng | |
| Asus ROG Zephyrus G15 GA502DU | |
| 1280x720 Lowest Preset | |
| Alienware Area-51m i9-9900K RTX 2080 | |
| Eurocom Nightsky RX15 | |
| MSI GE75 9SG | |
| Asus ROG Strix RTX 2080 OC | |
| Origin PC EVO16-S i7-9750H RTX 2080 Max-Q | |
| Média NVIDIA GeForce RTX 2080 Max-Q (114 - 142, n=5) | |
| HP Omen 15-dc0015ng | |
| Alienware m15 P79F | |
| Asus Strix Hero III G731GV | |
| Alienware m15 R2 P87F | |
| Asus ROG Zephyrus G15 GA502DU | |
| Asus VivoBook S15 S532F | |
| The Witcher 3 - 1920x1080 Ultra Graphics & Postprocessing (HBAO+) | |
| Asus ROG Strix RTX 2080 OC | |
| Alienware Area-51m i9-9900K RTX 2080 | |
| MSI GE75 9SG | |
| Alienware m15 R2 P87F | |
| Eurocom Nightsky RX15 | |
| Asus Zephyrus S GX531GX | |
| Média NVIDIA GeForce RTX 2080 Max-Q (65.7 - 92.7, n=22) | |
| Razer Blade 15 RTX 2080 Max-Q | |
| Origin PC EVO16-S i7-9750H RTX 2080 Max-Q | |
| Alienware m17 P37E | |
| Alienware m15 P79F | |
| Alienware 15 R3 Max-Q | |
| Medion Erazer X15805 | |
| Lenovo Legion Y740-15ICHg | |
| Asus Strix Hero III G731GV | |
| HP Omen 15-dc0015ng | |
| Lenovo Legion Y540-17IRH | |
| Alienware m15 GTX 1070 Max-Q | |
| Asus ROG Zephyrus G15 GA502DU | |
| Asus FX503VM-EH73 | |
| MSI GF63 8RC-040XPL | |
| Asus VivoBook S15 S532F | |
| baixo | média | alto | ultra | |
|---|---|---|---|---|
| BioShock Infinite (2013) | 314.6 | 273.1 | 251.7 | 166.5 |
| The Witcher 3 (2015) | 274.5 | 215.4 | 144.5 | 81.3 |
| Rocket League (2017) | 248.7 | 239.3 | 218.5 | |
| Shadow of the Tomb Raider (2018) | 114 | 91 | 89 | 87 |
| Alienware m15 R2 P87F GeForce RTX 2080 Max-Q, i7-9750H, 2x Toshiba XG6 KXG60ZNV512G (RAID 0) | Alienware m15 P79F GeForce RTX 2070 Max-Q, i7-8750H, Toshiba XG5 KXG50ZNV512G | Razer Blade 15 RTX 2080 Max-Q GeForce RTX 2080 Max-Q, i7-9750H, Samsung SSD PM981 MZVLB512HAJQ | Asus Zephyrus S GX531GX GeForce RTX 2080 Max-Q, i7-8750H, Intel SSD 660p SSDPEKNW512G8 | MSI GS65 Stealth 9SG GeForce RTX 2080 Max-Q, i7-9750H, Samsung SSD PM981 MZVLB512HAJQ | Lenovo Legion Y740-15ICHg GeForce RTX 2070 Max-Q, i7-8750H, Samsung SSD PM981 MZVLB256HAHQ | |
|---|---|---|---|---|---|---|
| Noise | -4% | 14% | 1% | 8% | 10% | |
| desligado / ambiente * (dB) | 28.3 | 28.2 -0% | 28.3 -0% | 28.7 -1% | 28.3 -0% | 28 1% |
| Idle Minimum * (dB) | 28.5 | 30.3 -6% | 28.8 -1% | 29.8 -5% | 30.4 -7% | 32.6 -14% |
| Idle Average * (dB) | 28.5 | 35.4 -24% | 28.8 -1% | 32.4 -14% | 30.5 -7% | 32.7 -15% |
| Idle Maximum * (dB) | 49 | 50.3 -3% | 29 41% | 38 22% | 30.6 38% | 32.7 33% |
| Load Average * (dB) | 49 | 50.3 -3% | 33.5 32% | 38.2 22% | 37.6 23% | 33.3 32% |
| Witcher 3 ultra * (dB) | 49 | 50.2 -2% | 45 8% | 56.6 -16% | 46 6% | 41.6 15% |
| Load Maximum * (dB) | 55 | 50.2 9% | 45.2 18% | 56.6 -3% | 55.1 -0% | 45.2 18% |
* ... menor é melhor
Barulho
| Ocioso |
| 28.5 / 28.5 / 49 dB |
| Carga |
| 49 / 55 dB |
 | ||
30 dB silencioso 40 dB(A) audível 50 dB(A) ruidosamente alto |
||
min: | ||
(-) A temperatura máxima no lado superior é 53.8 °C / 129 F, em comparação com a média de 40.4 °C / 105 F , variando de 21.2 a 68.8 °C para a classe Gaming.
(-) A parte inferior aquece até um máximo de 58 °C / 136 F, em comparação com a média de 43.2 °C / 110 F
(+) Em uso inativo, a temperatura média para o lado superior é 28 °C / 82 F, em comparação com a média do dispositivo de 33.9 °C / ### class_avg_f### F.
(±) Jogando The Witcher 3, a temperatura média para o lado superior é 36.3 °C / 97 F, em comparação com a média do dispositivo de 33.9 °C / ## #class_avg_f### F.
(+) Os apoios para as mãos e o touchpad estão atingindo a temperatura máxima da pele (32.2 °C / 90 F) e, portanto, não estão quentes.
(-) A temperatura média da área do apoio para as mãos de dispositivos semelhantes foi 28.8 °C / 83.8 F (-3.4 °C / -6.2 F).
Alienware m15 R2 P87F análise de áudio
(+) | os alto-falantes podem tocar relativamente alto (###valor### dB)
Graves 100 - 315Hz
(-) | quase nenhum baixo - em média 18.8% menor que a mediana
(±) | a linearidade dos graves é média (11.9% delta para a frequência anterior)
Médios 400 - 2.000 Hz
(+) | médios equilibrados - apenas 4.8% longe da mediana
(+) | médios são lineares (6.6% delta para frequência anterior)
Altos 2 - 16 kHz
(+) | agudos equilibrados - apenas 1.3% longe da mediana
(±) | a linearidade dos máximos é média (7.4% delta para frequência anterior)
Geral 100 - 16.000 Hz
(±) | a linearidade do som geral é média (19.8% diferença em relação à mediana)
Comparado com a mesma classe
» 70% de todos os dispositivos testados nesta classe foram melhores, 6% semelhantes, 24% piores
» O melhor teve um delta de 6%, a média foi 18%, o pior foi 132%
Comparado com todos os dispositivos testados
» 51% de todos os dispositivos testados foram melhores, 7% semelhantes, 42% piores
» O melhor teve um delta de 4%, a média foi 23%, o pior foi 134%
Apple MacBook 12 (Early 2016) 1.1 GHz análise de áudio
(+) | os alto-falantes podem tocar relativamente alto (###valor### dB)
Graves 100 - 315Hz
(±) | graves reduzidos - em média 11.3% menor que a mediana
(±) | a linearidade dos graves é média (14.2% delta para a frequência anterior)
Médios 400 - 2.000 Hz
(+) | médios equilibrados - apenas 2.4% longe da mediana
(+) | médios são lineares (5.5% delta para frequência anterior)
Altos 2 - 16 kHz
(+) | agudos equilibrados - apenas 2% longe da mediana
(+) | os máximos são lineares (4.5% delta da frequência anterior)
Geral 100 - 16.000 Hz
(+) | o som geral é linear (10.2% diferença em relação à mediana)
Comparado com a mesma classe
» 7% de todos os dispositivos testados nesta classe foram melhores, 2% semelhantes, 90% piores
» O melhor teve um delta de 5%, a média foi 18%, o pior foi 53%
Comparado com todos os dispositivos testados
» 5% de todos os dispositivos testados foram melhores, 1% semelhantes, 94% piores
» O melhor teve um delta de 4%, a média foi 23%, o pior foi 134%
| desligado | |
| Ocioso | |
| Carga |
|
Key:
min: | |
| Alienware m15 R2 P87F i7-9750H, GeForce RTX 2080 Max-Q, 2x Toshiba XG6 KXG60ZNV512G (RAID 0), IPS, 1920x1080, 15.6" | Alienware m15 P79F i7-8750H, GeForce RTX 2070 Max-Q, Toshiba XG5 KXG50ZNV512G, OLED, 3840x2160, 15.6" | Razer Blade 15 RTX 2080 Max-Q i7-9750H, GeForce RTX 2080 Max-Q, Samsung SSD PM981 MZVLB512HAJQ, IPS, 1920x1080, 15.6" | Lenovo Legion Y740-15ICHg i7-8750H, GeForce RTX 2070 Max-Q, Samsung SSD PM981 MZVLB256HAHQ, IPS, 1920x1080, 15.6" | MSI GP65 Leopard 9SE-225US i7-9750H, GeForce RTX 2060 Mobile, Toshiba KBG30ZMT512G, IPS, 1920x1080, 15.6" | Alienware 15 R3 Max-Q i7-7820HK, GeForce GTX 1080 Max-Q, LiteOn CX2-8B256, IPS, 1920x1080, 15.6" | |
|---|---|---|---|---|---|---|
| Power Consumption | 35% | 34% | 24% | 31% | 18% | |
| Idle Minimum * (Watt) | 19 | 10.9 43% | 12.5 34% | 22.9 -21% | 13.6 28% | 22 -16% |
| Idle Average * (Watt) | 40.5 | 12.3 70% | 15.3 62% | 27.2 33% | 17.9 56% | 26 36% |
| Idle Maximum * (Watt) | 52 | 19 63% | 20.7 60% | 27.5 47% | 20.6 60% | 33 37% |
| Load Average * (Watt) | 132.3 | 96 27% | 90.2 32% | 83.4 37% | 96 27% | 86 35% |
| Witcher 3 ultra * (Watt) | 183.3 | 161.7 12% | 162 12% | 143.6 22% | 154.6 16% | 159 13% |
| Load Maximum * (Watt) | 217.2 | 229.1 -5% | 209.3 4% | 160.5 26% | 218.6 -1% | 215 1% |
* ... menor é melhor
| Alienware m15 R2 P87F i7-9750H, GeForce RTX 2080 Max-Q, 76 Wh | Alienware m15 P79F i7-8750H, GeForce RTX 2070 Max-Q, 90 Wh | Razer Blade 15 RTX 2080 Max-Q i7-9750H, GeForce RTX 2080 Max-Q, 80 Wh | Asus Zephyrus S GX531GX i7-8750H, GeForce RTX 2080 Max-Q, 50 Wh | MSI GS65 Stealth 9SG i7-9750H, GeForce RTX 2080 Max-Q, 82 Wh | Lenovo Legion Y740-15ICHg i7-8750H, GeForce RTX 2070 Max-Q, 57 Wh | |
|---|---|---|---|---|---|---|
| Duração da bateria | -5% | 79% | -45% | 9% | -31% | |
| Reader / Idle (h) | 9.2 | 15.9 73% | 3.9 -58% | |||
| WiFi v1.3 (h) | 5.5 | 5.2 -5% | 6.6 20% | 3 -45% | 6 9% | 2.8 -49% |
| Load (h) | 0.7 | 1.7 143% | 0.8 14% |
Pro
Contra
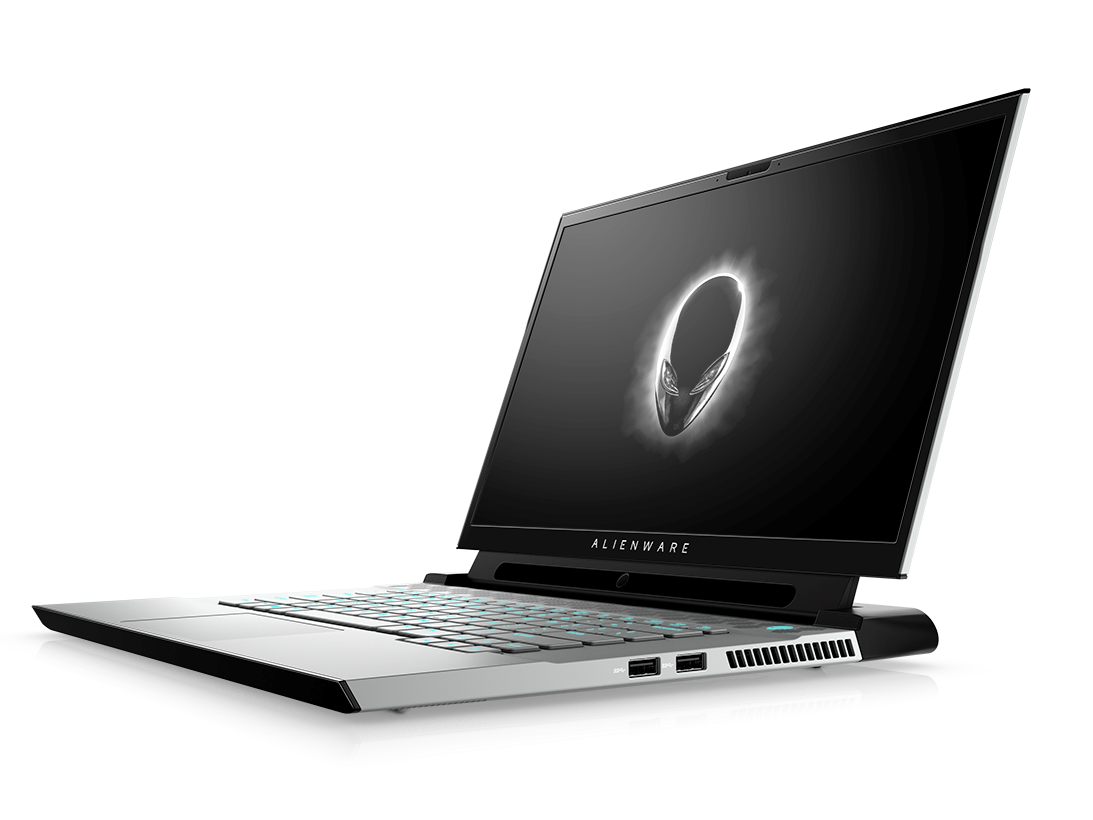
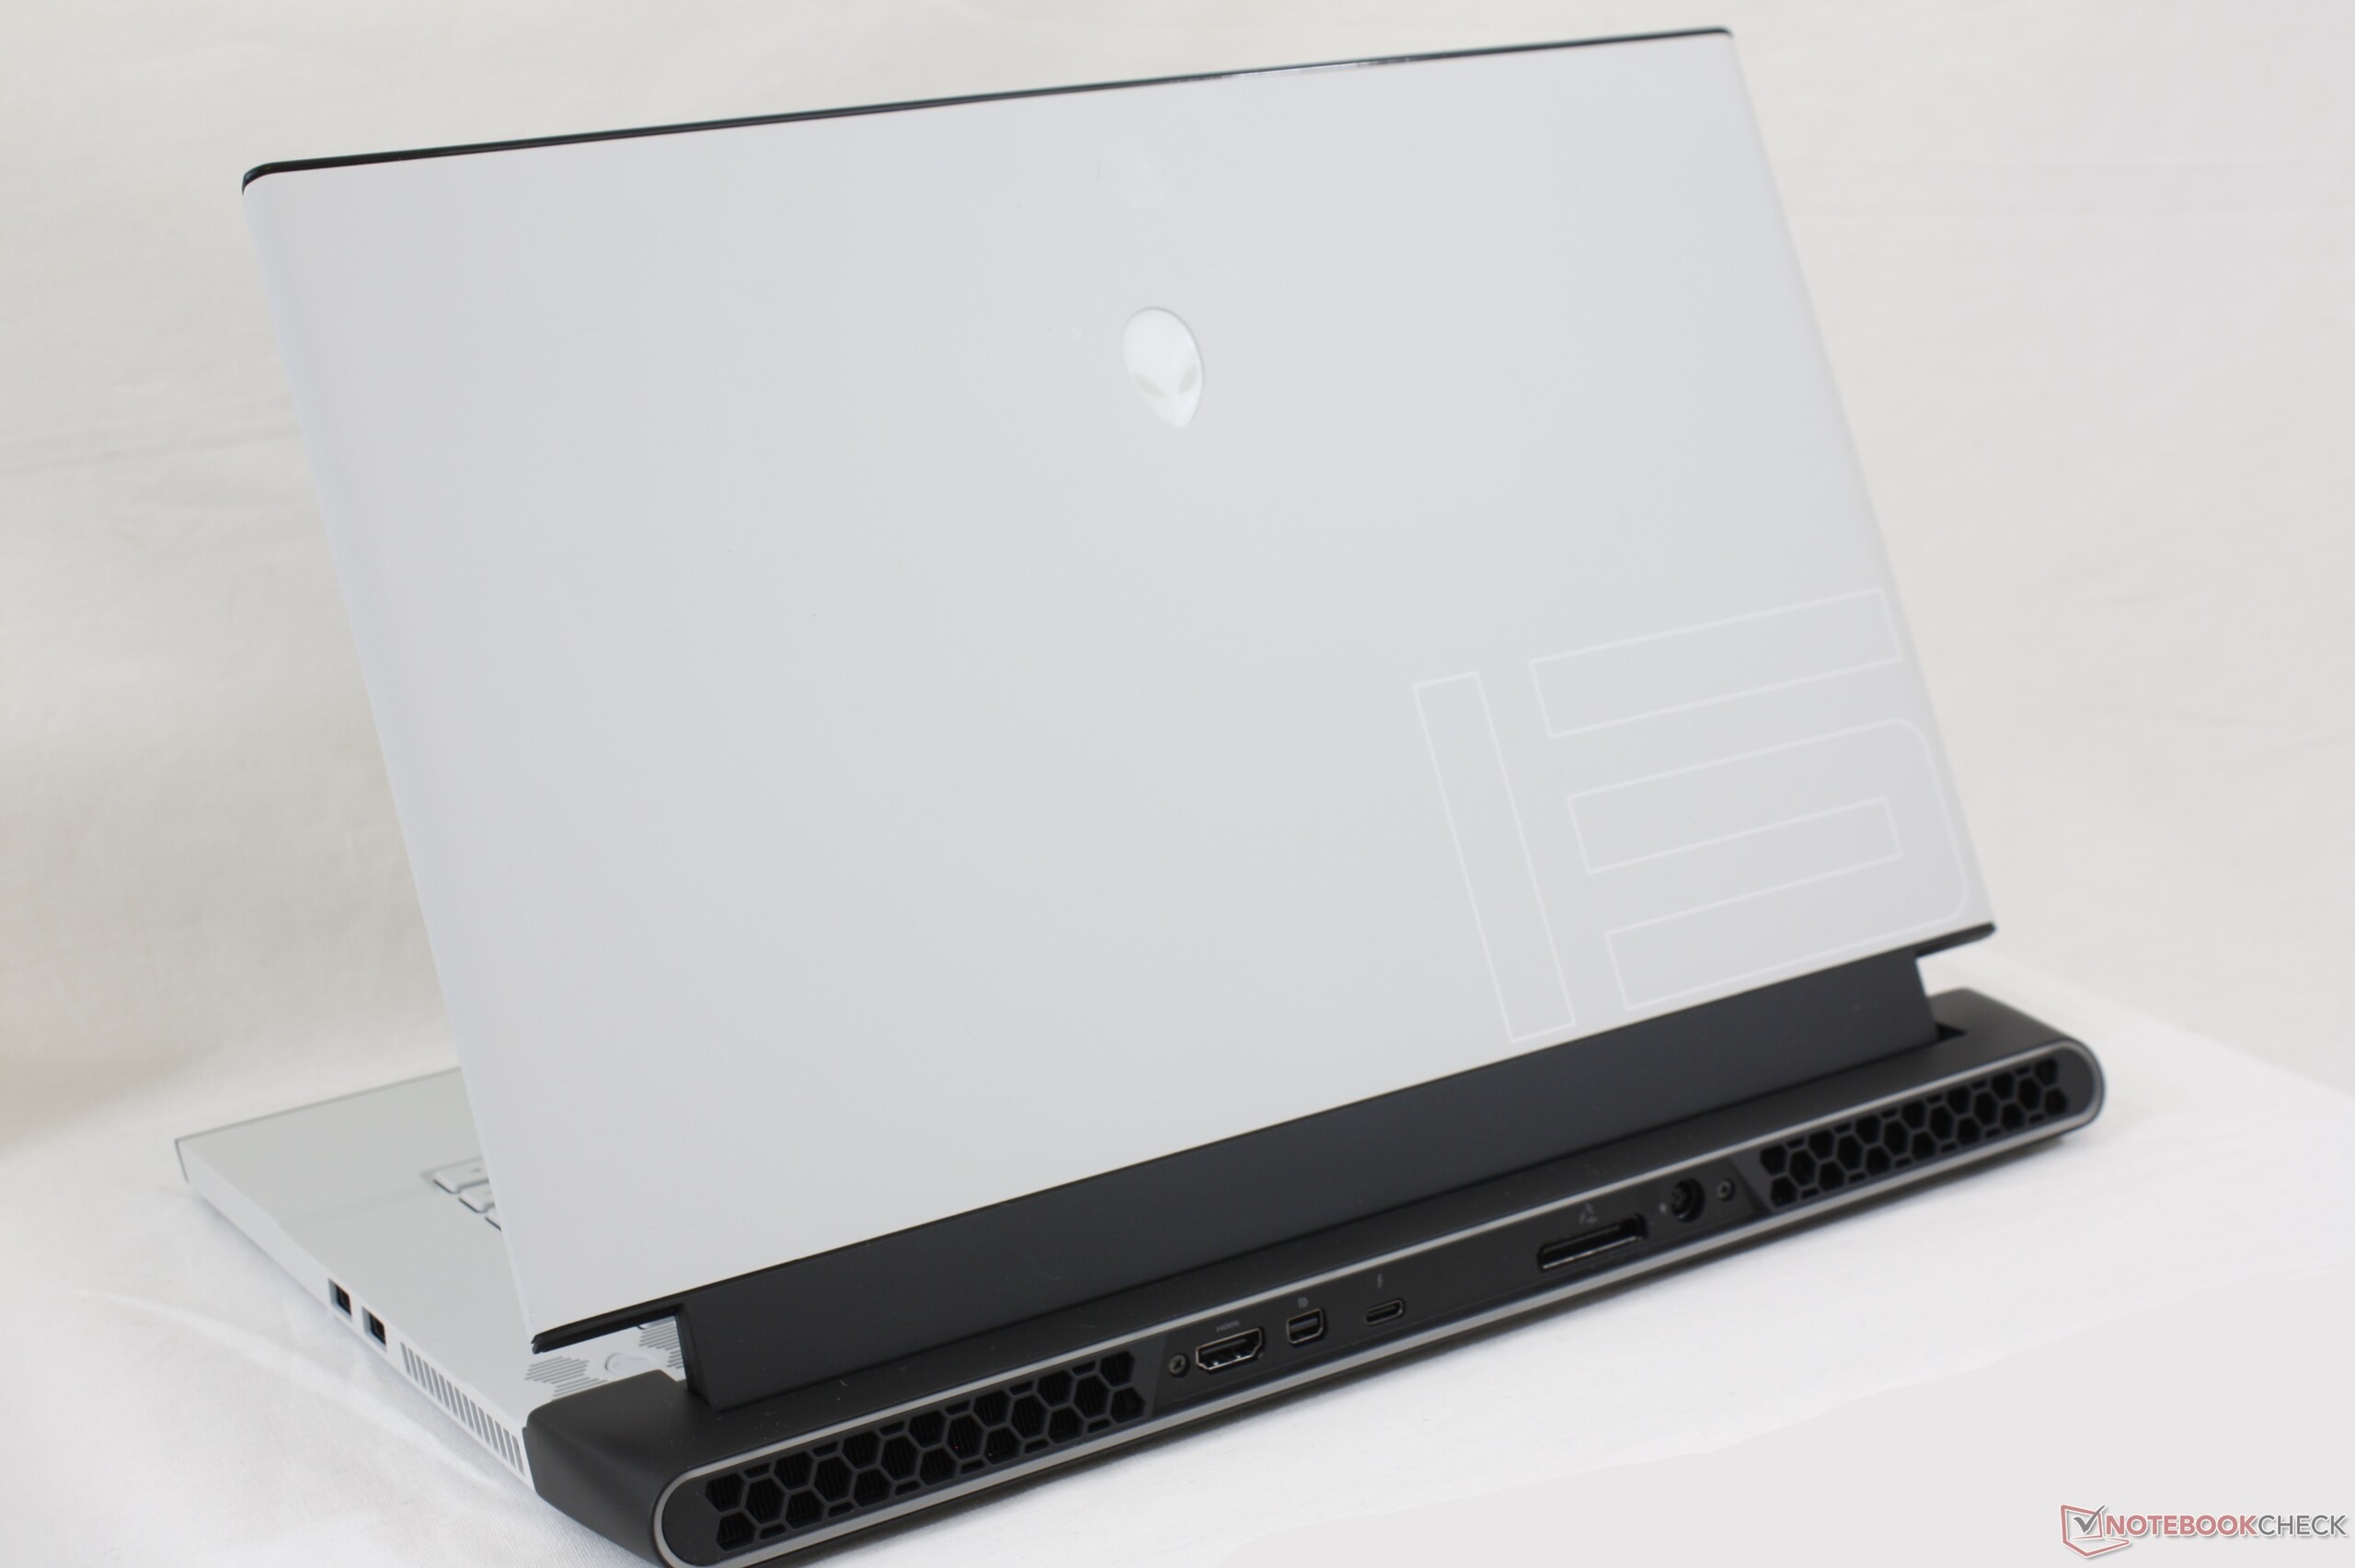
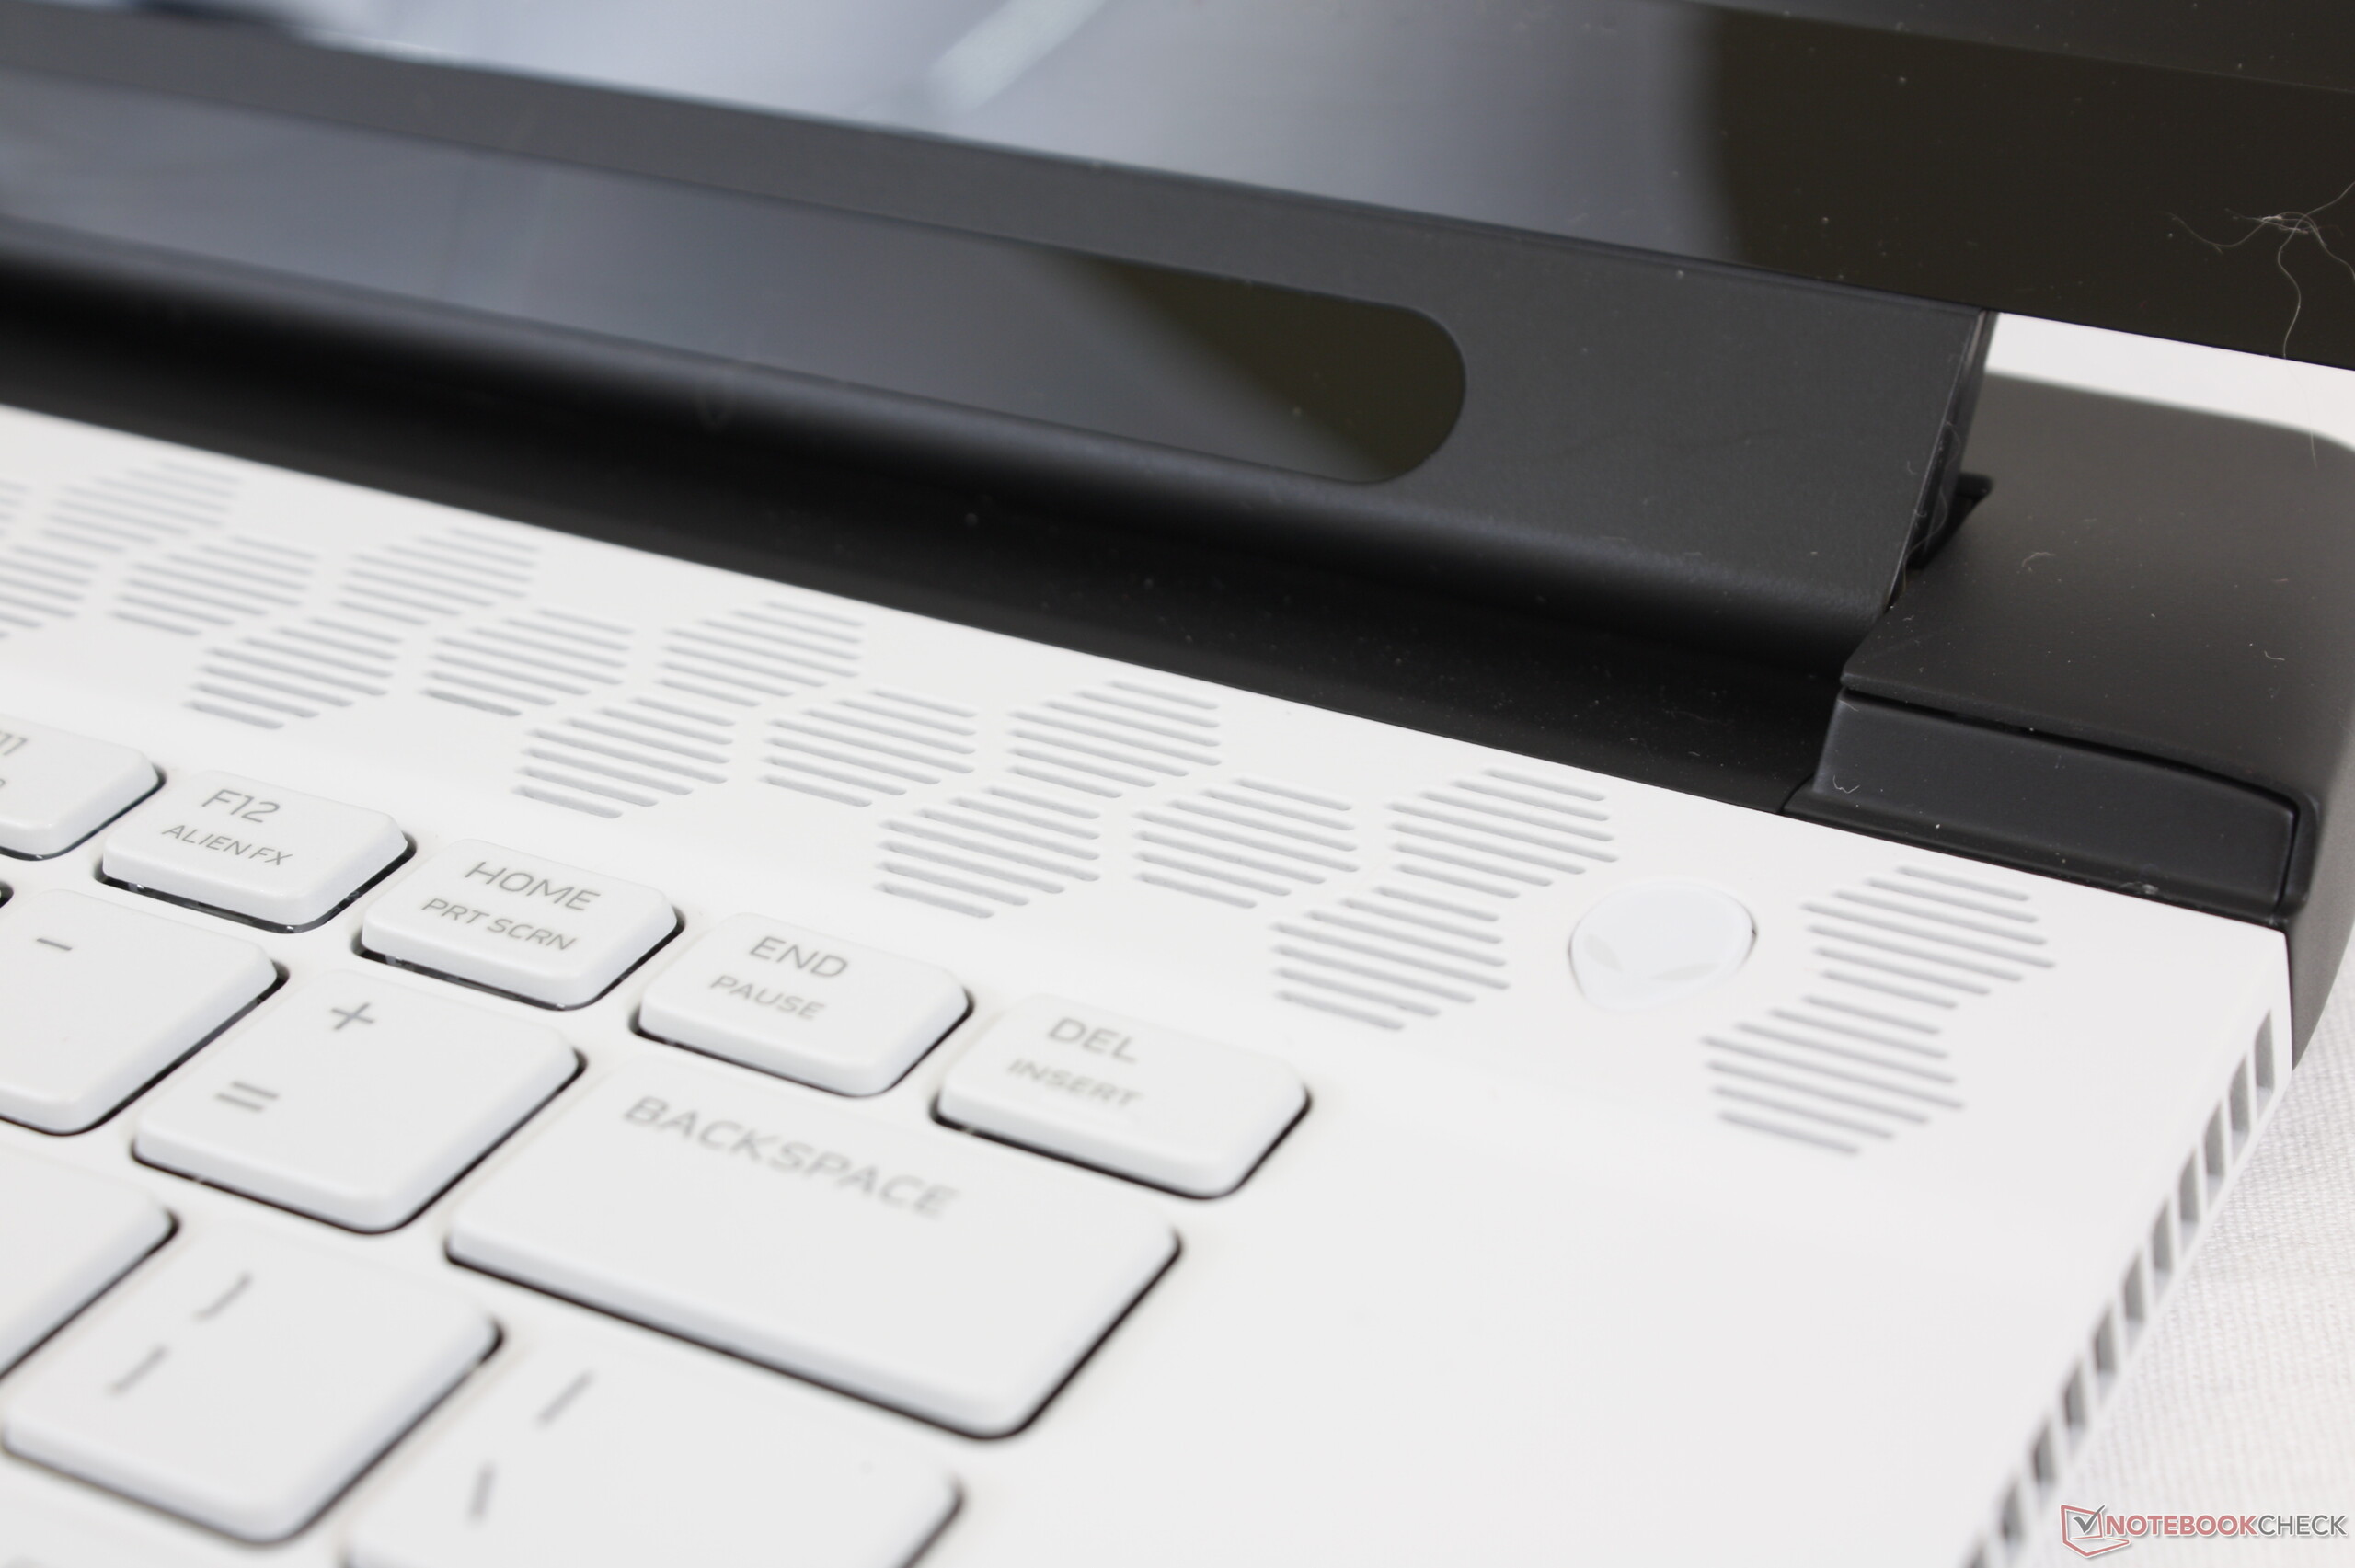
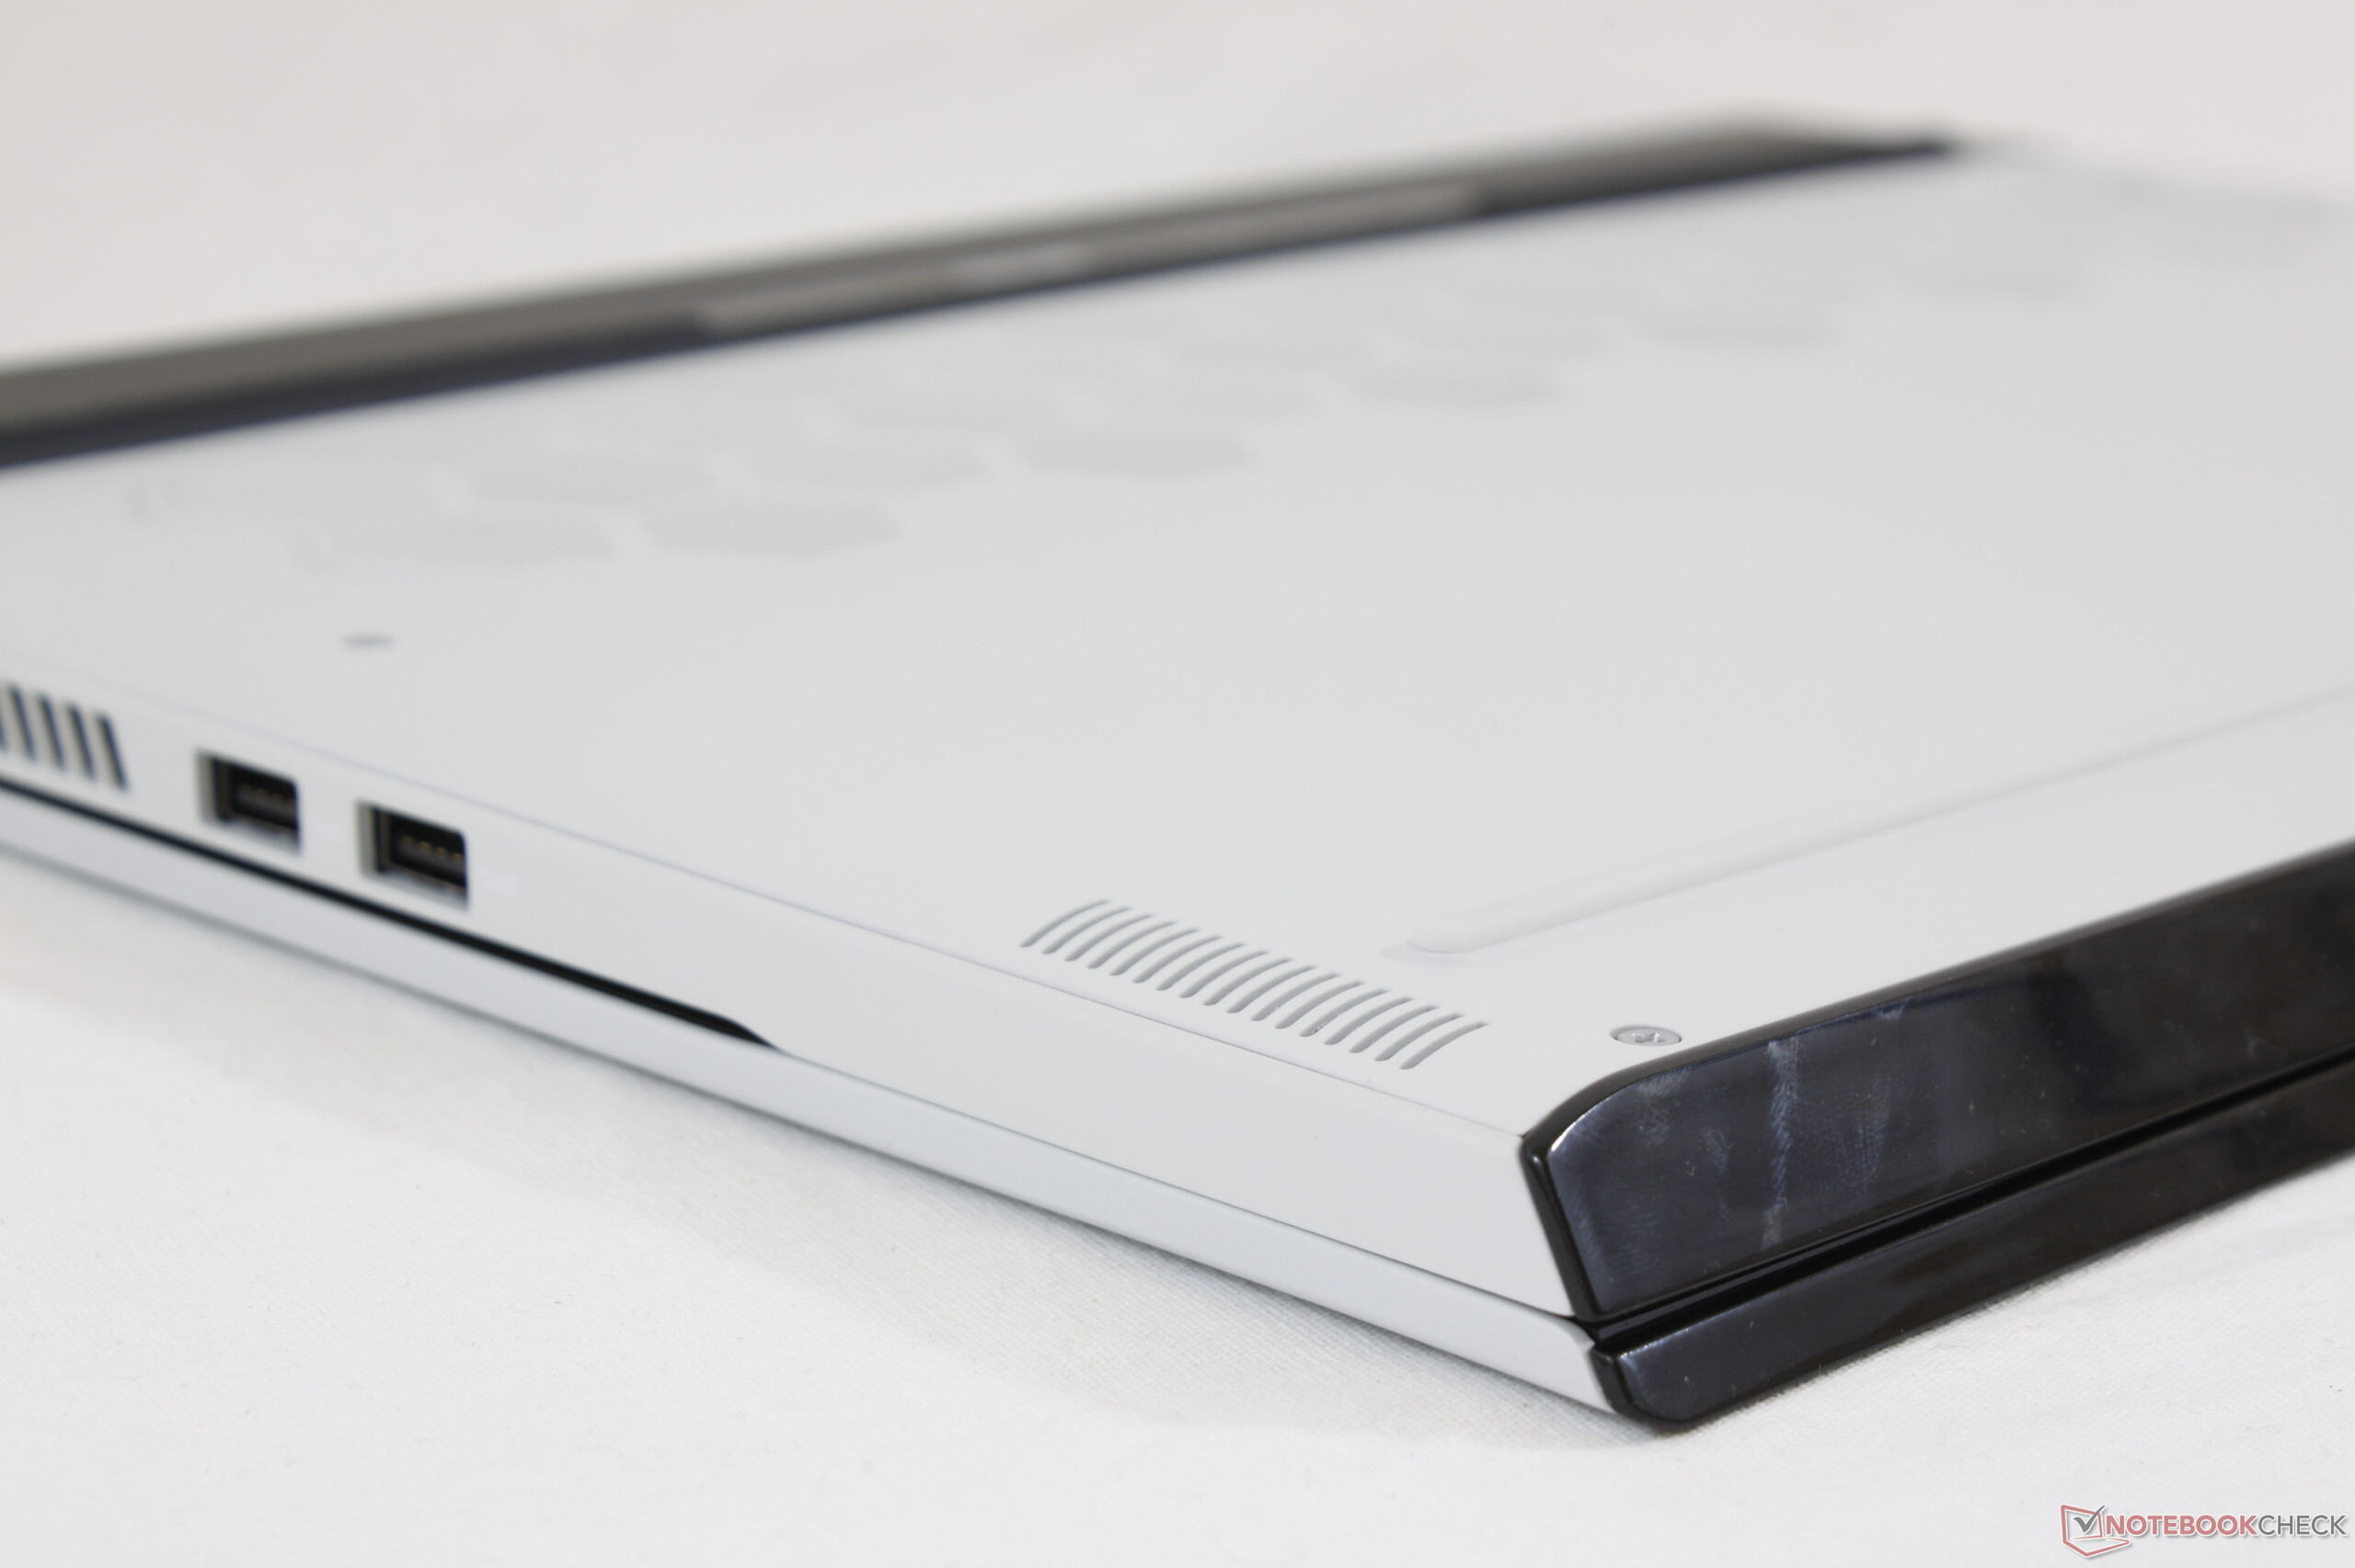
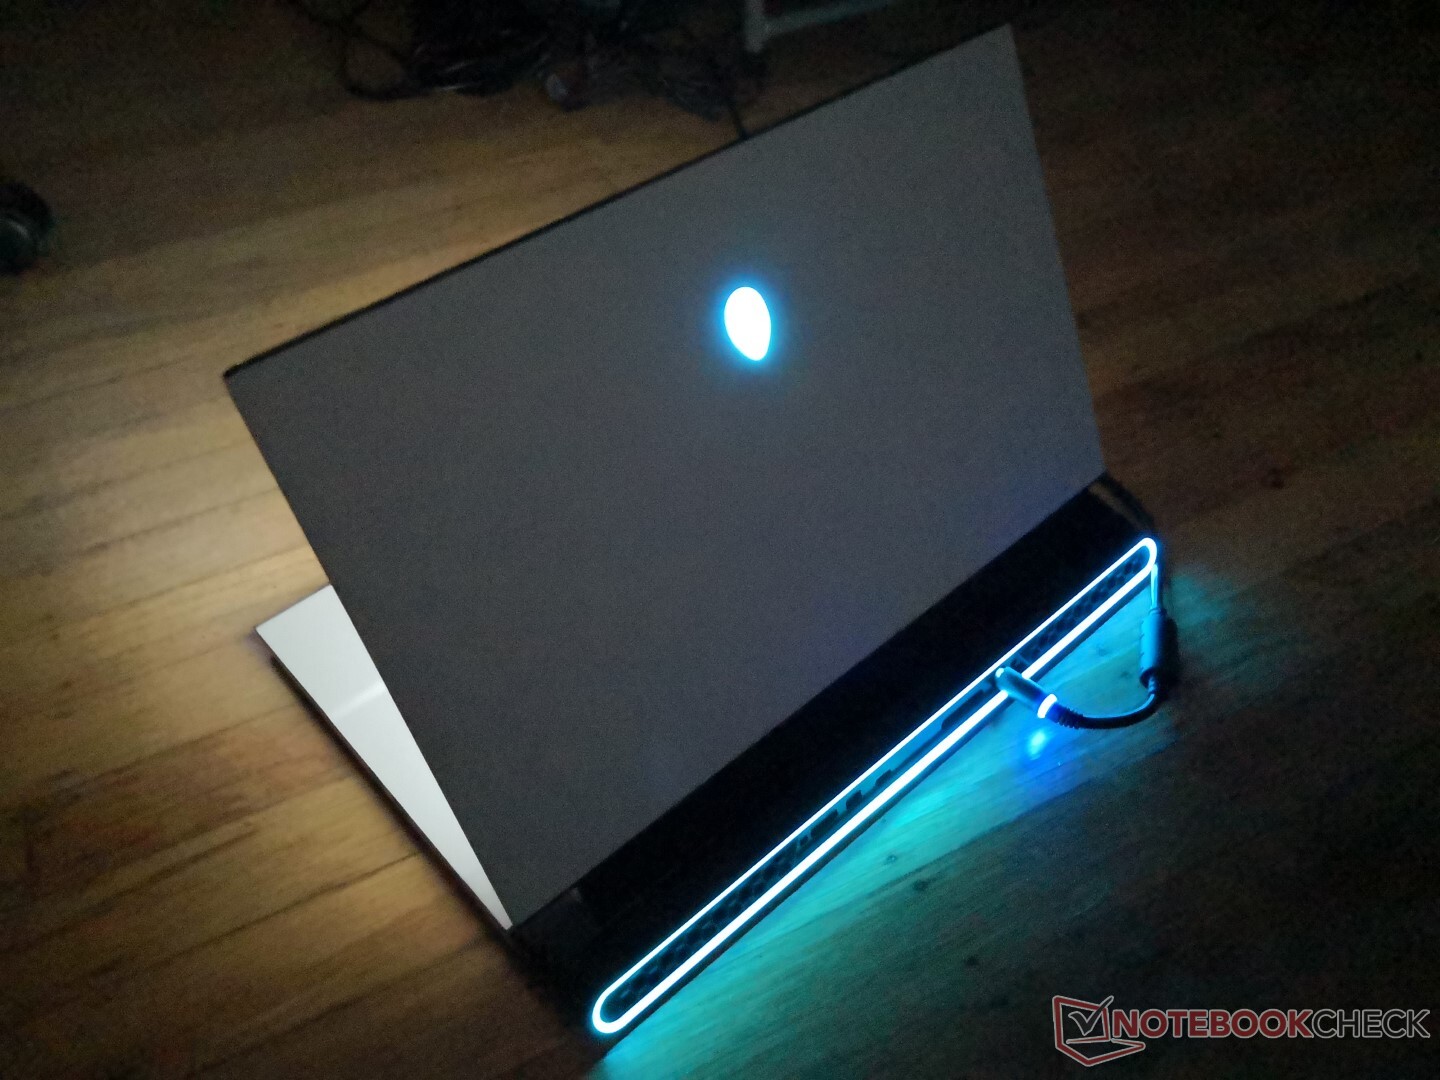
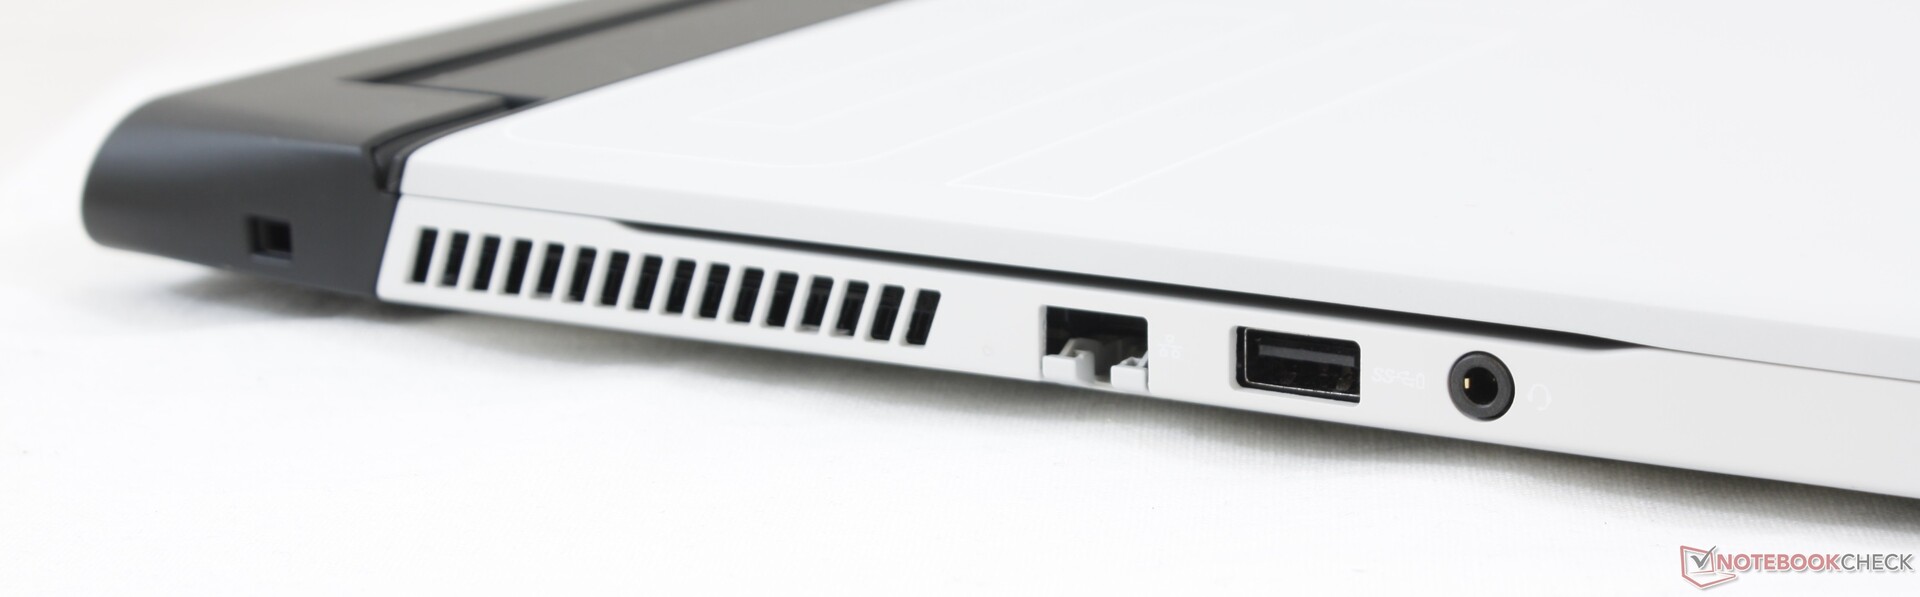
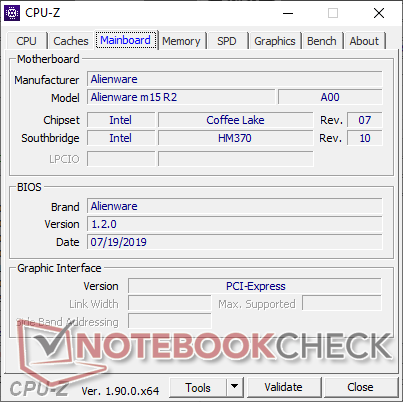
Como o modelo de segunda geração da série, esperamos que o Alienware m15 R2 seja objetivamente melhor que o Alienware m15 R1 de primeira geração, em todo sentido. Este não é necessariamente o caso, nem no papel; a RAM e a WLAN agora são soldadas, enquanto a capacidade da bateria é menor desta vez. Por sua vez, os usuários obtêm Ethernet de 2,5 Gbit, resposta aprimorada do teclado, Wi-Fi 6 opcional, iluminação RGB por tecla e uma aparência mais atraente que não parece mais fraca ou mais forte do que o design de saída que substitui.
Mergulhe mais fundo no m15 R2 e suas desvantagens começam a aparecer. A temperatura da CPU, em particular, é muito alta para o conforto, com quase 100 °C durante os jogos, mesmo com os ventiladores configurados no máximo. Teríamos deixado passar as altas temperaturas, caso tivessem significado ventiladores mais silenciosos ou desempenho mais rápido do que a concorrência, mas esse não é o caso. Se alternativas como o Asus Zephyrus S GX531, O HP ElitePad 15 G2, Razer Blade 15, ou MSI GS65 podem funcionar 20 °C mais frios, então não há razão para que o Alienware m15 R2 também não possa. Infelizmente, observamos esses mesmos resultados no Alienware m15 R1 mais antigo, sugerindo que o chassi do m15 R2 não resolve uma de nossas principais críticas sobre a relativamente nova série Alienware m15.
Talvez como resultado das altas temperaturas da CPU, o Core i7-9750H no m15 R2 tenha um desempenho um pouco mais lento que a média do i7-9750H em nosso banco de dados e até o Core i7-8750H no Alienware m15 R1. As velocidades da CPU podem ser muito mais variáveis do que as previstas e as taxas de quadros durante os jogos são consequentemente um pouco mais baixas, bem como quando a CPU está sob uso muito intenso.
Se você está procurando por um portátil Alienware, não há nada de mal em optar pelo mais antigo Alienware m15 R1 dado que o m15 R2 é mais um passo para um lado em termos de desempenho geral, capacidade de atualização e recursos. Recomendamos investir em uma tela com alta taxa de atualização, evitando as configurações Core i9 e de 8 GB de RAM básicas.
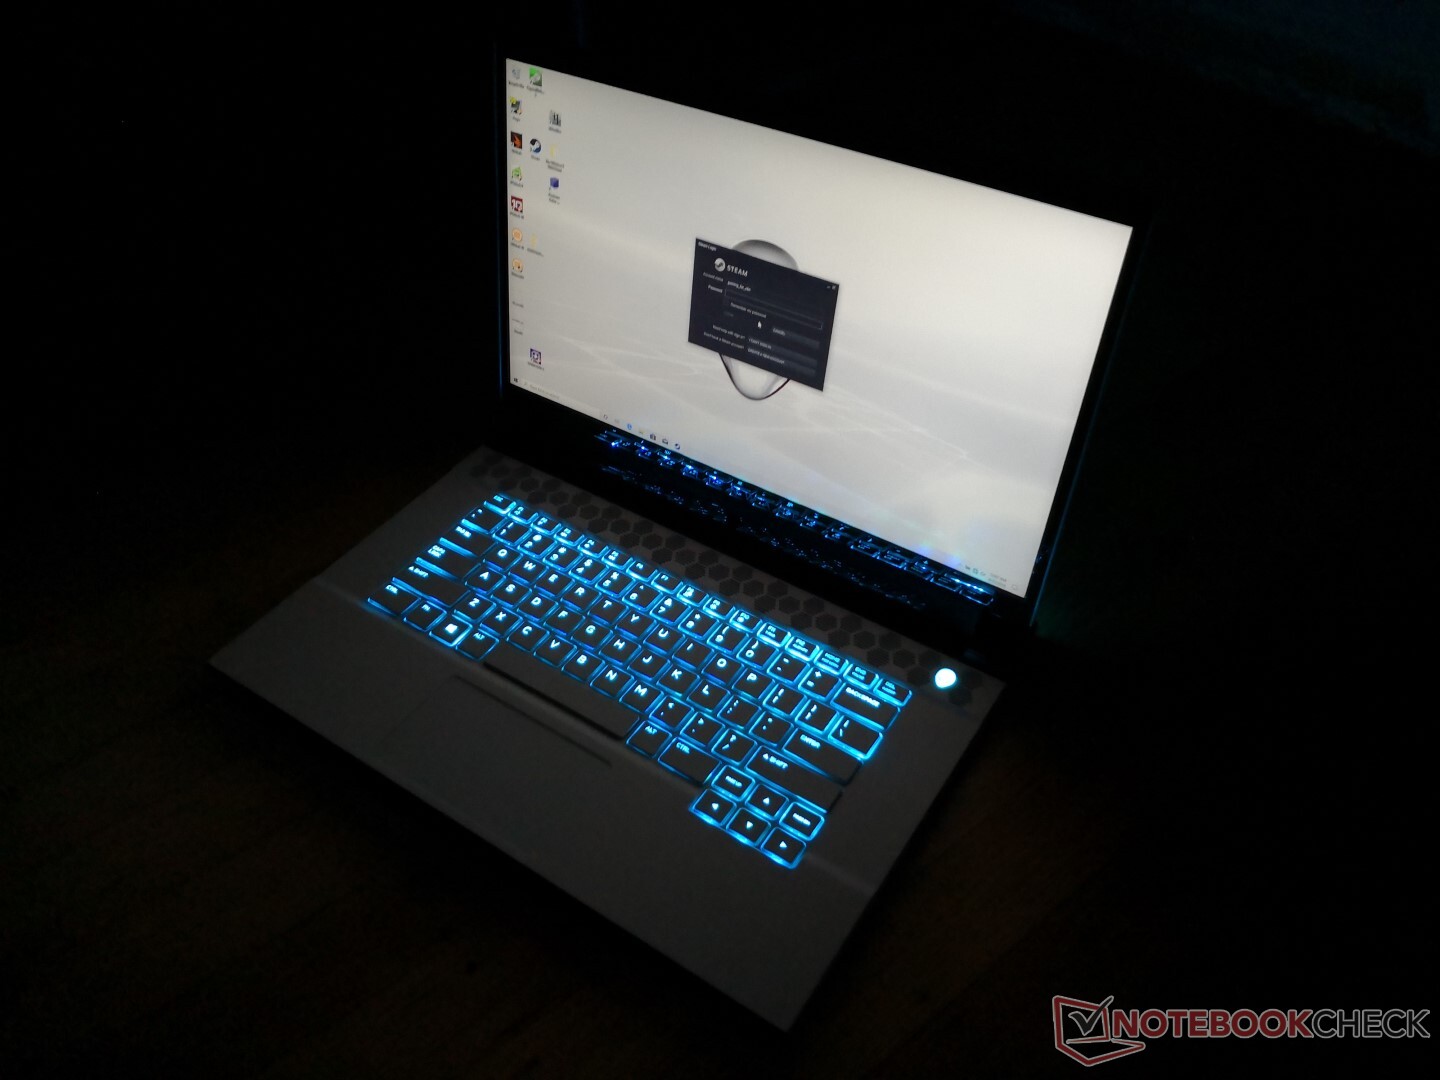
As novas atualizações da última geração do modelo Alienware m15 R1 são principalmente superficiais. Enquanto o Alienware m15 R2 parece mais elegante com iluminação RGB por tecla adicionada, atributos internos como ruído do ventilador e temperaturas muito quentes da CPU realmente não mudaram.
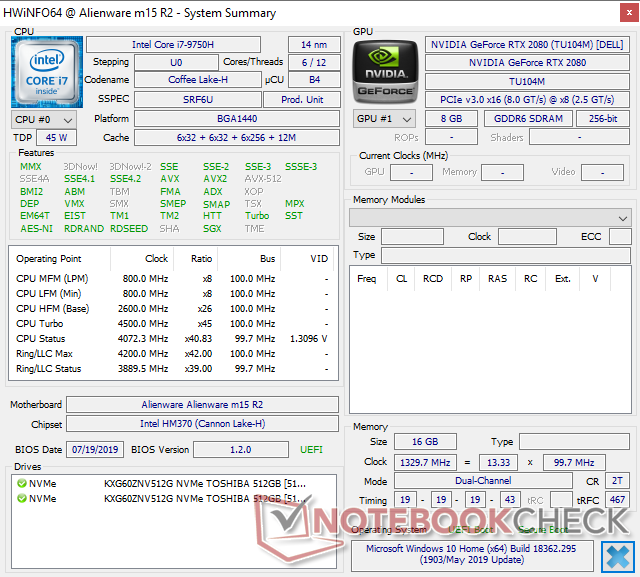
Alienware m15 R2 P87F
- 09/05/2019 v7 (old)
Allen Ngo
Price comparison
