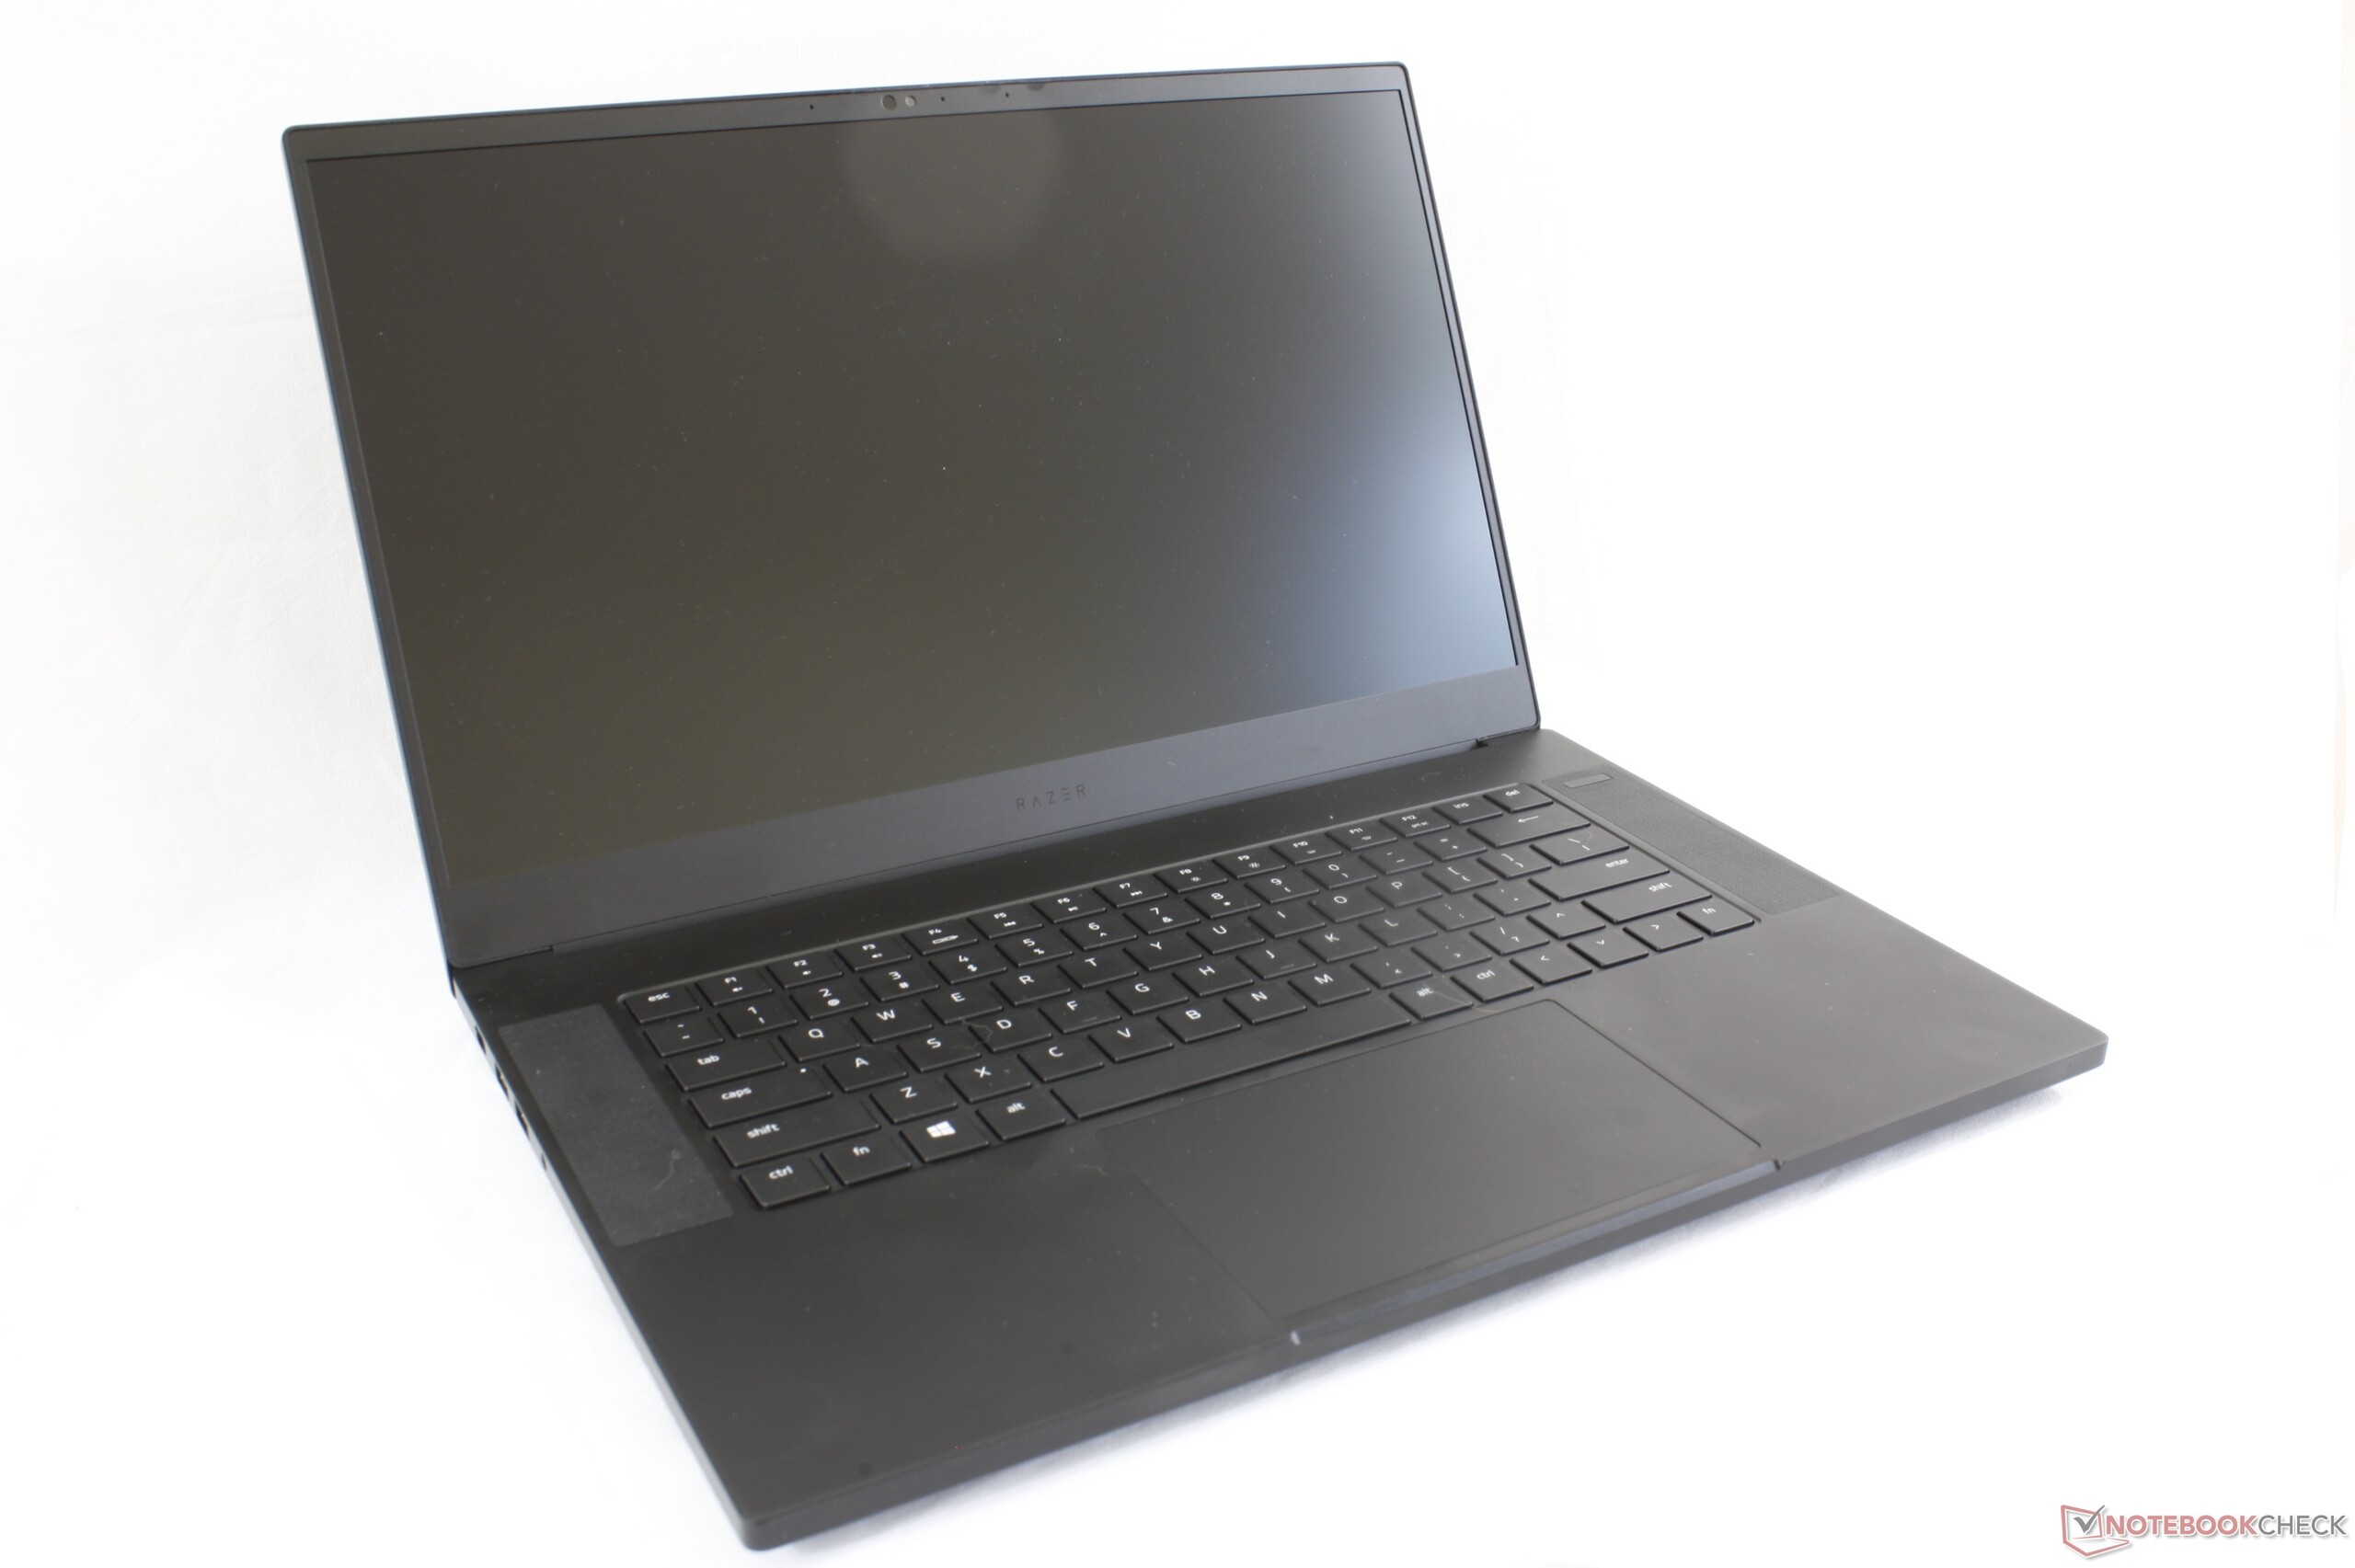
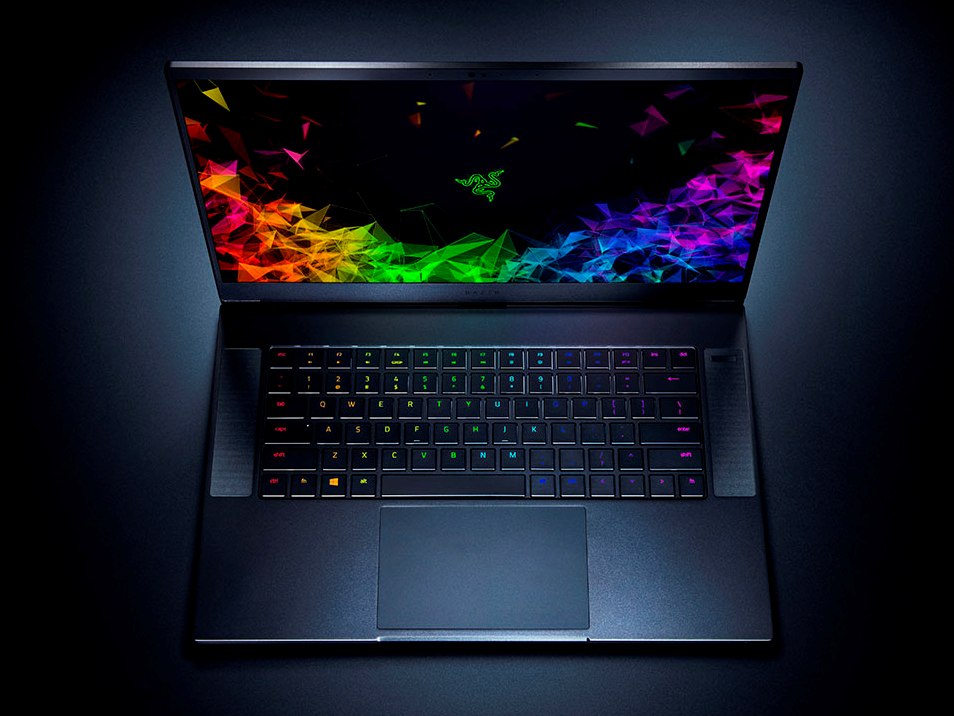
Breve Análise do Portátil Razer Blade 15 Advanced Model (i7-9750H, RTX 2080 Max-Q, 240 Hz)
| |||||||||||||||||||||||||
iluminação: 87 %
iluminação com acumulador: 293 cd/m²
Contraste: 1010:1 (Preto: 0.29 cd/m²)
ΔE ColorChecker Calman: 1.69 | ∀{0.5-29.43 Ø4.72}
calibrated: 1.24
ΔE Greyscale Calman: 2.3 | ∀{0.09-98 Ø4.97}
98.5% sRGB (Argyll 1.6.3 3D)
63% AdobeRGB 1998 (Argyll 1.6.3 3D)
68.5% AdobeRGB 1998 (Argyll 3D)
98.1% sRGB (Argyll 3D)
66.9% Display P3 (Argyll 3D)
Gamma: 2.3
CCT: 6758 K
| Razer Blade 15 RTX 2080 Max-Q Sharp LQ156M1JW03 (SHP14C5), IPS, 15.6", 1920x1080 | Razer Blade 15 RTX 2070 Max-Q LG Philips LGD05C0, IPS, 15.6", 1920x1080 | Alienware m15 GTX 1070 Max-Q AU Optronics B156HAN, IPS, 15.6", 1920x1080 | Asus Zephyrus S GX502GW AU Optronics B156HAN08.2 (AUO82ED), IPS, 15.6", 1920x1080 | Apple MacBook Pro 15 2018 (2.6 GHz, 560X) APPA040, IPS, 15.4", 2880x1800 | MSI GS65 Stealth Thin 8RE-051US AUO80ED, IPS, 15.6", 1920x1080 | |
|---|---|---|---|---|---|---|
| Display | -3% | -7% | -5% | 25% | -3% | |
| Display P3 Coverage (%) | 66.9 | 65.3 -2% | 63.5 -5% | 64.9 -3% | 98.7 48% | 65.8 -2% |
| sRGB Coverage (%) | 98.1 | 94.9 -3% | 89.4 -9% | 91 -7% | 99.9 2% | 92.1 -6% |
| AdobeRGB 1998 Coverage (%) | 68.5 | 66.3 -3% | 64.5 -6% | 65.9 -4% | 86.6 26% | 67 -2% |
| Response Times | -22% | -28% | 30% | -219% | -36% | |
| Response Time Grey 50% / Grey 80% * (ms) | 12.8 ? | 16.8 ? -31% | 18 ? -41% | 7.2 ? 44% | 43.2 ? -238% | 20 ? -56% |
| Response Time Black / White * (ms) | 10.4 ? | 11.6 ? -12% | 12 ? -15% | 8.8 ? 15% | 31.2 ? -200% | 12 ? -15% |
| PWM Frequency (Hz) | 23810 ? | 117000 ? | ||||
| Screen | -19% | -46% | -18% | 33% | -35% | |
| Brightness middle (cd/m²) | 293 | 314.7 7% | 353.6 21% | 286 -2% | 520 77% | 250.9 -14% |
| Brightness (cd/m²) | 270 | 312 16% | 346 28% | 275 2% | 492 82% | 257 -5% |
| Brightness Distribution (%) | 87 | 90 3% | 86 -1% | 90 3% | 88 1% | 83 -5% |
| Black Level * (cd/m²) | 0.29 | 0.38 -31% | 0.3 -3% | 0.37 -28% | 0.39 -34% | 0.32 -10% |
| Contrast (:1) | 1010 | 828 -18% | 1179 17% | 773 -23% | 1333 32% | 784 -22% |
| Colorchecker dE 2000 * | 1.69 | 2.56 -51% | 4.55 -169% | 2.19 -30% | 1.2 29% | 2.77 -64% |
| Colorchecker dE 2000 max. * | 3.37 | 4.89 -45% | 7.91 -135% | 4.4 -31% | 2.3 32% | 5.89 -75% |
| Colorchecker dE 2000 calibrated * | 1.24 | 1.71 -38% | 3.37 -172% | 2.27 -83% | 2.5 -102% | |
| Greyscale dE 2000 * | 2.3 | 3.4 -48% | 4.1 -78% | 2.2 4% | 1.3 43% | 4 -74% |
| Gamma | 2.3 96% | 2.3 96% | 2.27 97% | 2.41 91% | 2.18 101% | 2.27 97% |
| CCT | 6758 96% | 6435 101% | 7434 87% | 6405 101% | 6738 96% | 6901 94% |
| Color Space (Percent of AdobeRGB 1998) (%) | 63 | 60.7 -4% | 57.9 -8% | 59 -6% | 60 -5% | |
| Color Space (Percent of sRGB) (%) | 98.5 | 94.6 -4% | 88.9 -10% | 91 -8% | 92 -7% | |
| Média Total (Programa/Configurações) | -15% /
-17% | -27% /
-37% | 2% /
-10% | -54% /
-8% | -25% /
-29% |
* ... menor é melhor
Exibir tempos de resposta
| ↔ Tempo de resposta preto para branco | ||
|---|---|---|
| 10.4 ms ... ascensão ↗ e queda ↘ combinadas | ↗ 6 ms ascensão | 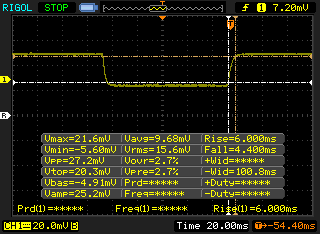 |
| ↘ 4.4 ms queda | ||
| A tela mostra boas taxas de resposta em nossos testes, mas pode ser muito lenta para jogadores competitivos. Em comparação, todos os dispositivos testados variam de 0.1 (mínimo) a 240 (máximo) ms. » 28 % de todos os dispositivos são melhores. Isso significa que o tempo de resposta medido é melhor que a média de todos os dispositivos testados (19.8 ms). | ||
| ↔ Tempo de resposta 50% cinza a 80% cinza | ||
| 12.8 ms ... ascensão ↗ e queda ↘ combinadas | ↗ 6.8 ms ascensão | 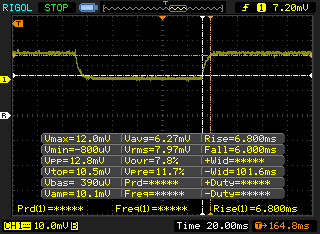 |
| ↘ 6 ms queda | ||
| A tela mostra boas taxas de resposta em nossos testes, mas pode ser muito lenta para jogadores competitivos. Em comparação, todos os dispositivos testados variam de 0.165 (mínimo) a 636 (máximo) ms. » 26 % de todos os dispositivos são melhores. Isso significa que o tempo de resposta medido é melhor que a média de todos os dispositivos testados (31 ms). | ||
Cintilação da tela / PWM (modulação por largura de pulso)
| Tela tremeluzindo/PWM detectado | 23810 Hz | ≤ 10 % configuração de brilho | 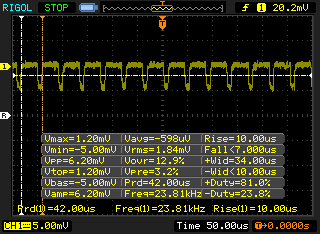 |
A luz de fundo da tela pisca em 23810 Hz (pior caso, por exemplo, utilizando PWM) Cintilação detectada em uma configuração de brilho de 10 % e abaixo. Não deve haver cintilação ou PWM acima desta configuração de brilho. A frequência de 23810 Hz é bastante alta, então a maioria dos usuários sensíveis ao PWM não deve notar nenhuma oscilação. [pwm_comparison] Em comparação: 52 % de todos os dispositivos testados não usam PWM para escurecer a tela. Se PWM foi detectado, uma média de 7769 (mínimo: 5 - máximo: 343500) Hz foi medida. | |||
| PCMark 8 Home Score Accelerated v2 | 4380 pontos | |
| PCMark 8 Work Score Accelerated v2 | 5749 pontos | |
| PCMark 10 Score | 5839 pontos | |
Ajuda | ||
| Razer Blade 15 RTX 2080 Max-Q Samsung SSD PM981 MZVLB512HAJQ | Razer Blade 15 RTX 2070 Max-Q Samsung SSD PM981 MZVLB512HAJQ | Alienware m15 GTX 1070 Max-Q Toshiba XG5 KXG50ZNV512G | Asus Zephyrus S GX502GW 2x Intel SSD 660p SSDPEKNW512G8 (RAID 0) | Apple MacBook Pro 15 2018 (2.6 GHz, 560X) Apple SSD AP0512 | |
|---|---|---|---|---|---|
| AS SSD | 1% | -43% | -21% | -76% | |
| Seq Read (MB/s) | 1832 | 1840 0% | 1967 7% | 2506 37% | 2239 22% |
| Seq Write (MB/s) | 1864 | 1822 -2% | 1135 -39% | 1712 -8% | 1644 -12% |
| 4K Read (MB/s) | 52.1 | 52.3 0% | 29.17 -44% | 48.32 -7% | 9.46 -82% |
| 4K Write (MB/s) | 108.3 | 110.7 2% | 93.4 -14% | 103.6 -4% | 18.78 -83% |
| 4K-64 Read (MB/s) | 1159 | 1126 -3% | 995 -14% | 624 -46% | 965 -17% |
| 4K-64 Write (MB/s) | 1807 | 1717 -5% | 656 -64% | 1253 -31% | 163.5 -91% |
| Access Time Read * (ms) | 0.05 | 0.047 6% | 0.116 -132% | 0.08 -60% | 0.225 -350% |
| Access Time Write * (ms) | 0.034 | 0.033 3% | 0.063 -85% | 0.04 -18% | |
| Score Read (Points) | 1394 | 1362 -2% | 1221 -12% | 923 -34% | 1199 -14% |
| Score Write (Points) | 2102 | 2010 -4% | 862 -59% | 1528 -27% | 347 -83% |
| Score Total (Points) | 4221 | 4079 -3% | 2667 -37% | 2896 -31% | 2119 -50% |
| Copy ISO MB/s (MB/s) | 2083 | 1975 -5% | 642 -69% | ||
| Copy Program MB/s (MB/s) | 496.5 | 526 6% | 431.5 -13% | ||
| Copy Game MB/s (MB/s) | 977 | 1200 23% | 706 -28% |
* ... menor é melhor

| 3DMark 11 Performance | 21563 pontos | |
| 3DMark Cloud Gate Standard Score | 32108 pontos | |
| 3DMark Fire Strike Score | 17838 pontos | |
| 3DMark Time Spy Score | 7410 pontos | |
Ajuda | ||
| The Witcher 3 - 1920x1080 Ultra Graphics & Postprocessing (HBAO+) | |
| MSI GE75 9SG | |
| Média NVIDIA GeForce RTX 2080 Max-Q (65.7 - 92.7, n=22) | |
| Razer Blade 15 RTX 2080 Max-Q | |
| Razer Blade 15 RTX 2070 Max-Q | |
| Alienware m15 GTX 1070 Max-Q | |
| Schenker Compact 15 | |
| MSI GS65 Stealth Thin 8RE-051US | |
| Acer Aspire Nitro 5 AN515-54-53Z2 | |
| Razer Blade Stealth i7-8565U | |
| baixo | média | alto | ultra | |
|---|---|---|---|---|
| BioShock Infinite (2013) | 323.8 | 280.2 | 262 | 170 |
| The Witcher 3 (2015) | 273.9 | 227.6 | 146.6 | 78.3 |
| Rise of the Tomb Raider (2016) | 239.5 | 174.7 | 143.8 | 126 |
| Razer Blade 15 RTX 2080 Max-Q GeForce RTX 2080 Max-Q, i7-9750H, Samsung SSD PM981 MZVLB512HAJQ | Razer Blade 15 RTX 2070 Max-Q GeForce RTX 2070 Max-Q, i7-8750H, Samsung SSD PM981 MZVLB512HAJQ | Alienware m15 GTX 1070 Max-Q GeForce GTX 1070 Max-Q, i7-8750H, Toshiba XG5 KXG50ZNV512G | Asus Zephyrus S GX502GW GeForce RTX 2070 Mobile, i7-9750H, 2x Intel SSD 660p SSDPEKNW512G8 (RAID 0) | Apple MacBook Pro 15 2018 (2.6 GHz, 560X) Radeon Pro 560X, i7-8850H, Apple SSD AP0512 | MSI GS65 Stealth Thin 8RE-051US GeForce GTX 1060 Mobile, i7-8750H, Samsung SSD PM981 MZVLB256HAHQ | Dell XPS 15 9570 Core i9 UHD GeForce GTX 1050 Ti Max-Q, i9-8950HK, Samsung SSD PM981 MZVLB1T0HALR | |
|---|---|---|---|---|---|---|---|
| Noise | -1% | -6% | -22% | -6% | -5% | -2% | |
| desligado / ambiente * (dB) | 28.3 | 28.8 -2% | 28.6 -1% | 30 -6% | 29.6 -5% | 28.4 -0% | 28.2 -0% |
| Idle Minimum * (dB) | 28.8 | 28.8 -0% | 28.6 1% | 31 -8% | 30.1 -5% | 28.4 1% | 28.5 1% |
| Idle Average * (dB) | 28.8 | 28.8 -0% | 28.6 1% | 33 -15% | 30.1 -5% | 28.4 1% | 28.6 1% |
| Idle Maximum * (dB) | 29 | 29.4 -1% | 28.6 1% | 38 -31% | 30.1 -4% | 29.6 -2% | 28.8 1% |
| Load Average * (dB) | 33.5 | 35.7 -7% | 40.8 -22% | 50 -49% | 46.8 -40% | 43.5 -30% | 36.2 -8% |
| Witcher 3 ultra * (dB) | 45 | 42.5 6% | 49.6 -10% | 53 -18% | 36 20% | 45.7 -2% | 47.6 -6% |
| Load Maximum * (dB) | 45.2 | 45 -0% | 49.6 -10% | 56 -24% | 46.8 -4% | 45.7 -1% | 47.6 -5% |
* ... menor é melhor
Barulho
| Ocioso |
| 28.8 / 28.8 / 29 dB |
| Carga |
| 33.5 / 45.2 dB |
 | ||
30 dB silencioso 40 dB(A) audível 50 dB(A) ruidosamente alto |
||
min: | ||
(-) A temperatura máxima no lado superior é 47 °C / 117 F, em comparação com a média de 40.4 °C / 105 F , variando de 21.2 a 68.8 °C para a classe Gaming.
(-) A parte inferior aquece até um máximo de 49.2 °C / 121 F, em comparação com a média de 43.2 °C / 110 F
(+) Em uso inativo, a temperatura média para o lado superior é 27.5 °C / 82 F, em comparação com a média do dispositivo de 33.9 °C / ### class_avg_f### F.
(±) Jogando The Witcher 3, a temperatura média para o lado superior é 37.5 °C / 100 F, em comparação com a média do dispositivo de 33.9 °C / ## #class_avg_f### F.
(±) Os apoios para as mãos e o touchpad podem ficar muito quentes ao toque, com um máximo de 36 °C / 96.8 F.
(-) A temperatura média da área do apoio para as mãos de dispositivos semelhantes foi 28.8 °C / 83.8 F (-7.2 °C / -13 F).
Razer Blade 15 RTX 2080 Max-Q análise de áudio
(+) | os alto-falantes podem tocar relativamente alto (###valor### dB)
Graves 100 - 315Hz
(±) | graves reduzidos - em média 10.7% menor que a mediana
(±) | a linearidade dos graves é média (11.3% delta para a frequência anterior)
Médios 400 - 2.000 Hz
(±) | médios mais altos - em média 5.7% maior que a mediana
(+) | médios são lineares (5.4% delta para frequência anterior)
Altos 2 - 16 kHz
(±) | máximos reduzidos - em média 6% menor que a mediana
(±) | a linearidade dos máximos é média (9.1% delta para frequência anterior)
Geral 100 - 16.000 Hz
(±) | a linearidade do som geral é média (21.7% diferença em relação à mediana)
Comparado com a mesma classe
» 78% de todos os dispositivos testados nesta classe foram melhores, 6% semelhantes, 17% piores
» O melhor teve um delta de 6%, a média foi 18%, o pior foi 132%
Comparado com todos os dispositivos testados
» 61% de todos os dispositivos testados foram melhores, 7% semelhantes, 31% piores
» O melhor teve um delta de 4%, a média foi 24%, o pior foi 134%
Apple MacBook 12 (Early 2016) 1.1 GHz análise de áudio
(+) | os alto-falantes podem tocar relativamente alto (###valor### dB)
Graves 100 - 315Hz
(±) | graves reduzidos - em média 11.3% menor que a mediana
(±) | a linearidade dos graves é média (14.2% delta para a frequência anterior)
Médios 400 - 2.000 Hz
(+) | médios equilibrados - apenas 2.4% longe da mediana
(+) | médios são lineares (5.5% delta para frequência anterior)
Altos 2 - 16 kHz
(+) | agudos equilibrados - apenas 2% longe da mediana
(+) | os máximos são lineares (4.5% delta da frequência anterior)
Geral 100 - 16.000 Hz
(+) | o som geral é linear (10.2% diferença em relação à mediana)
Comparado com a mesma classe
» 7% de todos os dispositivos testados nesta classe foram melhores, 2% semelhantes, 91% piores
» O melhor teve um delta de 5%, a média foi 18%, o pior foi 53%
Comparado com todos os dispositivos testados
» 5% de todos os dispositivos testados foram melhores, 1% semelhantes, 94% piores
» O melhor teve um delta de 4%, a média foi 24%, o pior foi 134%
| desligado | |
| Ocioso | |
| Carga |
|
Key:
min: | |
| Razer Blade 15 RTX 2080 Max-Q i7-9750H, GeForce RTX 2080 Max-Q, Samsung SSD PM981 MZVLB512HAJQ, IPS, 1920x1080, 15.6" | Razer Blade 15 RTX 2070 Max-Q i7-8750H, GeForce RTX 2070 Max-Q, Samsung SSD PM981 MZVLB512HAJQ, IPS, 1920x1080, 15.6" | Alienware m15 GTX 1070 Max-Q i7-8750H, GeForce GTX 1070 Max-Q, Toshiba XG5 KXG50ZNV512G, IPS, 1920x1080, 15.6" | Asus Zephyrus S GX502GW i7-9750H, GeForce RTX 2070 Mobile, 2x Intel SSD 660p SSDPEKNW512G8 (RAID 0), IPS, 1920x1080, 15.6" | Apple MacBook Pro 15 2018 (2.6 GHz, 560X) i7-8850H, Radeon Pro 560X, Apple SSD AP0512, IPS, 2880x1800, 15.4" | MSI GS65 Stealth Thin 8RE-051US i7-8750H, GeForce GTX 1060 Mobile, Samsung SSD PM981 MZVLB256HAHQ, IPS, 1920x1080, 15.6" | Dell XPS 15 9570 Core i9 UHD i9-8950HK, GeForce GTX 1050 Ti Max-Q, Samsung SSD PM981 MZVLB1T0HALR, IPS, 3840x2160, 15.6" | |
|---|---|---|---|---|---|---|---|
| Power Consumption | 10% | 16% | -47% | 40% | 18% | 24% | |
| Idle Minimum * (Watt) | 12.5 | 10.4 17% | 7.6 39% | 24 -92% | 3.4 73% | 8.7 30% | 7.1 43% |
| Idle Average * (Watt) | 15.3 | 14.6 5% | 13.8 10% | 27 -76% | 11 28% | 13 15% | 13.6 11% |
| Idle Maximum * (Watt) | 20.7 | 16.3 21% | 14.6 29% | 33 -59% | 14.9 28% | 14.3 31% | 14.1 32% |
| Load Average * (Watt) | 90.2 | 88.5 2% | 97.6 -8% | 129 -43% | 78.9 13% | 107.4 -19% | 103.9 -15% |
| Witcher 3 ultra * (Watt) | 162 | 155.4 4% | 145.8 10% | 176 -9% | 129 20% | 103 36% | |
| Load Maximum * (Watt) | 209.3 | 182.4 13% | 172.5 18% | 216 -3% | 91.2 56% | 151.5 28% | 130.9 37% |
* ... menor é melhor
| Razer Blade 15 RTX 2080 Max-Q i7-9750H, GeForce RTX 2080 Max-Q, 80 Wh | Razer Blade 15 RTX 2070 Max-Q i7-8750H, GeForce RTX 2070 Max-Q, 80 Wh | Alienware m15 GTX 1070 Max-Q i7-8750H, GeForce GTX 1070 Max-Q, 90 Wh | Asus Zephyrus S GX502GW i7-9750H, GeForce RTX 2070 Mobile, 76 Wh | Apple MacBook Pro 15 2018 (2.6 GHz, 560X) i7-8850H, Radeon Pro 560X, 83 Wh | MSI GS65 Stealth Thin 8RE-051US i7-8750H, GeForce GTX 1060 Mobile, 82 Wh | Dell XPS 15 9570 Core i9 UHD i9-8950HK, GeForce GTX 1050 Ti Max-Q, 97 Wh | |
|---|---|---|---|---|---|---|---|
| Duração da bateria | -14% | -6% | -49% | 55% | -18% | -6% | |
| Reader / Idle (h) | 15.9 | 11.4 -28% | 10.5 -34% | 5.9 -63% | 15 -6% | ||
| WiFi v1.3 (h) | 6.6 | 6.5 -2% | 7.7 17% | 3.7 -44% | 10.2 55% | 6.2 -6% | 8.6 30% |
| Load (h) | 1.7 | 1.5 -12% | 1.7 0% | 1 -41% | 1.2 -29% | 1 -41% | |
| Witcher 3 ultra (h) | 1.5 |
Pro
Contra
O maior motivo para possuir o mais recente Blade 15 em relação aos SKUs da geração anterior é a sua tela de 240 Hz ou OLED. Embora não possamos falar da opção OLED no momento, o salto de Wi-Fi 5 para Wi-Fi 6 ou Intel Core i7 de 8ª geração para o Core i7 de 9ª geração empalidece em comparação com o salto de uma tela de 60 Hz para 240 Hz. A fluidez, a capacidade de resposta e o luxo da taxa de atualização 4x mais rápida são imediatamente tangíveis, tanto nos jogos quanto fora dos jogos.
Enquanto isso, os usuários que estão considerando o RTX 2080 Max-Q sobre o RTX 2070 Max-Q terá desempenho de jogos até 17% mais rápido, sem impacto real no ruído, nas temperaturas ou na duração da bateria. No entanto, a opção 2080 Max-Q é $500 mais cara, e por isso existe um preço alto definido para obter o melhor que o Blade 15 tem a oferecer.
Para a maioria dos usuários além do ultra entusiasta, o painel original de 144 Hz ainda é mais que suficiente porque é difícil notar a diferença entre 144 Hz e 240 Hz na prática. Qualquer uma das opções fará com que o painel base de 60 Hz pareça pouco interessante após alguns dias de uso. O dinheiro economizado pode, em vez disso, ir para recursos potencialmente mais importantes, como armazenamento adicional, memória RAM, acessórios ou até mesmo um plano de garantia estendida da RazerCare.
O portátil de jogos mais completo da Razer ficou ainda melhor com esses SKUs adicionais de gama alta para os entusiastas. As novas atualizações consolidam a posição da Razer como uma empresa criada para os jogadores. Ainda assim, os jogadores de mainstream e gama média não terão grandes ganhos de desempenho com as já excelentes opções do Blade 15 com 144 Hz e Intel 8th gen.
Razer Blade 15 RTX 2080 Max-Q
- 05/20/2019 v6 (old)
Allen Ngo
Price comparison
