Breve Análise do Portátil Acer Predator Triton 500 (i7-8750H, RTX 2080 Max-Q)
| |||||||||||||||||||||||||
iluminação: 89 %
iluminação com acumulador: 304 cd/m²
Contraste: 1126:1 (Preto: 0.27 cd/m²)
ΔE ColorChecker Calman: 4.66 | ∀{0.5-29.43 Ø4.71}
calibrated: 1.72
ΔE Greyscale Calman: 5.53 | ∀{0.09-98 Ø4.96}
93% sRGB (Argyll 1.6.3 3D)
60% AdobeRGB 1998 (Argyll 1.6.3 3D)
65.7% AdobeRGB 1998 (Argyll 3D)
92.6% sRGB (Argyll 3D)
64.2% Display P3 (Argyll 3D)
Gamma: 2.5
CCT: 8028 K
| Acer Predator Triton 500 AU Optronics B156HAN08.2 (AUO82ED), IPS, 1920x1080 | Gigabyte Aero 15-X9 LGD05C0, IPS, 1920x1080 | Razer Blade 15 RTX 2070 Max-Q LG Philips LGD05C0, IPS, 1920x1080 | MSI GS65 8RF-019DE Stealth Thin AU Optronics B156HAN08.0 (AUO80ED), IPS, 1920x1080 | Asus Zephyrus S GX531GS AU Optronics B156HAN08.2 (AUO82ED), IPS, 1920x1080 | |
|---|---|---|---|---|---|
| Display | -1% | 2% | 1% | 1% | |
| Display P3 Coverage (%) | 64.2 | 63.5 -1% | 65.3 2% | 66.2 3% | 66.7 4% |
| sRGB Coverage (%) | 92.6 | 93.1 1% | 94.9 2% | 92.1 -1% | 91.2 -2% |
| AdobeRGB 1998 Coverage (%) | 65.7 | 64.5 -2% | 66.3 1% | 67.2 2% | 66.7 2% |
| Response Times | -63% | -57% | -67% | 9% | |
| Response Time Grey 50% / Grey 80% * (ms) | 8 ? | 16.4 ? -105% | 16.8 ? -110% | 17.6 ? -120% | 7.4 ? 7% |
| Response Time Black / White * (ms) | 11.2 ? | 13.6 ? -21% | 11.6 ? -4% | 12.8 ? -14% | 10 ? 11% |
| PWM Frequency (Hz) | |||||
| Screen | 15% | 7% | 14% | 11% | |
| Brightness middle (cd/m²) | 304 | 250 -18% | 314.7 4% | 254 -16% | 294 -3% |
| Brightness (cd/m²) | 299 | 235 -21% | 312 4% | 262 -12% | 275 -8% |
| Brightness Distribution (%) | 89 | 85 -4% | 90 1% | 89 0% | 84 -6% |
| Black Level * (cd/m²) | 0.27 | 0.29 -7% | 0.38 -41% | 0.22 19% | 0.24 11% |
| Contrast (:1) | 1126 | 862 -23% | 828 -26% | 1155 3% | 1225 9% |
| Colorchecker dE 2000 * | 4.66 | 1.46 69% | 2.56 45% | 2.37 49% | 2.57 45% |
| Colorchecker dE 2000 max. * | 9.65 | 2.47 74% | 4.89 49% | 4.71 51% | 4.88 49% |
| Colorchecker dE 2000 calibrated * | 1.72 | 1.71 1% | 1.84 -7% | 2.14 -24% | |
| Greyscale dE 2000 * | 5.53 | 1.27 77% | 3.4 39% | 1.58 71% | 2.41 56% |
| Gamma | 2.5 88% | 2.4 92% | 2.3 96% | 2.48 89% | 2.5 88% |
| CCT | 8028 81% | 6749 96% | 6435 101% | 6785 96% | 6370 102% |
| Color Space (Percent of AdobeRGB 1998) (%) | 60 | 60 0% | 60.7 1% | 60 0% | 59 -2% |
| Color Space (Percent of sRGB) (%) | 93 | 93 0% | 94.6 2% | 92 -1% | 91 -2% |
| Média Total (Programa/Configurações) | -16% /
1% | -16% /
-2% | -17% /
2% | 7% /
9% |
* ... menor é melhor
Exibir tempos de resposta
| ↔ Tempo de resposta preto para branco | ||
|---|---|---|
| 11.2 ms ... ascensão ↗ e queda ↘ combinadas | ↗ 6 ms ascensão | 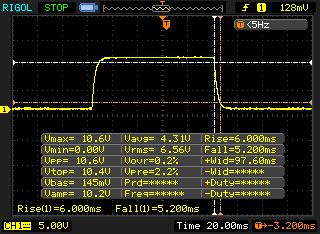 |
| ↘ 5.2 ms queda | ||
| A tela mostra boas taxas de resposta em nossos testes, mas pode ser muito lenta para jogadores competitivos. Em comparação, todos os dispositivos testados variam de 0.1 (mínimo) a 240 (máximo) ms. » 30 % de todos os dispositivos são melhores. Isso significa que o tempo de resposta medido é melhor que a média de todos os dispositivos testados (19.8 ms). | ||
| ↔ Tempo de resposta 50% cinza a 80% cinza | ||
| 8 ms ... ascensão ↗ e queda ↘ combinadas | ↗ 4 ms ascensão | 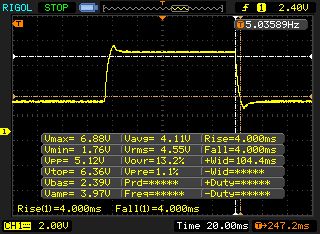 |
| ↘ 4 ms queda | ||
| A tela mostra taxas de resposta rápidas em nossos testes e deve ser adequada para jogos. Em comparação, todos os dispositivos testados variam de 0.165 (mínimo) a 636 (máximo) ms. » 21 % de todos os dispositivos são melhores. Isso significa que o tempo de resposta medido é melhor que a média de todos os dispositivos testados (31 ms). | ||
Cintilação da tela / PWM (modulação por largura de pulso)
| Tela tremeluzindo / PWM não detectado | 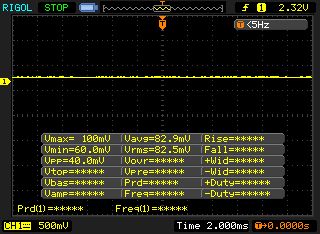 | ||
[pwm_comparison] Em comparação: 52 % de todos os dispositivos testados não usam PWM para escurecer a tela. Se PWM foi detectado, uma média de 7757 (mínimo: 5 - máximo: 343500) Hz foi medida. | |||
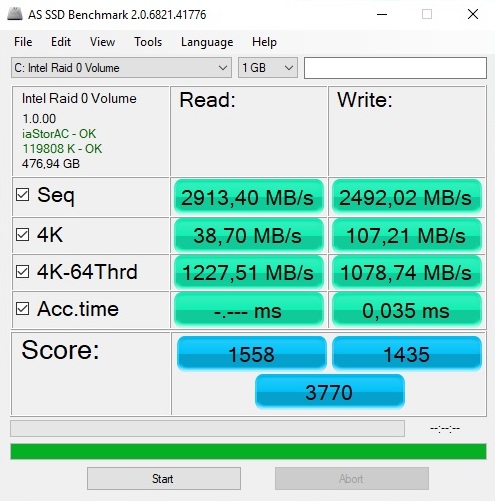
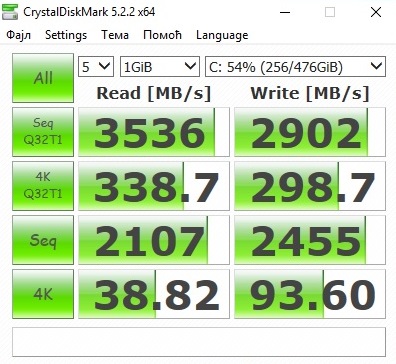
| Acer Predator Triton 500 2x WDC PC SN720 SDAPNTW-256G-1014 (RAID 0) | Gigabyte Aero 15-X9 Intel SSD 760p SSDPEKKW010T8 | Razer Blade 15 RTX 2070 Max-Q Samsung SSD PM981 MZVLB512HAJQ | MSI GS65 8RF-019DE Stealth Thin Samsung SSD PM981 MZVLB512HAJQ | Asus Zephyrus S GX531GS WDC PC SN520 SDAPNUW-512G | |
|---|---|---|---|---|---|
| AS SSD | -16% | 1% | -3% | -21% | |
| Score Total (Points) | 3770 | 2722 -28% | 4079 8% | 4122 9% | 3294 -13% |
| Seq Write (MB/s) | 2492 | 1471 -41% | 1822 -27% | 1834 -26% | 1261 -49% |
| Seq Read (MB/s) | 2913 | 2113 -27% | 1840 -37% | 1266 -57% | 903 -69% |
| 4K Write (MB/s) | 107.2 | 107.1 0% | 110.7 3% | 107.2 0% | 103.6 -3% |
| 4K Read (MB/s) | 38.7 | 55 42% | 52.3 35% | 48.94 26% | 40.02 3% |
| Score Write (Points) | 1435 | 957 -33% | 2010 40% | 2051 43% | 1515 6% |
| Score Read (Points) | 1558 | 1180 -24% | 1362 -13% | 1346 -14% | 1161 -25% |

| 3DMark 11 Performance | 20149 pontos | |
Ajuda | ||
| The Witcher 3 | |
| 1920x1080 High Graphics & Postprocessing (Nvidia HairWorks Off) | |
| Média da turma Gaming (341 - 404, n=2, últimos 2 anos) | |
| Acer Predator Triton 500 | |
| Razer Blade 15 RTX 2070 Max-Q | |
| MSI GS65 8RF-019DE Stealth Thin | |
| Asus Zephyrus S GX531GS | |
| Gigabyte Aero 15-X9 | |
| 1920x1080 Ultra Graphics & Postprocessing (HBAO+) | |
| Média da turma Gaming (104.7 - 240, n=7, últimos 2 anos) | |
| Acer Predator Triton 500 | |
| Razer Blade 15 RTX 2070 Max-Q | |
| Gigabyte Aero 15-X9 | |
| MSI GS65 8RF-019DE Stealth Thin | |
| Asus Zephyrus S GX531GS | |
| baixo | média | alto | ultra | |
|---|---|---|---|---|
| The Witcher 3 (2015) | 136 | 76.5 | ||
| Battlefield 1 (2016) | 134 | 129 | ||
| Assassin´s Creed Origins (2017) | 65 | 62 |
Barulho
| Ocioso |
| 30 / 32 / 34 dB |
| Carga |
| 44 / 47 dB |
 | ||
30 dB silencioso 40 dB(A) audível 50 dB(A) ruidosamente alto |
||
min: | ||
| Acer Predator Triton 500 GeForce RTX 2080 Max-Q, i7-8750H | Gigabyte Aero 15-X9 GeForce RTX 2070 Max-Q, i7-8750H | Razer Blade 15 RTX 2070 Max-Q GeForce RTX 2070 Max-Q, i7-8750H | MSI GS65 8RF-019DE Stealth Thin GeForce GTX 1070 Max-Q, i7-8750H | Asus Zephyrus S GX531GS GeForce GTX 1070 Max-Q, i7-8750H | Média da turma Gaming | |
|---|---|---|---|---|---|---|
| Noise | -2% | 9% | 2% | -9% | 7% | |
| desligado / ambiente * (dB) | 29 | 30 -3% | 28.8 1% | 30 -3% | 29 -0% | 24.1 ? 17% |
| Idle Minimum * (dB) | 30 | 32 -7% | 28.8 4% | 30 -0% | 33 -10% | 26 ? 13% |
| Idle Average * (dB) | 32 | 34 -6% | 28.8 10% | 31 3% | 34 -6% | 27.4 ? 14% |
| Idle Maximum * (dB) | 34 | 36 -6% | 29.4 14% | 34 -0% | 40 -18% | 30.1 ? 11% |
| Load Average * (dB) | 44 | 42 5% | 35.7 19% | 43 2% | 47 -7% | 43.6 ? 1% |
| Witcher 3 ultra * (dB) | 46 | 44 4% | 42.5 8% | 42 9% | 51 -11% | |
| Load Maximum * (dB) | 47 | 48 -2% | 45 4% | 44 6% | 53 -13% | 54.2 ? -15% |
* ... menor é melhor
(-) A temperatura máxima no lado superior é 49 °C / 120 F, em comparação com a média de 40.4 °C / 105 F , variando de 21.2 a 68.8 °C para a classe Gaming.
(-) A parte inferior aquece até um máximo de 58 °C / 136 F, em comparação com a média de 43.2 °C / 110 F
(+) Em uso inativo, a temperatura média para o lado superior é 30.2 °C / 86 F, em comparação com a média do dispositivo de 33.9 °C / ### class_avg_f### F.
(-) Jogando The Witcher 3, a temperatura média para o lado superior é 42.8 °C / 109 F, em comparação com a média do dispositivo de 33.9 °C / ## #class_avg_f### F.
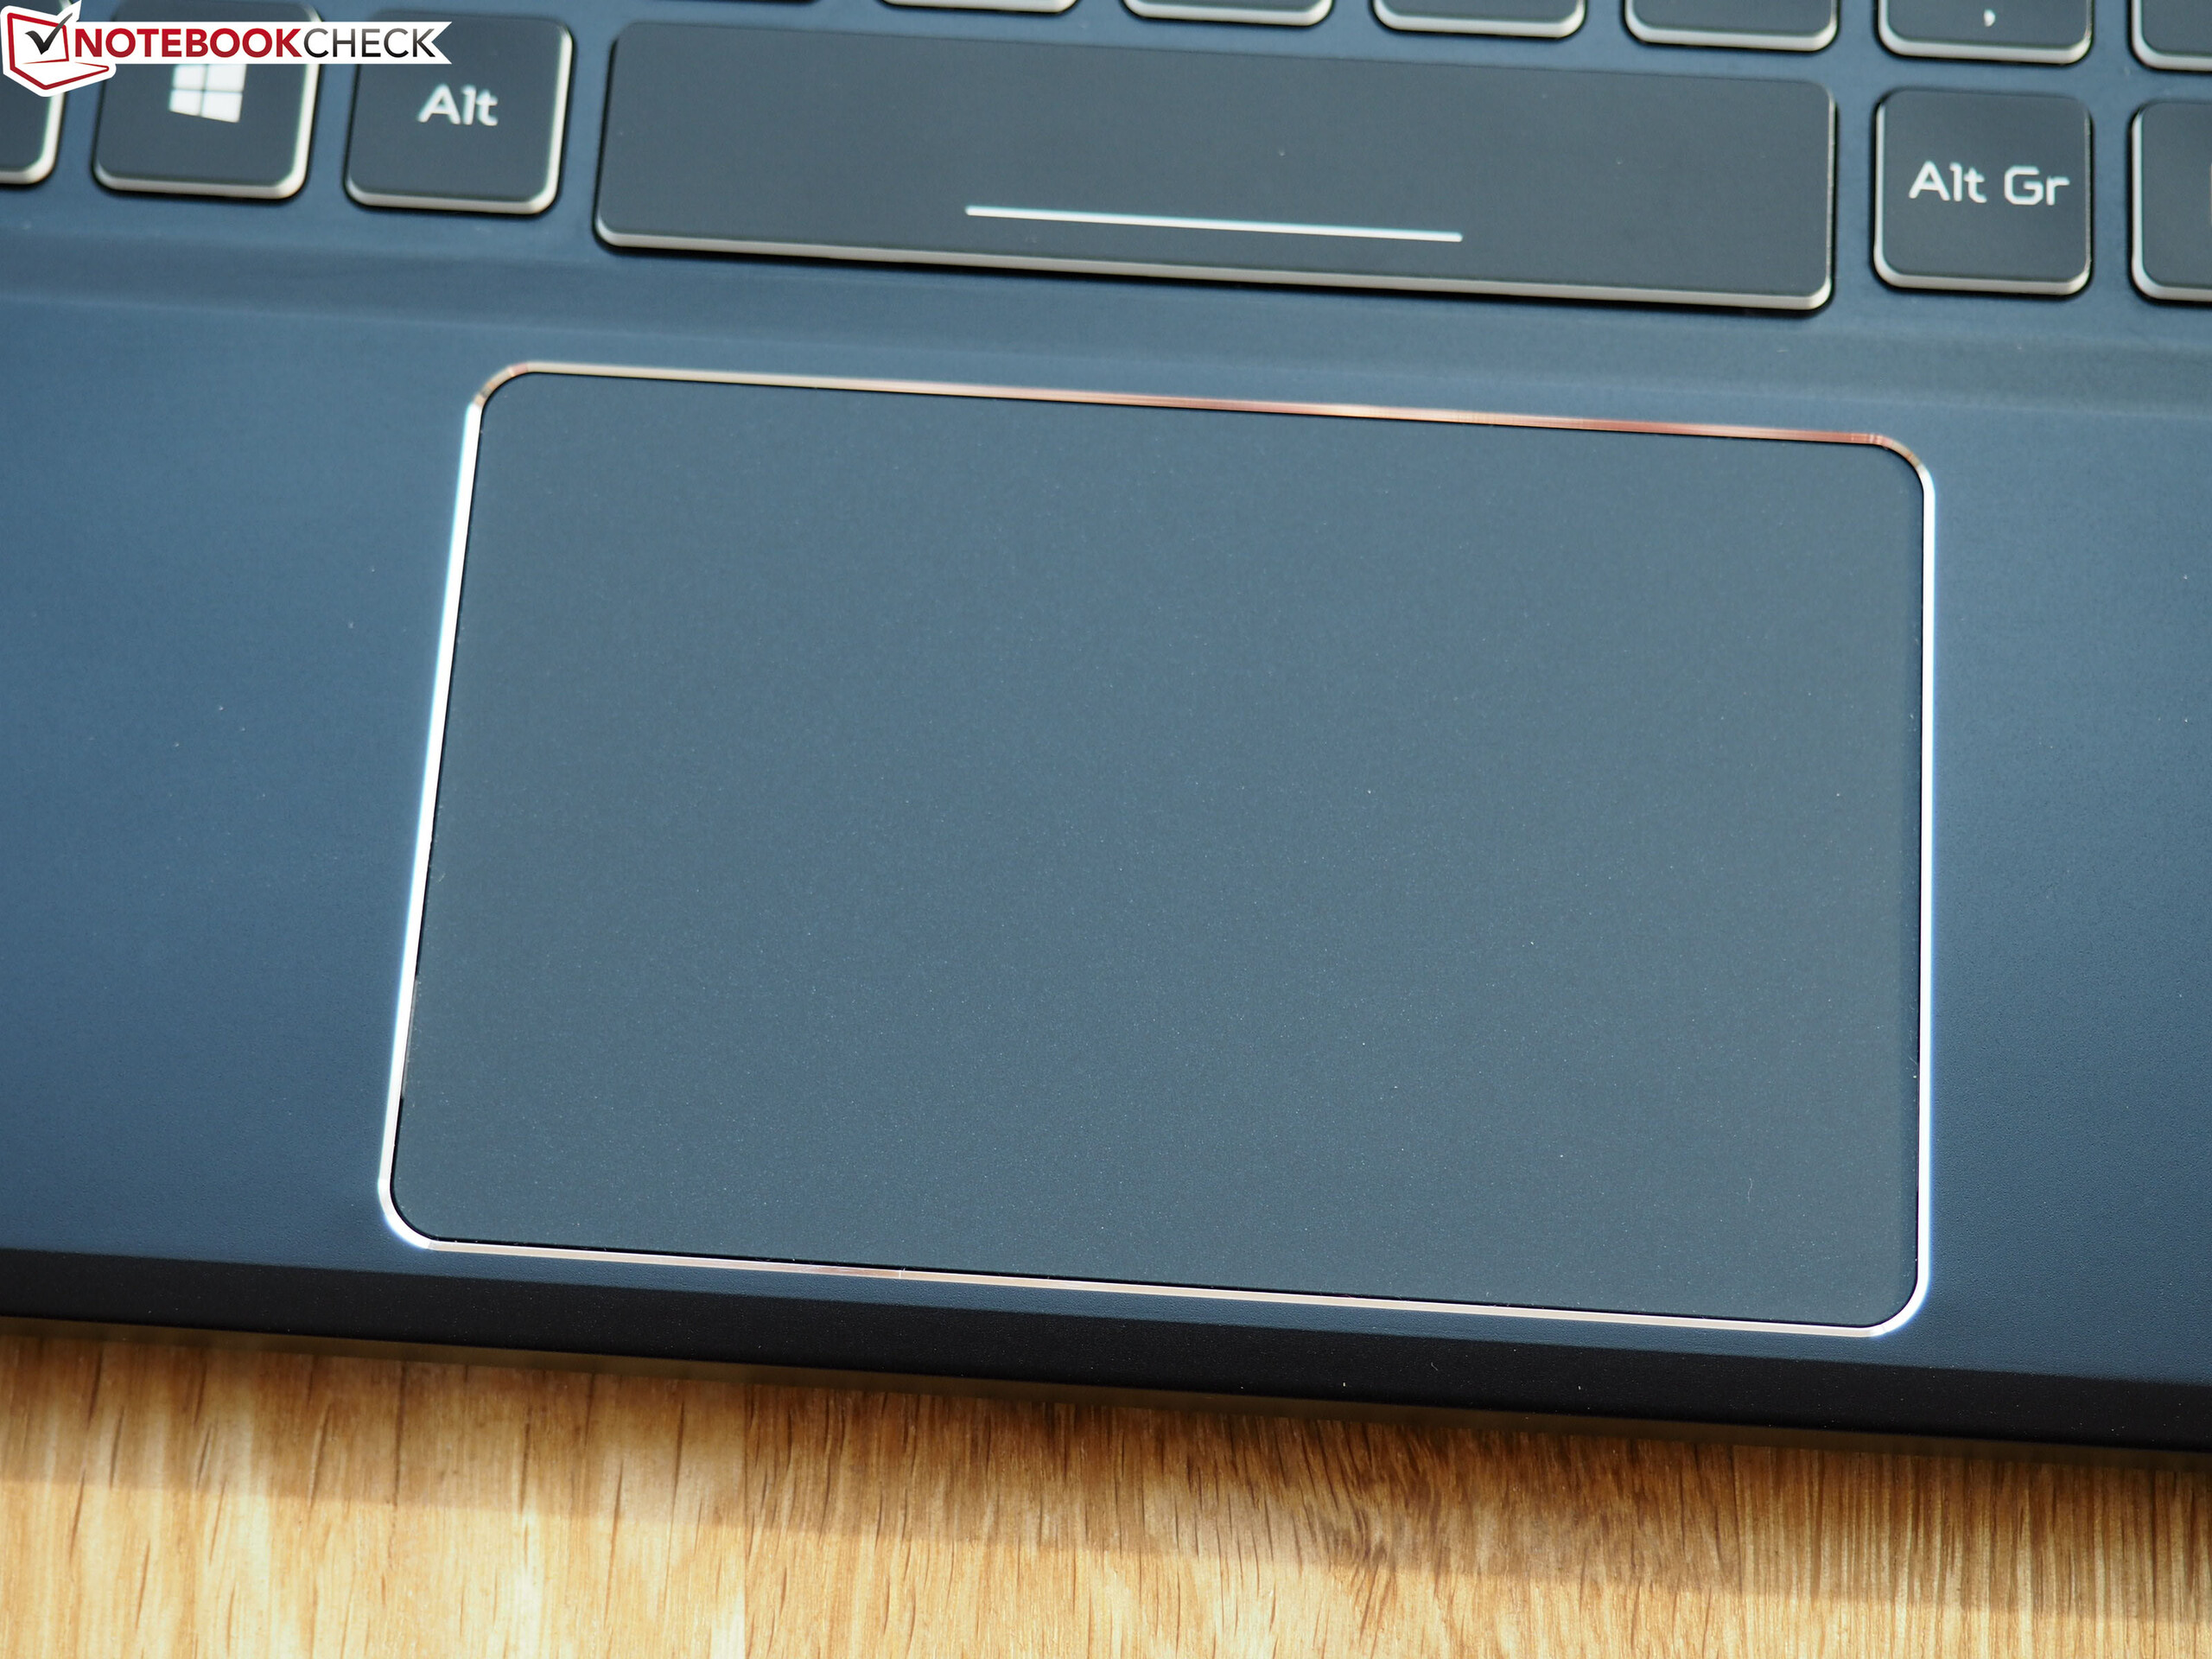
(±) Os apoios para as mãos e o touchpad podem ficar muito quentes ao toque, com um máximo de 39 °C / 102.2 F.
(-) A temperatura média da área do apoio para as mãos de dispositivos semelhantes foi 28.8 °C / 83.8 F (-10.2 °C / -18.4 F).
| Acer Predator Triton 500 GeForce RTX 2080 Max-Q, i7-8750H | Gigabyte Aero 15-X9 GeForce RTX 2070 Max-Q, i7-8750H | Razer Blade 15 RTX 2070 Max-Q GeForce RTX 2070 Max-Q, i7-8750H | MSI GS65 8RF-019DE Stealth Thin GeForce GTX 1070 Max-Q, i7-8750H | Asus Zephyrus S GX531GS GeForce GTX 1070 Max-Q, i7-8750H | Média da turma Gaming | |
|---|---|---|---|---|---|---|
| Heat | 2% | 14% | 11% | 1% | 7% | |
| Maximum Upper Side * (°C) | 49 | 56 -14% | 49 -0% | 49 -0% | 54 -10% | 45.2 ? 8% |
| Maximum Bottom * (°C) | 58 | 66 -14% | 49 16% | 63 -9% | 60 -3% | 48.1 ? 17% |
| Idle Upper Side * (°C) | 33 | 27 18% | 25.4 23% | 24 27% | 30 9% | 31 ? 6% |
| Idle Bottom * (°C) | 33 | 27 18% | 27.2 18% | 25 24% | 30 9% | 34.2 ? -4% |
* ... menor é melhor
Acer Predator Triton 500 análise de áudio
(±) | o volume do alto-falante é médio, mas bom (###valor### dB)
Graves 100 - 315Hz
(±) | graves reduzidos - em média 13% menor que a mediana
(±) | a linearidade dos graves é média (12.3% delta para a frequência anterior)
Médios 400 - 2.000 Hz
(+) | médios equilibrados - apenas 3.8% longe da mediana
(+) | médios são lineares (5.3% delta para frequência anterior)
Altos 2 - 16 kHz
(+) | agudos equilibrados - apenas 2.3% longe da mediana
(+) | os máximos são lineares (4.7% delta da frequência anterior)
Geral 100 - 16.000 Hz
(+) | o som geral é linear (14.5% diferença em relação à mediana)
Comparado com a mesma classe
» 27% de todos os dispositivos testados nesta classe foram melhores, 7% semelhantes, 66% piores
» O melhor teve um delta de 6%, a média foi 18%, o pior foi 132%
Comparado com todos os dispositivos testados
» 18% de todos os dispositivos testados foram melhores, 4% semelhantes, 77% piores
» O melhor teve um delta de 4%, a média foi 23%, o pior foi 134%
Acer Predator Triton 700 análise de áudio
(+) | os alto-falantes podem tocar relativamente alto (###valor### dB)
Graves 100 - 315Hz
(-) | quase nenhum baixo - em média 15.2% menor que a mediana
(±) | a linearidade dos graves é média (10.1% delta para a frequência anterior)
Médios 400 - 2.000 Hz
(±) | médios mais altos - em média 8% maior que a mediana
(+) | médios são lineares (6.7% delta para frequência anterior)
Altos 2 - 16 kHz
(+) | agudos equilibrados - apenas 2% longe da mediana
(+) | os máximos são lineares (4.9% delta da frequência anterior)
Geral 100 - 16.000 Hz
(±) | a linearidade do som geral é média (19.9% diferença em relação à mediana)
Comparado com a mesma classe
» 70% de todos os dispositivos testados nesta classe foram melhores, 6% semelhantes, 24% piores
» O melhor teve um delta de 6%, a média foi 18%, o pior foi 132%
Comparado com todos os dispositivos testados
» 51% de todos os dispositivos testados foram melhores, 7% semelhantes, 42% piores
» O melhor teve um delta de 4%, a média foi 23%, o pior foi 134%
| desligado | |
| Ocioso | |
| Carga |
|
Key:
min: | |
| Acer Predator Triton 500 GeForce RTX 2080 Max-Q, i7-8750H | Gigabyte Aero 15-X9 GeForce RTX 2070 Max-Q, i7-8750H | Razer Blade 15 RTX 2070 Max-Q GeForce RTX 2070 Max-Q, i7-8750H | MSI GS65 8RF-019DE Stealth Thin GeForce GTX 1070 Max-Q, i7-8750H | Asus Zephyrus S GX531GS GeForce GTX 1070 Max-Q, i7-8750H | Média da turma Gaming | |
|---|---|---|---|---|---|---|
| Power Consumption | 11% | 18% | 23% | -7% | -4% | |
| Idle Minimum * (Watt) | 16 | 16 -0% | 10.4 35% | 7 56% | 17 -6% | 13 ? 19% |
| Idle Average * (Watt) | 22 | 18 18% | 14.6 34% | 11 50% | 20 9% | 19 ? 14% |
| Idle Maximum * (Watt) | 32 | 23 28% | 16.3 49% | 20 37% | 29 9% | 24.6 ? 23% |
| Load Average * (Watt) | 89 | 88 1% | 88.5 1% | 98 -10% | 112 -26% | 110.7 ? -24% |
| Witcher 3 ultra * (Watt) | 147 | 120 18% | 155.4 -6% | 132 10% | 152 -3% | |
| Load Maximum * (Watt) | 173 | 167 3% | 182.4 -5% | 182 -5% | 211 -22% | 259 ? -50% |
* ... menor é melhor
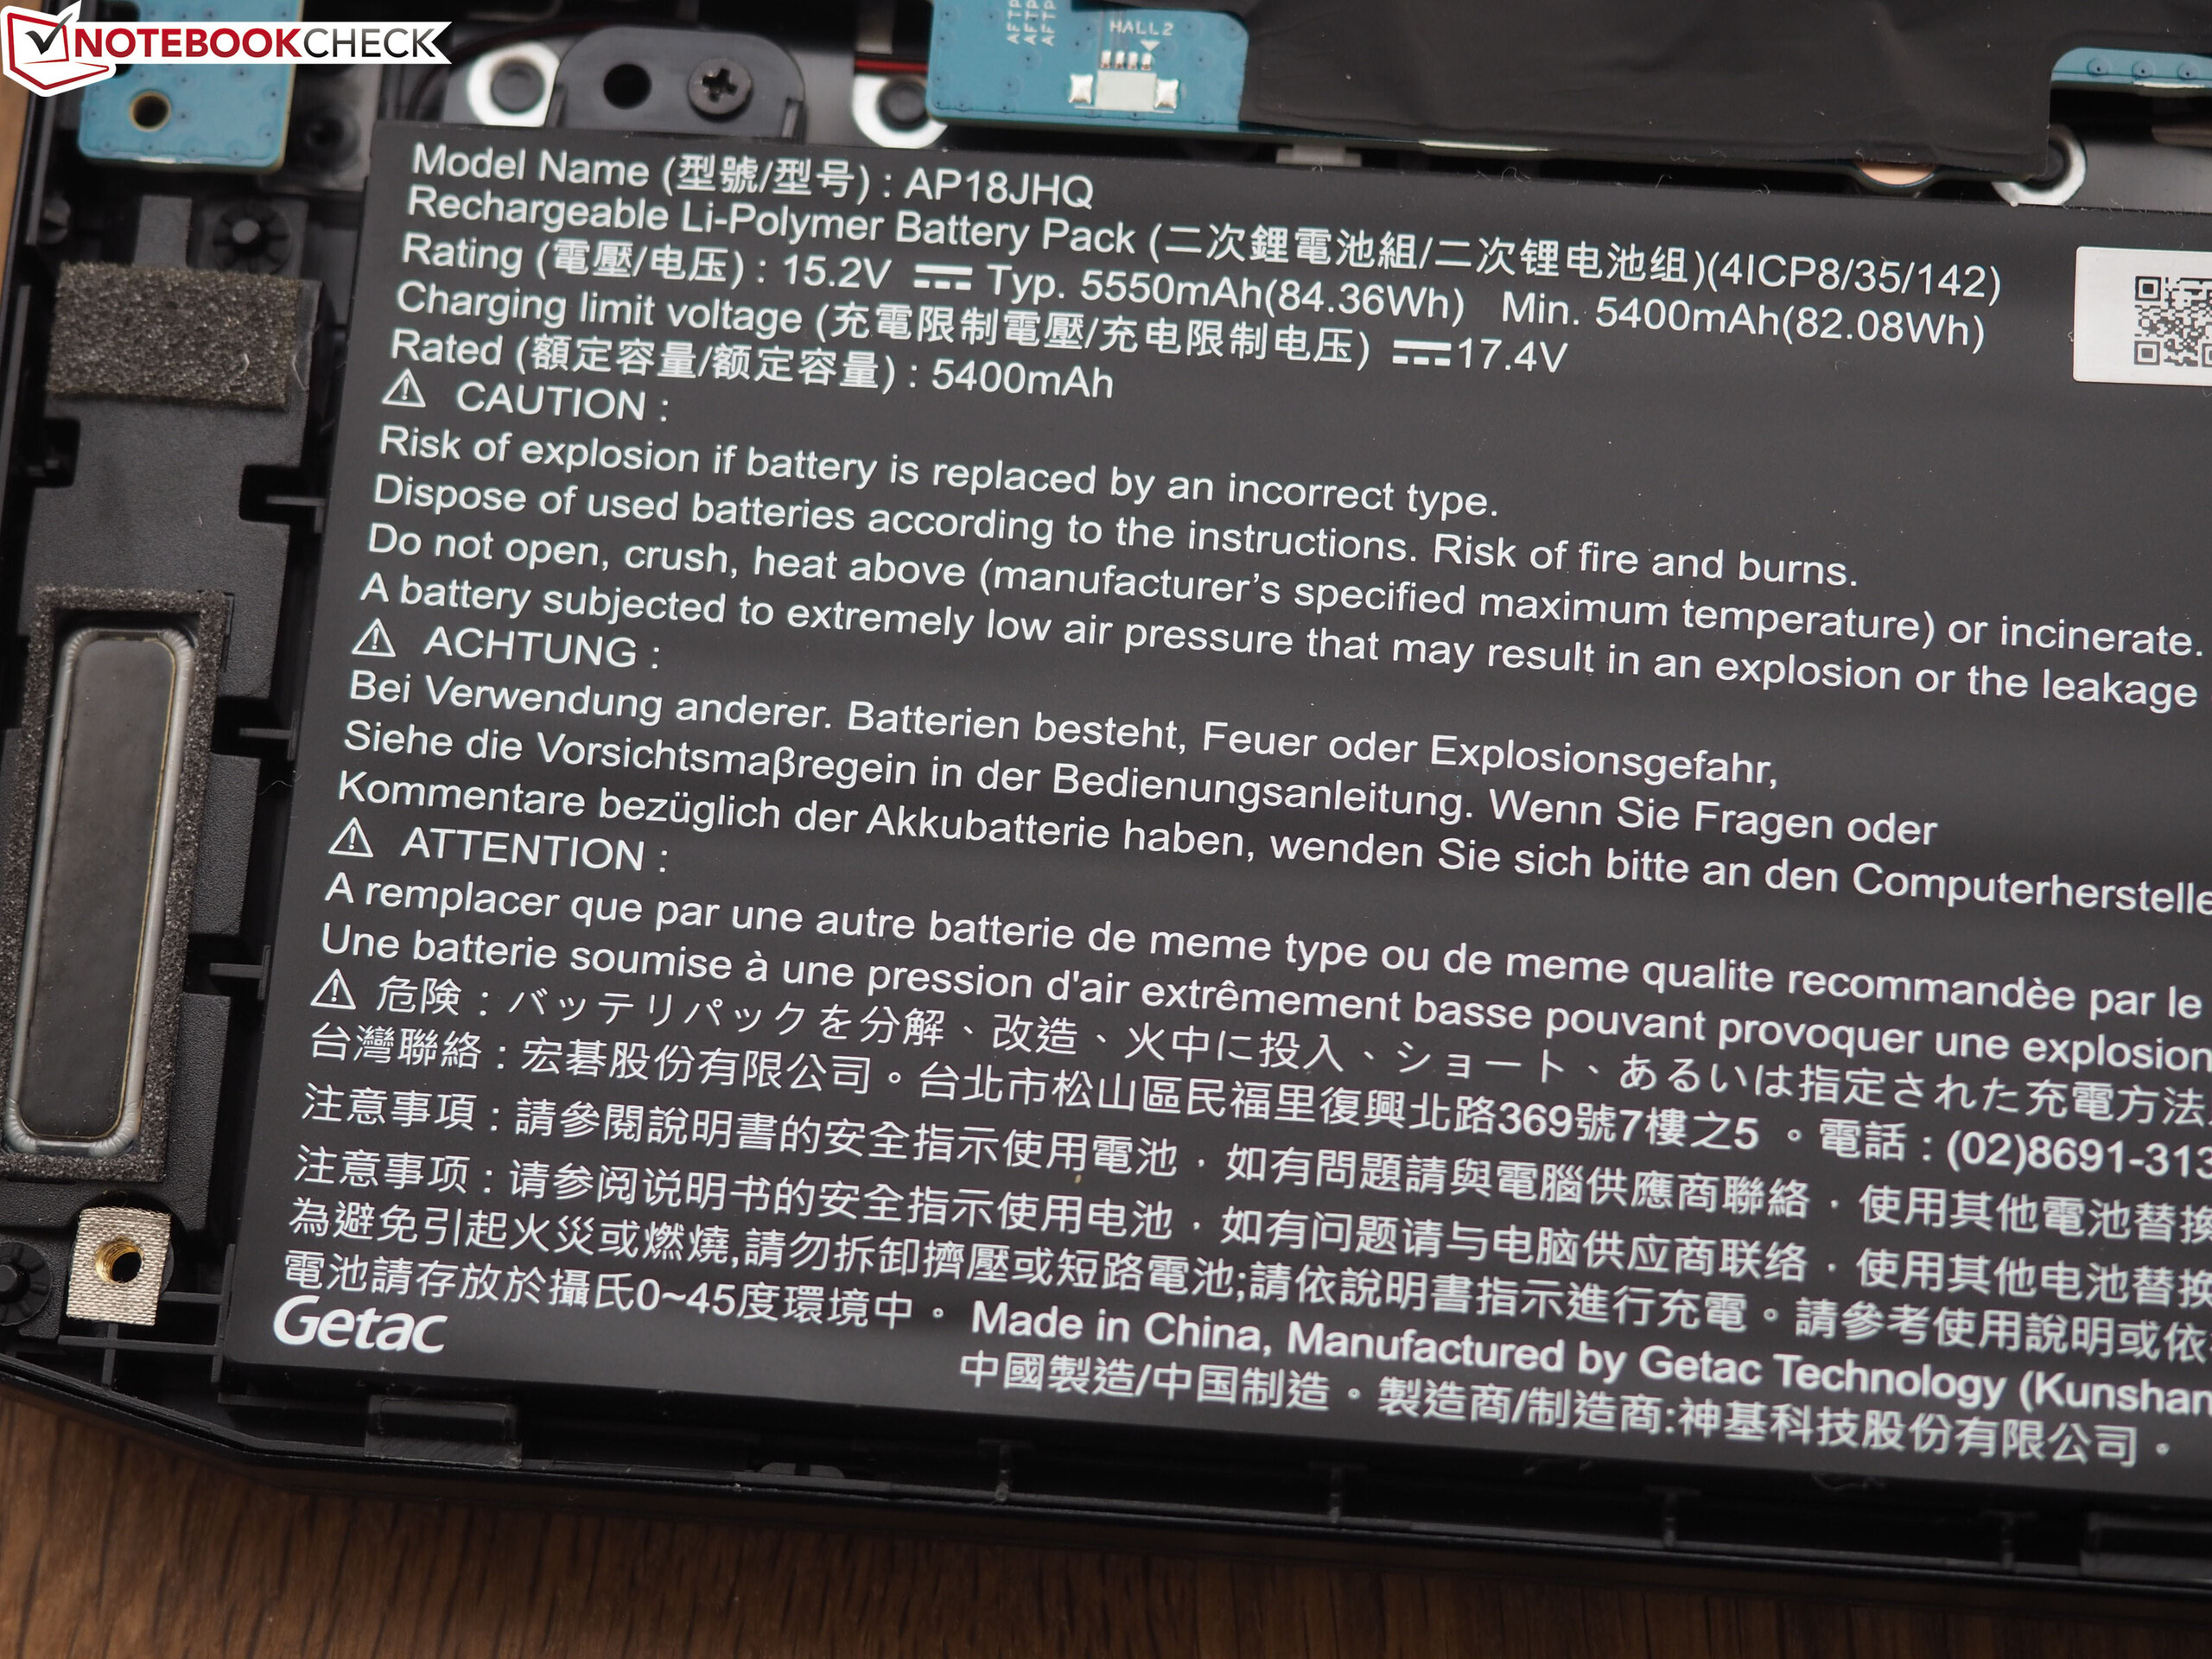
| Acer Predator Triton 500 GeForce RTX 2080 Max-Q, i7-8750H, 82 Wh | Gigabyte Aero 15-X9 GeForce RTX 2070 Max-Q, i7-8750H, 94.24 Wh | Razer Blade 15 RTX 2070 Max-Q GeForce RTX 2070 Max-Q, i7-8750H, 80 Wh | MSI GS65 8RF-019DE Stealth Thin GeForce GTX 1070 Max-Q, i7-8750H, 82 Wh | Asus Zephyrus S GX531GS GeForce GTX 1070 Max-Q, i7-8750H, 50 Wh | Média da turma Gaming | |
|---|---|---|---|---|---|---|
| Duração da bateria | 90% | 71% | 47% | -35% | 59% | |
| Reader / Idle (h) | 5.6 | 9.2 64% | 11.4 104% | 8.5 52% | 3.6 -36% | 8.27 ? 48% |
| WiFi v1.3 (h) | 3.2 | 6.4 100% | 6.5 103% | 6 88% | 2.6 -19% | 7.11 ? 122% |
| Load (h) | 1.4 | 2.9 107% | 1.5 7% | 1.4 0% | 0.7 -50% | 1.502 ? 7% |
| H.264 (h) | 6.1 | 5.9 | 8.32 ? |
Pro
Contra
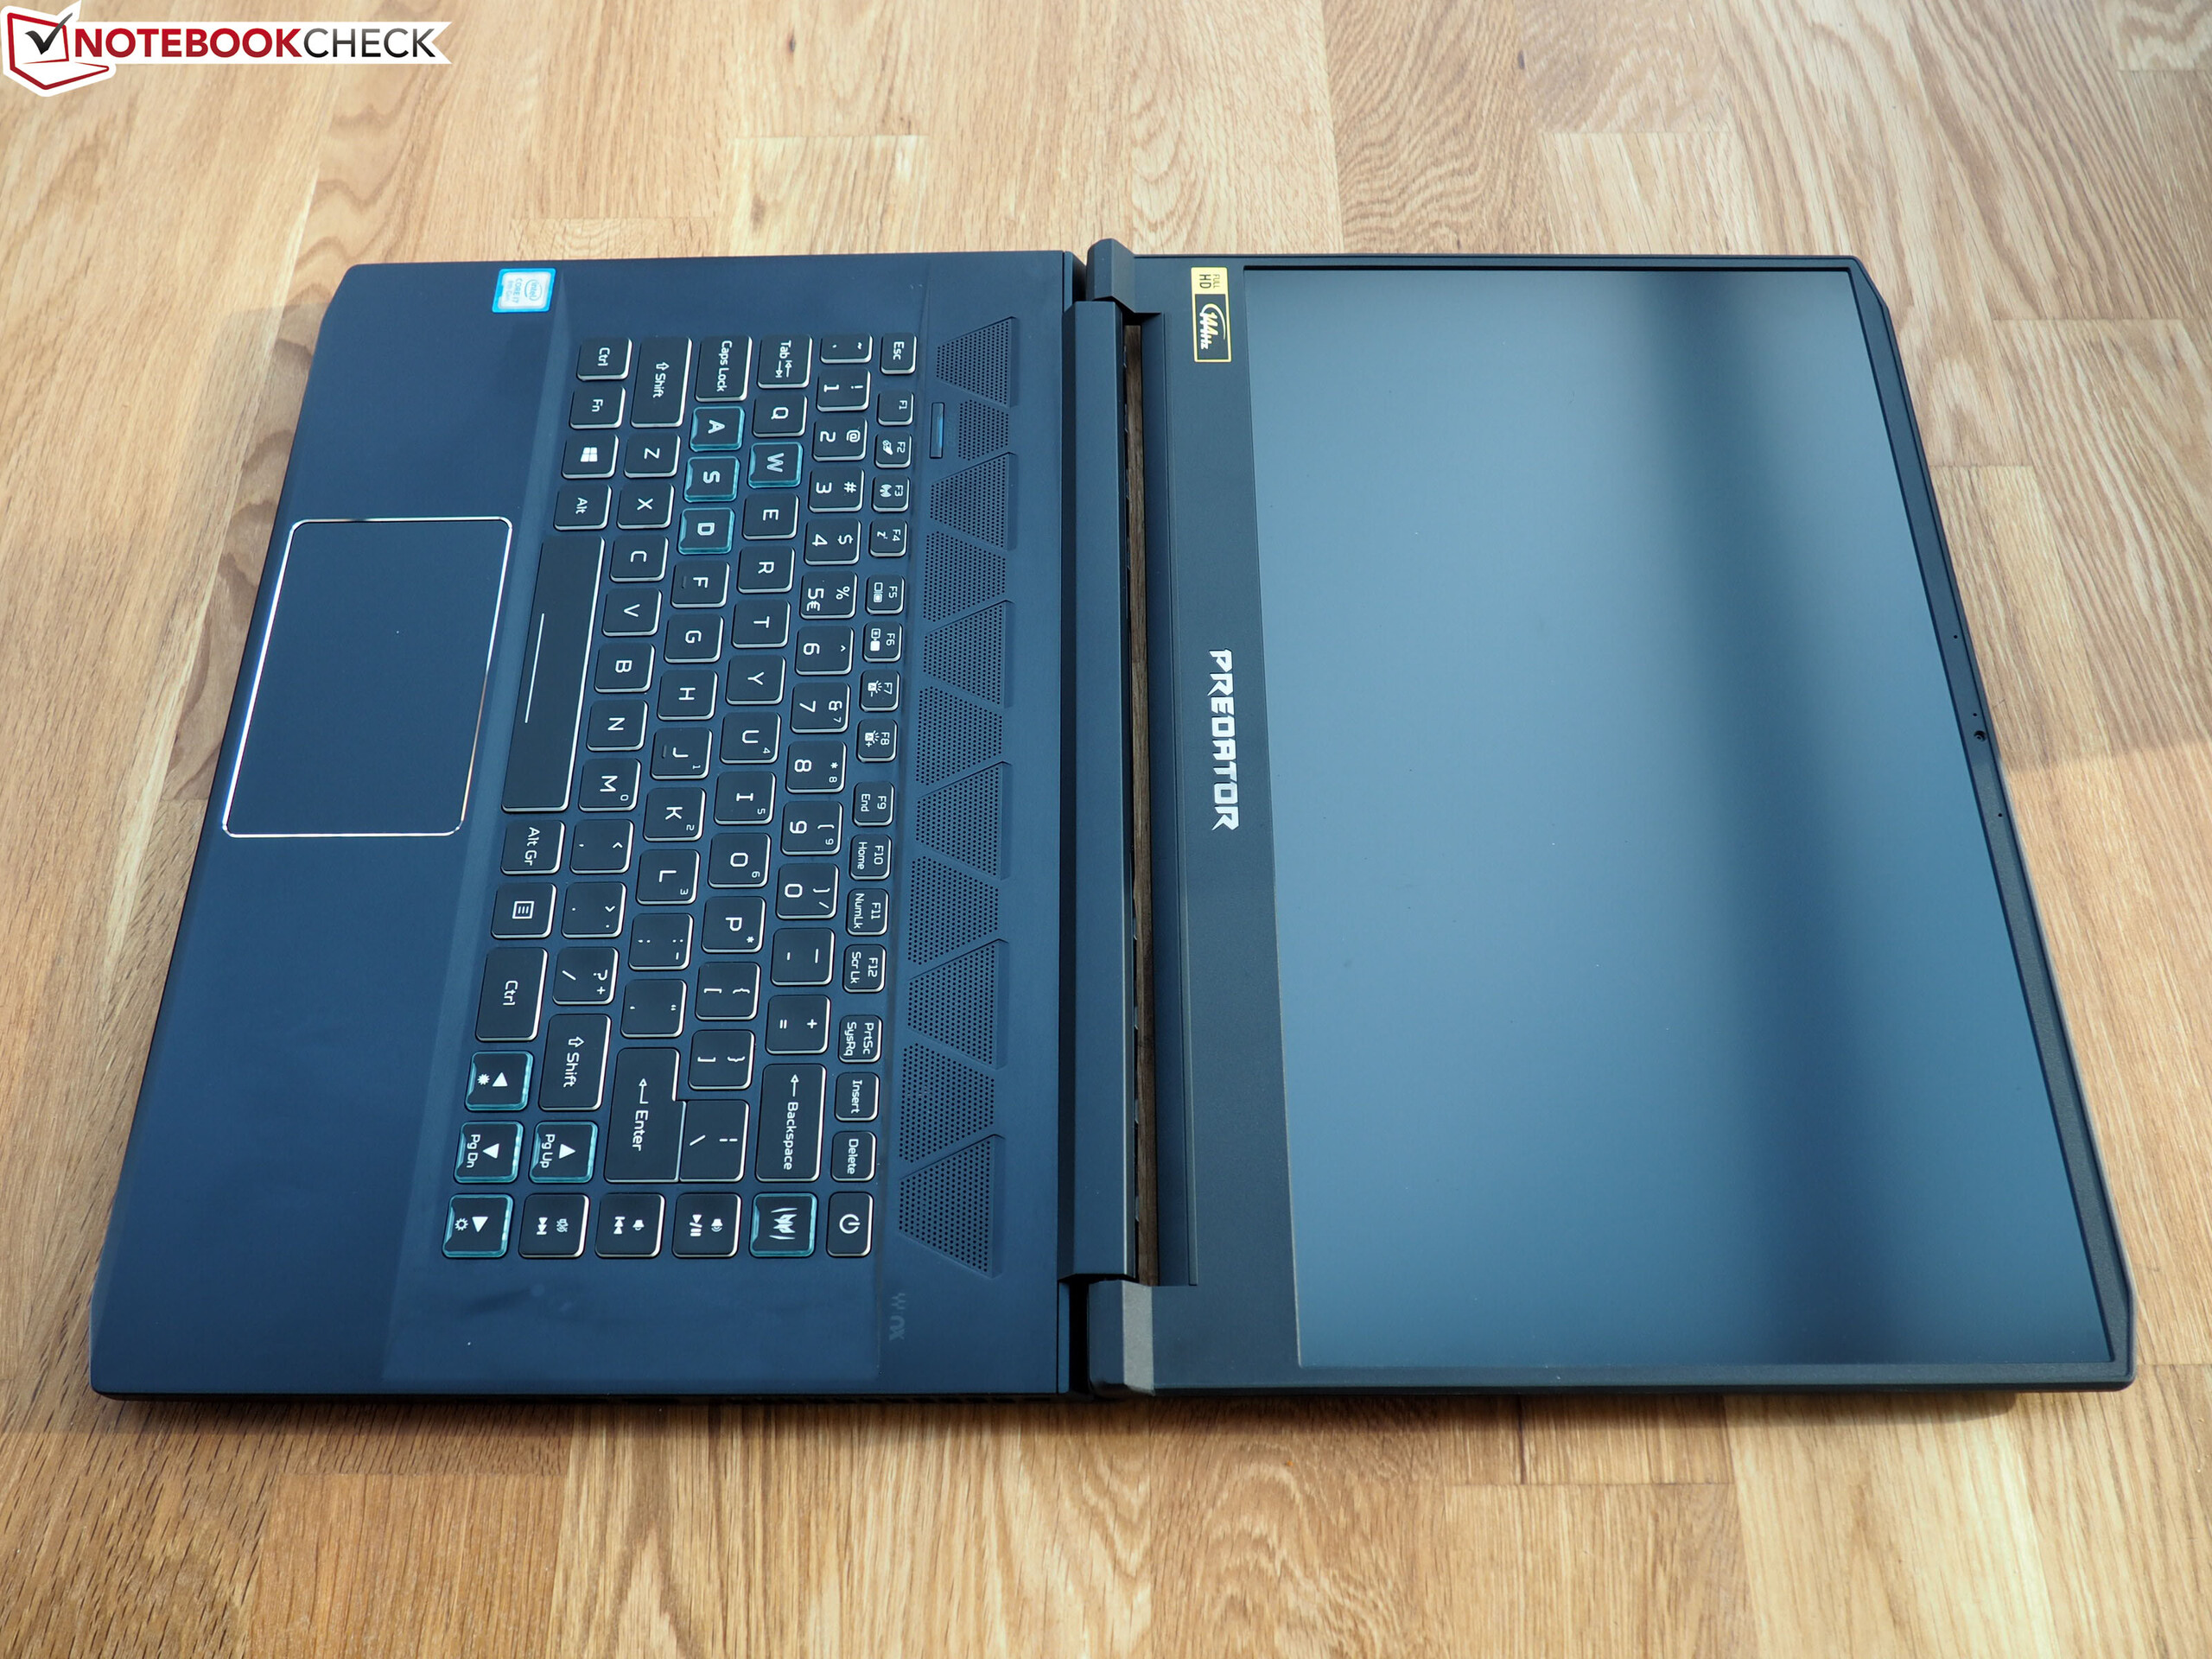
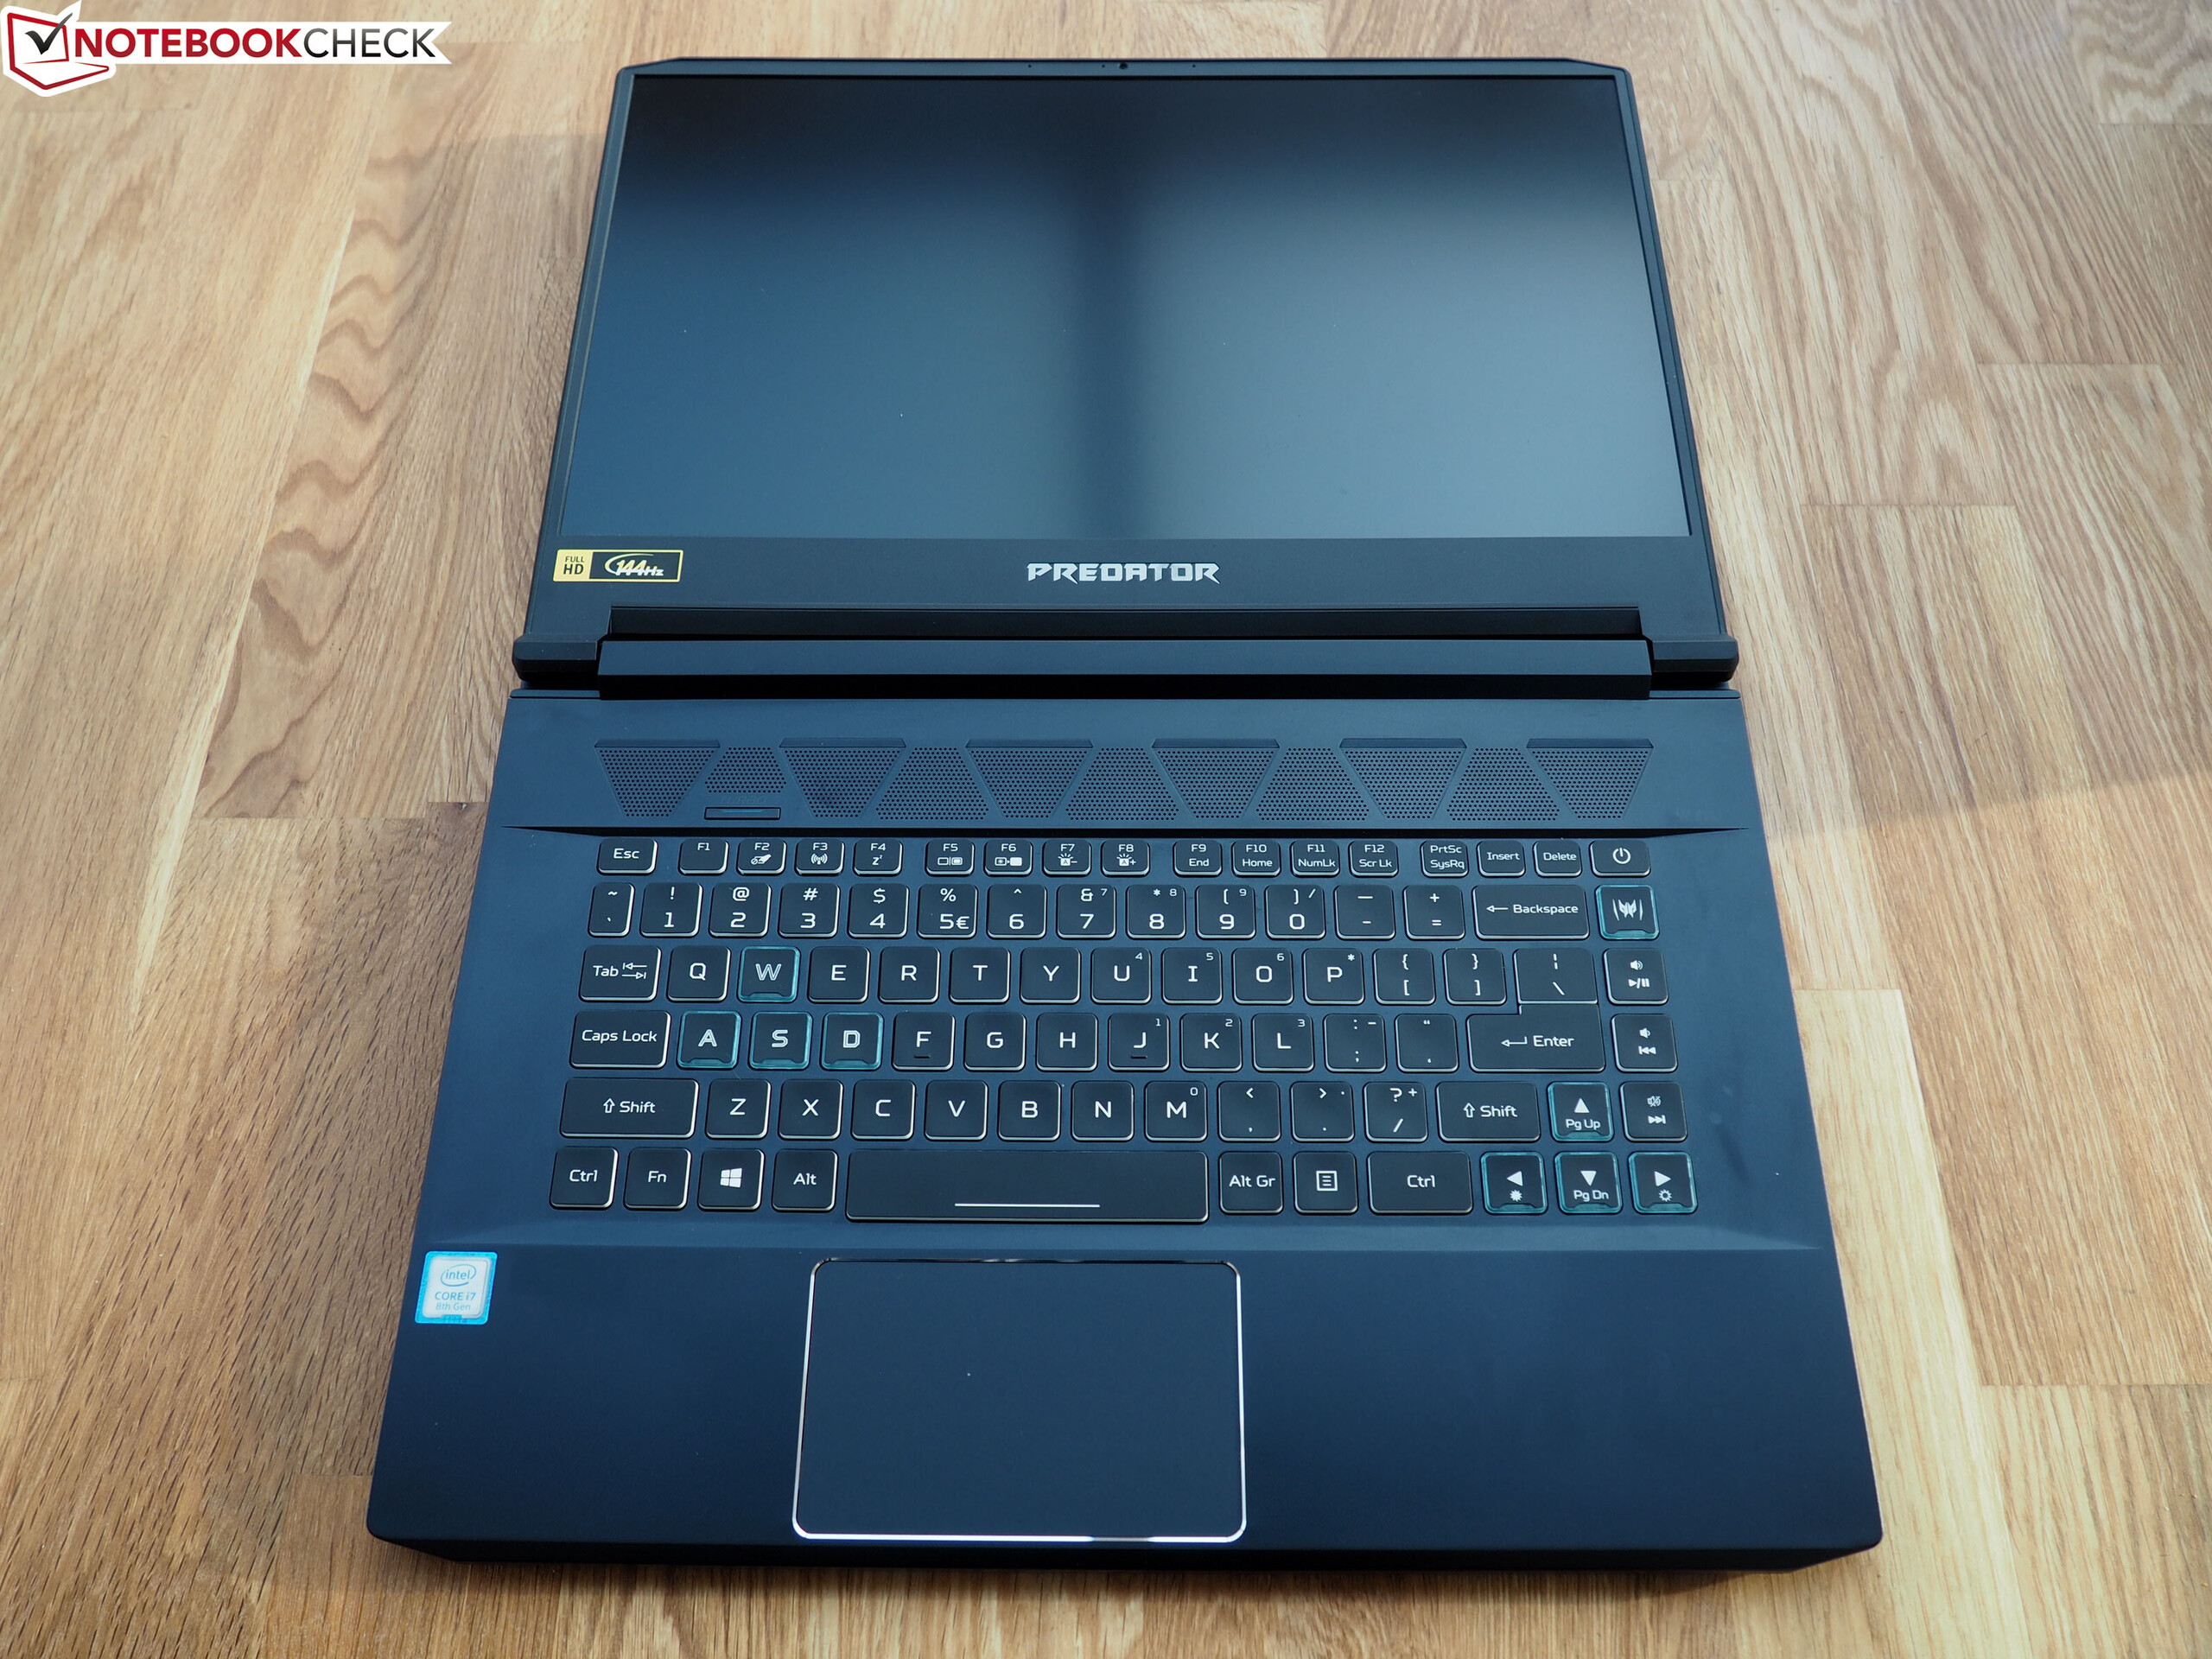
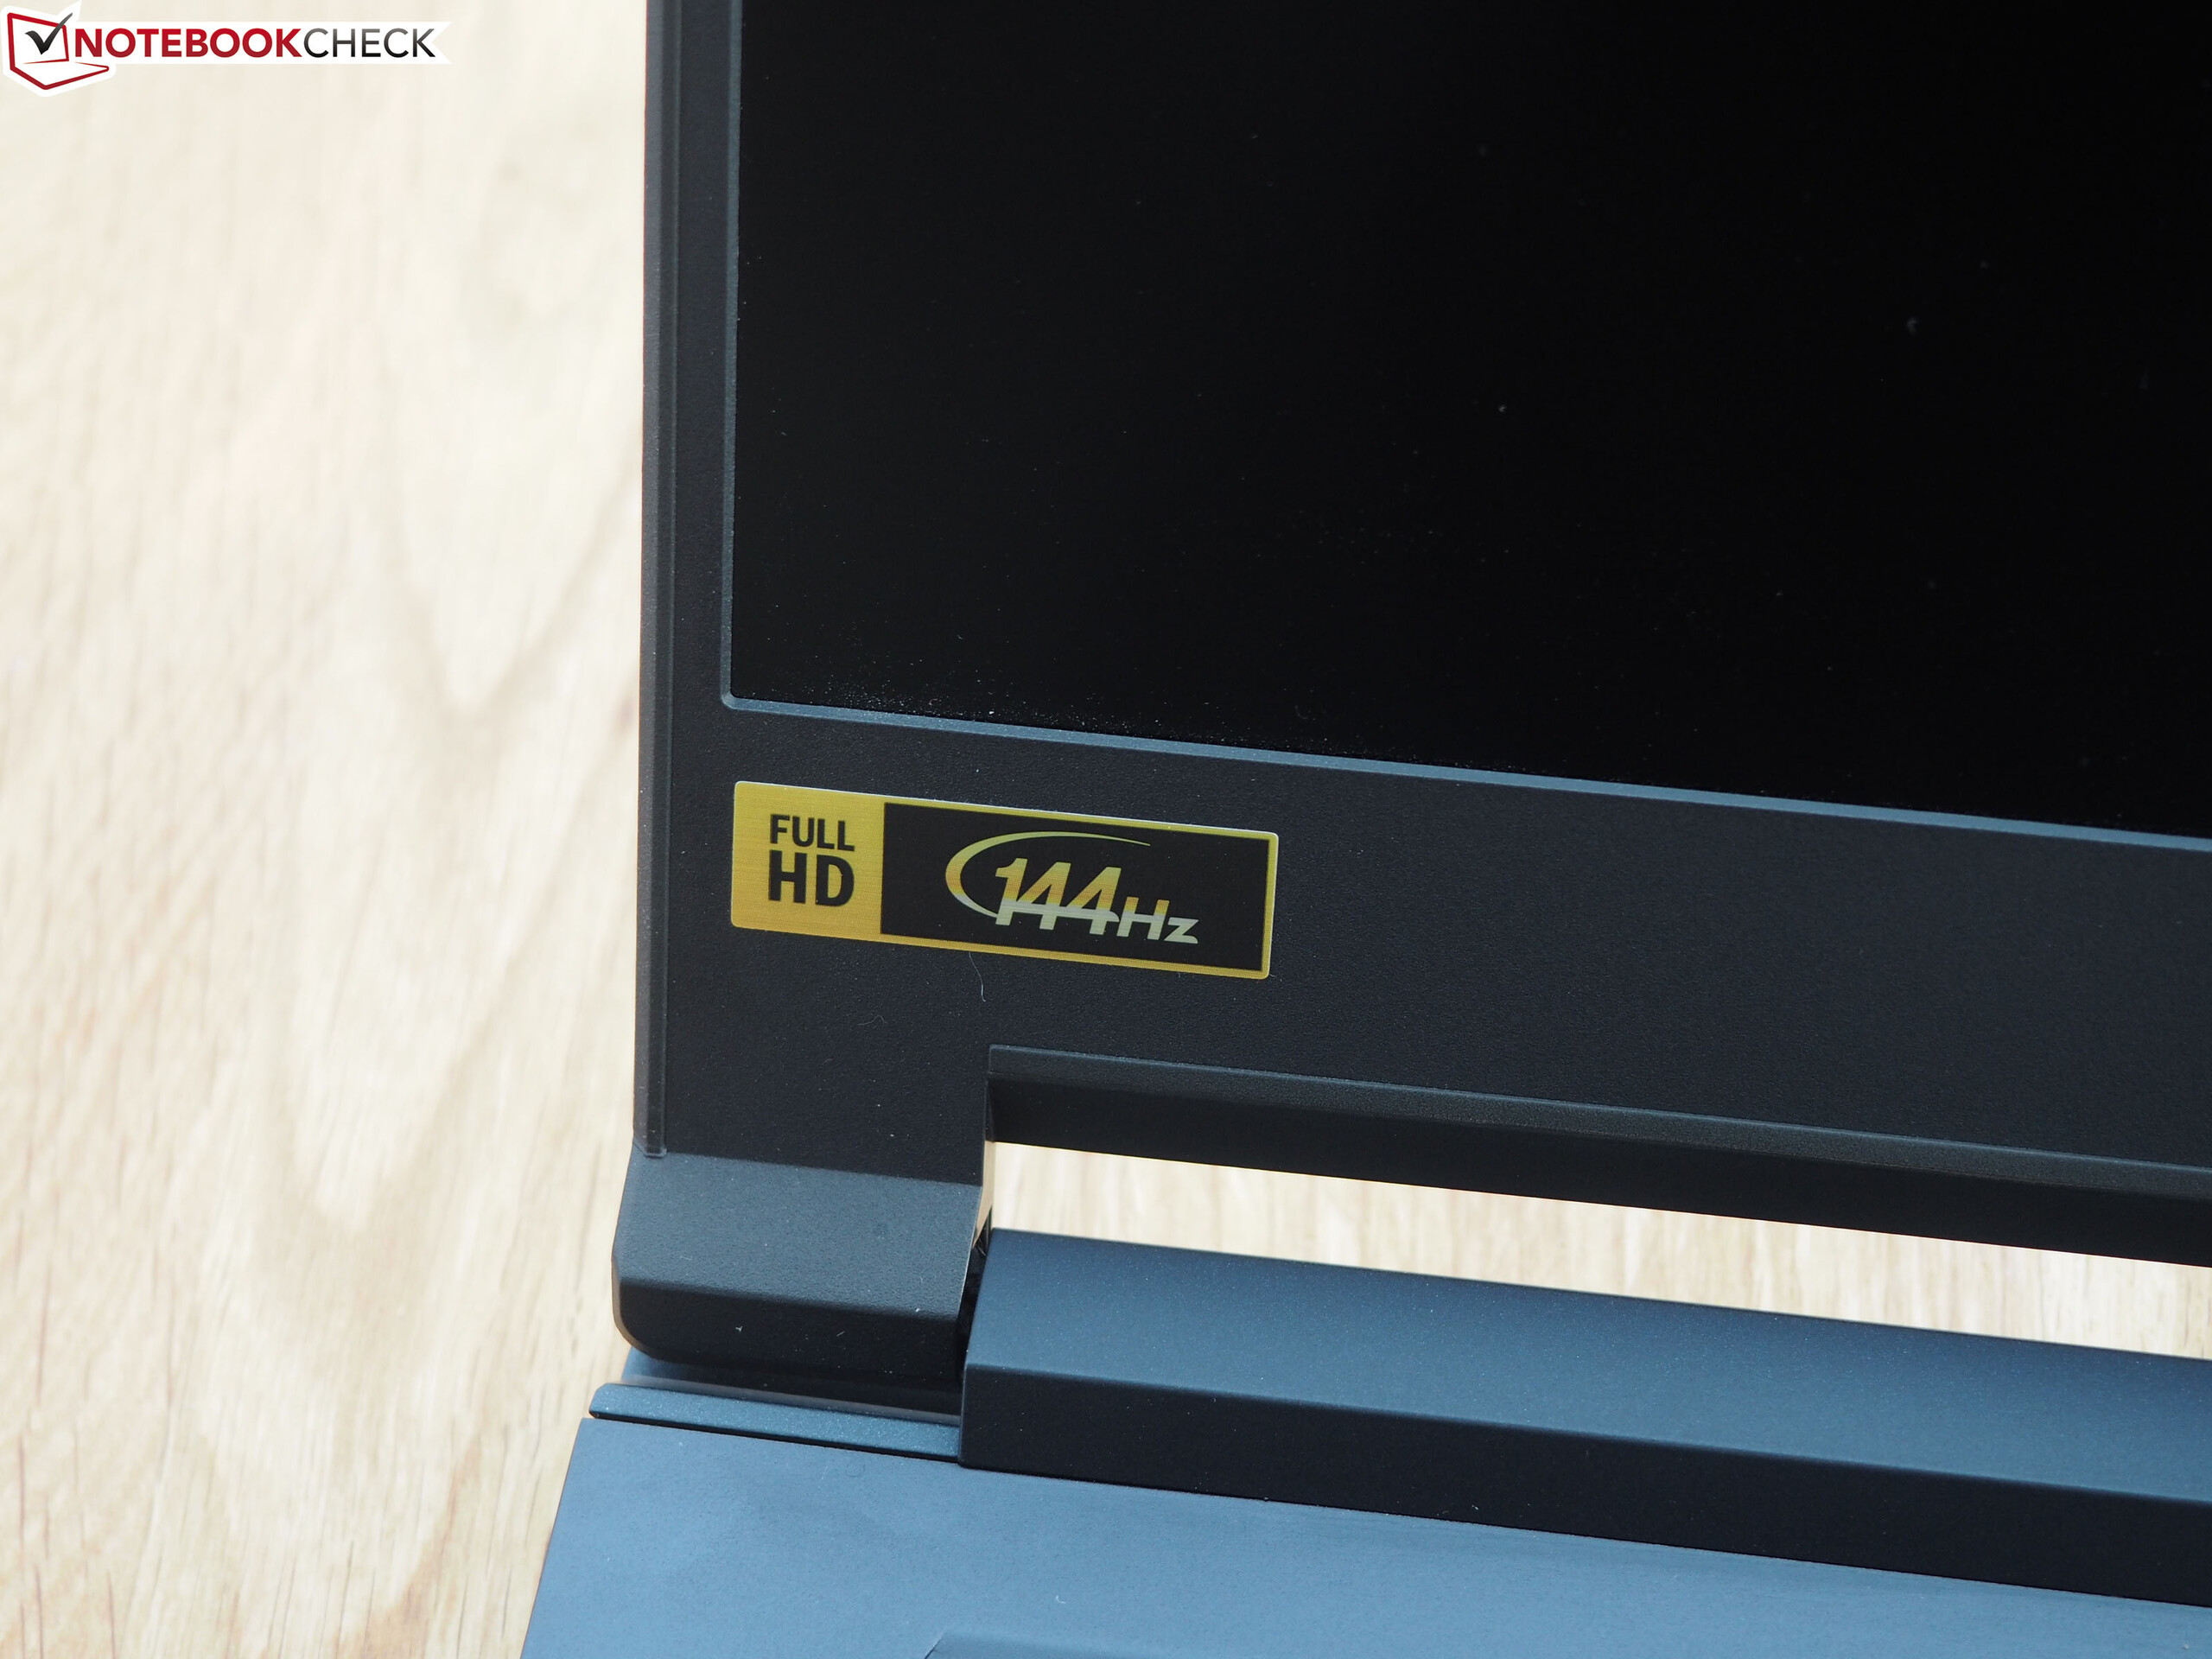
O Acer Predator Triton 500 perde uma avaliação "muito boa". O portátil de 15 polegadas preenche quase todos os critérios que distinguem um portátil moderno para jogos. Além da tela com marcos finos e carcaça fina, devemos também mencionar o painel de 144 Hz aqui, que ganha pontos com G-Sync.
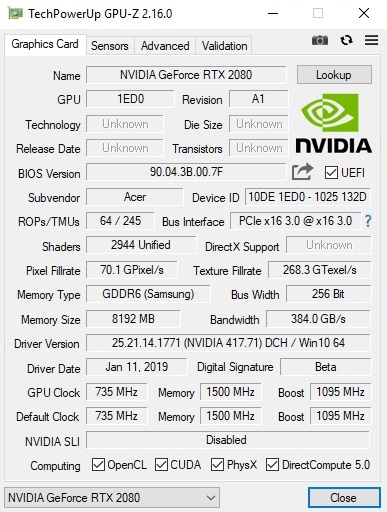
O Triton 500 também não apresenta falta de desempenho. Nossa versão testada com um Core i7-8750H e GeForce GTX 2080 Max-Q pode lidar sem esforço com qualquer jogo atual com resolução Full HD.
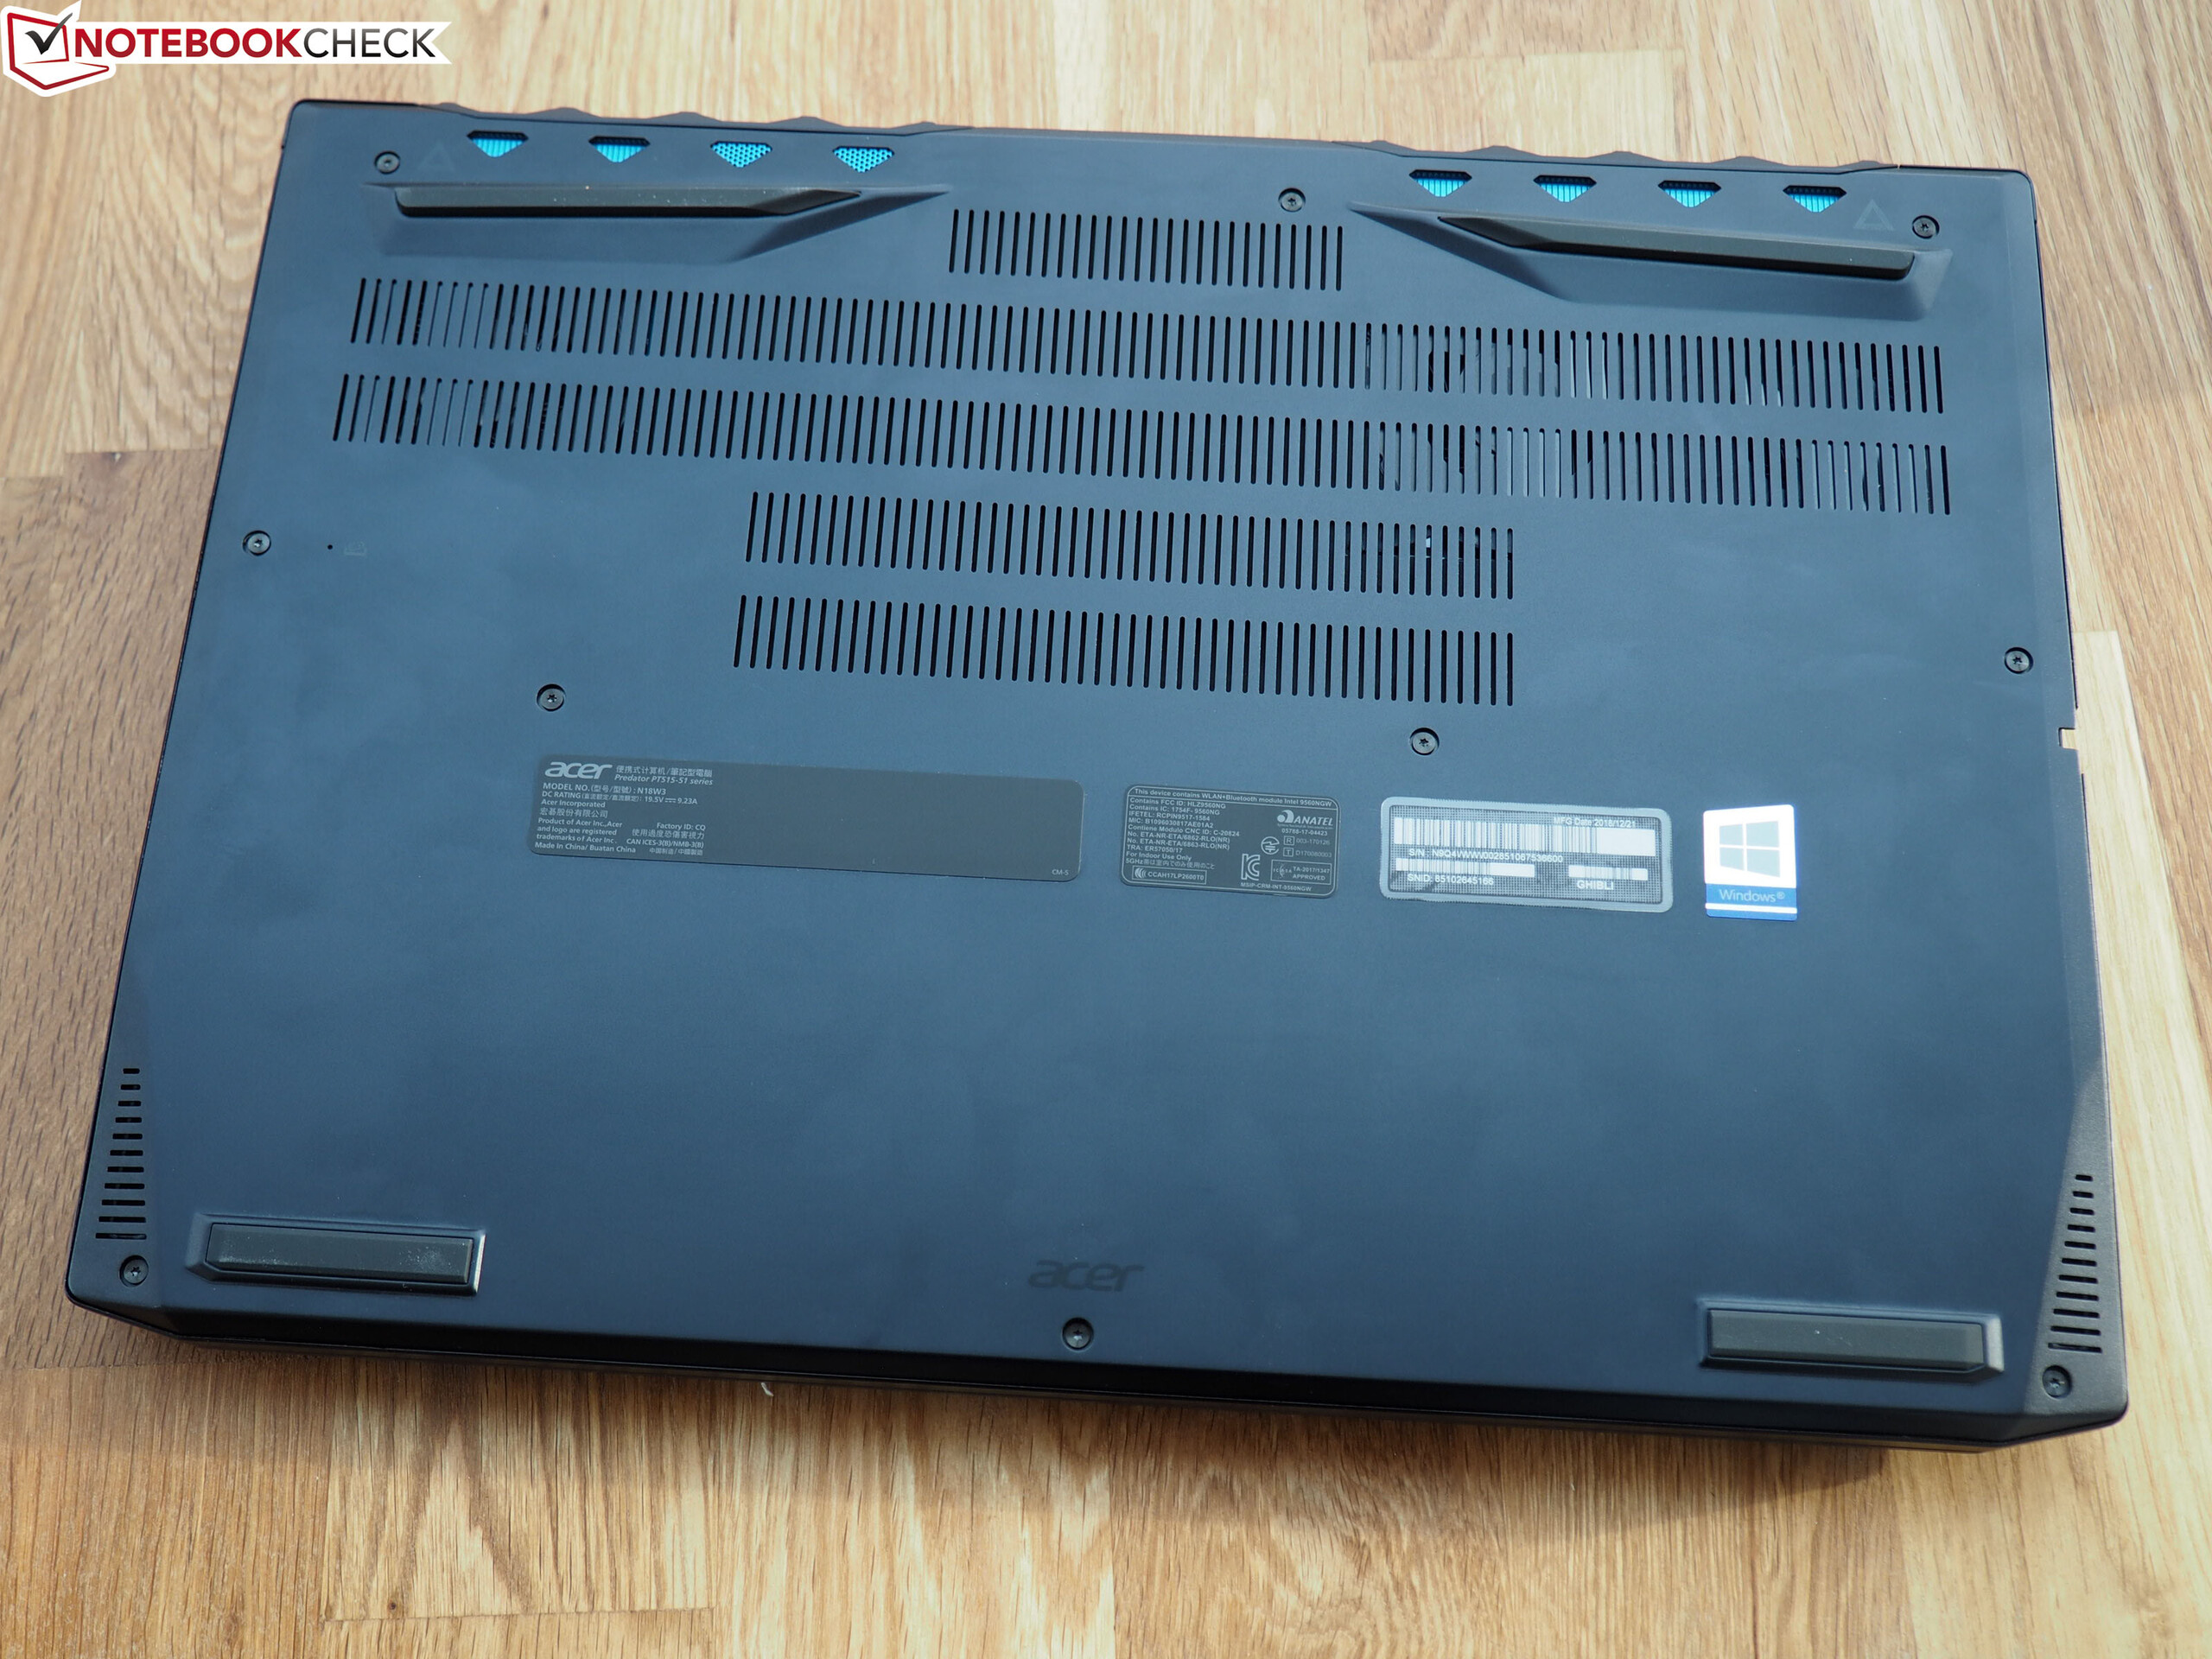
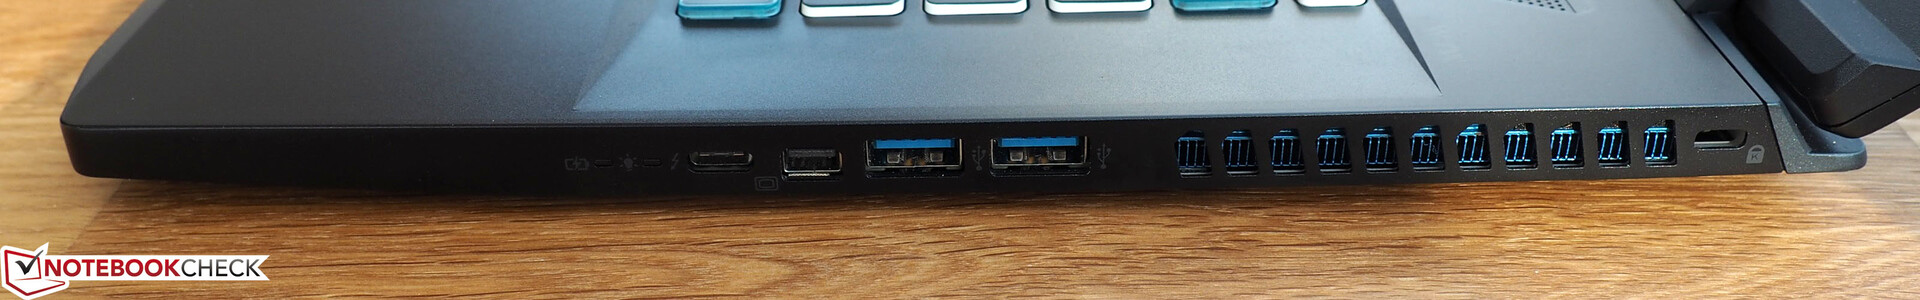
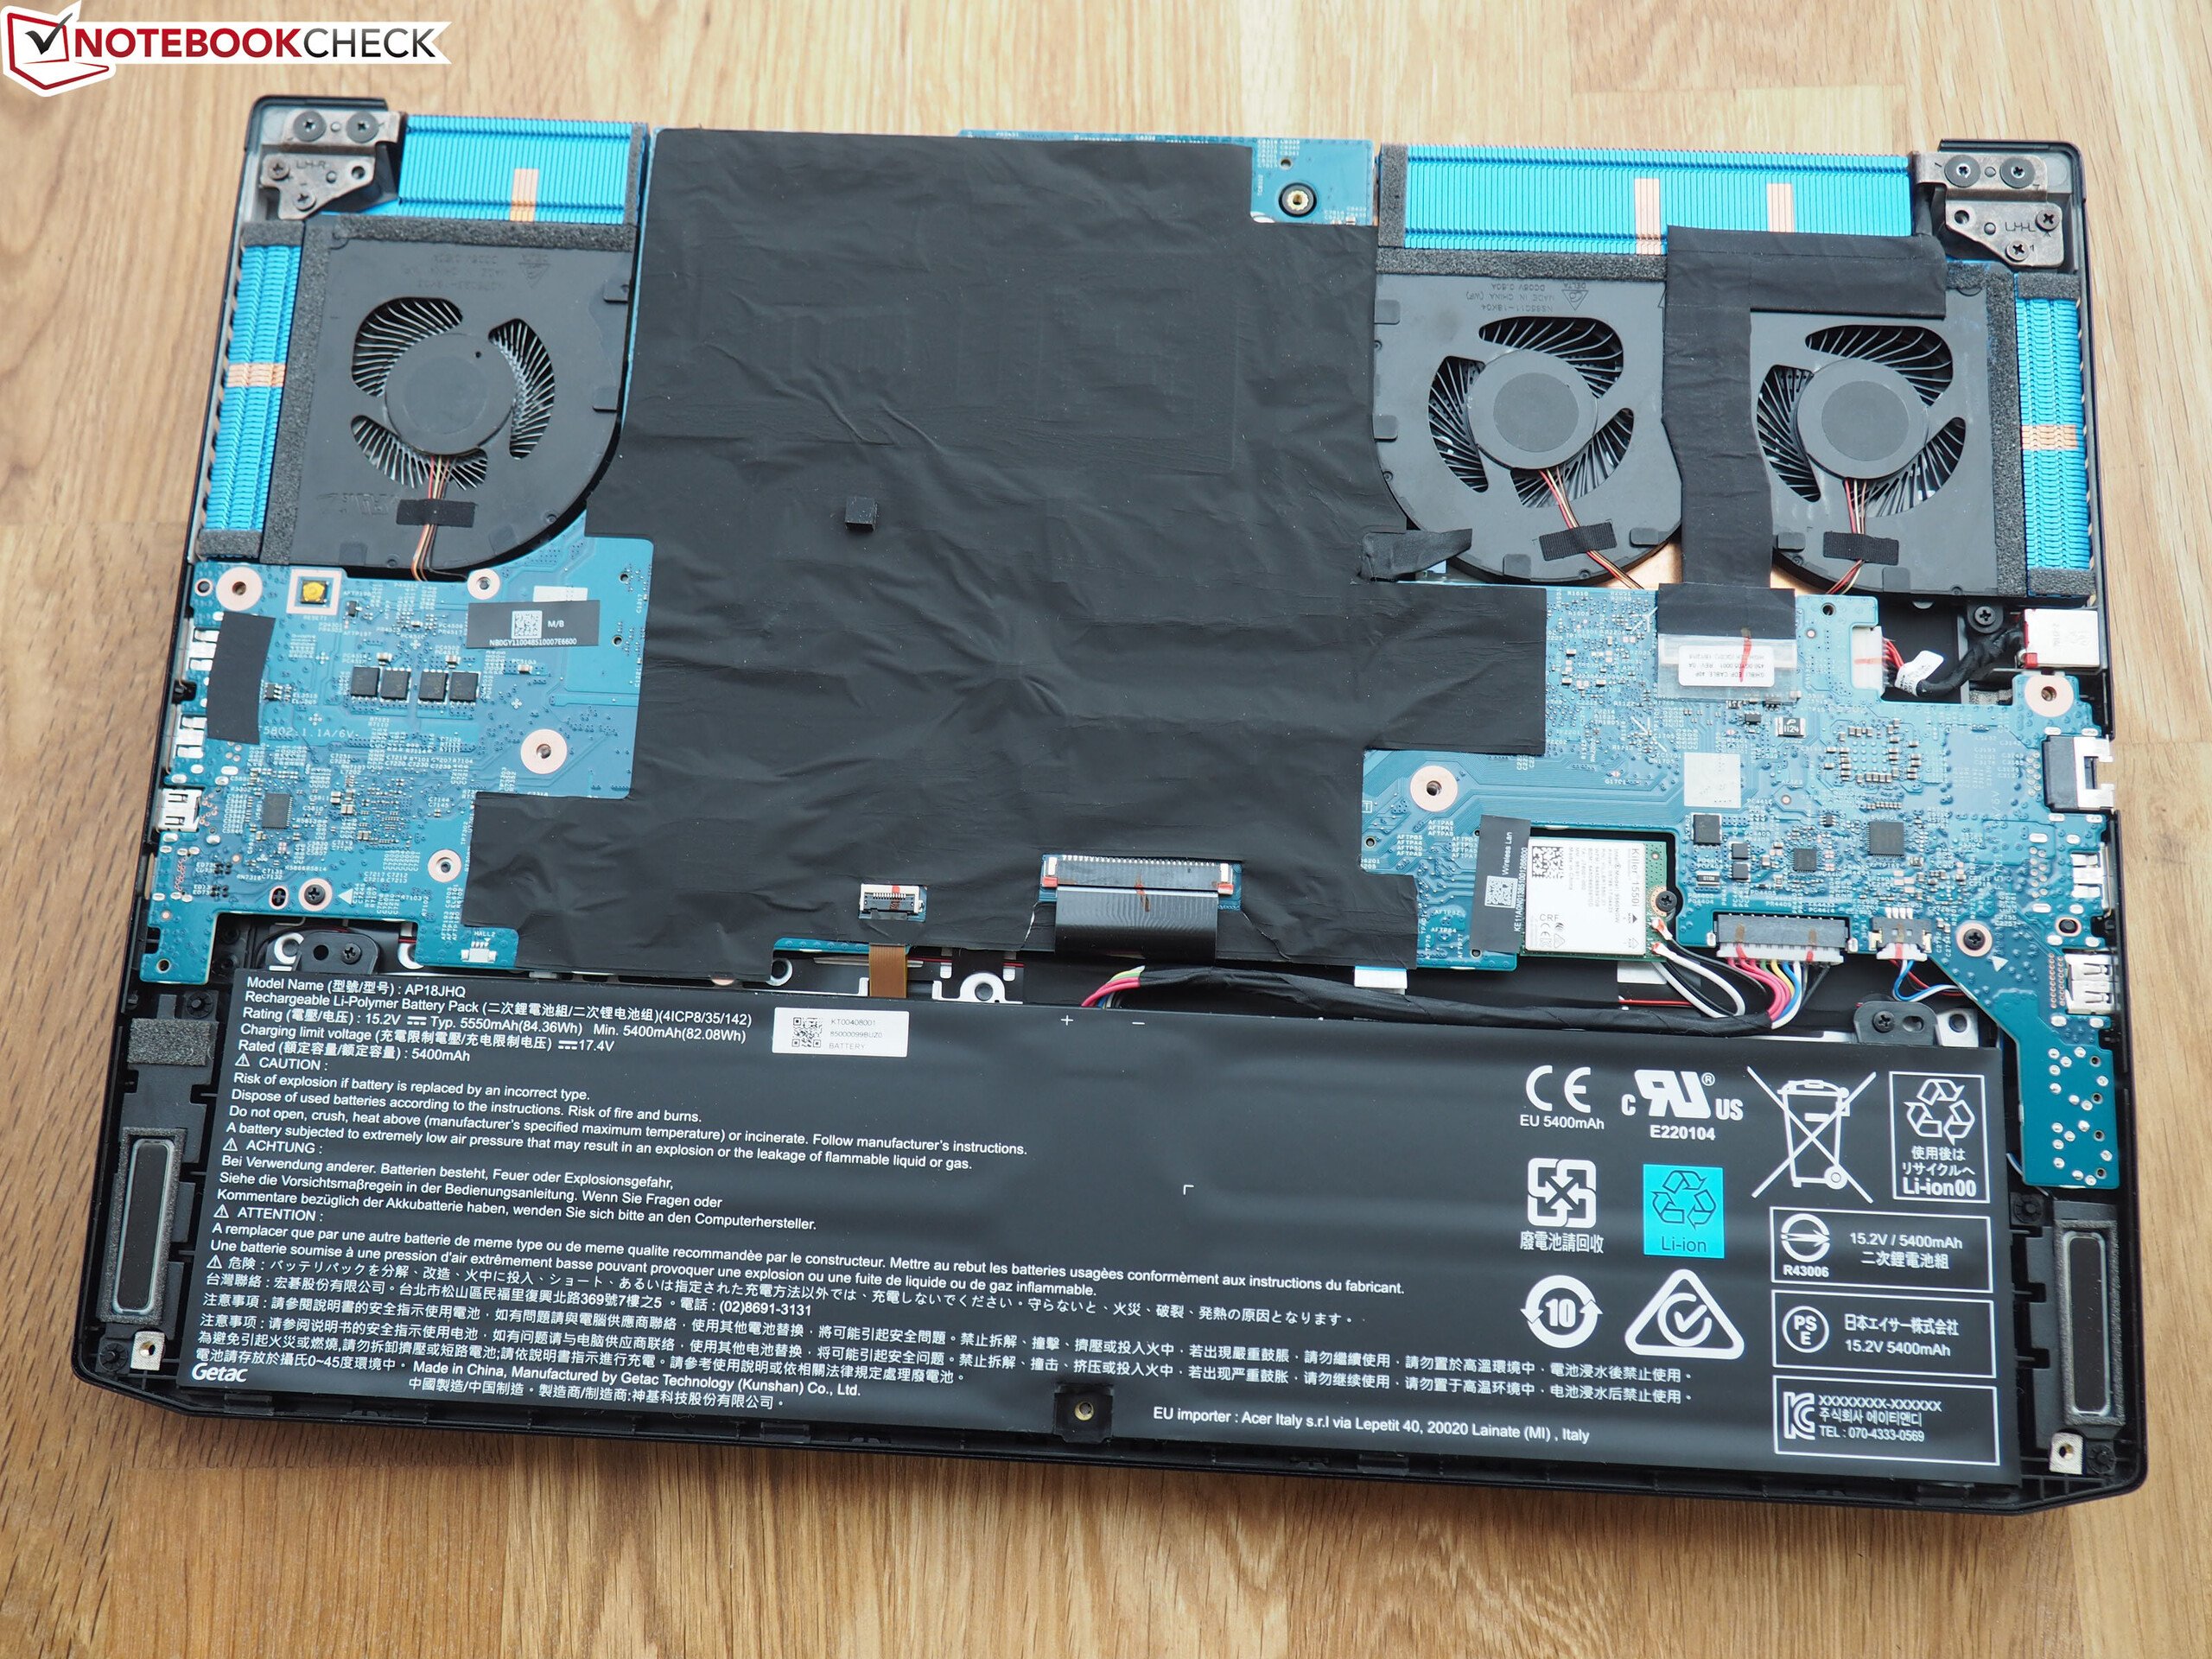
No entanto, é incompreensível para nós a razão pela qual a Acer não utilizou a comutação de gráficos. Em termos de mobilidade, o +Optimus absolutamente se ofereceria como uma vantagem. Vemos fraquezas adicionais em termos de manutenção. O design do interior é tal que os compradores dificilmente podem acessar qualquer componente (palavras-chave: solução de armazenamento e RAM).
Apesar de tudo isso, o Triton 500 é significativamente mais bem sucedido em nossa opinião do que o antigo Triton 700.
Acer Predator Triton 500
- 02/14/2019 v6 (old)
Florian Glaser
Price comparison