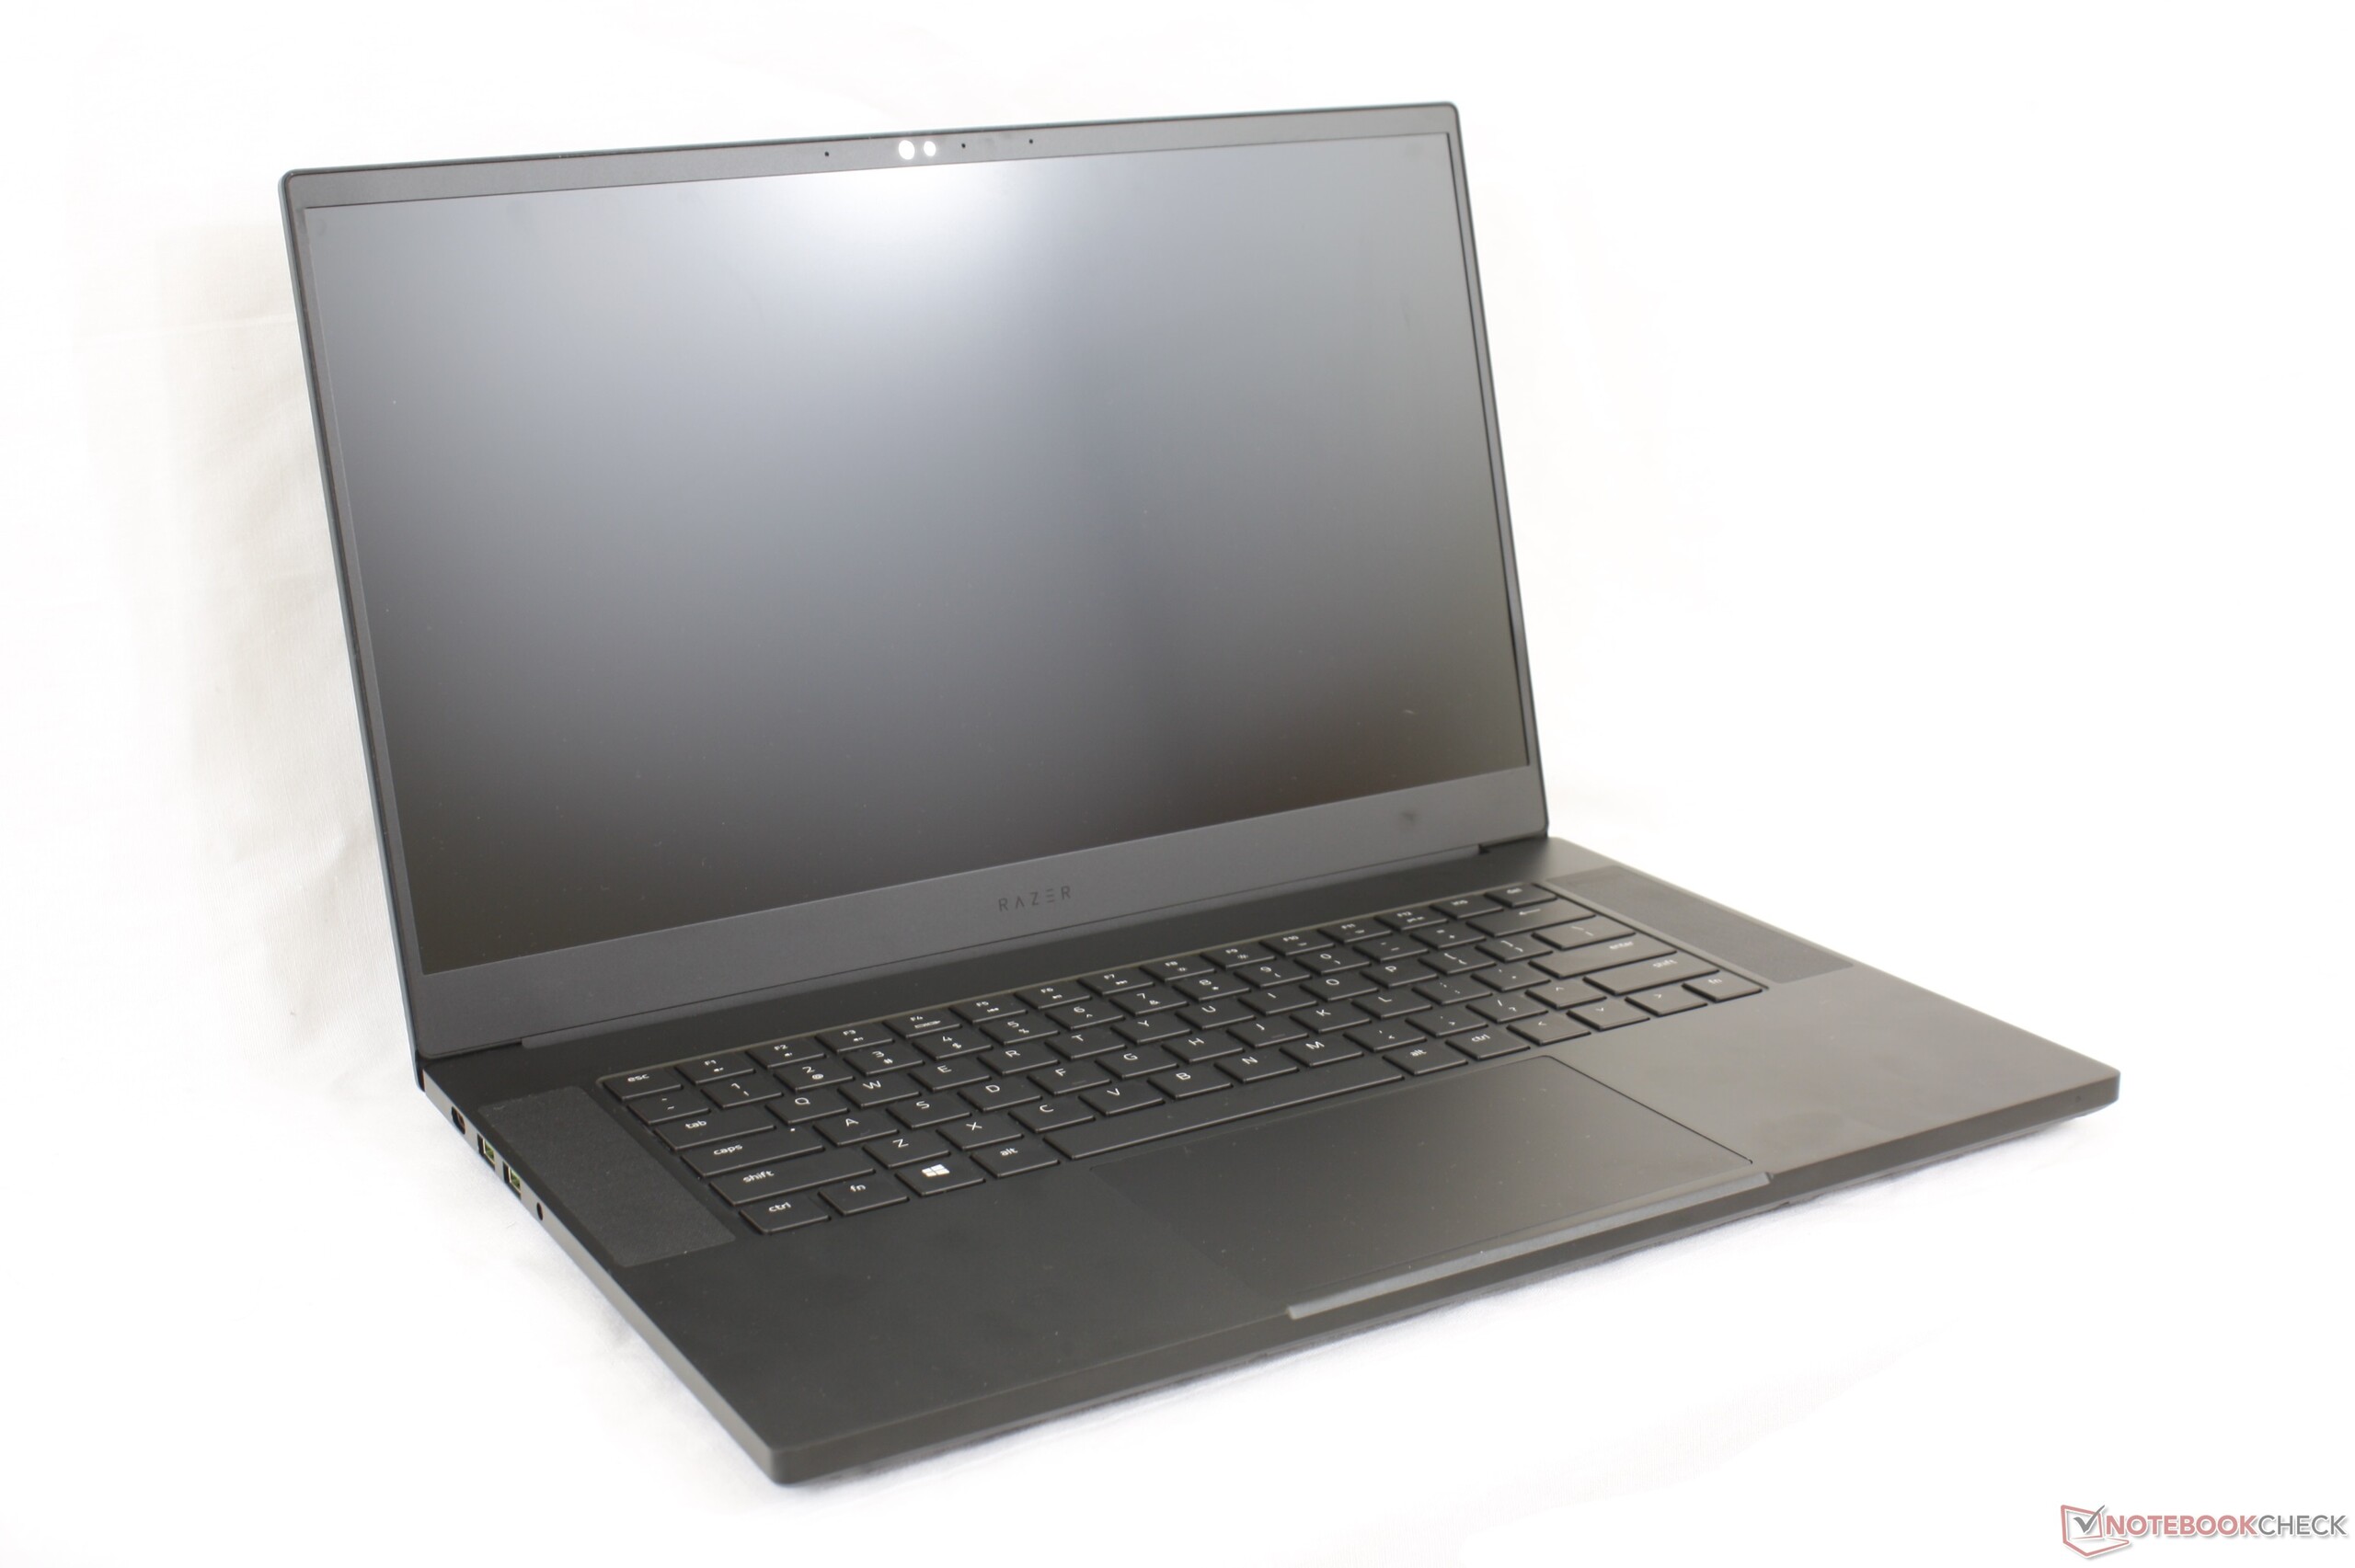
Breve Análise do Portátil Razer Blade 15 Advanced Model (RTX 2070 Max-Q, FHD)
| |||||||||||||||||||||||||
iluminação: 90 %
iluminação com acumulador: 314.7 cd/m²
Contraste: 828:1 (Preto: 0.38 cd/m²)
ΔE ColorChecker Calman: 2.56 | ∀{0.5-29.43 Ø4.71}
calibrated: 1.71
ΔE Greyscale Calman: 3.4 | ∀{0.09-98 Ø4.96}
94.6% sRGB (Argyll 1.6.3 3D)
60.7% AdobeRGB 1998 (Argyll 1.6.3 3D)
66.3% AdobeRGB 1998 (Argyll 3D)
94.9% sRGB (Argyll 3D)
65.3% Display P3 (Argyll 3D)
Gamma: 2.3
CCT: 6435 K
| Razer Blade 15 RTX 2070 Max-Q LG Philips LGD05C0, IPS, 15.6", 1920x1080 | Alienware m15 GTX 1070 Max-Q AU Optronics B156HAN, IPS, 15.6", 1920x1080 | Razer Blade 15 2018 LGD05C0, IPS, 15.6", 1920x1080 | Apple MacBook Pro 15 2018 (2.6 GHz, 560X) APPA040, IPS, 15.4", 2880x1800 | MSI GS65 Stealth Thin 8RE-051US AUO80ED, IPS, 15.6", 1920x1080 | Gigabyte Aero 15X v8 LGD05C0, IPS, 15.6", 1920x1080 | |
|---|---|---|---|---|---|---|
| Display | -4% | -1% | 29% | -0% | -2% | |
| Display P3 Coverage (%) | 65.3 | 63.5 -3% | 64.3 -2% | 98.7 51% | 65.8 1% | 63.6 -3% |
| sRGB Coverage (%) | 94.9 | 89.4 -6% | 93.7 -1% | 99.9 5% | 92.1 -3% | 93.8 -1% |
| AdobeRGB 1998 Coverage (%) | 66.3 | 64.5 -3% | 65.5 -1% | 86.6 31% | 67 1% | 64.9 -2% |
| Response Times | -5% | -3% | -163% | -11% | 2% | |
| Response Time Grey 50% / Grey 80% * (ms) | 16.8 ? | 18 ? -7% | 17.2 ? -2% | 43.2 ? -157% | 20 ? -19% | 16.8 ? -0% |
| Response Time Black / White * (ms) | 11.6 ? | 12 ? -3% | 12 ? -3% | 31.2 ? -169% | 12 ? -3% | 11.2 ? 3% |
| PWM Frequency (Hz) | 117000 ? | |||||
| Screen | -17% | 2% | 43% | -12% | 20% | |
| Brightness middle (cd/m²) | 314.7 | 353.6 12% | 290 -8% | 520 65% | 250.9 -20% | 313 -1% |
| Brightness (cd/m²) | 312 | 346 11% | 281 -10% | 492 58% | 257 -18% | 300 -4% |
| Brightness Distribution (%) | 90 | 86 -4% | 82 -9% | 88 -2% | 83 -8% | 78 -13% |
| Black Level * (cd/m²) | 0.38 | 0.3 21% | 0.3 21% | 0.39 -3% | 0.32 16% | 0.33 13% |
| Contrast (:1) | 828 | 1179 42% | 967 17% | 1333 61% | 784 -5% | 948 14% |
| Colorchecker dE 2000 * | 2.56 | 4.55 -78% | 2.85 -11% | 1.2 53% | 2.77 -8% | 1.29 50% |
| Colorchecker dE 2000 max. * | 4.89 | 7.91 -62% | 6.27 -28% | 2.3 53% | 5.89 -20% | 2.04 58% |
| Colorchecker dE 2000 calibrated * | 1.71 | 3.37 -97% | 1.39 19% | 2.5 -46% | ||
| Greyscale dE 2000 * | 3.4 | 4.1 -21% | 2.4 29% | 1.3 62% | 4 -18% | 0.69 80% |
| Gamma | 2.3 96% | 2.27 97% | 2.34 94% | 2.18 101% | 2.27 97% | 2.43 91% |
| CCT | 6435 101% | 7434 87% | 6718 97% | 6738 96% | 6901 94% | 6550 99% |
| Color Space (Percent of AdobeRGB 1998) (%) | 60.7 | 57.9 -5% | 60 -1% | 60 -1% | 60 -1% | |
| Color Space (Percent of sRGB) (%) | 94.6 | 88.9 -6% | 94 -1% | 92 -3% | 94 -1% | |
| Média Total (Programa/Configurações) | -9% /
-13% | -1% /
1% | -30% /
8% | -8% /
-10% | 7% /
13% |
* ... menor é melhor
Exibir tempos de resposta
| ↔ Tempo de resposta preto para branco | ||
|---|---|---|
| 11.6 ms ... ascensão ↗ e queda ↘ combinadas | ↗ 7.2 ms ascensão | 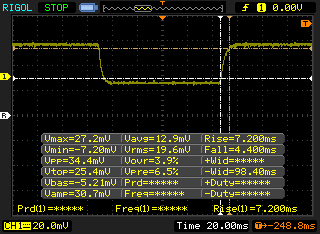 |
| ↘ 4.4 ms queda | ||
| A tela mostra boas taxas de resposta em nossos testes, mas pode ser muito lenta para jogadores competitivos. Em comparação, todos os dispositivos testados variam de 0.1 (mínimo) a 240 (máximo) ms. » 31 % de todos os dispositivos são melhores. Isso significa que o tempo de resposta medido é melhor que a média de todos os dispositivos testados (19.8 ms). | ||
| ↔ Tempo de resposta 50% cinza a 80% cinza | ||
| 16.8 ms ... ascensão ↗ e queda ↘ combinadas | ↗ 9.2 ms ascensão | 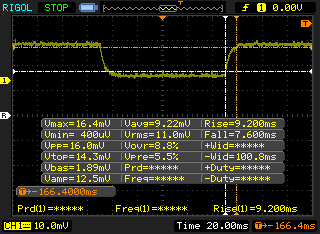 |
| ↘ 7.6 ms queda | ||
| A tela mostra boas taxas de resposta em nossos testes, mas pode ser muito lenta para jogadores competitivos. Em comparação, todos os dispositivos testados variam de 0.165 (mínimo) a 636 (máximo) ms. » 31 % de todos os dispositivos são melhores. Isso significa que o tempo de resposta medido é melhor que a média de todos os dispositivos testados (31 ms). | ||
Cintilação da tela / PWM (modulação por largura de pulso)
| Tela tremeluzindo / PWM não detectado | 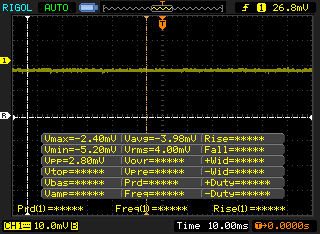 | ||
[pwm_comparison] Em comparação: 52 % de todos os dispositivos testados não usam PWM para escurecer a tela. Se PWM foi detectado, uma média de 7754 (mínimo: 5 - máximo: 343500) Hz foi medida. | |||
| Cinebench R15 | |
| CPU Single 64Bit | |
| no name | |
| Dell XPS 15 9570 Core i9 UHD | |
| Lenovo ThinkPad X1 Extreme-20MF000RGE | |
| Razer Blade 15 RTX 2070 Max-Q | |
| Alienware m15 GTX 1070 Max-Q | |
| Média Intel Core i7-8750H (163 - 177, n=86) | |
| Lenovo ThinkPad X1 Carbon 2018-20KGS5DU00 | |
| Razer Blade Pro RZ09-0220 | |
| Asus GL702ZC-GC104T | |
| Xiaomi Mi Gaming Laptop 7300HQ 1050Ti | |
| CPU Multi 64Bit | |
| Asus GL702ZC-GC104T | |
| no name | |
| Dell XPS 15 9570 Core i9 UHD | |
| Alienware m15 GTX 1070 Max-Q | |
| Média Intel Core i7-8750H (863 - 1251, n=93) | |
| Razer Blade 15 RTX 2070 Max-Q | |
| Lenovo ThinkPad X1 Extreme-20MF000RGE | |
| Razer Blade Pro RZ09-0220 | |
| Lenovo ThinkPad X1 Carbon 2018-20KGS5DU00 | |
| Xiaomi Mi Gaming Laptop 7300HQ 1050Ti | |
| Cinebench R11.5 | |
| CPU Single 64Bit | |
| no name | |
| Média Intel Core i7-8750H (1.89 - 2, n=40) | |
| Razer Blade Pro RZ09-0220 | |
| Asus GL702ZC-GC104T | |
| CPU Multi 64Bit | |
| Asus GL702ZC-GC104T | |
| no name | |
| Média Intel Core i7-8750H (9.54 - 13.5, n=41) | |
| Razer Blade Pro RZ09-0220 | |
| Cinebench R10 | |
| Rendering Multiple CPUs 32Bit | |
| no name | |
| Média Intel Core i7-8750H (29664 - 35307, n=25) | |
| Asus GL702ZC-GC104T | |
| Razer Blade Pro RZ09-0220 | |
| Rendering Single 32Bit | |
| no name | |
| Média Intel Core i7-8750H (6236 - 6645, n=25) | |
| Razer Blade Pro RZ09-0220 | |
| Asus GL702ZC-GC104T | |
| wPrime 2.10 - 1024m | |
| Razer Blade Pro RZ09-0220 | |
| Média Intel Core i7-8750H (125.5 - 180.5, n=6) | |
| no name | |
* ... menor é melhor
| PCMark 8 Home Score Accelerated v2 | 4150 pontos | |
| PCMark 8 Work Score Accelerated v2 | 5607 pontos | |
| PCMark 10 Score | 5416 pontos | |
Ajuda | ||
| Razer Blade 15 RTX 2070 Max-Q Samsung SSD PM981 MZVLB512HAJQ | Razer Blade 15 2018 Samsung PM961 NVMe MZVLW512HMJP | Apple MacBook Pro 15 2018 (2.6 GHz, 560X) Apple SSD AP0512 | Dell XPS 15 9570 Core i9 UHD Samsung SSD PM981 MZVLB1T0HALR | Alienware m15 GTX 1070 Max-Q Toshiba XG5 KXG50ZNV512G | |
|---|---|---|---|---|---|
| AS SSD | -7% | -78% | -6% | -45% | |
| Seq Read (MB/s) | 1840 | 2376 29% | 2239 22% | 1320 -28% | 1967 7% |
| Seq Write (MB/s) | 1822 | 1521 -17% | 1644 -10% | 1500 -18% | 1135 -38% |
| 4K Read (MB/s) | 52.3 | 46.45 -11% | 9.46 -82% | 30.73 -41% | 29.17 -44% |
| 4K Write (MB/s) | 110.7 | 93.6 -15% | 18.78 -83% | 94.4 -15% | 93.4 -16% |
| 4K-64 Read (MB/s) | 1126 | 1300 15% | 965 -14% | 1453 29% | 995 -12% |
| 4K-64 Write (MB/s) | 1717 | 1204 -30% | 163.5 -90% | 1815 6% | 656 -62% |
| Access Time Read * (ms) | 0.047 | 0.051 -9% | 0.225 -379% | 0.061 -30% | 0.116 -147% |
| Access Time Write * (ms) | 0.033 | 0.038 -15% | 0.044 -33% | 0.063 -91% | |
| Score Read (Points) | 1362 | 1584 16% | 1199 -12% | 1616 19% | 1221 -10% |
| Score Write (Points) | 2010 | 1450 -28% | 347 -83% | 2059 2% | 862 -57% |
| Score Total (Points) | 4079 | 3806 -7% | 2119 -48% | 4507 10% | 2667 -35% |
| Copy ISO MB/s (MB/s) | 1975 | 2577 30% | 642 -67% | ||
| Copy Program MB/s (MB/s) | 526 | 515 -2% | 431.5 -18% | ||
| Copy Game MB/s (MB/s) | 1200 | 1120 -7% | 706 -41% |
* ... menor é melhor

| 3DMark | |
| 1280x720 Cloud Gate Standard Graphics | |
| Asus ROG Strix RTX 2070 OC | |
| Acer Triton 500 | |
| Asus Zephyrus GX501 | |
| Asus ROG G703GX | |
| Razer Blade Pro 2017 | |
| Razer Blade 15 RTX 2070 Max-Q | |
| Schenker XMG Ultra 15 | |
| Razer Blade 15 2018 | |
| Média NVIDIA GeForce RTX 2070 Max-Q (39014 - 134255, n=28) | |
| Razer Blade 15 Base Model | |
| Lenovo Legion Y730-15ICH i5-8300H | |
| Razer Blade (2017) UHD | |
| Dell XPS 15 9570 Core i9 UHD | |
| MSI GF63 8RC-040XPL | |
| 1920x1080 Fire Strike Graphics | |
| Asus ROG G703GX | |
| Asus ROG Strix RTX 2070 OC | |
| Acer Triton 500 | |
| Razer Blade Pro 2017 | |
| Asus Zephyrus GX501 | |
| Razer Blade 15 RTX 2070 Max-Q | |
| Média NVIDIA GeForce RTX 2070 Max-Q (11563 - 21191, n=31) | |
| Razer Blade 15 2018 | |
| Schenker XMG Ultra 15 | |
| Razer Blade 15 Base Model | |
| Razer Blade (2017) UHD | |
| Lenovo Legion Y730-15ICH i5-8300H | |
| Dell XPS 15 9570 Core i9 UHD | |
| MSI GF63 8RC-040XPL | |
| 2560x1440 Port Royal Graphics | |
| Asus ROG G703GX | |
| Acer Triton 500 | |
| Média NVIDIA GeForce RTX 2070 Max-Q (3240 - 4742, n=23) | |
| Razer Blade 15 RTX 2070 Max-Q | |
| Schenker XMG Ultra 15 | |
| 3DMark 11 Performance | 17689 pontos | |
| 3DMark Cloud Gate Standard Score | 29109 pontos | |
| 3DMark Fire Strike Score | 15428 pontos | |
| 3DMark Fire Strike Extreme Score | 8041 pontos | |
| 3DMark Time Spy Score | 6367 pontos | |
Ajuda | ||
| The Witcher 3 - 1920x1080 Ultra Graphics & Postprocessing (HBAO+) | |
| Asus ROG G703GX | |
| Asus ROG Strix RTX 2070 OC | |
| Acer Triton 500 | |
| MSI GS75 8SG Stealth | |
| Razer Blade 15 RTX 2070 Max-Q | |
| Razer Blade Pro 2017 | |
| Asus Zephyrus GX501 | |
| Alienware 17 R5 | |
| Schenker XMG Ultra 15 | |
| Razer Blade 15 2018 | |
| Razer Blade 15 Base Model | |
| Razer Blade Pro RZ09-0220 | |
| Asus GL702ZC-GC104T | |
| Lenovo Legion Y730-15ICH i5-8300H | |
| Lenovo ThinkPad X1 Extreme-20MF000RGE | |
| Apple MacBook Pro 15 2018 (2.6 GHz, 560X) | |
| Rise of the Tomb Raider - 1920x1080 Very High Preset AA:FX AF:16x | |
| Asus ROG Strix RTX 2070 OC | |
| Asus Zephyrus GX501 | |
| Razer Blade 15 RTX 2070 Max-Q | |
| Razer Blade 15 Base Model | |
| Razer Blade Pro RZ09-0220 | |
| Asus GL702ZC-GC104T | |
| Lenovo Legion Y730-15ICH i5-8300H | |
| Apple MacBook Pro 15 2018 (2.6 GHz, 560X) | |
| baixo | média | alto | ultra | |
|---|---|---|---|---|
| BioShock Infinite (2013) | 290.8 | 260.1 | 246.1 | 152.5 |
| The Witcher 3 (2015) | 252.5 | 208.9 | 130.1 | 68.9 |
| Rise of the Tomb Raider (2016) | 204.2 | 157.8 | 121.9 | 103.9 |
| Razer Blade 15 RTX 2070 Max-Q GeForce RTX 2070 Max-Q, i7-8750H, Samsung SSD PM981 MZVLB512HAJQ | Razer Blade 15 2018 GeForce GTX 1070 Max-Q, i7-8750H, Samsung PM961 NVMe MZVLW512HMJP | Alienware m15 GTX 1070 Max-Q GeForce GTX 1070 Max-Q, i7-8750H, Toshiba XG5 KXG50ZNV512G | Dell XPS 15 9570 Core i9 UHD GeForce GTX 1050 Ti Max-Q, i9-8950HK, Samsung SSD PM981 MZVLB1T0HALR | Gigabyte Aero 15X v8 GeForce GTX 1070 Max-Q, i7-8750H, Toshiba NVMe THNSN5512GPU7 | MSI GS65 Stealth Thin 8RE-051US GeForce GTX 1060 Mobile, i7-8750H, Samsung SSD PM981 MZVLB256HAHQ | |
|---|---|---|---|---|---|---|
| Noise | -12% | -5% | -2% | -16% | -4% | |
| desligado / ambiente * (dB) | 28.8 | 29 -1% | 28.6 1% | 28.2 2% | 29 -1% | 28.4 1% |
| Idle Minimum * (dB) | 28.8 | 29 -1% | 28.6 1% | 28.5 1% | 30 -4% | 28.4 1% |
| Idle Average * (dB) | 28.8 | 30 -4% | 28.6 1% | 28.6 1% | 31 -8% | 28.4 1% |
| Idle Maximum * (dB) | 29.4 | 38 -29% | 28.6 3% | 28.8 2% | 35 -19% | 29.6 -1% |
| Load Average * (dB) | 35.7 | 46 -29% | 40.8 -14% | 36.2 -1% | 49 -37% | 43.5 -22% |
| Witcher 3 ultra * (dB) | 42.5 | 49 -15% | 49.6 -17% | 47.6 -12% | 51 -20% | 45.7 -8% |
| Load Maximum * (dB) | 45 | 46 -2% | 49.6 -10% | 47.6 -6% | 54 -20% | 45.7 -2% |
* ... menor é melhor
Barulho
| Ocioso |
| 28.8 / 28.8 / 29.4 dB |
| Carga |
| 35.7 / 45 dB |
 | ||
30 dB silencioso 40 dB(A) audível 50 dB(A) ruidosamente alto |
||
min: | ||
(-) A temperatura máxima no lado superior é 49 °C / 120 F, em comparação com a média de 40.4 °C / 105 F , variando de 21.2 a 68.8 °C para a classe Gaming.
(-) A parte inferior aquece até um máximo de 49 °C / 120 F, em comparação com a média de 43.2 °C / 110 F
(+) Em uso inativo, a temperatura média para o lado superior é 24.9 °C / 77 F, em comparação com a média do dispositivo de 33.9 °C / ### class_avg_f### F.
(±) Jogando The Witcher 3, a temperatura média para o lado superior é 35.8 °C / 96 F, em comparação com a média do dispositivo de 33.9 °C / ## #class_avg_f### F.
(+) Os apoios para as mãos e o touchpad estão atingindo a temperatura máxima da pele (34.2 °C / 93.6 F) e, portanto, não estão quentes.
(-) A temperatura média da área do apoio para as mãos de dispositivos semelhantes foi 28.8 °C / 83.8 F (-5.4 °C / -9.8 F).
Razer Blade 15 RTX 2070 Max-Q análise de áudio
(-) | alto-falantes não muito altos (###valor### dB)
Graves 100 - 315Hz
(±) | graves reduzidos - em média 7.7% menor que a mediana
(±) | a linearidade dos graves é média (11.1% delta para a frequência anterior)
Médios 400 - 2.000 Hz
(±) | médios mais altos - em média 7.8% maior que a mediana
(±) | a linearidade dos médios é média (9.5% delta para frequência anterior)
Altos 2 - 16 kHz
(+) | agudos equilibrados - apenas 3% longe da mediana
(±) | a linearidade dos máximos é média (7.2% delta para frequência anterior)
Geral 100 - 16.000 Hz
(±) | a linearidade do som geral é média (23.9% diferença em relação à mediana)
Comparado com a mesma classe
» 86% de todos os dispositivos testados nesta classe foram melhores, 5% semelhantes, 9% piores
» O melhor teve um delta de 6%, a média foi 18%, o pior foi 132%
Comparado com todos os dispositivos testados
» 72% de todos os dispositivos testados foram melhores, 6% semelhantes, 22% piores
» O melhor teve um delta de 4%, a média foi 23%, o pior foi 134%
Apple MacBook 12 (Early 2016) 1.1 GHz análise de áudio
(+) | os alto-falantes podem tocar relativamente alto (###valor### dB)
Graves 100 - 315Hz
(±) | graves reduzidos - em média 11.3% menor que a mediana
(±) | a linearidade dos graves é média (14.2% delta para a frequência anterior)
Médios 400 - 2.000 Hz
(+) | médios equilibrados - apenas 2.4% longe da mediana
(+) | médios são lineares (5.5% delta para frequência anterior)
Altos 2 - 16 kHz
(+) | agudos equilibrados - apenas 2% longe da mediana
(+) | os máximos são lineares (4.5% delta da frequência anterior)
Geral 100 - 16.000 Hz
(+) | o som geral é linear (10.2% diferença em relação à mediana)
Comparado com a mesma classe
» 7% de todos os dispositivos testados nesta classe foram melhores, 2% semelhantes, 90% piores
» O melhor teve um delta de 5%, a média foi 18%, o pior foi 53%
Comparado com todos os dispositivos testados
» 5% de todos os dispositivos testados foram melhores, 1% semelhantes, 94% piores
» O melhor teve um delta de 4%, a média foi 23%, o pior foi 134%
| desligado | |
| Ocioso | |
| Carga |
|
Key:
min: | |
| Razer Blade 15 RTX 2070 Max-Q i7-8750H, GeForce RTX 2070 Max-Q, Samsung SSD PM981 MZVLB512HAJQ, IPS, 1920x1080, 15.6" | Razer Blade 15 2018 i7-8750H, GeForce GTX 1070 Max-Q, Samsung PM961 NVMe MZVLW512HMJP, IPS, 1920x1080, 15.6" | Apple MacBook Pro 15 2018 (2.6 GHz, 560X) i7-8850H, Radeon Pro 560X, Apple SSD AP0512, IPS, 2880x1800, 15.4" | MSI GS65 Stealth Thin 8RE-051US i7-8750H, GeForce GTX 1060 Mobile, Samsung SSD PM981 MZVLB256HAHQ, IPS, 1920x1080, 15.6" | Gigabyte Aero 15X v8 i7-8750H, GeForce GTX 1070 Max-Q, Toshiba NVMe THNSN5512GPU7, IPS, 1920x1080, 15.6" | Alienware m15 GTX 1070 Max-Q i7-8750H, GeForce GTX 1070 Max-Q, Toshiba XG5 KXG50ZNV512G, IPS, 1920x1080, 15.6" | |
|---|---|---|---|---|---|---|
| Power Consumption | -13% | 32% | 9% | -14% | 7% | |
| Idle Minimum * (Watt) | 10.4 | 14 -35% | 3.4 67% | 8.7 16% | 14 -35% | 7.6 27% |
| Idle Average * (Watt) | 14.6 | 17 -16% | 11 25% | 13 11% | 18 -23% | 13.8 5% |
| Idle Maximum * (Watt) | 16.3 | 21 -29% | 14.9 9% | 14.3 12% | 22 -35% | 14.6 10% |
| Load Average * (Watt) | 88.5 | 95 -7% | 78.9 11% | 107.4 -21% | 91 -3% | 97.6 -10% |
| Witcher 3 ultra * (Watt) | 155.4 | 141 9% | 129 17% | 142 9% | 145.8 6% | |
| Load Maximum * (Watt) | 182.4 | 179 2% | 91.2 50% | 151.5 17% | 173 5% | 172.5 5% |
* ... menor é melhor
| Razer Blade 15 RTX 2070 Max-Q i7-8750H, GeForce RTX 2070 Max-Q, 80 Wh | Razer Blade 15 2018 i7-8750H, GeForce GTX 1070 Max-Q, 80 Wh | Apple MacBook Pro 15 2018 (2.6 GHz, 560X) i7-8850H, Radeon Pro 560X, 83 Wh | MSI GS65 Stealth Thin 8RE-051US i7-8750H, GeForce GTX 1060 Mobile, 82 Wh | Alienware m15 GTX 1070 Max-Q i7-8750H, GeForce GTX 1070 Max-Q, 90 Wh | Gigabyte Aero 15X v8 i7-8750H, GeForce GTX 1070 Max-Q, 94.24 Wh | |
|---|---|---|---|---|---|---|
| Duração da bateria | -27% | 57% | -13% | 8% | 39% | |
| Reader / Idle (h) | 11.4 | 6.4 -44% | 10.5 -8% | 12.7 11% | ||
| WiFi v1.3 (h) | 6.5 | 5.4 -17% | 10.2 57% | 6.2 -5% | 7.7 18% | 8.6 32% |
| Load (h) | 1.5 | 1.2 -20% | 1.2 -20% | 1.7 13% | 2.6 73% | |
| Witcher 3 ultra (h) | 1.5 |
Pro
Contra
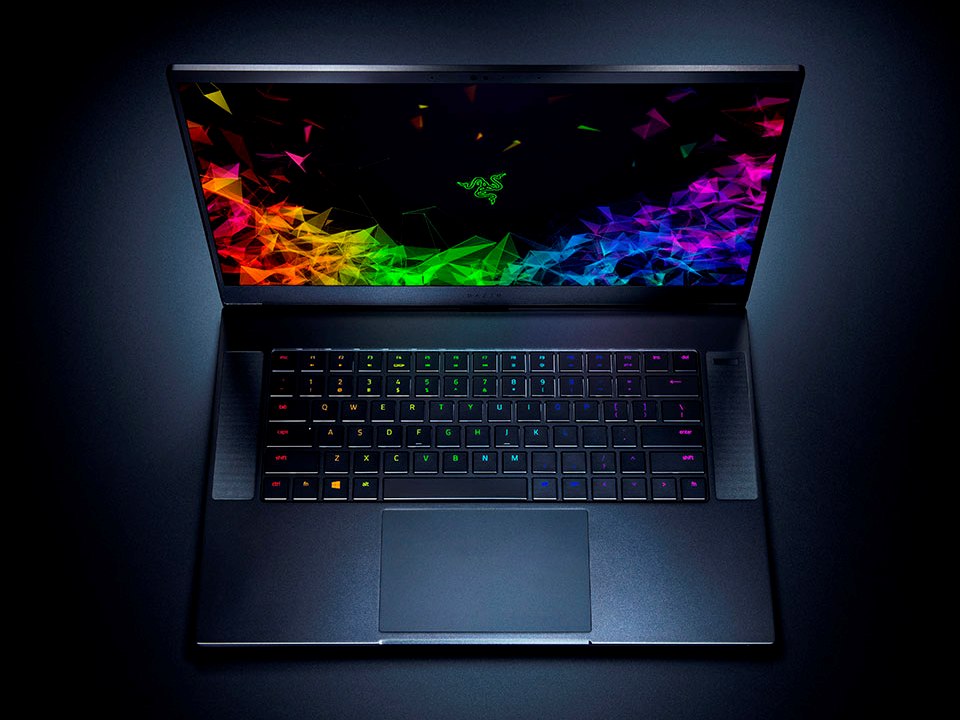
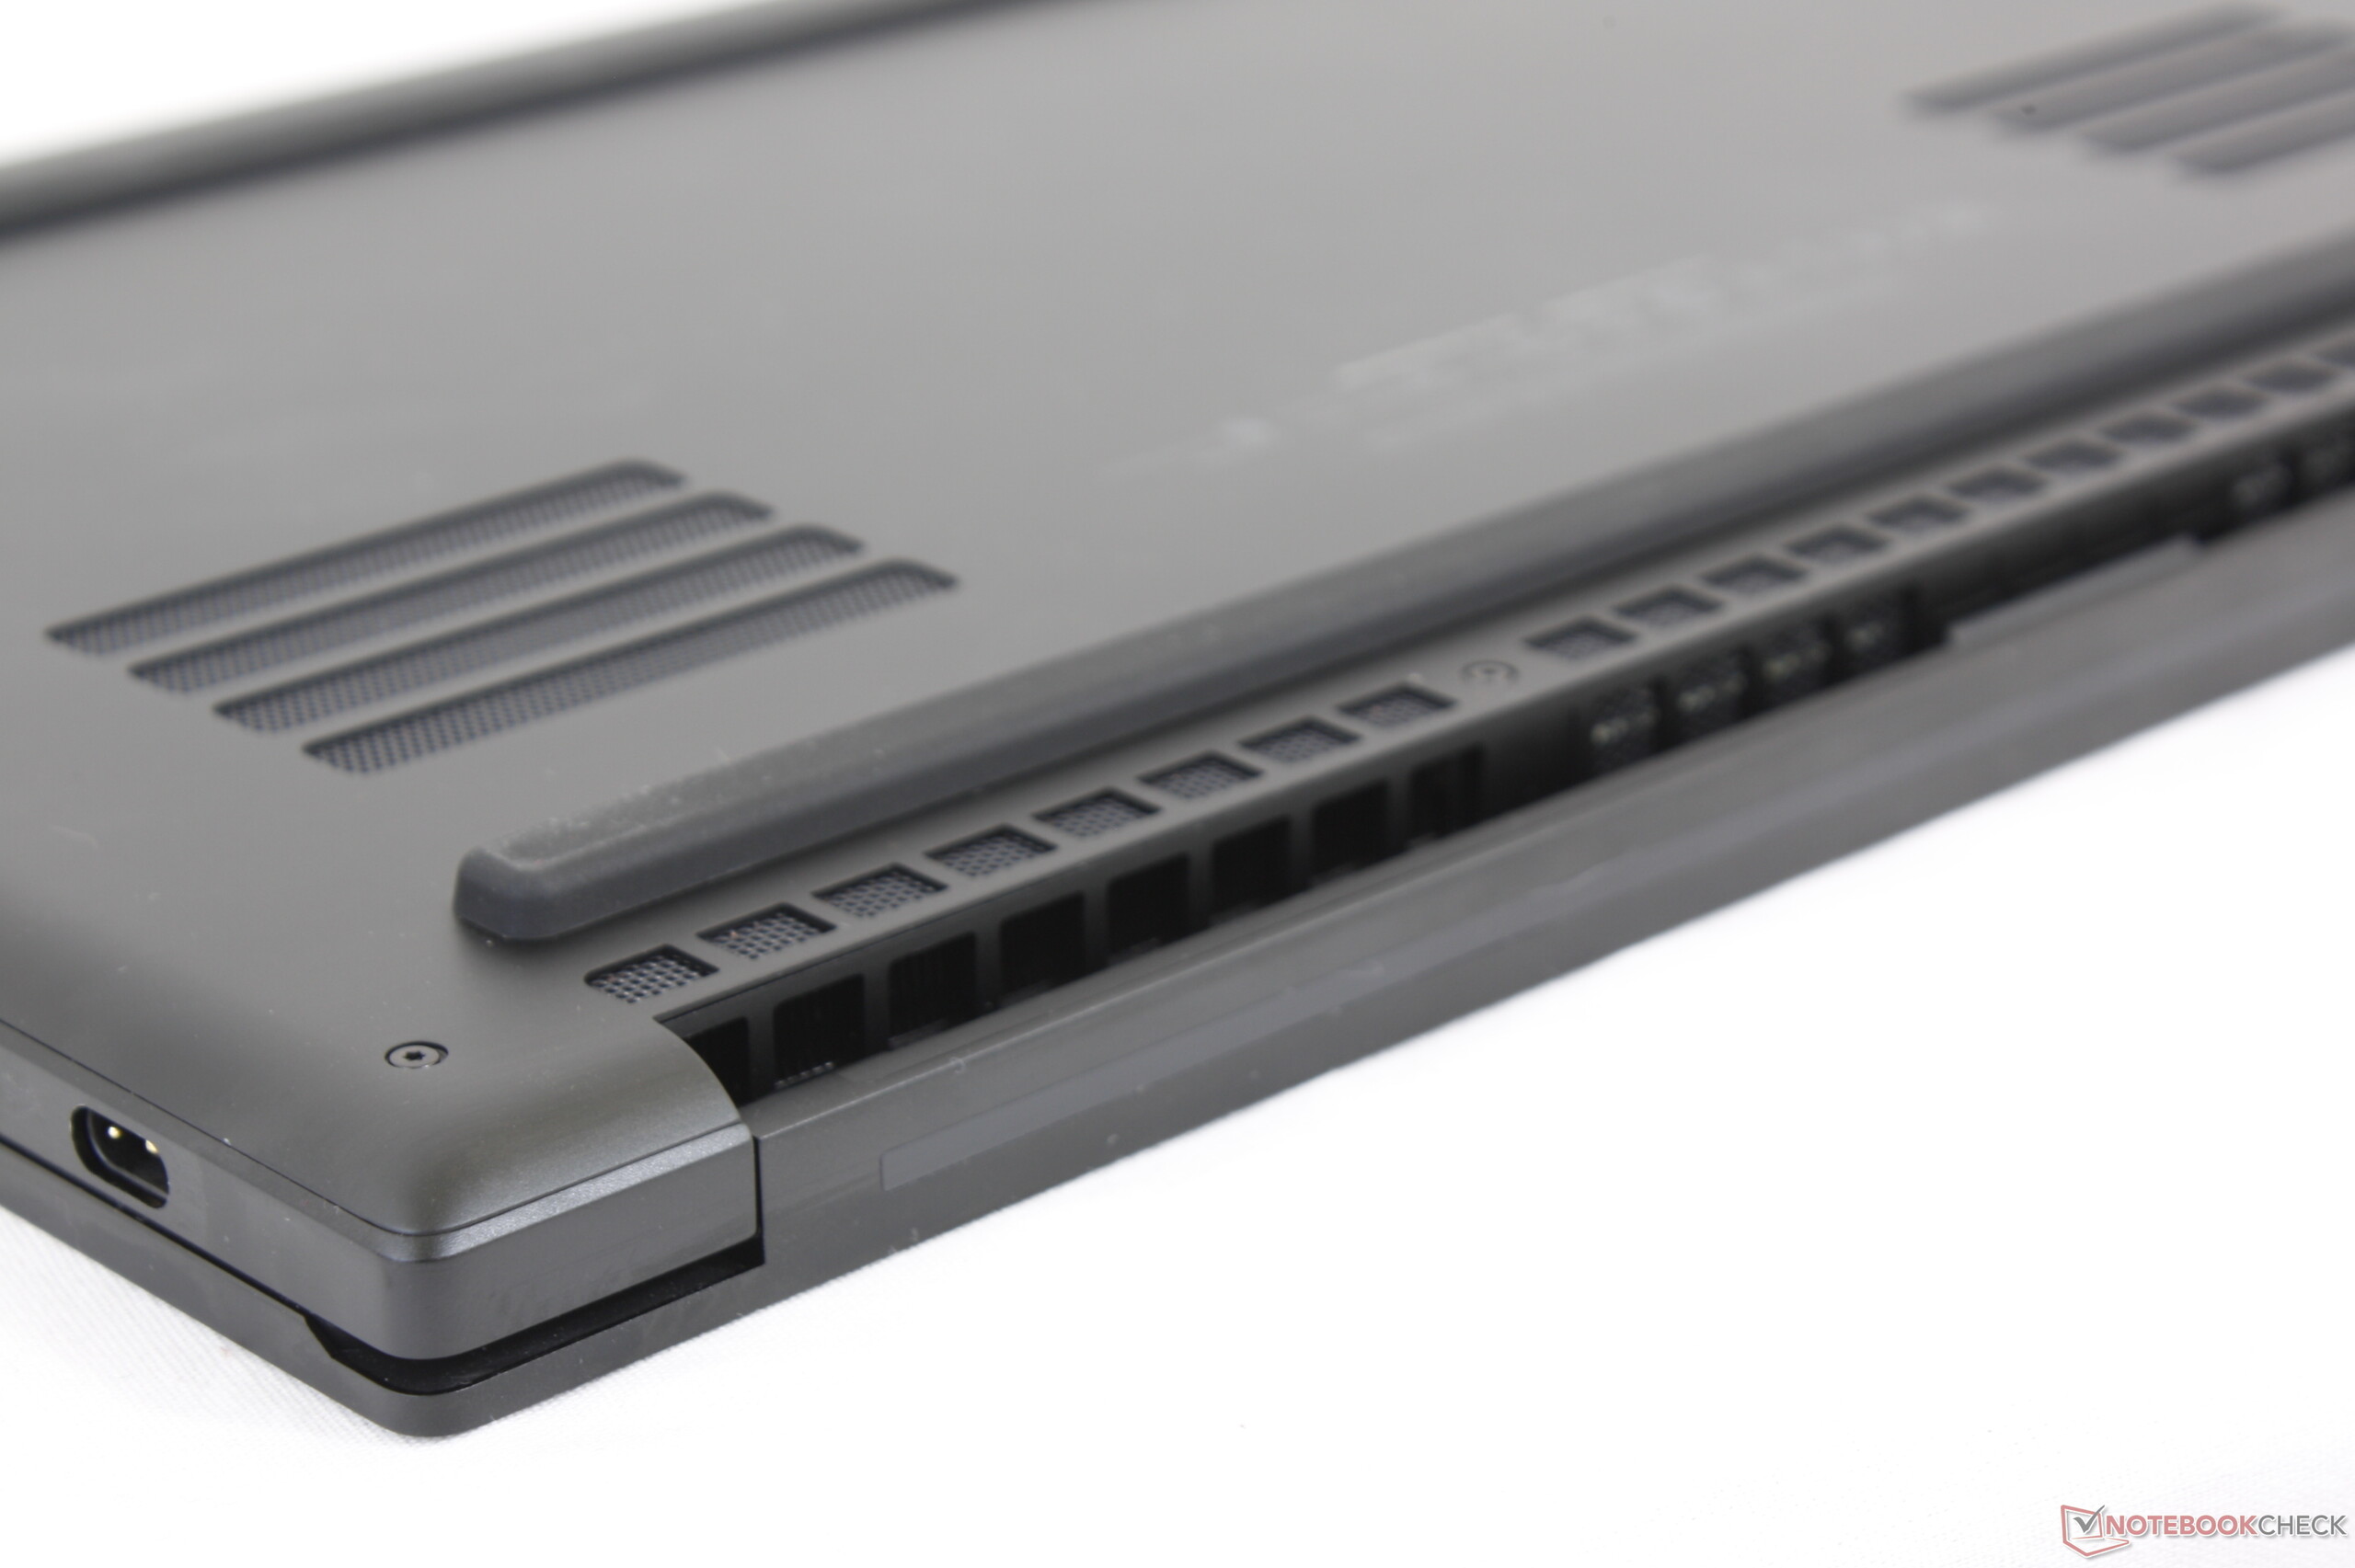
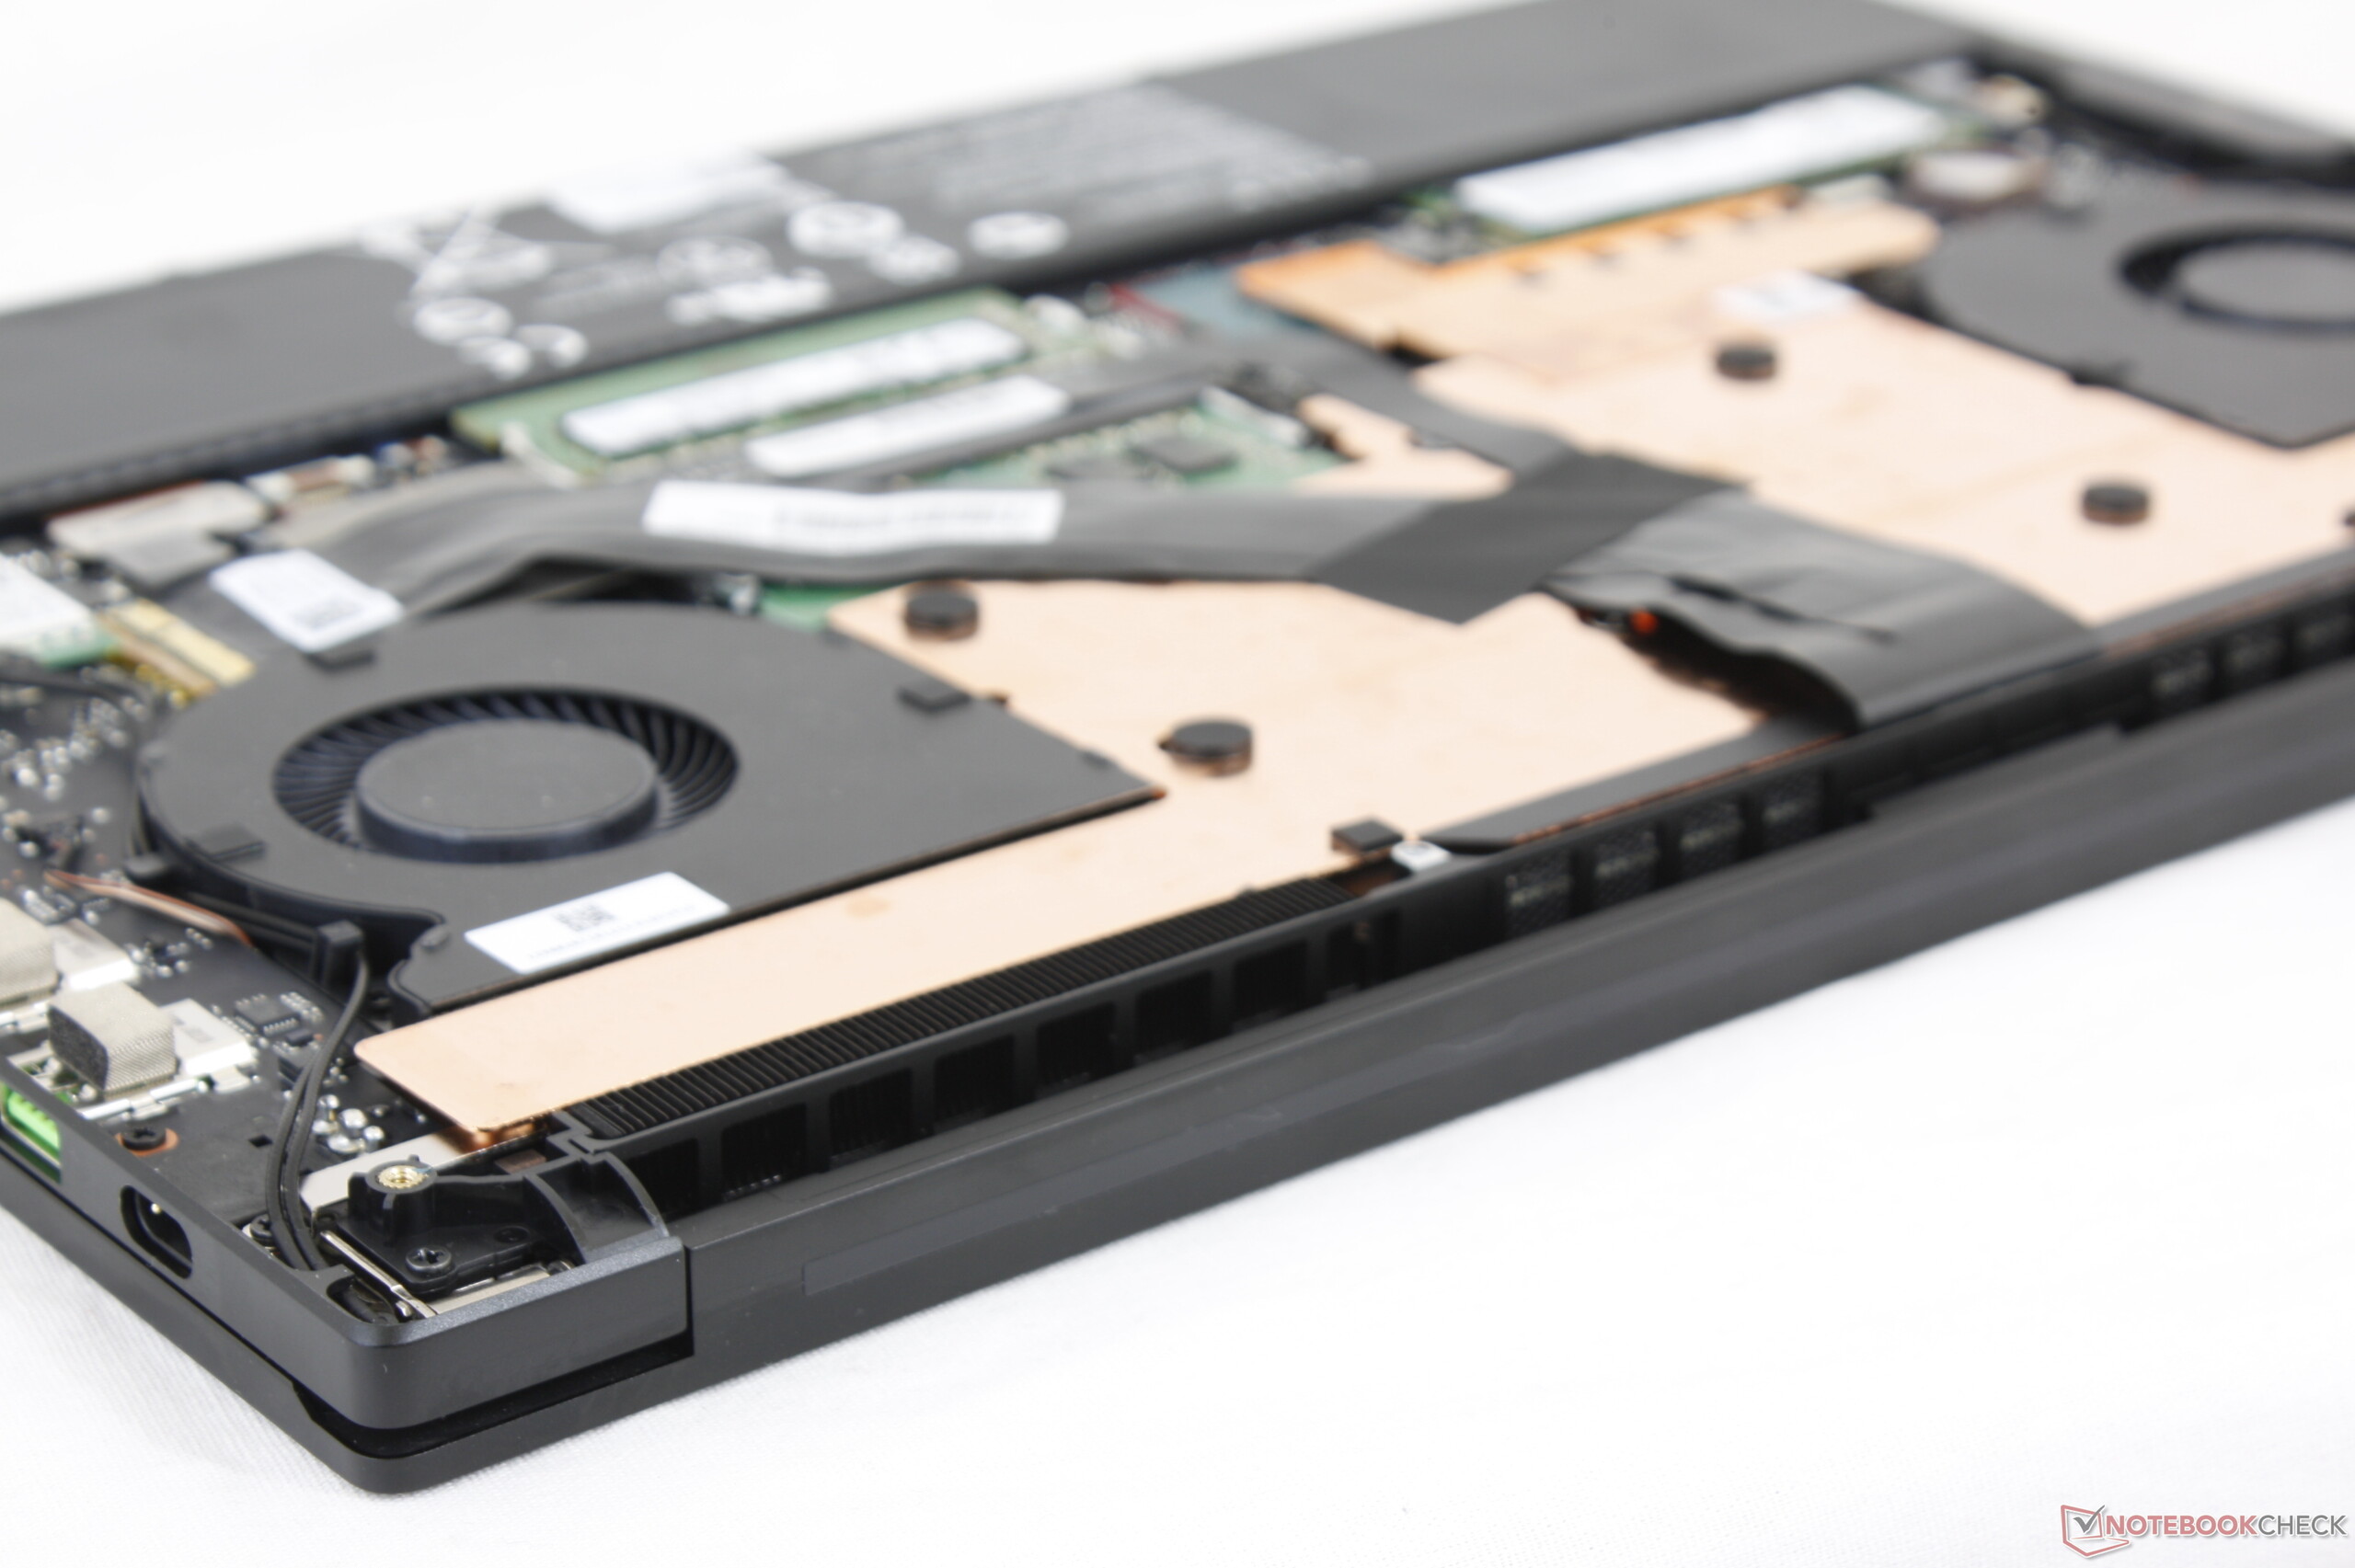
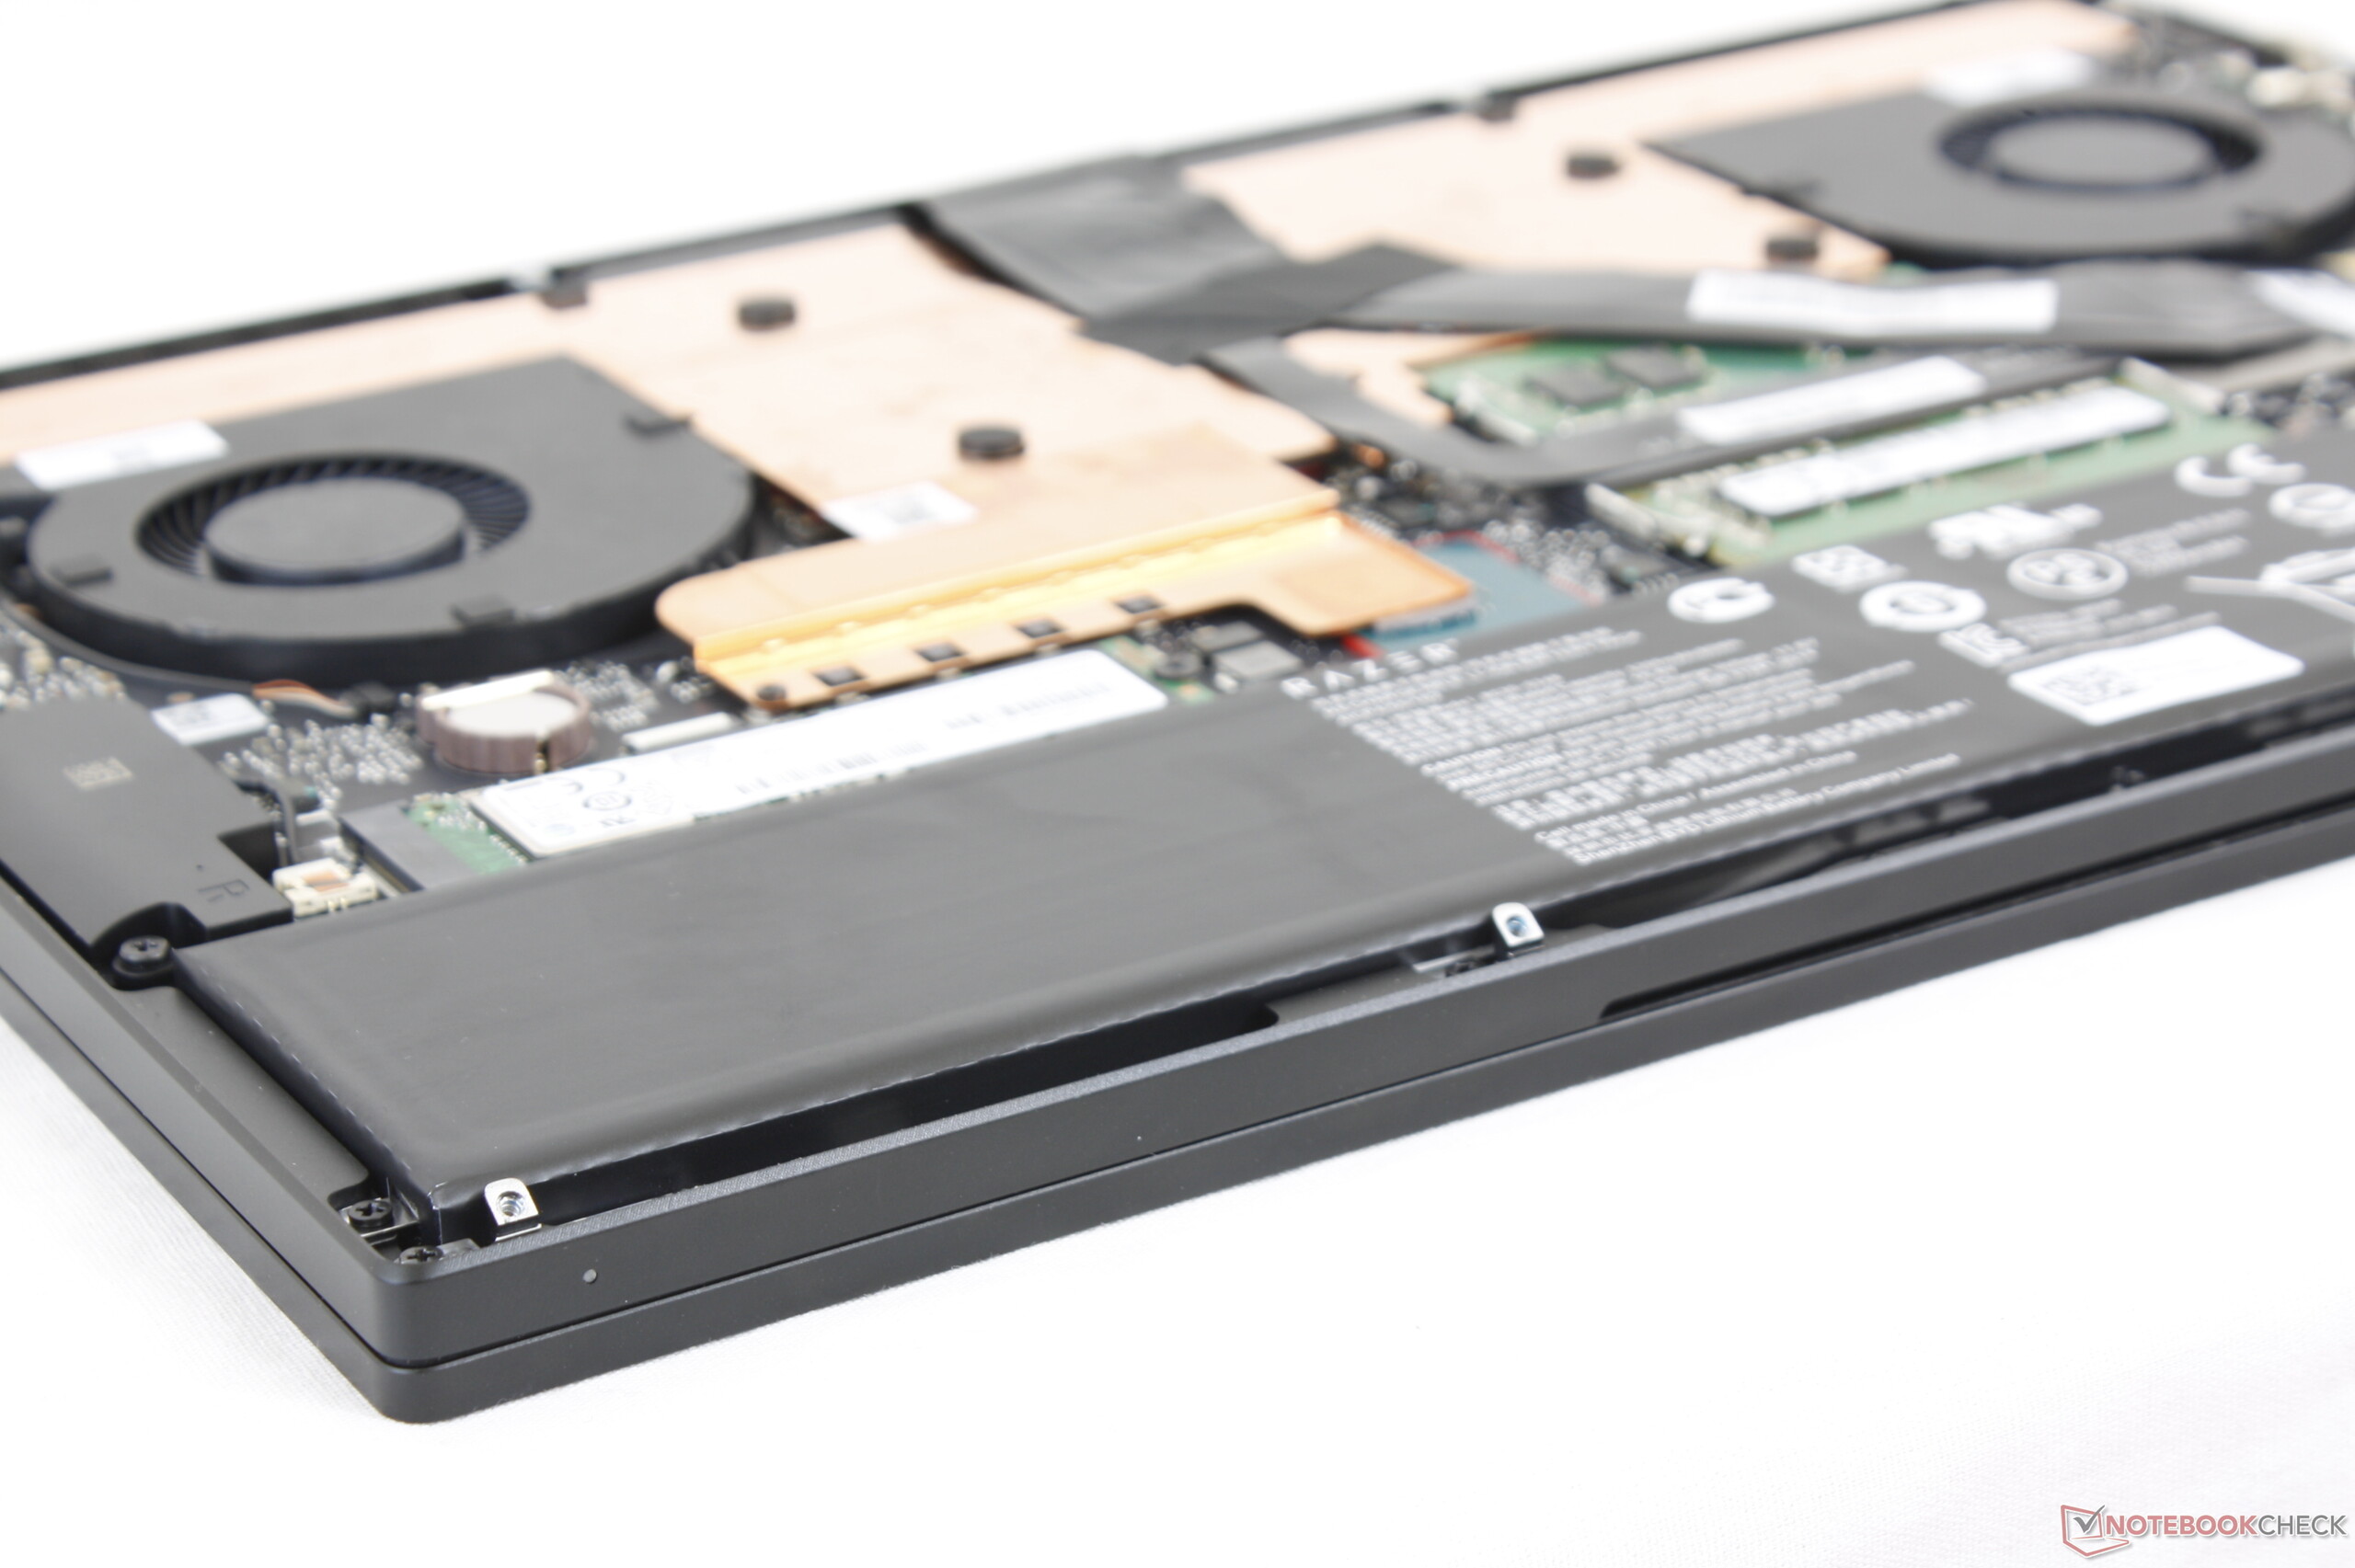
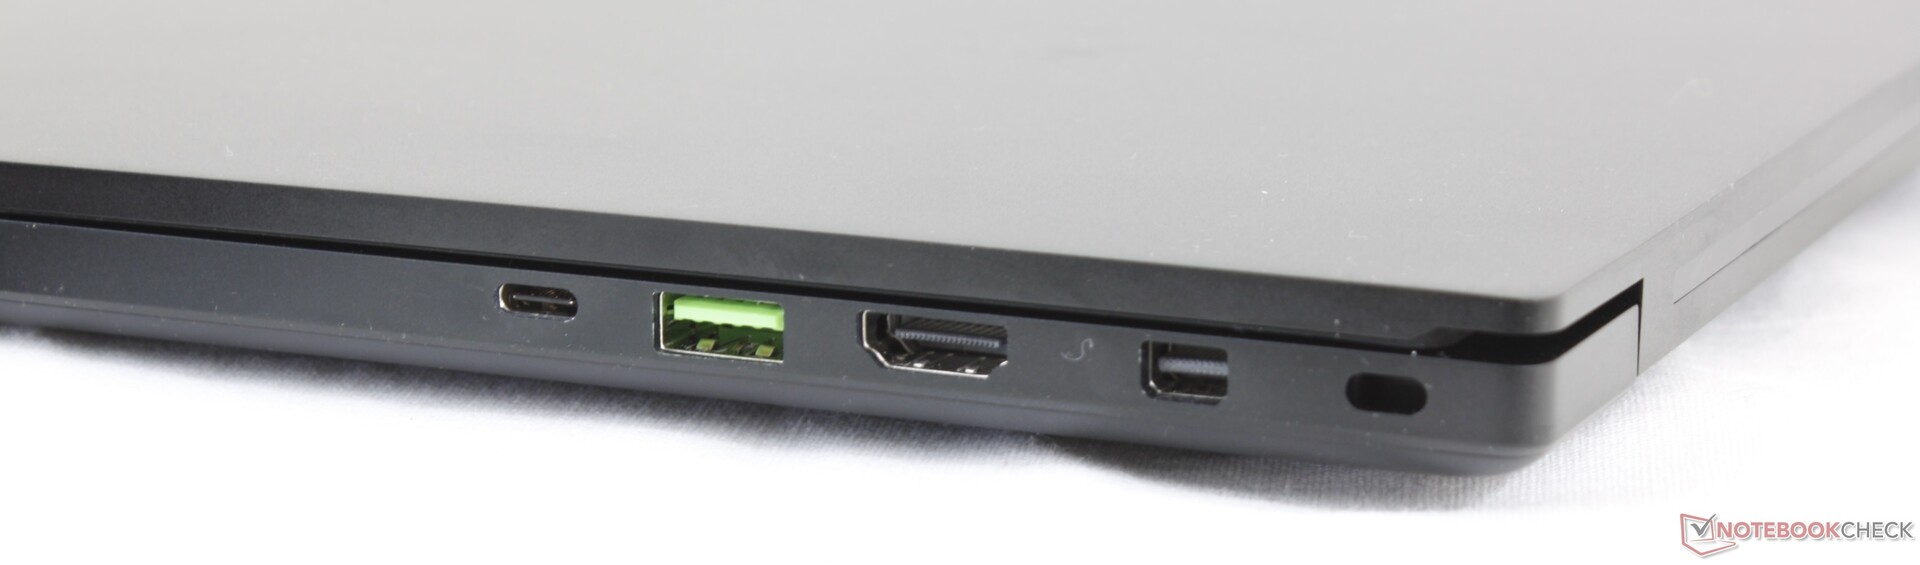
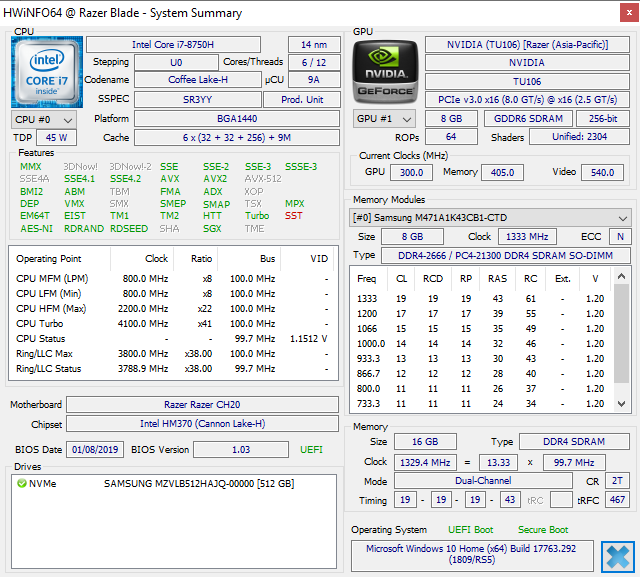
Classificamos o Blade 15 2018 como um dos melhores portáteis para jogos ultrafinos do mercado e este modelo do início de 2019 não é diferente. Todas as principais vantagens (construção fina e sólida, aberturas estreitas, tela pré calibrada) e desvantagens (deslocamento raso das teclas, Turbo Boost limitado da CPU, sem leitor SD, RJ-45 ou armazenamento secundário) do Modelo Avançado Blade 15 do ano passado permanecem em vigor para esta última iteração. Fora da troca esperada da GPU, a Razer também atualizou silenciosamente o WLAN e o armazenamento da Intel 9260 para a Intel 9560 e da Samsung PM961 para a PM981, respectivamente.
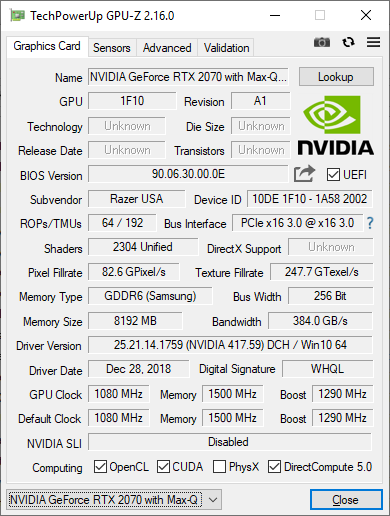
No que diz respeito à GPU, a RTX 2070 Max-Q é mais rápida que a GTX 1070 Max-Q sem funcionar de forma mais barulhenta, nem mais quente. O desempenho geral dos jogos é muito semelhante ao de um portátil GTX 1080 Max-Q quando não levar em conta qualquer capacidade de ray tracing. Portanto, a menos que o ray tracing ou DLSS sejam recursos indispensáveis (vamos encarar — 99 por cento dos títulos de PC nem sequer suportam essas opções avançadas), o desempenho é apenas cerca de 15% mais rápido que o muito menos caro Blade 15 GTX 1070 Max-Q. Usuários que procuram um portátil de jogos ultrafino encontrarão o modelo Blade 15 Advanced antigo muito mais atraente por esse motivo.
Não mudou muito, mas não precisa. Todas as coisas boas do Blade 15 agora estão de volta com força total com a Nvidia RTX. Se o ray tracing não for de interesse, então o visualmente idêntico, ainda mais barato Blade 15 Advanced Model 2018 pode fornecer quase a mesma experiência de jogos que o RTX 2070 Max-Q na maioria dos casos.
Razer Blade 15 RTX 2070 Max-Q
- 09/20/2019 v7 (old)
Allen Ngo
Price comparison
