Breve Análise do Portátil Gigabyte Aero 15-X9 (Core i7-8750H, RTX 2070 Max-Q)
| SD Card Reader | |
| average JPG Copy Test (av. of 3 runs) | |
| Gigabyte Aero 15-X9 (Toshiba Exceria Pro SDXC 64 GB UHS-II) | |
| Gigabyte Aero 15X v8 (Toshiba Exceria Pro SDXC 64 GB UHS-II) | |
| Média da turma Gaming (20.9 - 210, n=54, últimos 2 anos) | |
| maximum AS SSD Seq Read Test (1GB) | |
| Gigabyte Aero 15X v8 (Toshiba Exceria Pro SDXC 64 GB UHS-II) | |
| Gigabyte Aero 15-X9 (Toshiba Exceria Pro SDXC 64 GB UHS-II) | |
| Média da turma Gaming (25.5 - 261, n=51, últimos 2 anos) | |
| |||||||||||||||||||||||||
iluminação: 85 %
iluminação com acumulador: 250 cd/m²
Contraste: 862:1 (Preto: 0.29 cd/m²)
ΔE ColorChecker Calman: 1.46 | ∀{0.5-29.43 Ø4.72}
ΔE Greyscale Calman: 1.27 | ∀{0.09-98 Ø4.97}
93% sRGB (Argyll 1.6.3 3D)
60% AdobeRGB 1998 (Argyll 1.6.3 3D)
64.5% AdobeRGB 1998 (Argyll 3D)
93.1% sRGB (Argyll 3D)
63.5% Display P3 (Argyll 3D)
Gamma: 2.4
CCT: 6749 K
| Gigabyte Aero 15-X9 LGD05C0, IPS, 1920x1080 | Gigabyte Aero 15X v8 LGD05C0, IPS, 1920x1080 | Asus Zephyrus S GX531GS AU Optronics B156HAN08.2 (AUO82ED), IPS, 1920x1080 | MSI GS65 8RF-019DE Stealth Thin AU Optronics B156HAN08.0 (AUO80ED), IPS, 1920x1080 | Razer Blade 15 RTX 2070 Max-Q LG Philips LGD05C0, IPS, 1920x1080 | Acer Predator Triton 500 AU Optronics B156HAN08.2 (AUO82ED), IPS, 1920x1080 | |
|---|---|---|---|---|---|---|
| Display | 1% | 2% | 2% | 3% | 1% | |
| Display P3 Coverage (%) | 63.5 | 63.6 0% | 66.7 5% | 66.2 4% | 65.3 3% | 64.2 1% |
| sRGB Coverage (%) | 93.1 | 93.8 1% | 91.2 -2% | 92.1 -1% | 94.9 2% | 92.6 -1% |
| AdobeRGB 1998 Coverage (%) | 64.5 | 64.9 1% | 66.7 3% | 67.2 4% | 66.3 3% | 65.7 2% |
| Response Times | 8% | 41% | -1% | 7% | 35% | |
| Response Time Grey 50% / Grey 80% * (ms) | 16.4 ? | 16.8 ? -2% | 7.4 ? 55% | 17.6 ? -7% | 16.8 ? -2% | 8 ? 51% |
| Response Time Black / White * (ms) | 13.6 ? | 11.2 ? 18% | 10 ? 26% | 12.8 ? 6% | 11.6 ? 15% | 11.2 ? 18% |
| PWM Frequency (Hz) | ||||||
| Screen | 12% | -18% | -10% | -31% | -75% | |
| Brightness middle (cd/m²) | 250 | 313 25% | 294 18% | 254 2% | 314.7 26% | 304 22% |
| Brightness (cd/m²) | 235 | 300 28% | 275 17% | 262 11% | 312 33% | 299 27% |
| Brightness Distribution (%) | 85 | 78 -8% | 84 -1% | 89 5% | 90 6% | 89 5% |
| Black Level * (cd/m²) | 0.29 | 0.33 -14% | 0.24 17% | 0.22 24% | 0.38 -31% | 0.27 7% |
| Contrast (:1) | 862 | 948 10% | 1225 42% | 1155 34% | 828 -4% | 1126 31% |
| Colorchecker dE 2000 * | 1.46 | 1.29 12% | 2.57 -76% | 2.37 -62% | 2.56 -75% | 4.66 -219% |
| Colorchecker dE 2000 max. * | 2.47 | 2.04 17% | 4.88 -98% | 4.71 -91% | 4.89 -98% | 9.65 -291% |
| Greyscale dE 2000 * | 1.27 | 0.69 46% | 2.41 -90% | 1.58 -24% | 3.4 -168% | 5.53 -335% |
| Gamma | 2.4 92% | 2.43 91% | 2.5 88% | 2.48 89% | 2.3 96% | 2.5 88% |
| CCT | 6749 96% | 6550 99% | 6370 102% | 6785 96% | 6435 101% | 8028 81% |
| Color Space (Percent of AdobeRGB 1998) (%) | 60 | 60 0% | 59 -2% | 60 0% | 60.7 1% | 60 0% |
| Color Space (Percent of sRGB) (%) | 93 | 94 1% | 91 -2% | 92 -1% | 94.6 2% | 93 0% |
| Colorchecker dE 2000 calibrated * | 2.14 | 1.84 | 1.71 | 1.72 | ||
| Média Total (Programa/Configurações) | 7% /
9% | 8% /
-6% | -3% /
-6% | -7% /
-19% | -13% /
-45% |
* ... menor é melhor
Exibir tempos de resposta
| ↔ Tempo de resposta preto para branco | ||
|---|---|---|
| 13.6 ms ... ascensão ↗ e queda ↘ combinadas | ↗ 8.4 ms ascensão | 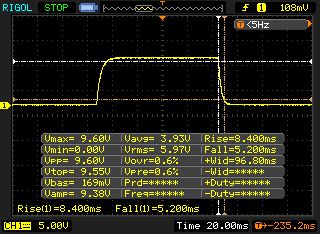 |
| ↘ 5.2 ms queda | ||
| A tela mostra boas taxas de resposta em nossos testes, mas pode ser muito lenta para jogadores competitivos. Em comparação, todos os dispositivos testados variam de 0.1 (mínimo) a 240 (máximo) ms. » 34 % de todos os dispositivos são melhores. Isso significa que o tempo de resposta medido é melhor que a média de todos os dispositivos testados (19.8 ms). | ||
| ↔ Tempo de resposta 50% cinza a 80% cinza | ||
| 16.4 ms ... ascensão ↗ e queda ↘ combinadas | ↗ 8.8 ms ascensão | 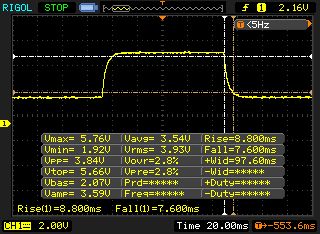 |
| ↘ 7.6 ms queda | ||
| A tela mostra boas taxas de resposta em nossos testes, mas pode ser muito lenta para jogadores competitivos. Em comparação, todos os dispositivos testados variam de 0.165 (mínimo) a 636 (máximo) ms. » 31 % de todos os dispositivos são melhores. Isso significa que o tempo de resposta medido é melhor que a média de todos os dispositivos testados (31 ms). | ||
Cintilação da tela / PWM (modulação por largura de pulso)
| Tela tremeluzindo / PWM não detectado |  | ||
[pwm_comparison] Em comparação: 52 % de todos os dispositivos testados não usam PWM para escurecer a tela. Se PWM foi detectado, uma média de 7747 (mínimo: 5 - máximo: 343500) Hz foi medida. | |||
| Cinebench R10 | |
| Rendering Single 32Bit | |
| Média da turma Gaming (7457 - 11779, n=8, últimos 2 anos) | |
| Gigabyte Aero 15-X9 | |
| Rendering Multiple CPUs 32Bit | |
| Média da turma Gaming (42932 - 81339, n=8, últimos 2 anos) | |
| Gigabyte Aero 15-X9 | |
| Geekbench 3 | |
| 32 Bit Multi-Core Score | |
| Gigabyte Aero 15-X9 | |
| 32 Bit Single-Core Score | |
| Gigabyte Aero 15-X9 | |
| Geekbench 4.0 | |
| 64 Bit Multi-Core Score | |
| Média da turma Gaming (40469 - 76142, n=4, últimos 2 anos) | |
| Gigabyte Aero 15-X9 | |
| 64 Bit Single-Core Score | |
| Média da turma Gaming (7589 - 9053, n=4, últimos 2 anos) | |
| Gigabyte Aero 15-X9 | |
| Geekbench 4.4 | |
| 64 Bit Multi-Core Score | |
| Média da turma Gaming (89200 - 97490, n=2, últimos 2 anos) | |
| Gigabyte Aero 15-X9 | |
| 64 Bit Single-Core Score | |
| Média da turma Gaming (9335 - 9492, n=2, últimos 2 anos) | |
| Gigabyte Aero 15-X9 | |
| Mozilla Kraken 1.1 - Total | |
| Gigabyte Aero 15-X9 (Edge 44) | |
| Razer Blade 15 RTX 2070 Max-Q (Edge 44.17763.1.0) | |
| Média da turma Gaming (391 - 590, n=99, últimos 2 anos) | |
| Octane V2 - Total Score | |
| Média da turma Gaming (93292 - 139447, n=27, últimos 2 anos) | |
| Gigabyte Aero 15-X9 (Edge 44) | |
| Razer Blade 15 RTX 2070 Max-Q (Edge 44.17763.1.0) | |
| JetStream 1.1 - 1.1 Total | |
| Média da turma Gaming (549 - 647, n=3, últimos 2 anos) | |
| Razer Blade 15 RTX 2070 Max-Q (Edge 44.17763.1.0) | |
| Gigabyte Aero 15-X9 (Edge 44) | |
* ... menor é melhor
| PCMark 7 Score | 6400 pontos | |
| PCMark 8 Home Score Accelerated v2 | 4338 pontos | |
| PCMark 8 Creative Score Accelerated v2 | 5111 pontos | |
| PCMark 8 Work Score Accelerated v2 | 5645 pontos | |
| PCMark 10 Score | 5353 pontos | |
Ajuda | ||

| Gigabyte Aero 15-X9 Intel SSD 760p SSDPEKKW010T8 | Gigabyte Aero 15X v8 Toshiba NVMe THNSN5512GPU7 | Asus Zephyrus S GX531GS WDC PC SN520 SDAPNUW-512G | MSI GS65 8RF-019DE Stealth Thin Samsung SSD PM981 MZVLB512HAJQ | Razer Blade 15 RTX 2070 Max-Q Samsung SSD PM981 MZVLB512HAJQ | Acer Predator Triton 500 2x WDC PC SN720 SDAPNTW-256G-1014 (RAID 0) | |
|---|---|---|---|---|---|---|
| CrystalDiskMark 5.2 / 6 | -10% | -14% | 1% | 3% | 23% | |
| Write 4K (MB/s) | 97.1 | 94.4 -3% | 98.2 1% | 95.3 -2% | 93.9 -3% | 93.6 -4% |
| Read 4K (MB/s) | 53.7 | 37.65 -30% | 39.43 -27% | 40.13 -25% | 40.56 -24% | 38.82 -28% |
| Write Seq (MB/s) | 1526 | 1335 -13% | 1386 -9% | 1883 23% | 1468 -4% | 2455 61% |
| Read Seq (MB/s) | 2020 | 1404 -30% | 1100 -46% | 1322 -35% | 1540 -24% | 2107 4% |
| Write 4K Q32T1 (MB/s) | 285.6 | 268.6 -6% | 270.3 -5% | 309.9 9% | 293.5 3% | 298.7 5% |
| Read 4K Q32T1 (MB/s) | 321.8 | 332.8 3% | 340.3 6% | 353.7 10% | 346 8% | 338.7 5% |
| Write Seq Q32T1 (MB/s) | 1533 | 1375 -10% | 1454 -5% | 1919 25% | 1941 27% | 2902 89% |
| Read Seq Q32T1 (MB/s) | 2351 | 2627 12% | 1681 -28% | 2466 5% | 3266 39% | 3536 50% |
| 3DMark 06 Standard Score | 34534 pontos | |
| 3DMark 11 Performance | 16608 pontos | |
| 3DMark Ice Storm Standard Score | 80496 pontos | |
| 3DMark Cloud Gate Standard Score | 31838 pontos | |
| 3DMark Fire Strike Score | 15587 pontos | |
| 3DMark Time Spy Score | 6400 pontos | |
Ajuda | ||
| 3DMark | |
| 1920x1080 Fire Strike Graphics | |
| Média da turma Gaming (12242 - 62849, n=114, últimos 2 anos) | |
| Razer Blade 15 RTX 2070 Max-Q | |
| Gigabyte Aero 15-X9 | |
| Gigabyte Aero 15X v8 | |
| MSI GS65 8RF-019DE Stealth Thin | |
| 2560x1440 Time Spy Graphics | |
| Média da turma Gaming (5012 - 26212, n=114, últimos 2 anos) | |
| Razer Blade 15 RTX 2070 Max-Q | |
| Gigabyte Aero 15-X9 | |
| 2560x1440 Port Royal Graphics | |
| Média da turma Gaming (4395 - 17286, n=70, últimos 2 anos) | |
| Razer Blade 15 RTX 2070 Max-Q | |
| Gigabyte Aero 15-X9 | |
| baixo | média | alto | ultra | |
|---|---|---|---|---|
| BioShock Infinite (2013) | 233.9 | 217.9 | 202.6 | 127.7 |
| GTA V (2015) | 133.1 | 123.1 | 92.9 | 54.2 |
| The Witcher 3 (2015) | 177.7 | 144.9 | 86.5 | 58.3 |
| Ashes of the Singularity (2016) | 60.2 | 53.1 | 52.6 | |
| Destiny 2 (2017) | 110.9 | 95.9 | 96.9 | 96.1 |
| X-Plane 11.11 (2018) | 84.6 | 70.2 | 61.6 | |
| Far Cry 5 (2018) | 94 | 73 | 70 | 67 |
| Darksiders III (2018) | 102.2 | 68.2 | 65.3 | 64.9 |
| The Witcher 3 - 1920x1080 Ultra Graphics & Postprocessing (HBAO+) | |
| Média da turma Gaming (104.7 - 240, n=6, últimos 2 anos) | |
| Acer Predator Triton 500 | |
| Razer Blade 15 RTX 2070 Max-Q | |
| Gigabyte Aero 15-X9 | |
| MSI GS65 8RF-019DE Stealth Thin | |
| Gigabyte Aero 15X v8 | |
| Asus Zephyrus S GX531GS | |
| BioShock Infinite - 1920x1080 Ultra Preset, DX11 (DDOF) | |
| Razer Blade 15 RTX 2070 Max-Q | |
| Gigabyte Aero 15-X9 | |
Barulho
| Ocioso |
| 32 / 34 / 36 dB |
| Carga |
| 42 / 48 dB |
 | ||
30 dB silencioso 40 dB(A) audível 50 dB(A) ruidosamente alto |
||
min: | ||
| Gigabyte Aero 15-X9 i7-8750H, GeForce RTX 2070 Max-Q | Gigabyte Aero 15X v8 i7-8750H, GeForce GTX 1070 Max-Q | Asus Zephyrus S GX531GS i7-8750H, GeForce GTX 1070 Max-Q | MSI GS65 8RF-019DE Stealth Thin i7-8750H, GeForce GTX 1070 Max-Q | Razer Blade 15 RTX 2070 Max-Q i7-8750H, GeForce RTX 2070 Max-Q | Acer Predator Triton 500 i7-8750H, GeForce RTX 2080 Max-Q | Média da turma Gaming | |
|---|---|---|---|---|---|---|---|
| Noise | -4% | -7% | 5% | 10% | 2% | 10% | |
| desligado / ambiente * (dB) | 30 | 29 3% | 29 3% | 30 -0% | 28.8 4% | 29 3% | 24.1 ? 20% |
| Idle Minimum * (dB) | 32 | 30 6% | 33 -3% | 30 6% | 28.8 10% | 30 6% | 25.9 ? 19% |
| Idle Average * (dB) | 34 | 31 9% | 34 -0% | 31 9% | 28.8 15% | 32 6% | 27.4 ? 19% |
| Idle Maximum * (dB) | 36 | 35 3% | 40 -11% | 34 6% | 29.4 18% | 34 6% | 30.1 ? 16% |
| Load Average * (dB) | 42 | 49 -17% | 47 -12% | 43 -2% | 35.7 15% | 44 -5% | 43.6 ? -4% |
| Witcher 3 ultra * (dB) | 44 | 51 -16% | 51 -16% | 42 5% | 42.5 3% | 46 -5% | |
| Load Maximum * (dB) | 48 | 54 -13% | 53 -10% | 44 8% | 45 6% | 47 2% | 54.2 ? -13% |
* ... menor é melhor
(-) A temperatura máxima no lado superior é 56 °C / 133 F, em comparação com a média de 40.4 °C / 105 F , variando de 21.2 a 68.8 °C para a classe Gaming.
(-) A parte inferior aquece até um máximo de 66 °C / 151 F, em comparação com a média de 43.2 °C / 110 F
(+) Em uso inativo, a temperatura média para o lado superior é 25.4 °C / 78 F, em comparação com a média do dispositivo de 33.9 °C / ### class_avg_f### F.
(-) Jogando The Witcher 3, a temperatura média para o lado superior é 44.3 °C / 112 F, em comparação com a média do dispositivo de 33.9 °C / ## #class_avg_f### F.
(±) Os apoios para as mãos e o touchpad podem ficar muito quentes ao toque, com um máximo de 38 °C / 100.4 F.
(-) A temperatura média da área do apoio para as mãos de dispositivos semelhantes foi 28.8 °C / 83.8 F (-9.2 °C / -16.6 F).
| Gigabyte Aero 15-X9 i7-8750H, GeForce RTX 2070 Max-Q | Gigabyte Aero 15X v8 i7-8750H, GeForce GTX 1070 Max-Q | Asus Zephyrus S GX531GS i7-8750H, GeForce GTX 1070 Max-Q | MSI GS65 8RF-019DE Stealth Thin i7-8750H, GeForce GTX 1070 Max-Q | Razer Blade 15 RTX 2070 Max-Q i7-8750H, GeForce RTX 2070 Max-Q | Acer Predator Triton 500 i7-8750H, GeForce RTX 2080 Max-Q | Média da turma Gaming | |
|---|---|---|---|---|---|---|---|
| Heat | 0% | -2% | 9% | 11% | -5% | 1% | |
| Maximum Upper Side * (°C) | 56 | 53 5% | 54 4% | 49 12% | 49 12% | 49 12% | 45.2 ? 19% |
| Maximum Bottom * (°C) | 66 | 65 2% | 60 9% | 63 5% | 49 26% | 58 12% | 48.2 ? 27% |
| Idle Upper Side * (°C) | 27 | 26 4% | 30 -11% | 24 11% | 25.4 6% | 33 -22% | 31 ? -15% |
| Idle Bottom * (°C) | 27 | 30 -11% | 30 -11% | 25 7% | 27.2 -1% | 33 -22% | 34.3 ? -27% |
* ... menor é melhor
Gigabyte Aero 15-X9 análise de áudio
(±) | o volume do alto-falante é médio, mas bom (###valor### dB)
Graves 100 - 315Hz
(±) | graves reduzidos - em média 14% menor que a mediana
(±) | a linearidade dos graves é média (13.7% delta para a frequência anterior)
Médios 400 - 2.000 Hz
(±) | médios mais altos - em média 6.2% maior que a mediana
(±) | a linearidade dos médios é média (7.9% delta para frequência anterior)
Altos 2 - 16 kHz
(+) | agudos equilibrados - apenas 4.4% longe da mediana
(±) | a linearidade dos máximos é média (9.7% delta para frequência anterior)
Geral 100 - 16.000 Hz
(±) | a linearidade do som geral é média (17.5% diferença em relação à mediana)
Comparado com a mesma classe
» 49% de todos os dispositivos testados nesta classe foram melhores, 12% semelhantes, 40% piores
» O melhor teve um delta de 6%, a média foi 18%, o pior foi 132%
Comparado com todos os dispositivos testados
» 34% de todos os dispositivos testados foram melhores, 8% semelhantes, 58% piores
» O melhor teve um delta de 4%, a média foi 23%, o pior foi 134%
Gigabyte Aero 15X v8 análise de áudio
(±) | o volume do alto-falante é médio, mas bom (###valor### dB)
Graves 100 - 315Hz
(-) | quase nenhum baixo - em média 16.8% menor que a mediana
(±) | a linearidade dos graves é média (11.6% delta para a frequência anterior)
Médios 400 - 2.000 Hz
(+) | médios equilibrados - apenas 4.3% longe da mediana
(+) | médios são lineares (5% delta para frequência anterior)
Altos 2 - 16 kHz
(+) | agudos equilibrados - apenas 3.6% longe da mediana
(±) | a linearidade dos máximos é média (9.1% delta para frequência anterior)
Geral 100 - 16.000 Hz
(±) | a linearidade do som geral é média (18.4% diferença em relação à mediana)
Comparado com a mesma classe
» 59% de todos os dispositivos testados nesta classe foram melhores, 9% semelhantes, 32% piores
» O melhor teve um delta de 6%, a média foi 18%, o pior foi 132%
Comparado com todos os dispositivos testados
» 41% de todos os dispositivos testados foram melhores, 8% semelhantes, 51% piores
» O melhor teve um delta de 4%, a média foi 23%, o pior foi 134%
| desligado | |
| Ocioso | |
| Carga |
|
Key:
min: | |
| Gigabyte Aero 15-X9 i7-8750H, GeForce RTX 2070 Max-Q | Gigabyte Aero 15X v8 i7-8750H, GeForce GTX 1070 Max-Q | Asus Zephyrus S GX531GS i7-8750H, GeForce GTX 1070 Max-Q | MSI GS65 8RF-019DE Stealth Thin i7-8750H, GeForce GTX 1070 Max-Q | Razer Blade 15 RTX 2070 Max-Q i7-8750H, GeForce RTX 2070 Max-Q | Acer Predator Triton 500 i7-8750H, GeForce RTX 2080 Max-Q | Média da turma Gaming | |
|---|---|---|---|---|---|---|---|
| Power Consumption | -2% | -21% | 13% | 7% | -15% | -14% | |
| Idle Minimum * (Watt) | 16 | 14 12% | 17 -6% | 7 56% | 10.4 35% | 16 -0% | 13 ? 19% |
| Idle Average * (Watt) | 18 | 18 -0% | 20 -11% | 11 39% | 14.6 19% | 22 -22% | 18.7 ? -4% |
| Idle Maximum * (Watt) | 23 | 22 4% | 29 -26% | 20 13% | 16.3 29% | 32 -39% | 24.3 ? -6% |
| Load Average * (Watt) | 88 | 91 -3% | 112 -27% | 98 -11% | 88.5 -1% | 89 -1% | 110.2 ? -25% |
| Witcher 3 ultra * (Watt) | 120 | 142 -18% | 152 -27% | 132 -10% | 155.4 -30% | 147 -23% | |
| Load Maximum * (Watt) | 167 | 173 -4% | 211 -26% | 182 -9% | 182.4 -9% | 173 -4% | 258 ? -54% |
* ... menor é melhor
| Gigabyte Aero 15-X9 i7-8750H, GeForce RTX 2070 Max-Q, 94.24 Wh | Gigabyte Aero 15X v8 i7-8750H, GeForce GTX 1070 Max-Q, 94.24 Wh | Asus Zephyrus S GX531GS i7-8750H, GeForce GTX 1070 Max-Q, 50 Wh | MSI GS65 8RF-019DE Stealth Thin i7-8750H, GeForce GTX 1070 Max-Q, 82 Wh | Razer Blade 15 RTX 2070 Max-Q i7-8750H, GeForce RTX 2070 Max-Q, 80 Wh | Acer Predator Triton 500 i7-8750H, GeForce RTX 2080 Max-Q, 82 Wh | Média da turma Gaming | |
|---|---|---|---|---|---|---|---|
| Duração da bateria | 25% | -65% | -17% | -7% | -47% | 0% | |
| Reader / Idle (h) | 9.2 | 12.7 38% | 3.6 -61% | 8.5 -8% | 11.4 24% | 5.6 -39% | 8.71 ? -5% |
| H.264 (h) | 6.1 | 8.4 38% | 5.9 -3% | 8.64 ? 42% | |||
| WiFi v1.3 (h) | 6.4 | 8.6 34% | 2.6 -59% | 6 -6% | 6.5 2% | 3.2 -50% | 7.15 ? 12% |
| Load (h) | 2.9 | 2.6 -10% | 0.7 -76% | 1.4 -52% | 1.5 -48% | 1.4 -52% | 1.502 ? -48% |
Pro
Contra
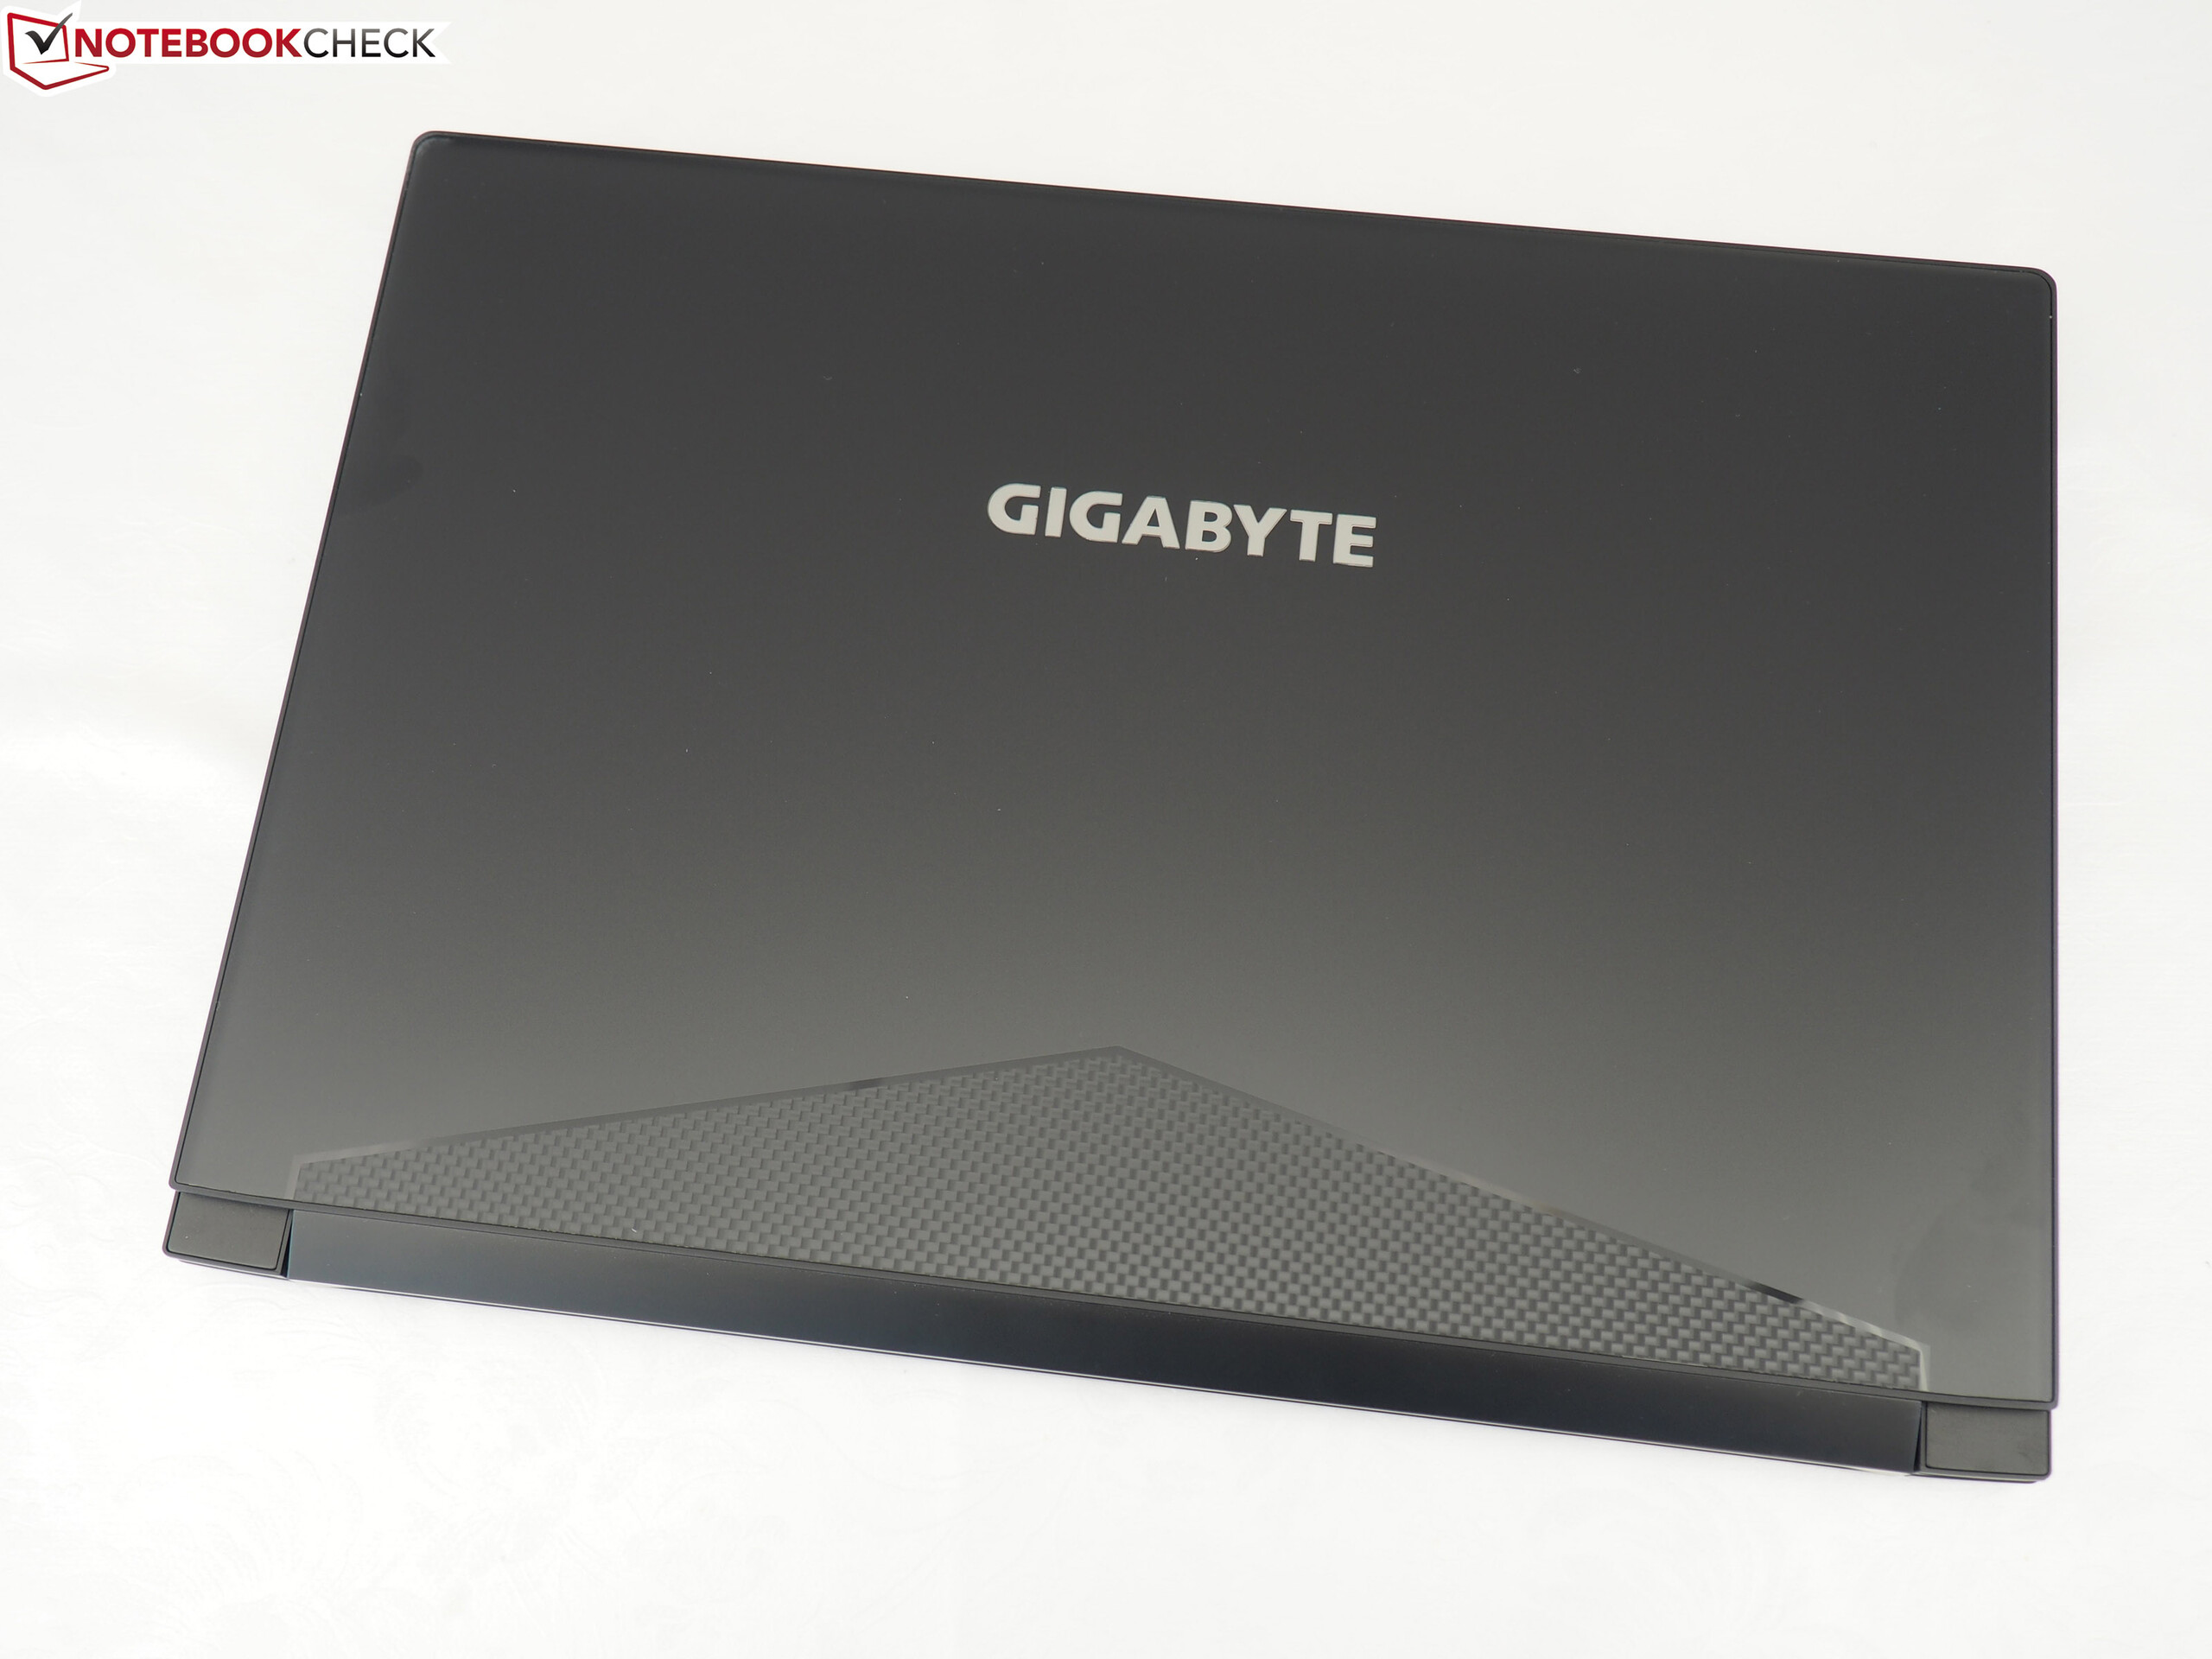
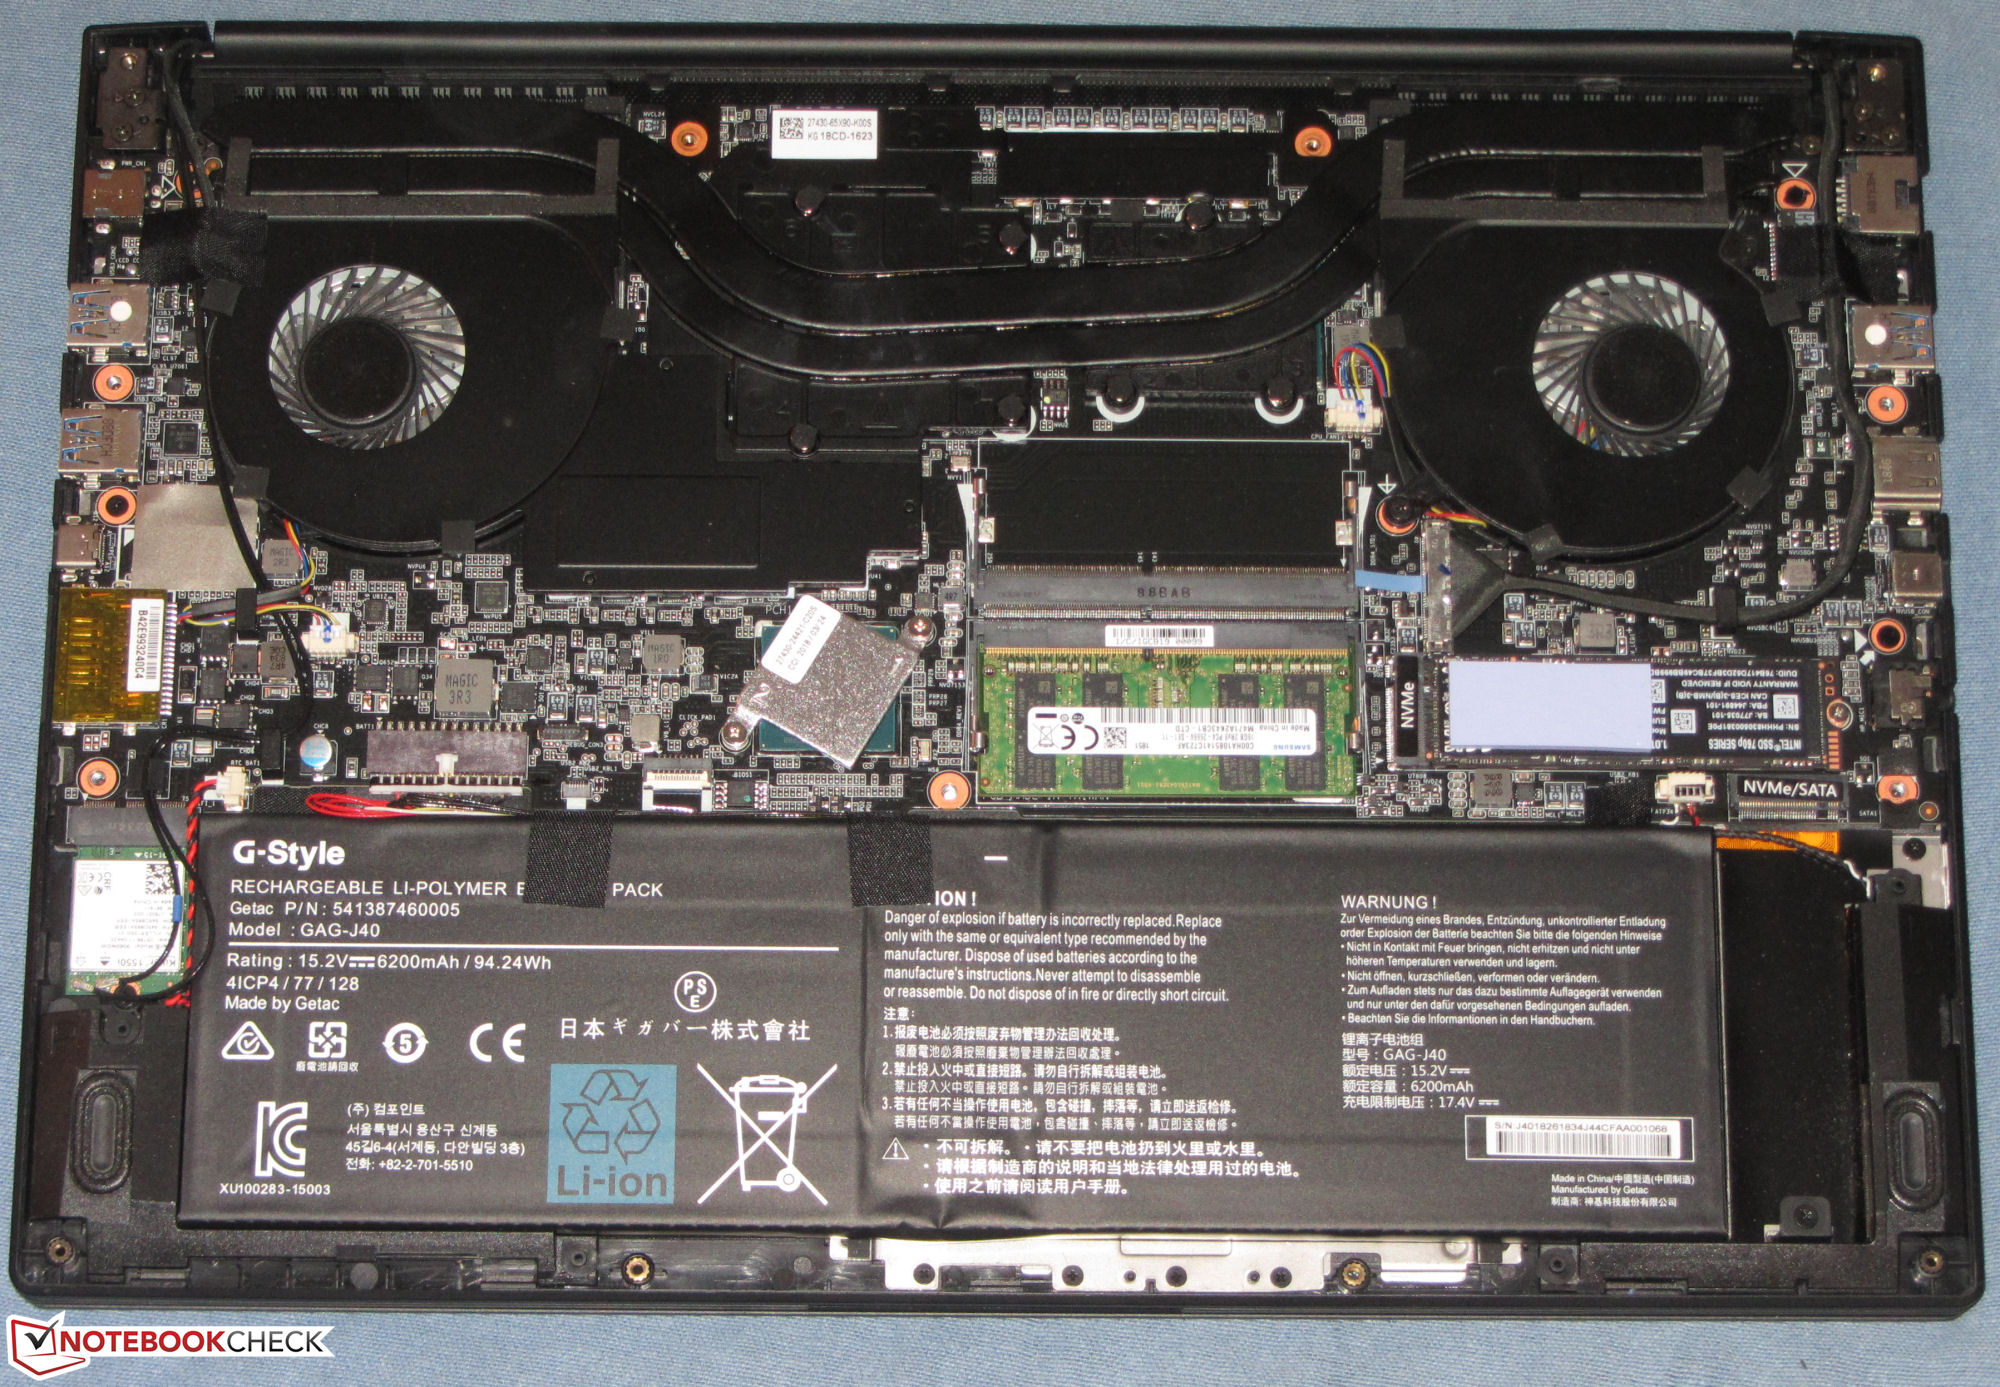
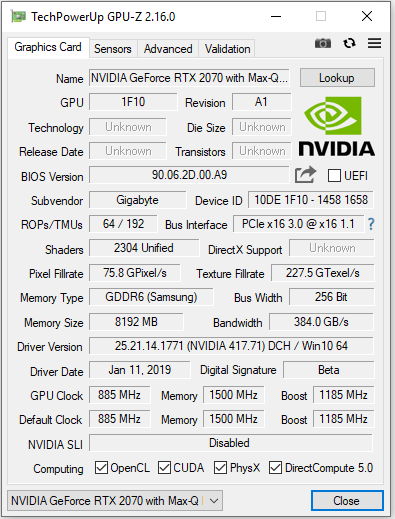
O Gigabyte Aero 15-X9 é um excelente portátil para jogos, mas é apenas um ligeiro refinamento do seu antecessor com algumas desvantagens. O processador Core i7-8750H e a GPU RTX-2070 Max-Q são uma combinação vencedora que é poderosa o suficiente para lidar com todos os jogos triple A com gráficos máximos em 1080p. Além disso, o SSD NVMe garante que o sistema funcione sem problemas mesmo quando estiver trabalhando sob uso intenso contínuo. O dispositivo é fácil de manter e atualizar também, o que é um bônus.
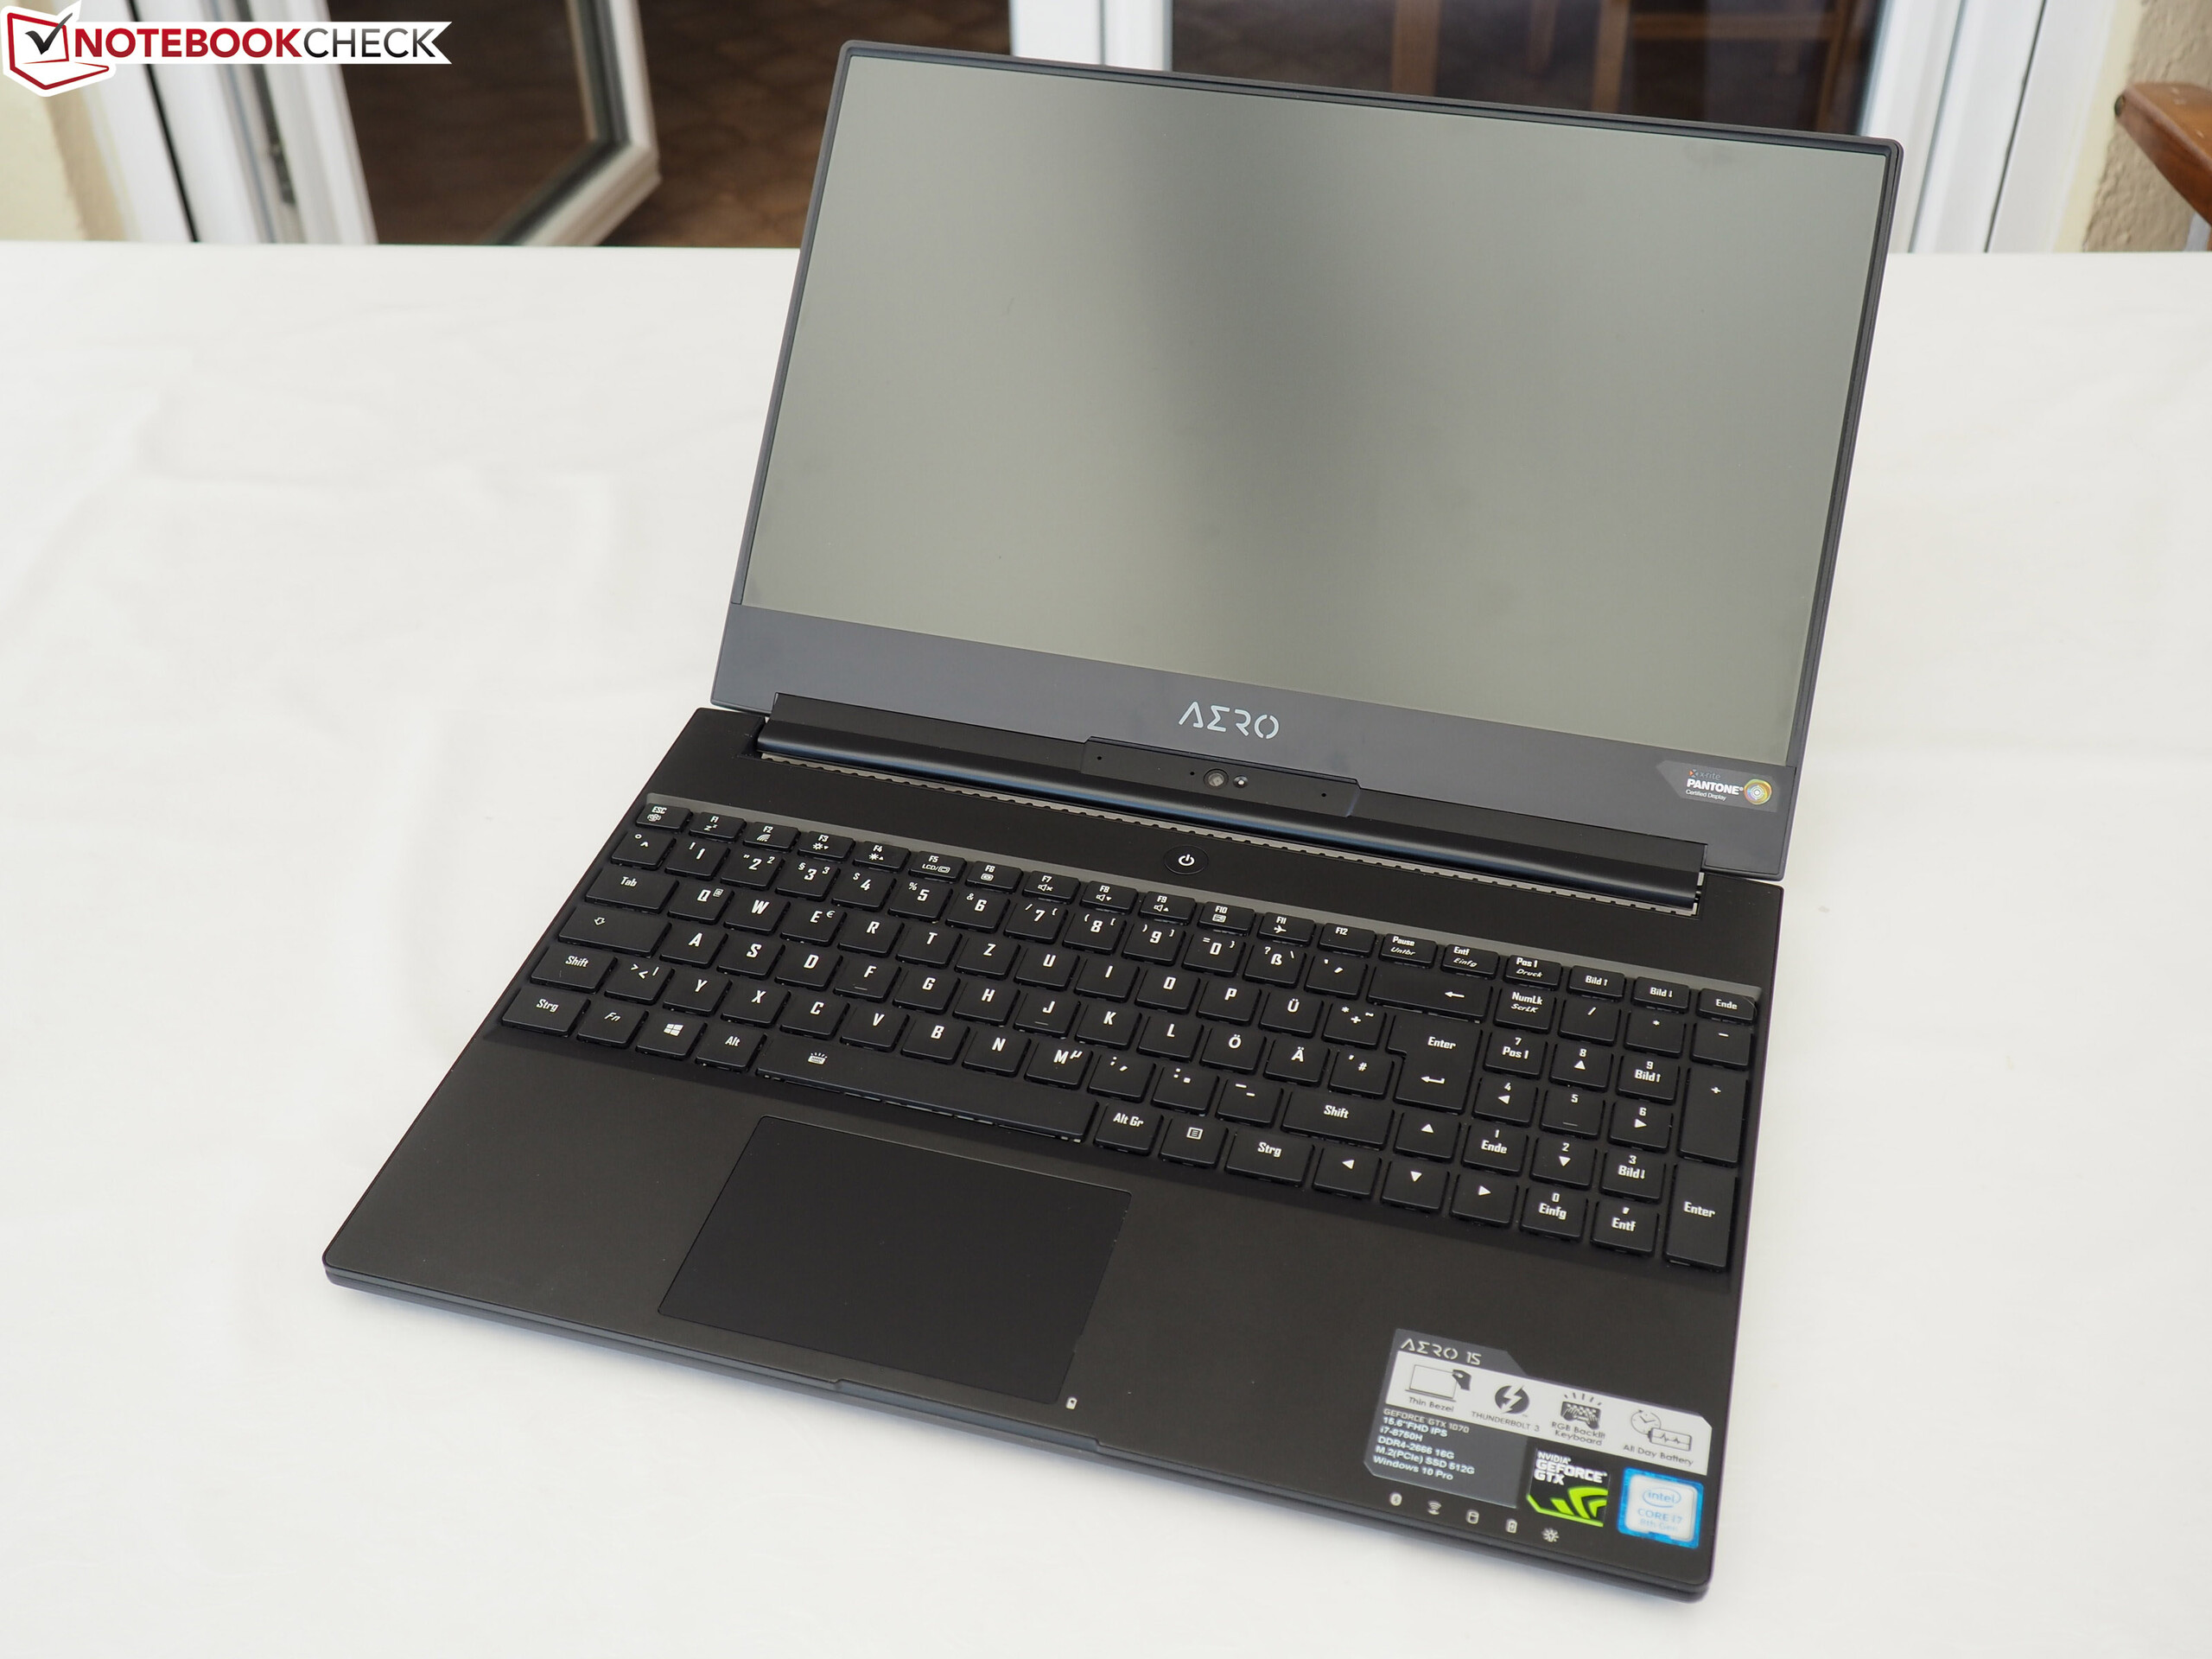
O Gigabyte Aero 15-X9 é um portátil para jogos fino e leve, mas não é tão impressionante quanto seu antecessor foi há um ano.
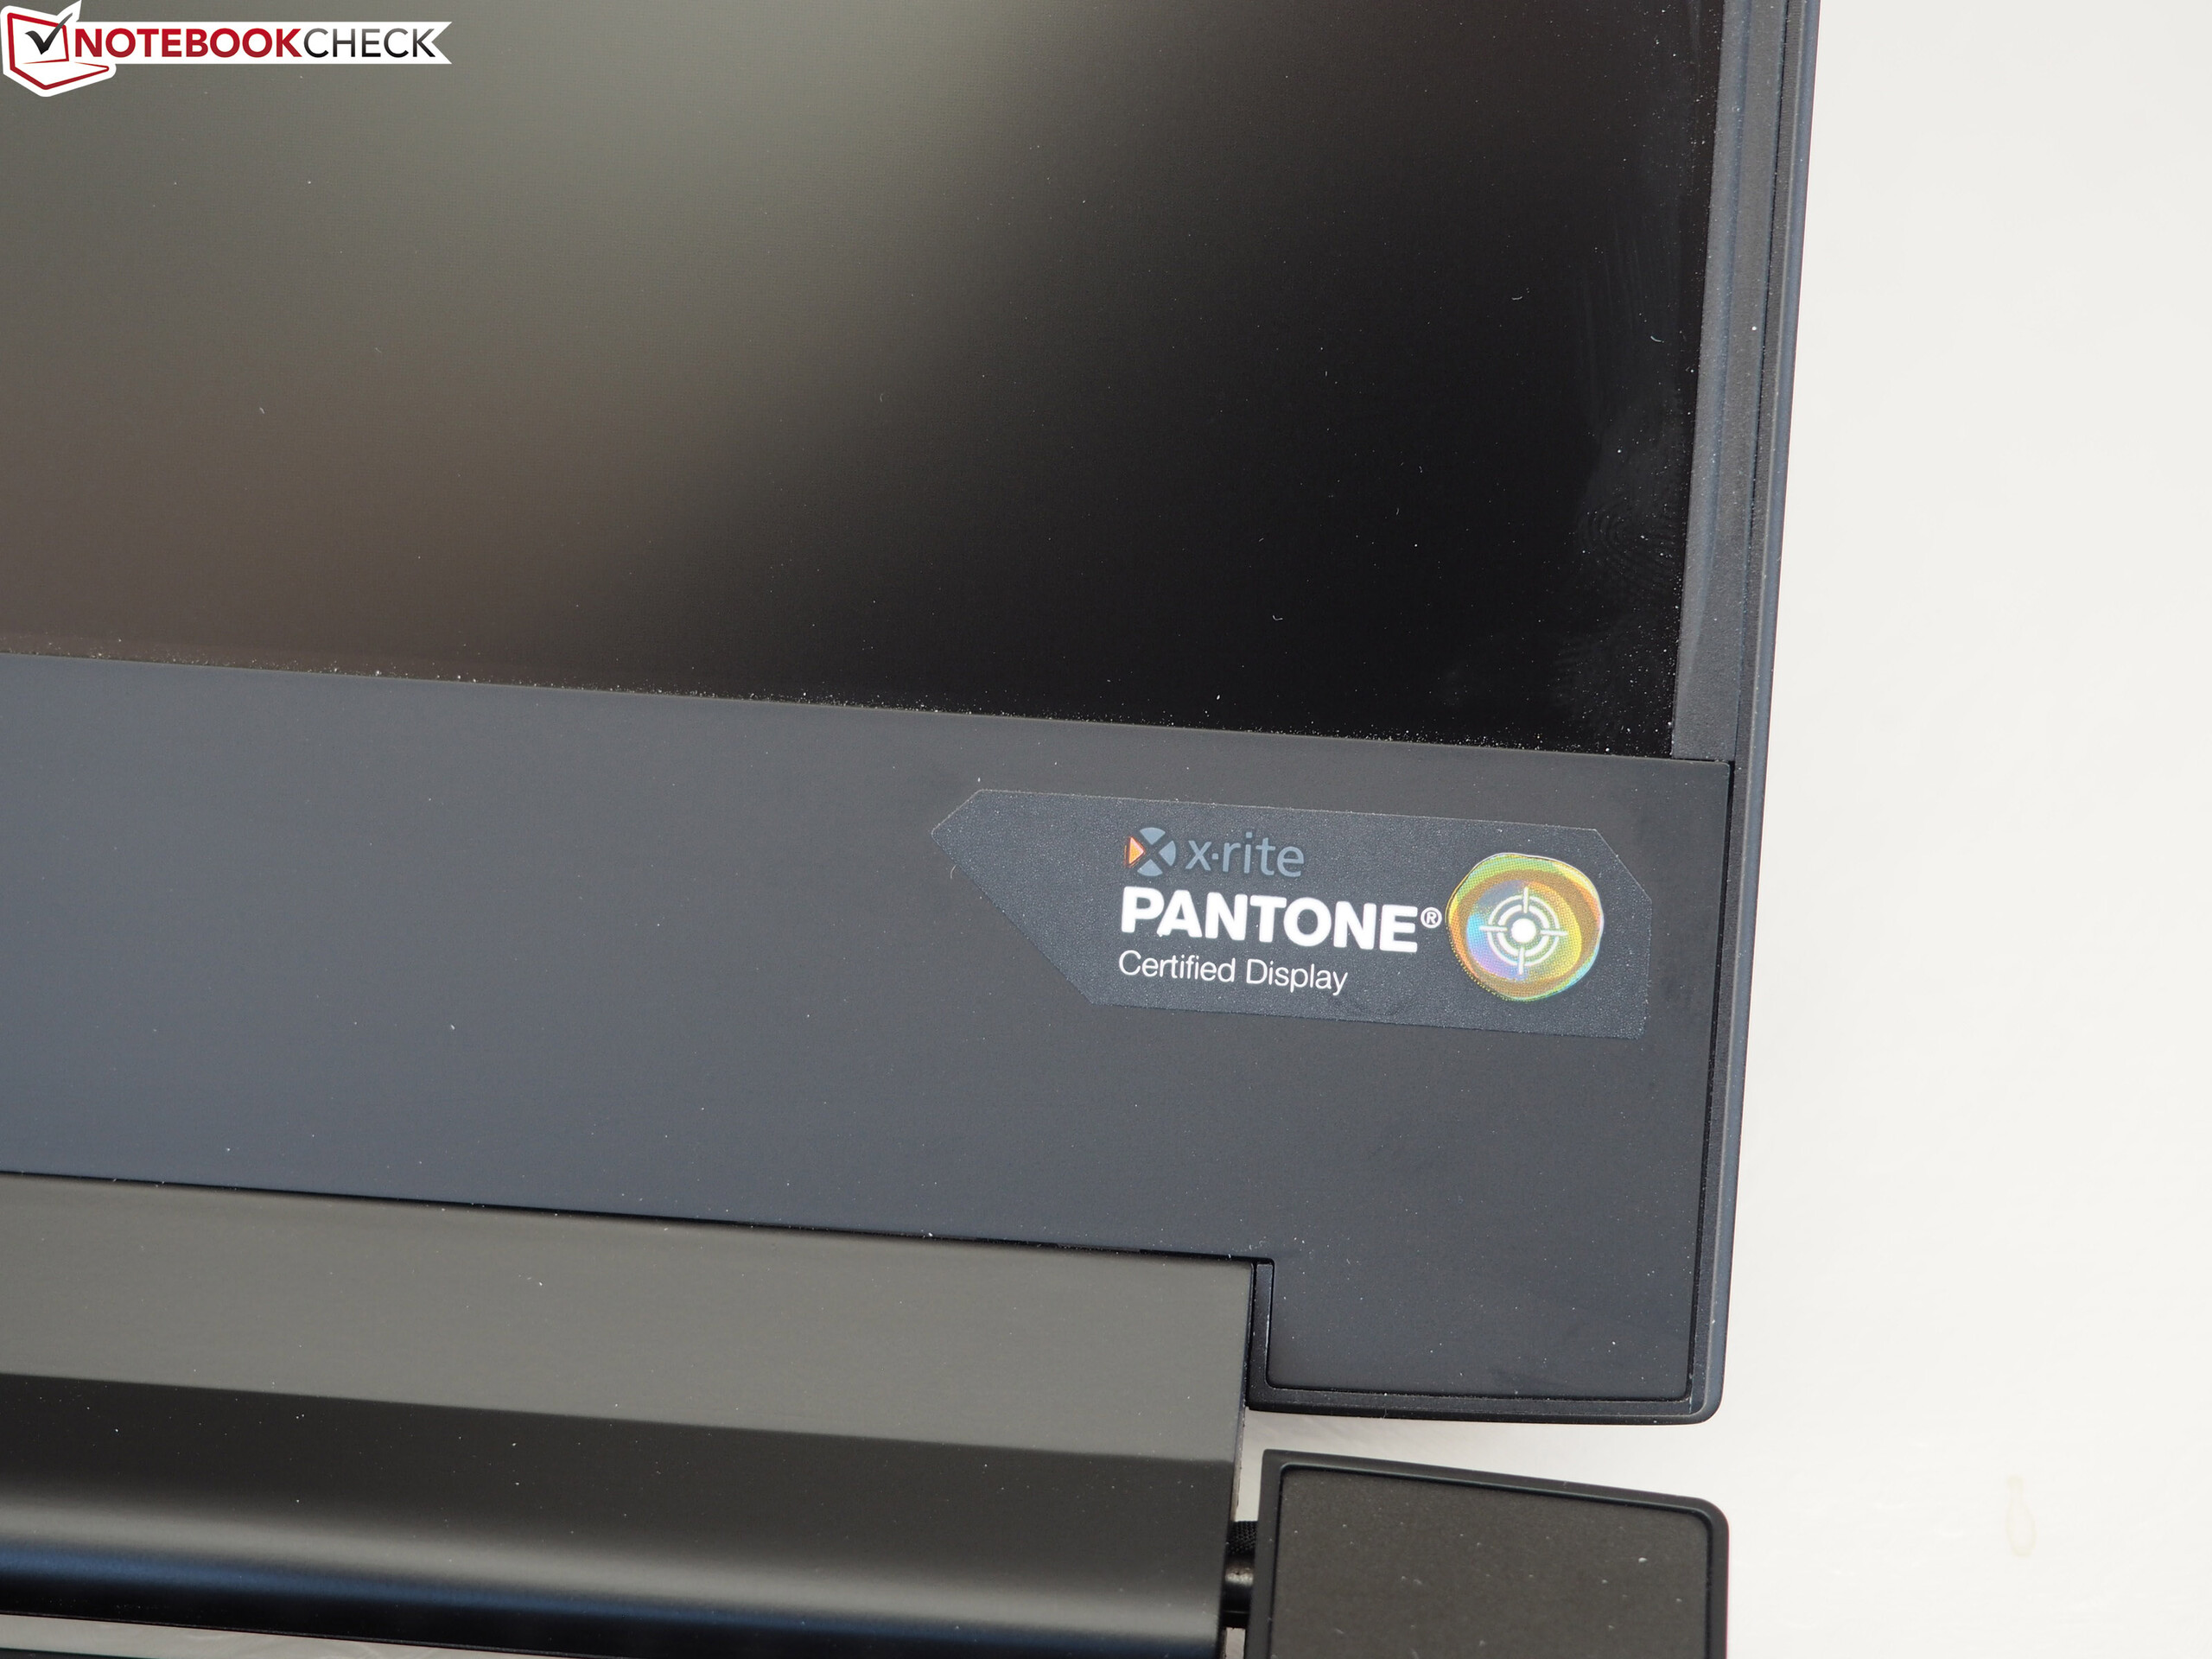
Da mesma forma, a tela IPS de 144 Hz continua a impressionar com sua certificação Pantone X-Rite, seus ângulos de visão estáveis e seus breves tempos de resposta. No entanto, é bastante escura, o que resulta em uma baixa taxa de contraste.
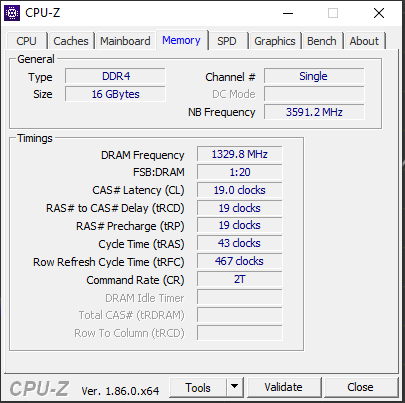
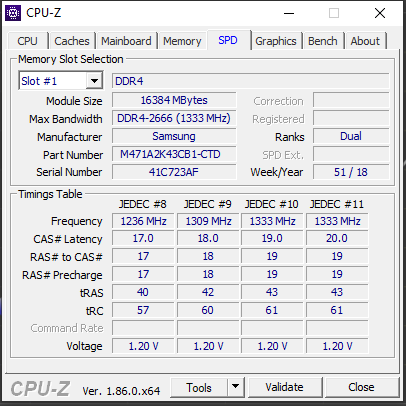
Infelizmente, a duração da bateria é abaixo do esperado, considerando o precedente que o seu antecessor definiu. Esperamos que este seja um bug que a Gigabyte possa resolver. Além disso, a GPU mais potente gera mais calor, o que torna o dispositivo muito quente para ter sobre as pernas durante jogos ou edição de vídeo. A persistência com a RAM single-channel também é um obstáculo para o desempenho, o que parece desnecessário e algo fácil para a Razer remediar. Felizmente, todos esses problemas, além das altas temperaturas, são esperançosamente solucionáveis. O dispositivo também é vendido por várias centenas de dólares a mais do que seu antecessor atualmente e traz apenas pequenas melhorias. Resumindo, o Gigabyte Aero 15-X9 é um dos melhores portáteis finos e leves para jogos que o dinheiro pode comprar, mas seu alto preço e problemas no momento de nossos testes significam que não podemos recomendá-lo tão bem quanto fizemos com seu predecessor.
Gigabyte Aero 15-X9
- 02/25/2019 v6 (old)
Sascha Mölck
Price comparison
