Breve Análise do Portátil Asus ROG Zephyrus S GX531GS (i7-8750H, GTX 1070 Max-Q, FHD)
| |||||||||||||||||||||||||
iluminação: 84 %
iluminação com acumulador: 294 cd/m²
Contraste: 1225:1 (Preto: 0.24 cd/m²)
ΔE ColorChecker Calman: 2.57 | ∀{0.5-29.43 Ø4.71}
calibrated: 2.14
ΔE Greyscale Calman: 2.41 | ∀{0.09-98 Ø4.96}
91% sRGB (Argyll 1.6.3 3D)
59% AdobeRGB 1998 (Argyll 1.6.3 3D)
66.7% AdobeRGB 1998 (Argyll 3D)
91.2% sRGB (Argyll 3D)
66.7% Display P3 (Argyll 3D)
Gamma: 2.5
CCT: 6370 K
| Asus Zephyrus S GX531GS AU Optronics B156HAN08.2 (AUO82ED), IPS, 1920x1080 | Asus Zephyrus GX501VS ID: AUO42ED, Name: AU Optronics B156HAN04.2, IPS, 1920x1080 | Gigabyte Aero 15X v8 LGD05C0, IPS, 1920x1080 | Razer Blade 15 2018 LGD05C0, IPS, 1920x1080 | MSI GS65 8RF-019DE Stealth Thin AU Optronics B156HAN08.0 (AUO80ED), IPS, 1920x1080 | |
|---|---|---|---|---|---|
| Display | -6% | -2% | -1% | 0% | |
| Display P3 Coverage (%) | 66.7 | 62.1 -7% | 63.6 -5% | 64.3 -4% | 66.2 -1% |
| sRGB Coverage (%) | 91.2 | 85.6 -6% | 93.8 3% | 93.7 3% | 92.1 1% |
| AdobeRGB 1998 Coverage (%) | 66.7 | 62.4 -6% | 64.9 -3% | 65.5 -2% | 67.2 1% |
| Response Times | -265% | -70% | -76% | -83% | |
| Response Time Grey 50% / Grey 80% * (ms) | 7.4 ? | 33.2 ? -349% | 16.8 ? -127% | 17.2 ? -132% | 17.6 ? -138% |
| Response Time Black / White * (ms) | 10 ? | 28 ? -180% | 11.2 ? -12% | 12 ? -20% | 12.8 ? -28% |
| PWM Frequency (Hz) | |||||
| Screen | -13% | 13% | -4% | 5% | |
| Brightness middle (cd/m²) | 294 | 307.1 4% | 313 6% | 290 -1% | 254 -14% |
| Brightness (cd/m²) | 275 | 309 12% | 300 9% | 281 2% | 262 -5% |
| Brightness Distribution (%) | 84 | 86 2% | 78 -7% | 82 -2% | 89 6% |
| Black Level * (cd/m²) | 0.24 | 0.35 -46% | 0.33 -38% | 0.3 -25% | 0.22 8% |
| Contrast (:1) | 1225 | 877 -28% | 948 -23% | 967 -21% | 1155 -6% |
| Colorchecker dE 2000 * | 2.57 | 3.4 -32% | 1.29 50% | 2.85 -11% | 2.37 8% |
| Colorchecker dE 2000 max. * | 4.88 | 8.2 -68% | 2.04 58% | 6.27 -28% | 4.71 3% |
| Colorchecker dE 2000 calibrated * | 2.14 | 1.39 35% | 1.84 14% | ||
| Greyscale dE 2000 * | 2.41 | 1.4 42% | 0.69 71% | 2.4 -0% | 1.58 34% |
| Gamma | 2.5 88% | 2.19 100% | 2.43 91% | 2.34 94% | 2.48 89% |
| CCT | 6370 102% | 6558 99% | 6550 99% | 6718 97% | 6785 96% |
| Color Space (Percent of AdobeRGB 1998) (%) | 59 | 55.6 -6% | 60 2% | 60 2% | 60 2% |
| Color Space (Percent of sRGB) (%) | 91 | 85 -7% | 94 3% | 94 3% | 92 1% |
| Média Total (Programa/Configurações) | -95% /
-45% | -20% /
-1% | -27% /
-13% | -26% /
-7% |
* ... menor é melhor
Exibir tempos de resposta
| ↔ Tempo de resposta preto para branco | ||
|---|---|---|
| 10 ms ... ascensão ↗ e queda ↘ combinadas | ↗ 4.4 ms ascensão | 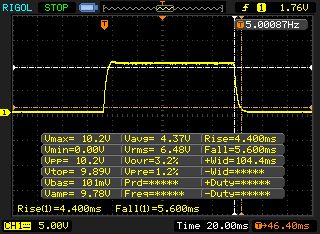 |
| ↘ 5.6 ms queda | ||
| A tela mostra boas taxas de resposta em nossos testes, mas pode ser muito lenta para jogadores competitivos. Em comparação, todos os dispositivos testados variam de 0.1 (mínimo) a 240 (máximo) ms. » 27 % de todos os dispositivos são melhores. Isso significa que o tempo de resposta medido é melhor que a média de todos os dispositivos testados (19.8 ms). | ||
| ↔ Tempo de resposta 50% cinza a 80% cinza | ||
| 7.4 ms ... ascensão ↗ e queda ↘ combinadas | ↗ 3.8 ms ascensão | 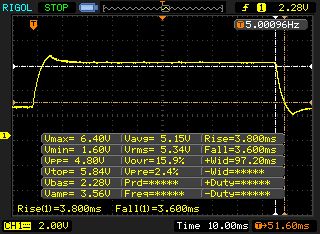 |
| ↘ 3.6 ms queda | ||
| A tela mostra taxas de resposta muito rápidas em nossos testes e deve ser muito adequada para jogos em ritmo acelerado. Em comparação, todos os dispositivos testados variam de 0.165 (mínimo) a 636 (máximo) ms. » 20 % de todos os dispositivos são melhores. Isso significa que o tempo de resposta medido é melhor que a média de todos os dispositivos testados (31 ms). | ||
Cintilação da tela / PWM (modulação por largura de pulso)
| Tela tremeluzindo / PWM não detectado | 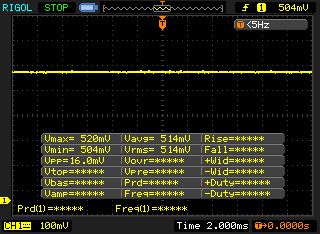 | ||
[pwm_comparison] Em comparação: 52 % de todos os dispositivos testados não usam PWM para escurecer a tela. Se PWM foi detectado, uma média de 7757 (mínimo: 5 - máximo: 343500) Hz foi medida. | |||
| PCMark 10 - Score | |
| Média da turma Gaming (5828 - 12414, n=93, últimos 2 anos) | |
| Asus Zephyrus S GX531GS | |
| MSI GS65 8RF-019DE Stealth Thin | |
| Gigabyte Aero 15X v8 | |
| Razer Blade 15 2018 | |
| Asus Zephyrus GX501VS | |
| PCMark 8 Home Score Accelerated v2 | 4620 pontos | |
| PCMark 8 Work Score Accelerated v2 | 5706 pontos | |
| PCMark 10 Score | 5170 pontos | |
Ajuda | ||
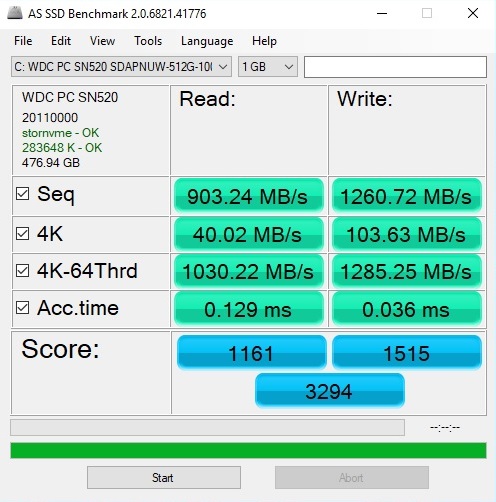
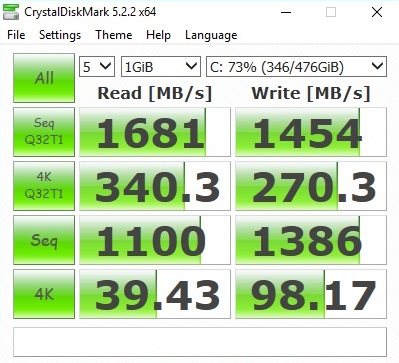
| Asus Zephyrus S GX531GS WDC PC SN520 SDAPNUW-512G | Asus Zephyrus GX501VS Samsung SM961 MZVPW256HEGL | Gigabyte Aero 15X v8 Toshiba NVMe THNSN5512GPU7 | Razer Blade 15 2018 Samsung PM961 NVMe MZVLW512HMJP | MSI GS65 8RF-019DE Stealth Thin Samsung SSD PM981 MZVLB512HAJQ | |
|---|---|---|---|---|---|
| CrystalDiskMark 5.2 / 6 | 39% | 8% | 17% | 19% | |
| Write 4K (MB/s) | 98.2 | 152.7 55% | 94.4 -4% | 94.2 -4% | 95.3 -3% |
| Read 4K (MB/s) | 39.43 | 48.81 24% | 37.65 -5% | 39.23 -1% | 40.13 2% |
| Write Seq (MB/s) | 1386 | 1013 -27% | 1335 -4% | 1483 7% | 1883 36% |
| Read Seq (MB/s) | 1100 | 1120 2% | 1404 28% | 1371 25% | 1322 20% |
| Write 4K Q32T1 (MB/s) | 270.3 | 498.1 84% | 268.6 -1% | 296.2 10% | 309.9 15% |
| Read 4K Q32T1 (MB/s) | 340.3 | 574 69% | 332.8 -2% | 342.5 1% | 353.7 4% |
| Write Seq Q32T1 (MB/s) | 1454 | 1507 4% | 1375 -5% | 1527 5% | 1919 32% |
| Read Seq Q32T1 (MB/s) | 1681 | 3327 98% | 2627 56% | 3280 95% | 2466 47% |

| 3DMark 11 Performance | 15856 pontos | |
Ajuda | ||
| The Witcher 3 - 1920x1080 Ultra Graphics & Postprocessing (HBAO+) | |
| Média da turma Gaming (104.7 - 240, n=7, últimos 2 anos) | |
| Razer Blade 15 2018 | |
| MSI GS65 8RF-019DE Stealth Thin | |
| Gigabyte Aero 15X v8 | |
| Asus Zephyrus GX501VS | |
| Asus Zephyrus S GX531GS | |
| baixo | média | alto | ultra | |
|---|---|---|---|---|
| The Witcher 3 (2015) | 90.4 | 49.2 | ||
| The Crew 2 (2018) | 60 | 60 | ||
| Monster Hunter World (2018) | 74.8 | 56.9 | ||
| F1 2018 (2018) | 108 | 70 | ||
| Shadow of the Tomb Raider (2018) | 67 | 58 | ||
| FIFA 19 (2018) | 199 | 194 | ||
| Forza Horizon 4 (2018) | 99 | 80 | ||
| Assassin´s Creed Odyssey (2018) | 61 | 44 | ||
| Call of Duty Black Ops 4 (2018) | 91.4 | 84.7 | ||
| Hitman 2 (2018) | 68.1 | 66.3 | ||
| Fallout 76 (2018) | 60 | 60 | ||
| Battlefield V (2018) | 91.7 | 85.2 |
Barulho
| Ocioso |
| 33 / 34 / 40 dB |
| Carga |
| 47 / 53 dB |
 | ||
30 dB silencioso 40 dB(A) audível 50 dB(A) ruidosamente alto |
||
min: | ||
| Asus Zephyrus S GX531GS i7-8750H, GeForce GTX 1070 Max-Q | Asus Zephyrus GX501VS i7-7700HQ, GeForce GTX 1070 Max-Q | Gigabyte Aero 15X v8 i7-8750H, GeForce GTX 1070 Max-Q | Razer Blade 15 2018 i7-8750H, GeForce GTX 1070 Max-Q | MSI GS65 8RF-019DE Stealth Thin i7-8750H, GeForce GTX 1070 Max-Q | Média da turma Gaming | |
|---|---|---|---|---|---|---|
| Noise | 15% | 3% | 7% | 11% | 15% | |
| desligado / ambiente * (dB) | 29 | 28.5 2% | 29 -0% | 29 -0% | 30 -3% | 24.1 ? 17% |
| Idle Minimum * (dB) | 33 | 28.5 14% | 30 9% | 29 12% | 30 9% | 26 ? 21% |
| Idle Average * (dB) | 34 | 28.5 16% | 31 9% | 30 12% | 31 9% | 27.4 ? 19% |
| Idle Maximum * (dB) | 40 | 30.1 25% | 35 12% | 38 5% | 34 15% | 30.1 ? 25% |
| Load Average * (dB) | 47 | 35.2 25% | 49 -4% | 46 2% | 43 9% | 43.6 ? 7% |
| Witcher 3 ultra * (dB) | 51 | 41.7 18% | 51 -0% | 49 4% | 42 18% | |
| Load Maximum * (dB) | 53 | 48.8 8% | 54 -2% | 46 13% | 44 17% | 54.2 ? -2% |
* ... menor é melhor
(-) A temperatura máxima no lado superior é 54 °C / 129 F, em comparação com a média de 40.4 °C / 105 F , variando de 21.2 a 68.8 °C para a classe Gaming.
(-) A parte inferior aquece até um máximo de 60 °C / 140 F, em comparação com a média de 43.2 °C / 110 F
(+) Em uso inativo, a temperatura média para o lado superior é 29 °C / 84 F, em comparação com a média do dispositivo de 33.9 °C / ### class_avg_f### F.
(-) Jogando The Witcher 3, a temperatura média para o lado superior é 43.3 °C / 110 F, em comparação com a média do dispositivo de 33.9 °C / ## #class_avg_f### F.
(-) Os apoios para as mãos e o touchpad podem ficar muito quentes ao toque, com um máximo de 40 °C / 104 F.
(-) A temperatura média da área do apoio para as mãos de dispositivos semelhantes foi 28.8 °C / 83.8 F (-11.2 °C / -20.2 F).
| Asus Zephyrus S GX531GS i7-8750H, GeForce GTX 1070 Max-Q | Asus Zephyrus GX501VS i7-7700HQ, GeForce GTX 1070 Max-Q | Gigabyte Aero 15X v8 i7-8750H, GeForce GTX 1070 Max-Q | Razer Blade 15 2018 i7-8750H, GeForce GTX 1070 Max-Q | MSI GS65 8RF-019DE Stealth Thin i7-8750H, GeForce GTX 1070 Max-Q | Média da turma Gaming | |
|---|---|---|---|---|---|---|
| Heat | 9% | 2% | -6% | 10% | 5% | |
| Maximum Upper Side * (°C) | 54 | 54.4 -1% | 53 2% | 56 -4% | 49 9% | 45.2 ? 16% |
| Maximum Bottom * (°C) | 60 | 41.2 31% | 65 -8% | 59 2% | 63 -5% | 48.1 ? 20% |
| Idle Upper Side * (°C) | 30 | 31.2 -4% | 26 13% | 33 -10% | 24 20% | 31 ? -3% |
| Idle Bottom * (°C) | 30 | 27.6 8% | 30 -0% | 34 -13% | 25 17% | 34.2 ? -14% |
* ... menor é melhor
Asus Zephyrus S GX531GS análise de áudio
(±) | o volume do alto-falante é médio, mas bom (###valor### dB)
Graves 100 - 315Hz
(-) | quase nenhum baixo - em média 19.4% menor que a mediana
(±) | a linearidade dos graves é média (12.6% delta para a frequência anterior)
Médios 400 - 2.000 Hz
(+) | médios equilibrados - apenas 1.4% longe da mediana
(+) | médios são lineares (2.1% delta para frequência anterior)
Altos 2 - 16 kHz
(+) | agudos equilibrados - apenas 1.8% longe da mediana
(+) | os máximos são lineares (3.3% delta da frequência anterior)
Geral 100 - 16.000 Hz
(+) | o som geral é linear (14.5% diferença em relação à mediana)
Comparado com a mesma classe
» 27% de todos os dispositivos testados nesta classe foram melhores, 7% semelhantes, 66% piores
» O melhor teve um delta de 6%, a média foi 18%, o pior foi 132%
Comparado com todos os dispositivos testados
» 18% de todos os dispositivos testados foram melhores, 4% semelhantes, 77% piores
» O melhor teve um delta de 4%, a média foi 23%, o pior foi 134%
Asus Zephyrus GX501VS análise de áudio
(-) | alto-falantes não muito altos (###valor### dB)
Graves 100 - 315Hz
(-) | quase nenhum baixo - em média 18.8% menor que a mediana
(±) | a linearidade dos graves é média (11.3% delta para a frequência anterior)
Médios 400 - 2.000 Hz
(+) | médios equilibrados - apenas 1.2% longe da mediana
(+) | médios são lineares (6.3% delta para frequência anterior)
Altos 2 - 16 kHz
(±) | máximos mais altos - em média 6.5% maior que a mediana
(+) | os máximos são lineares (6.3% delta da frequência anterior)
Geral 100 - 16.000 Hz
(±) | a linearidade do som geral é média (23.4% diferença em relação à mediana)
Comparado com a mesma classe
» 85% de todos os dispositivos testados nesta classe foram melhores, 5% semelhantes, 11% piores
» O melhor teve um delta de 6%, a média foi 18%, o pior foi 132%
Comparado com todos os dispositivos testados
» 70% de todos os dispositivos testados foram melhores, 6% semelhantes, 24% piores
» O melhor teve um delta de 4%, a média foi 23%, o pior foi 134%
| desligado | |
| Ocioso | |
| Carga |
|
Key:
min: | |
| Asus Zephyrus S GX531GS i7-8750H, GeForce GTX 1070 Max-Q | Asus Zephyrus GX501VS i7-7700HQ, GeForce GTX 1070 Max-Q | Gigabyte Aero 15X v8 i7-8750H, GeForce GTX 1070 Max-Q | Razer Blade 15 2018 i7-8750H, GeForce GTX 1070 Max-Q | MSI GS65 8RF-019DE Stealth Thin i7-8750H, GeForce GTX 1070 Max-Q | Média da turma Gaming | |
|---|---|---|---|---|---|---|
| Power Consumption | 13% | 16% | 16% | 29% | 4% | |
| Idle Minimum * (Watt) | 17 | 19.1 -12% | 14 18% | 14 18% | 7 59% | 13 ? 24% |
| Idle Average * (Watt) | 20 | 20.8 -4% | 18 10% | 17 15% | 11 45% | 19 ? 5% |
| Idle Maximum * (Watt) | 29 | 21.8 25% | 22 24% | 21 28% | 20 31% | 24.6 ? 15% |
| Load Average * (Watt) | 112 | 73.7 34% | 91 19% | 95 15% | 98 12% | 110.7 ? 1% |
| Witcher 3 ultra * (Watt) | 152 | 130.2 14% | 142 7% | 141 7% | 132 13% | |
| Load Maximum * (Watt) | 211 | 173.1 18% | 173 18% | 179 15% | 182 14% | 259 ? -23% |
* ... menor é melhor
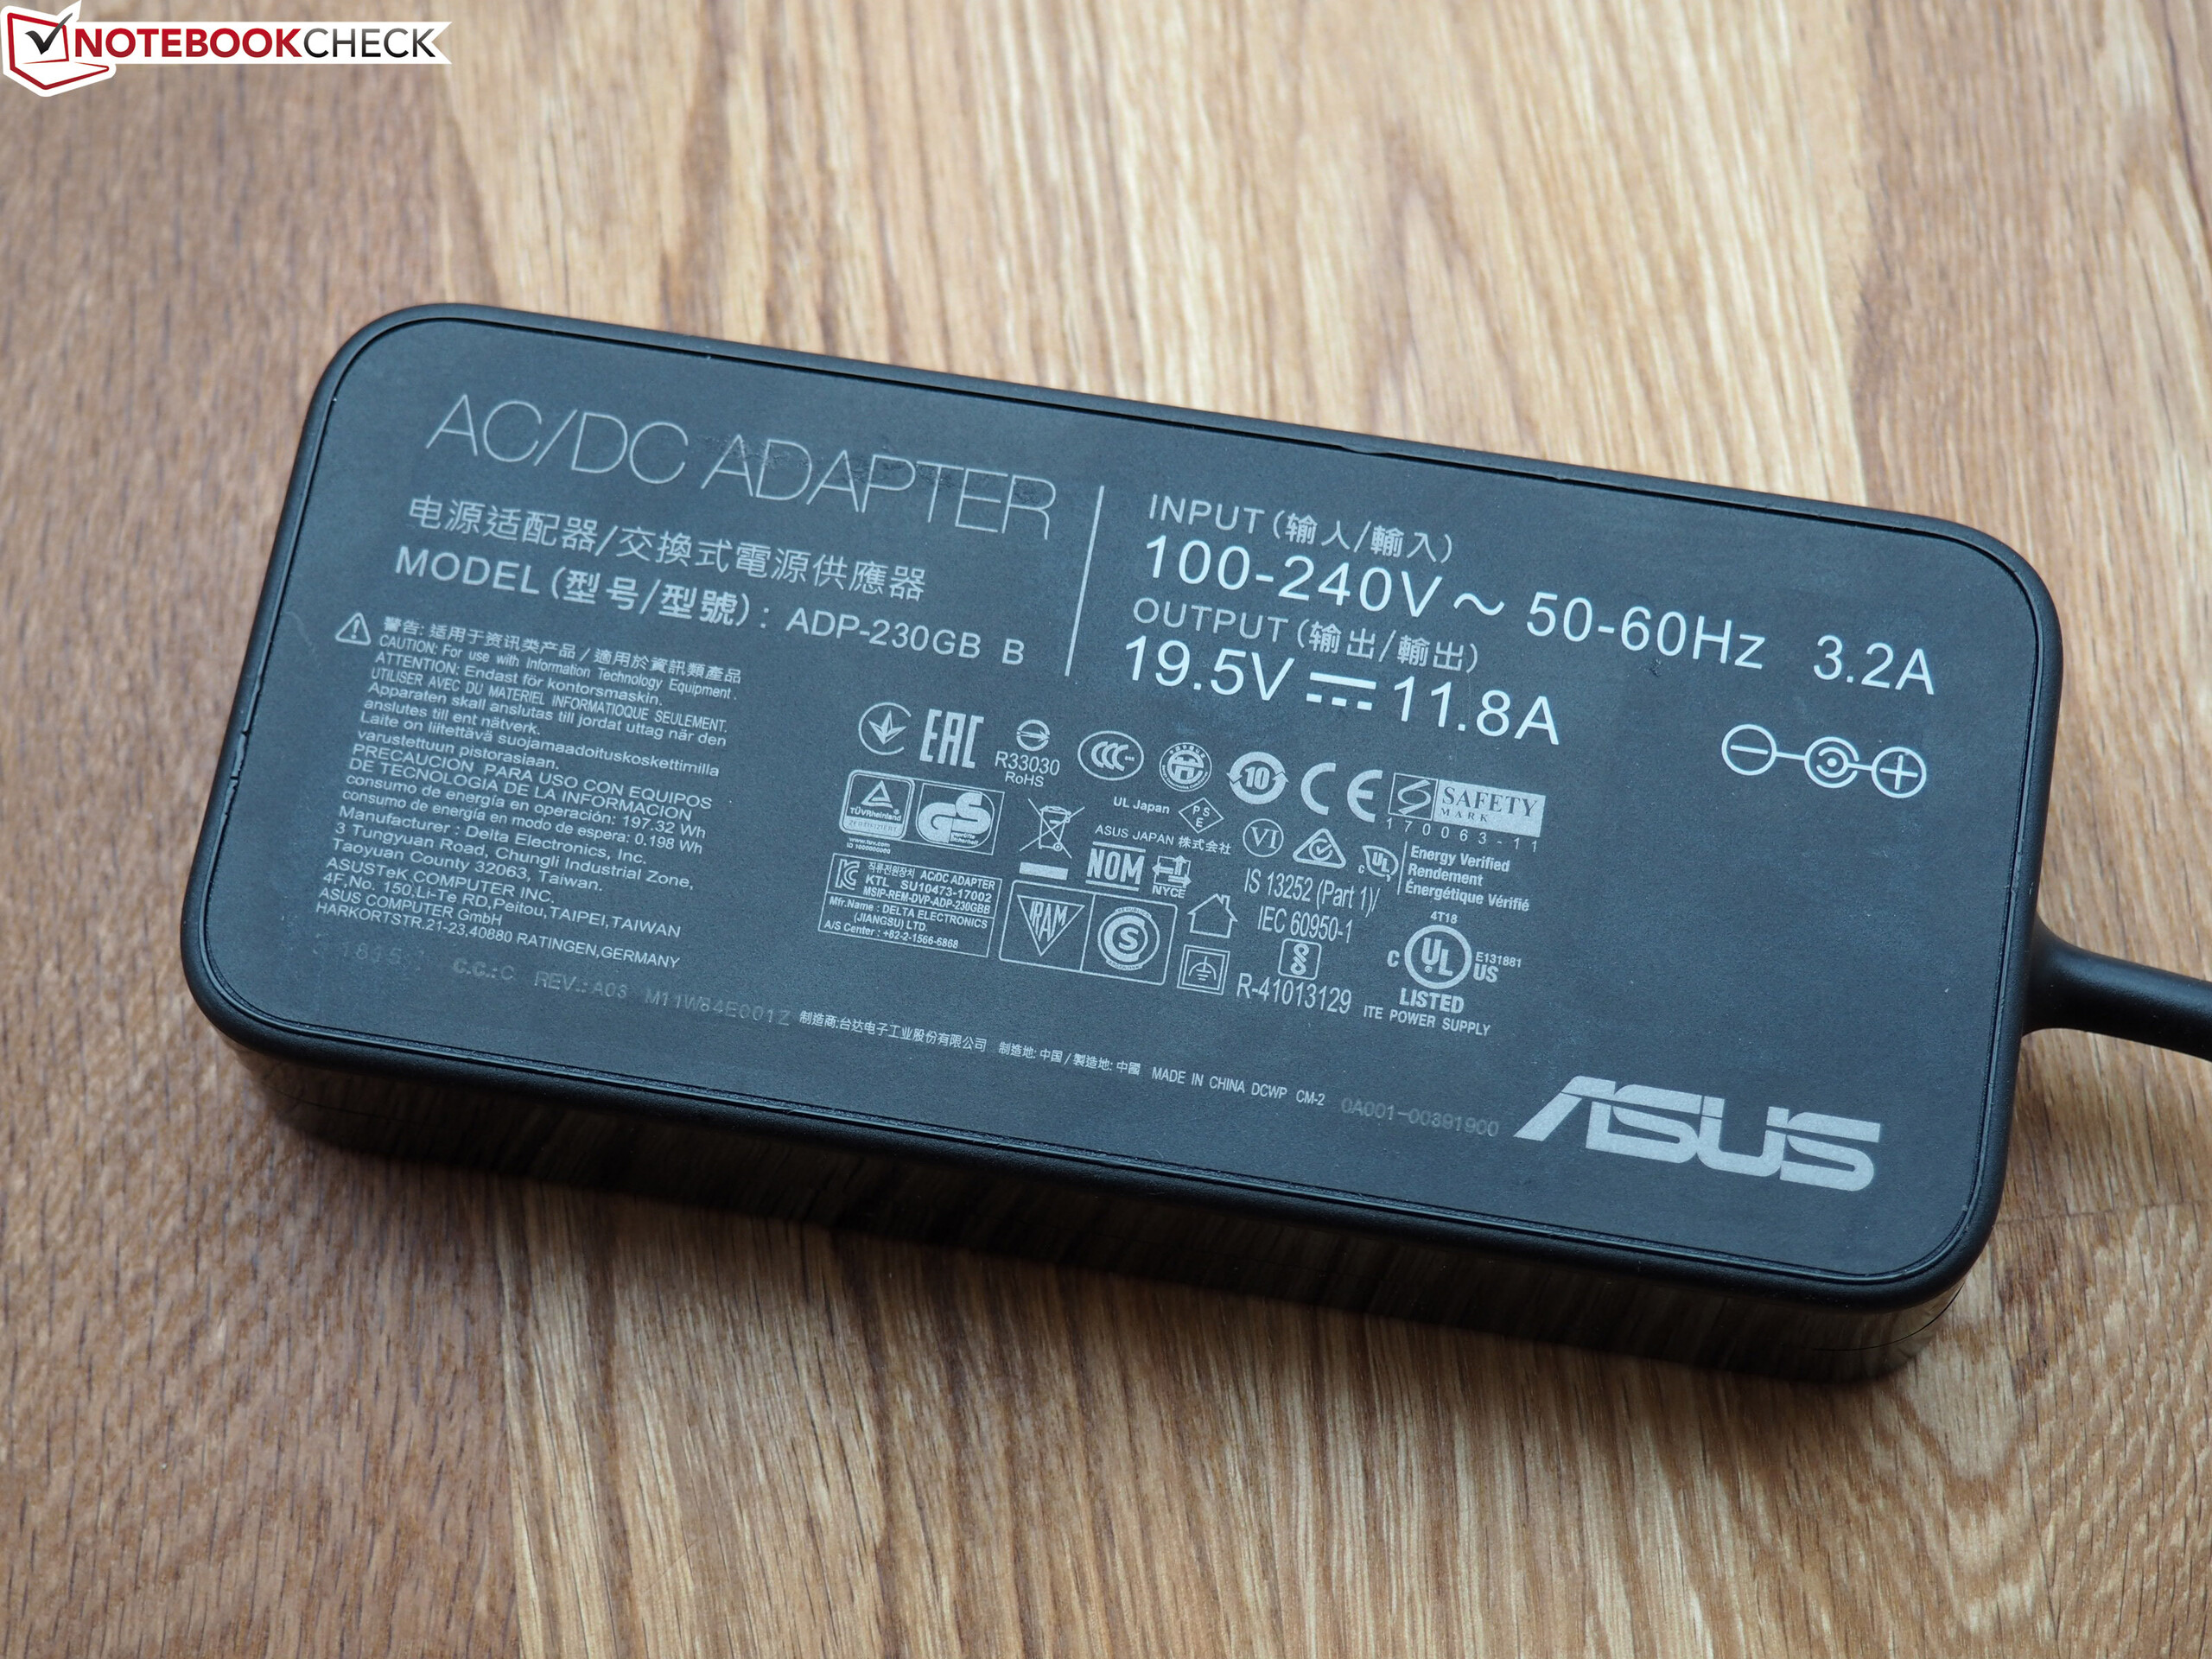
| Asus Zephyrus S GX531GS i7-8750H, GeForce GTX 1070 Max-Q, 50 Wh | Asus Zephyrus GX501VS i7-7700HQ, GeForce GTX 1070 Max-Q, 50 Wh | Gigabyte Aero 15X v8 i7-8750H, GeForce GTX 1070 Max-Q, 94.24 Wh | Razer Blade 15 2018 i7-8750H, GeForce GTX 1070 Max-Q, 80 Wh | MSI GS65 8RF-019DE Stealth Thin i7-8750H, GeForce GTX 1070 Max-Q, 82 Wh | Média da turma Gaming | |
|---|---|---|---|---|---|---|
| Duração da bateria | 5% | 252% | 86% | 122% | 139% | |
| Reader / Idle (h) | 3.6 | 3.8 6% | 12.7 253% | 6.4 78% | 8.5 136% | 8.27 ? 130% |
| WiFi v1.3 (h) | 2.6 | 2.5 -4% | 8.6 231% | 5.4 108% | 6 131% | 7.11 ? 173% |
| Load (h) | 0.7 | 0.8 14% | 2.6 271% | 1.2 71% | 1.4 100% | 1.502 ? 115% |
| H.264 (h) | 8.4 | 5.4 | 5.9 | 8.32 ? |
Pro
Contra
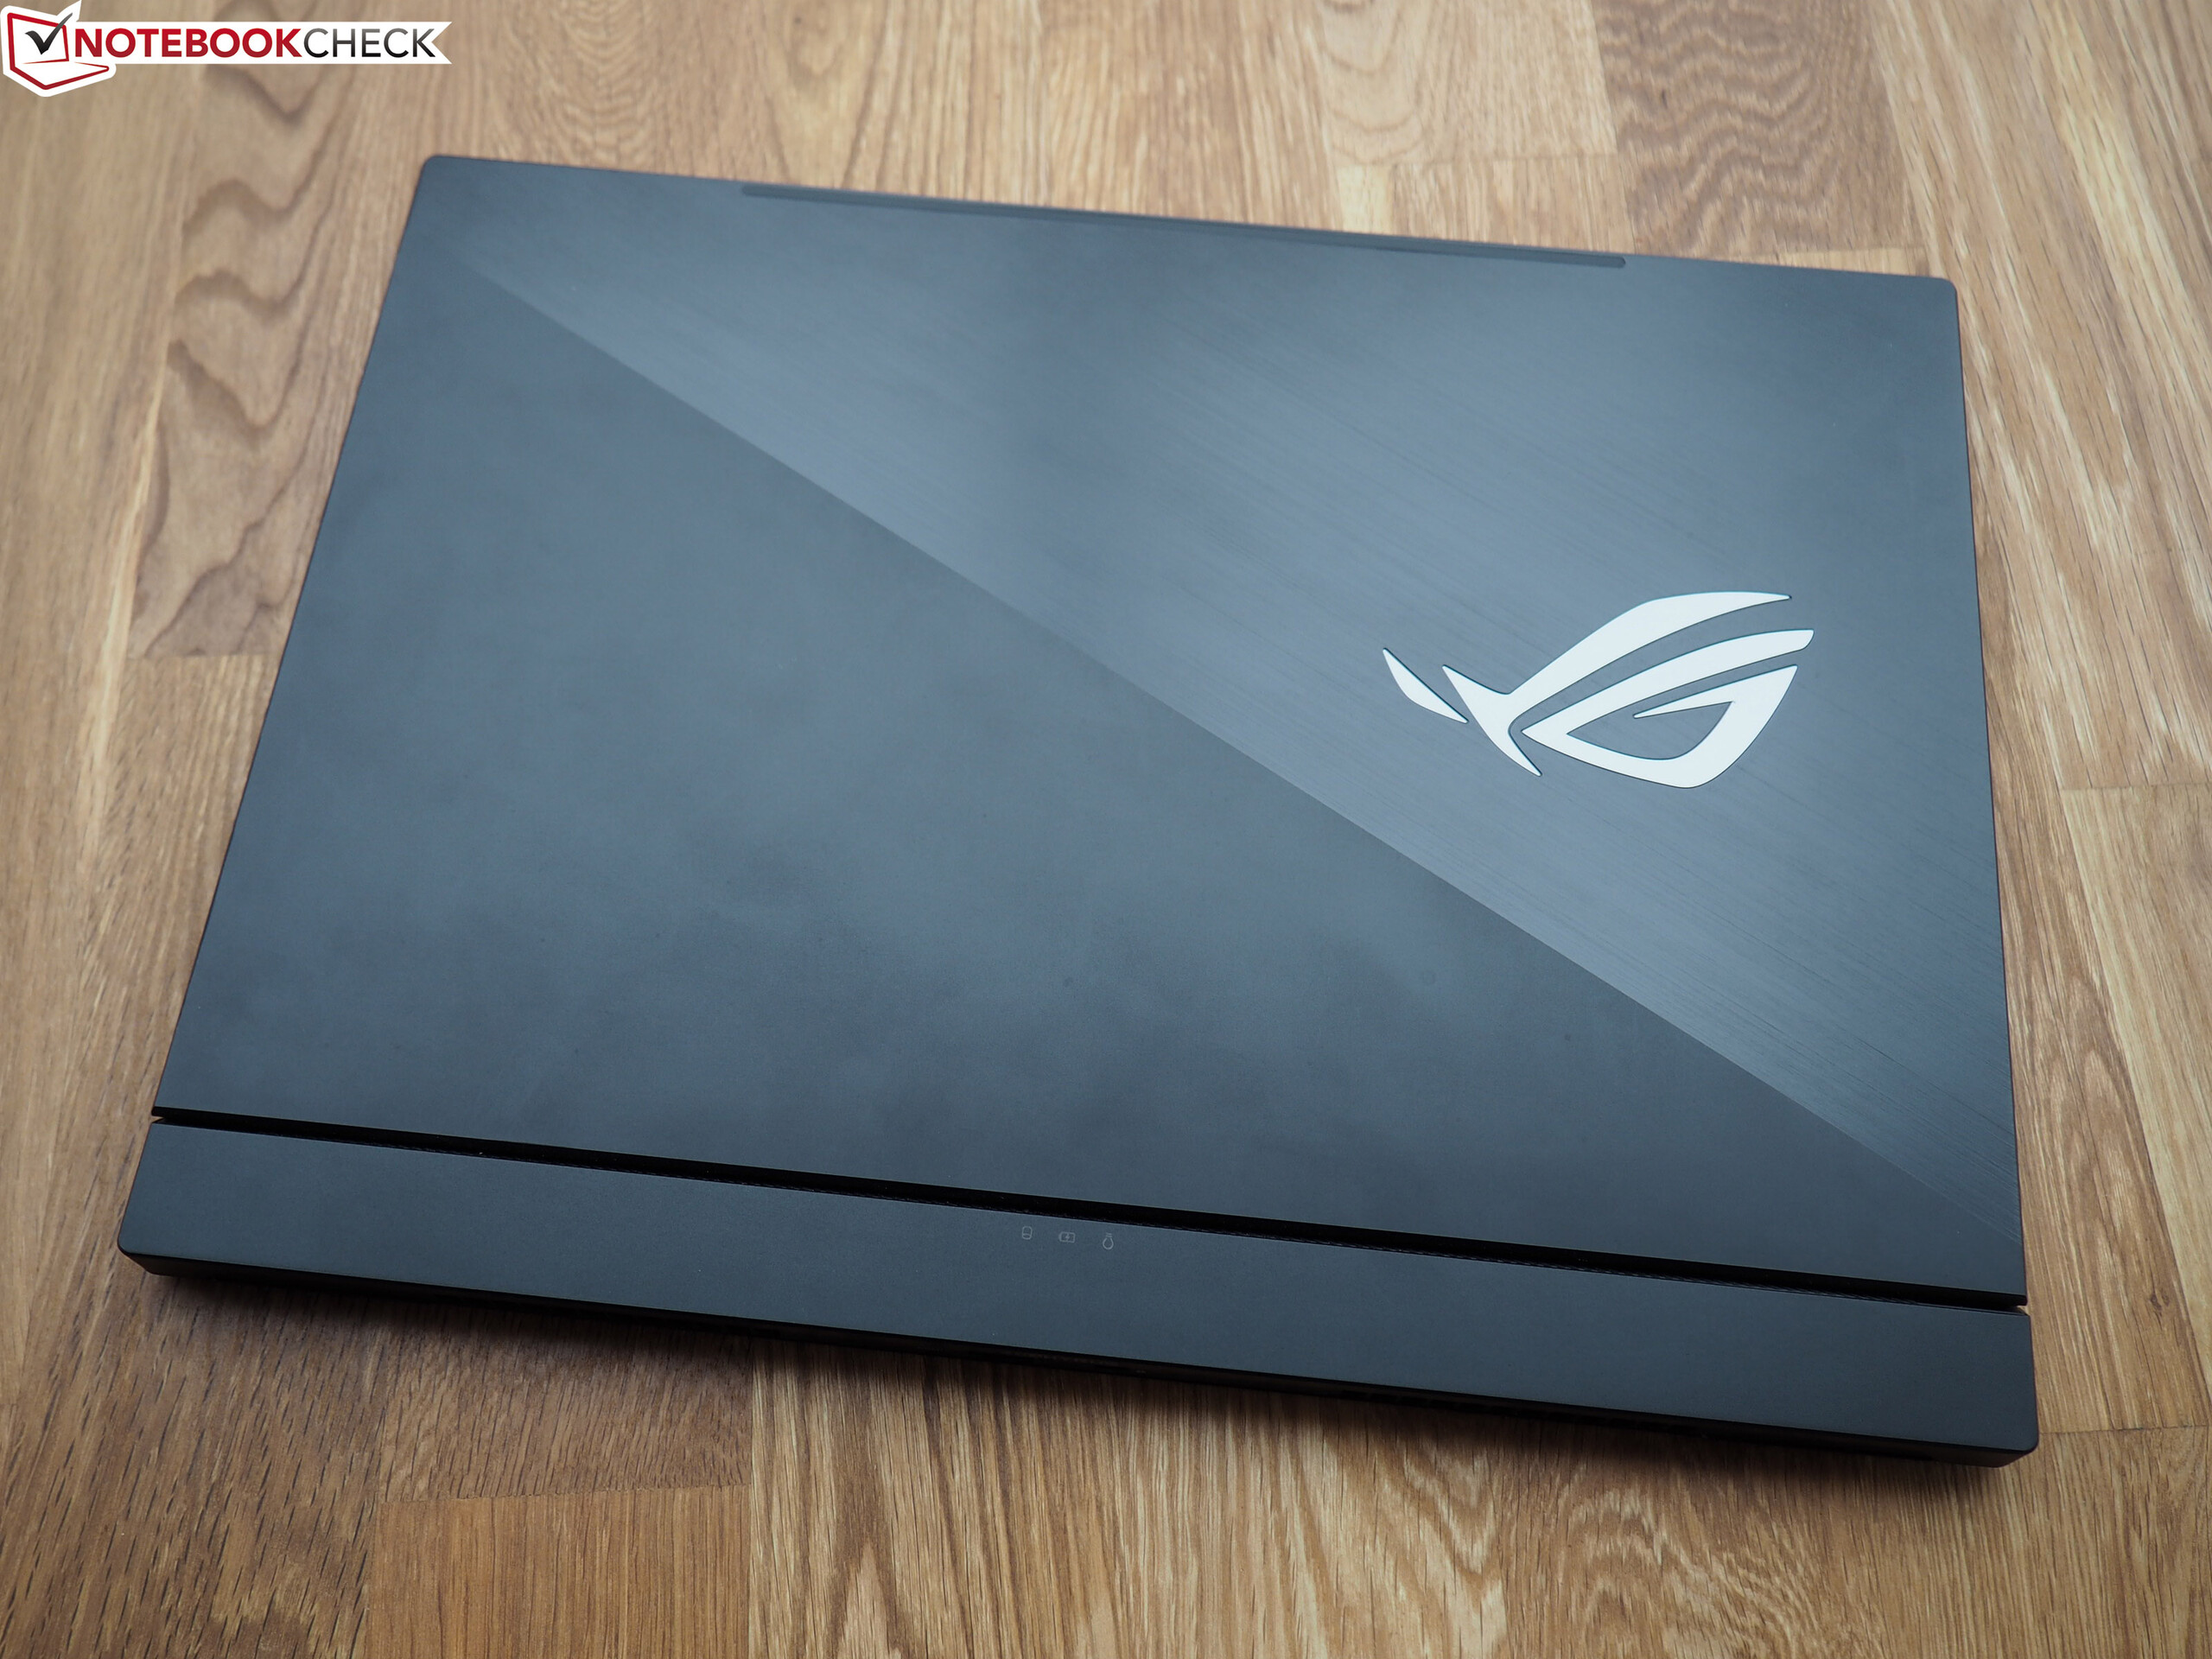
O ROG Zephyrus S GX531GS é um exemplo perfeito de um fabricante indo longe demais em sua atual obsessão por fazer portáteis finos.
Sim, do ponto de vista de marketing, pode ser bom você poder dizer que oferece o portátil mais fino do mundo. No entanto, se o seu dispositivo for mais barulhento do que os concorrentes usando os mesmos componentes principais e seu desempenho ainda for um pouco mais fraco em aplicativos 3D, sua finura poderá desaparecer rapidamente no fundo, já que é apenas uma questão de poucos milímetros.
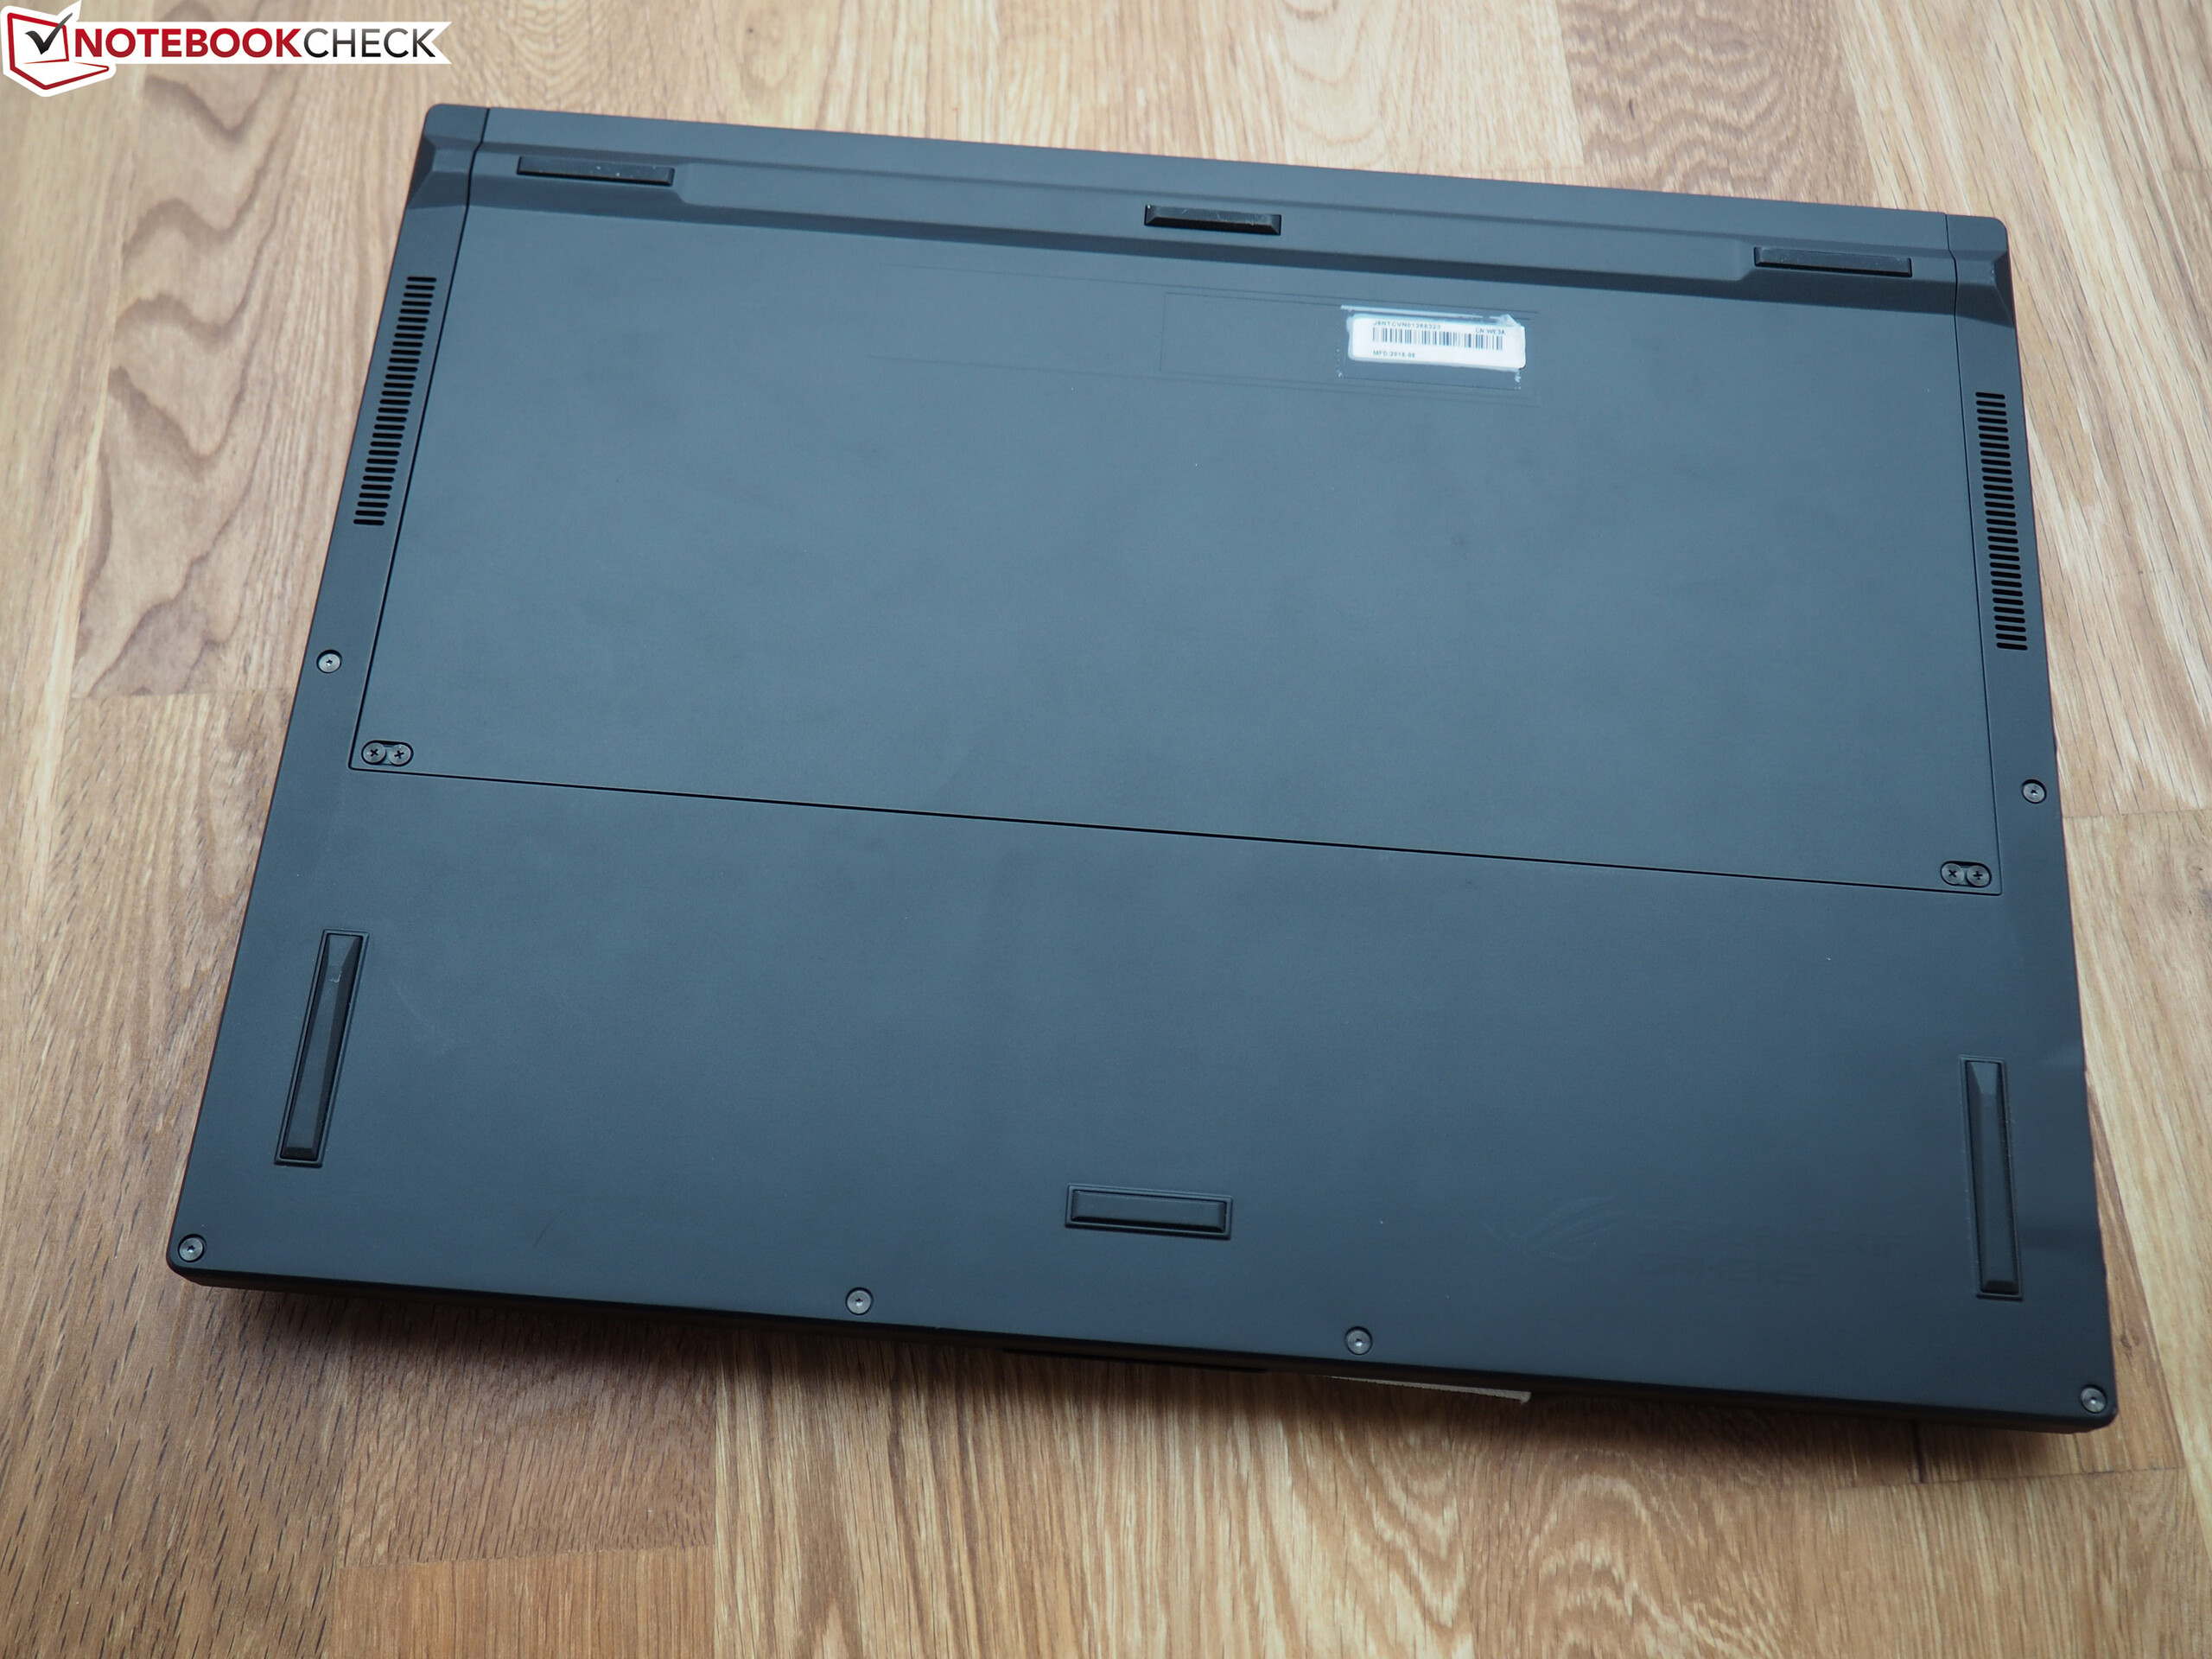
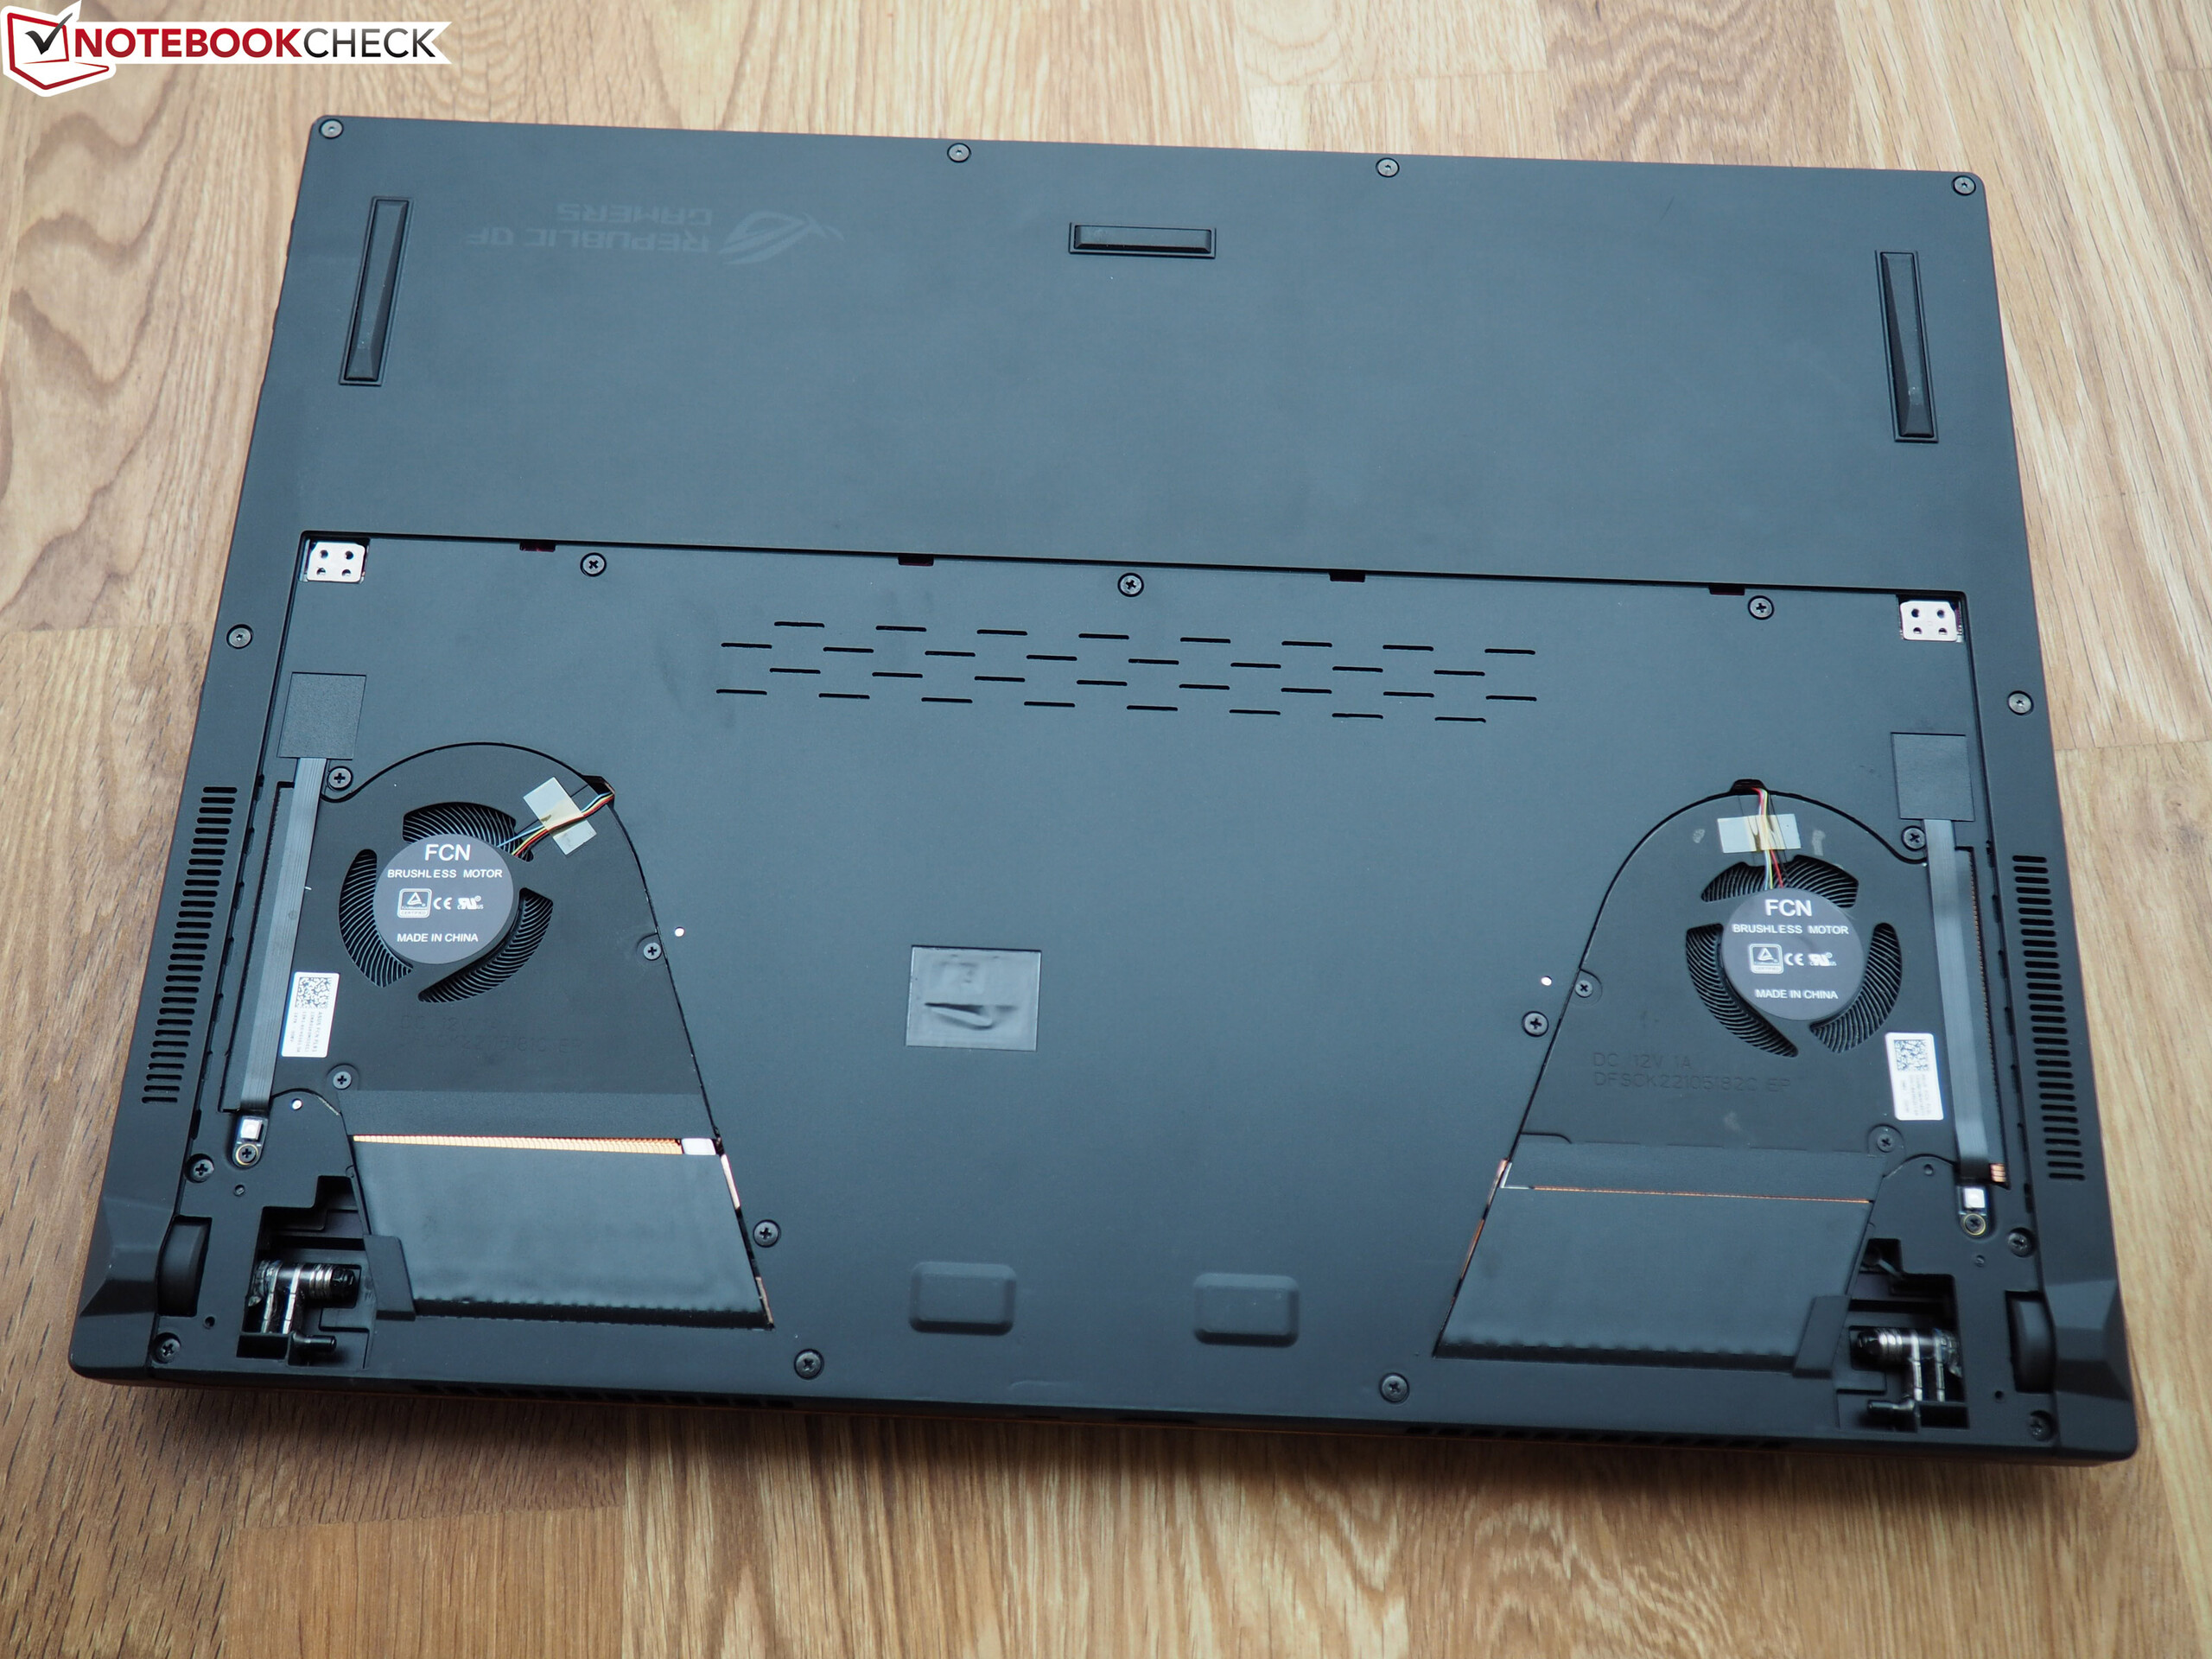
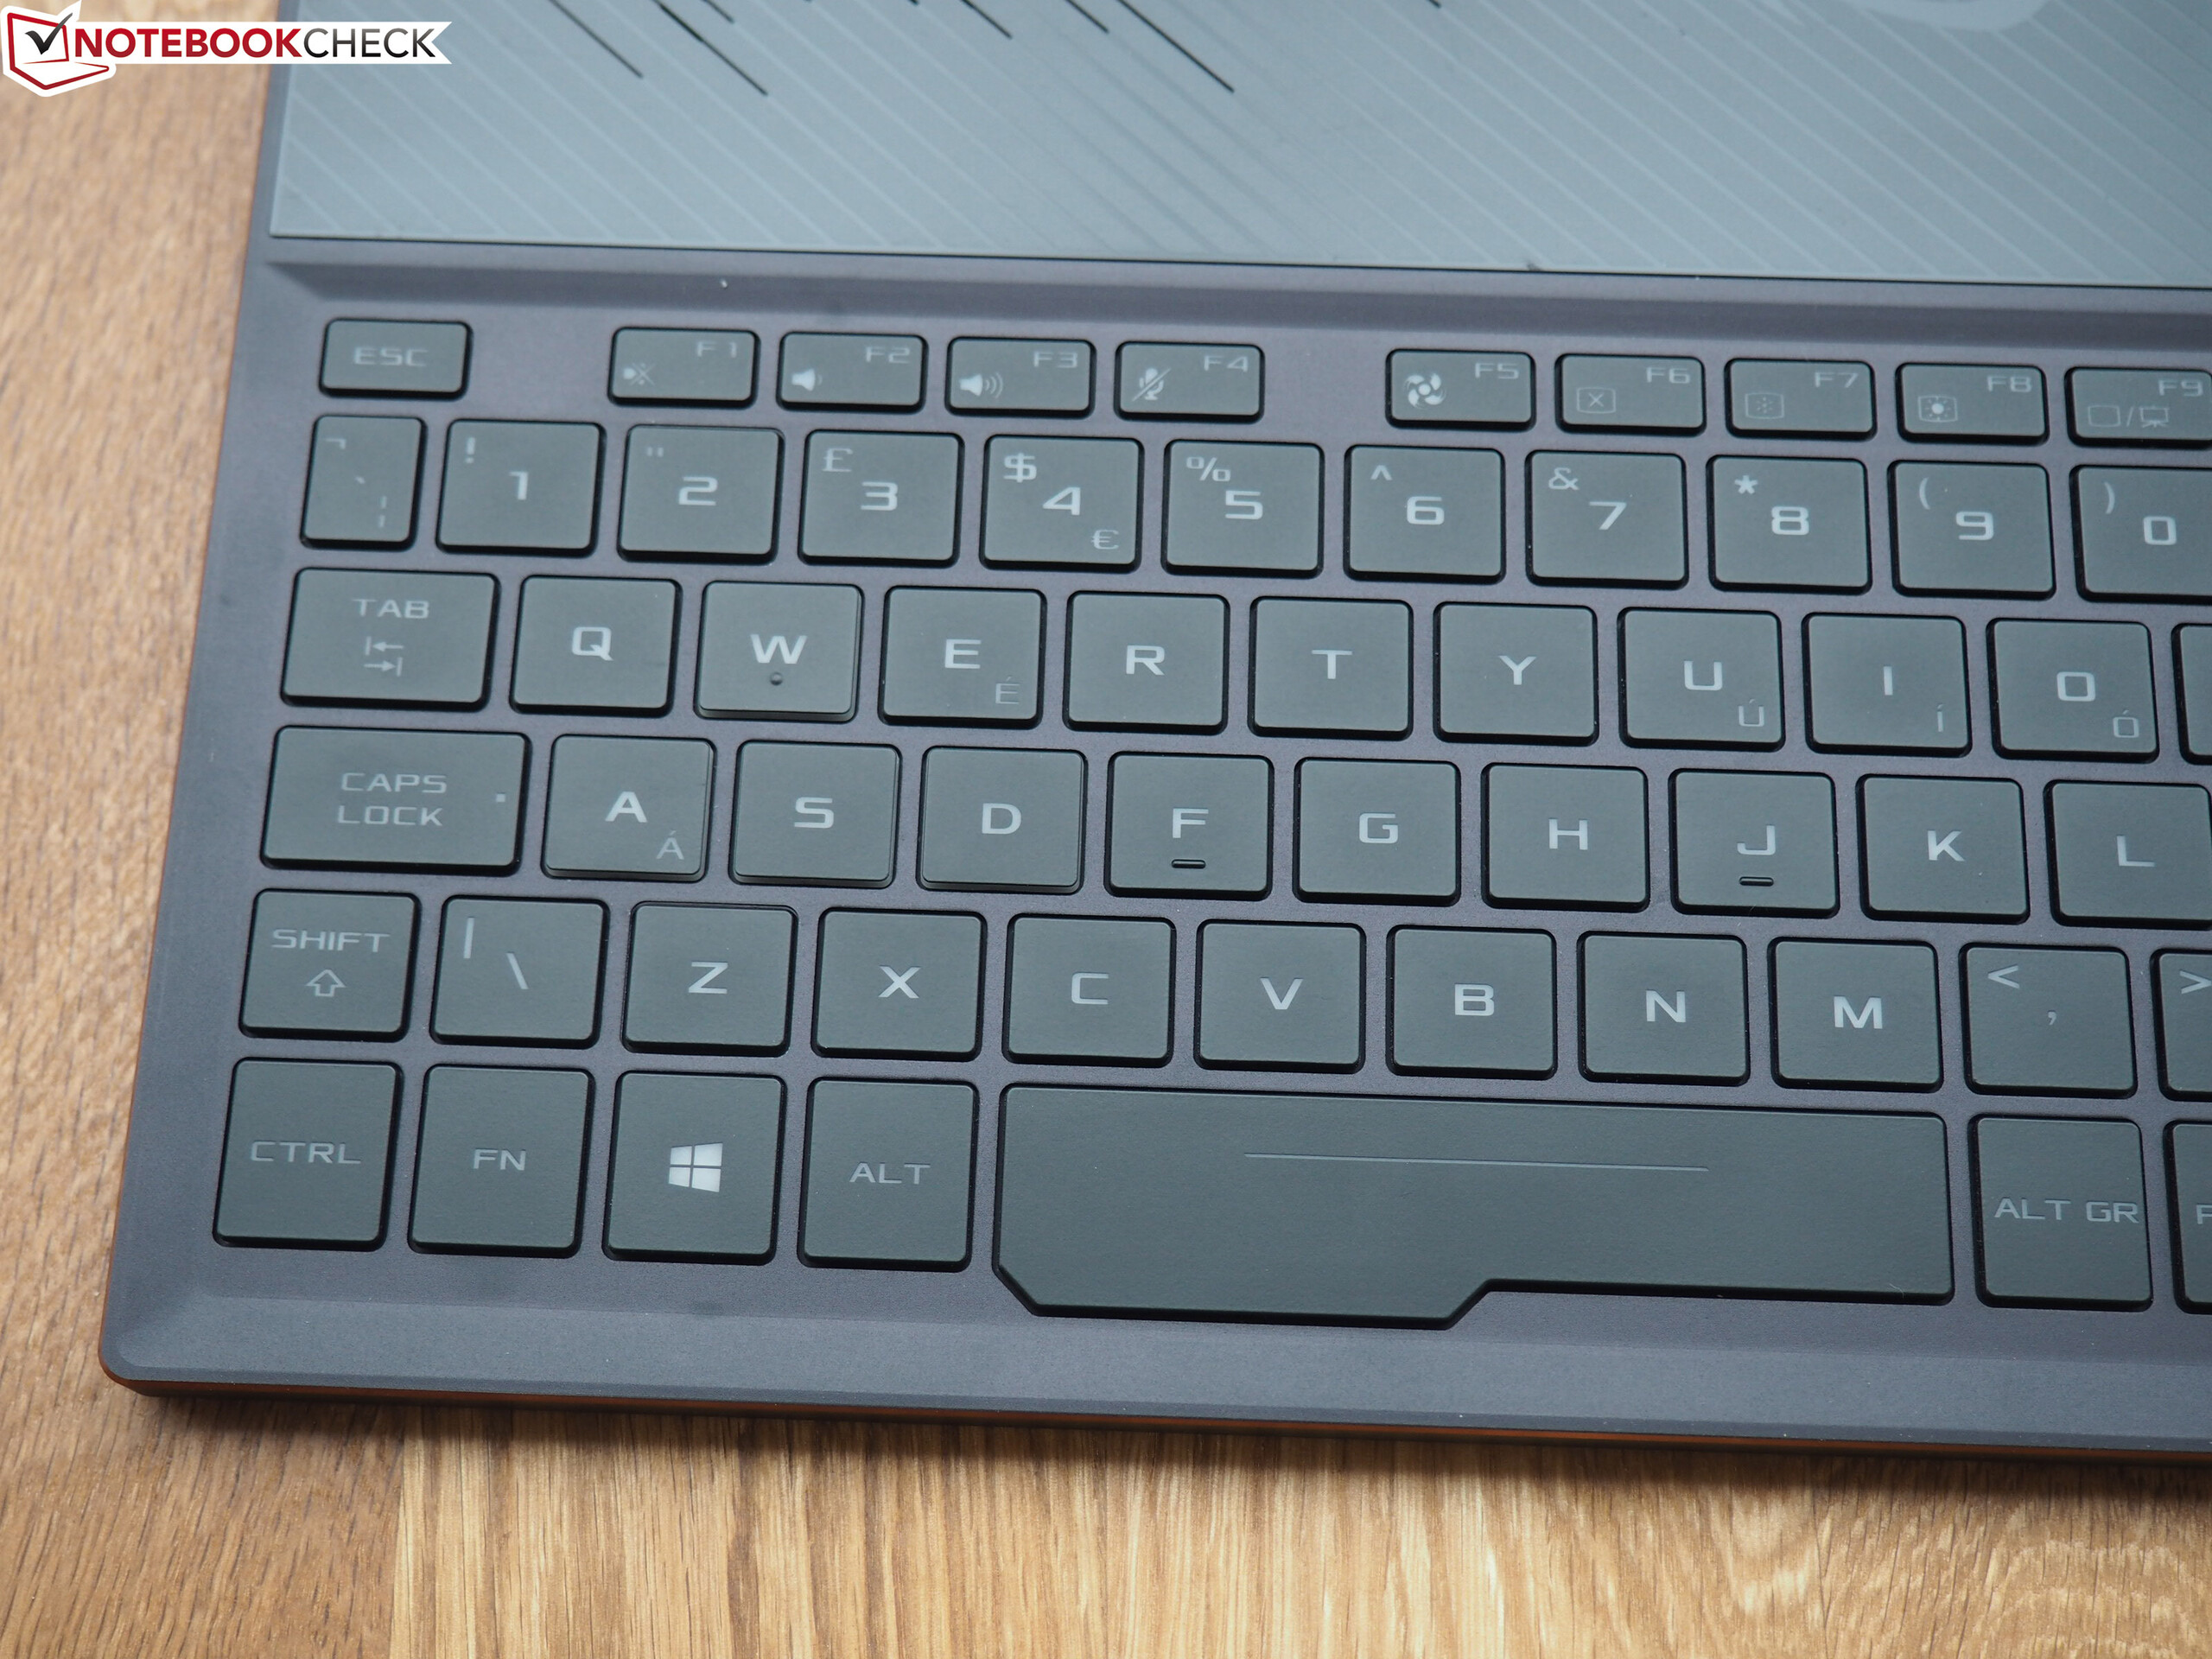
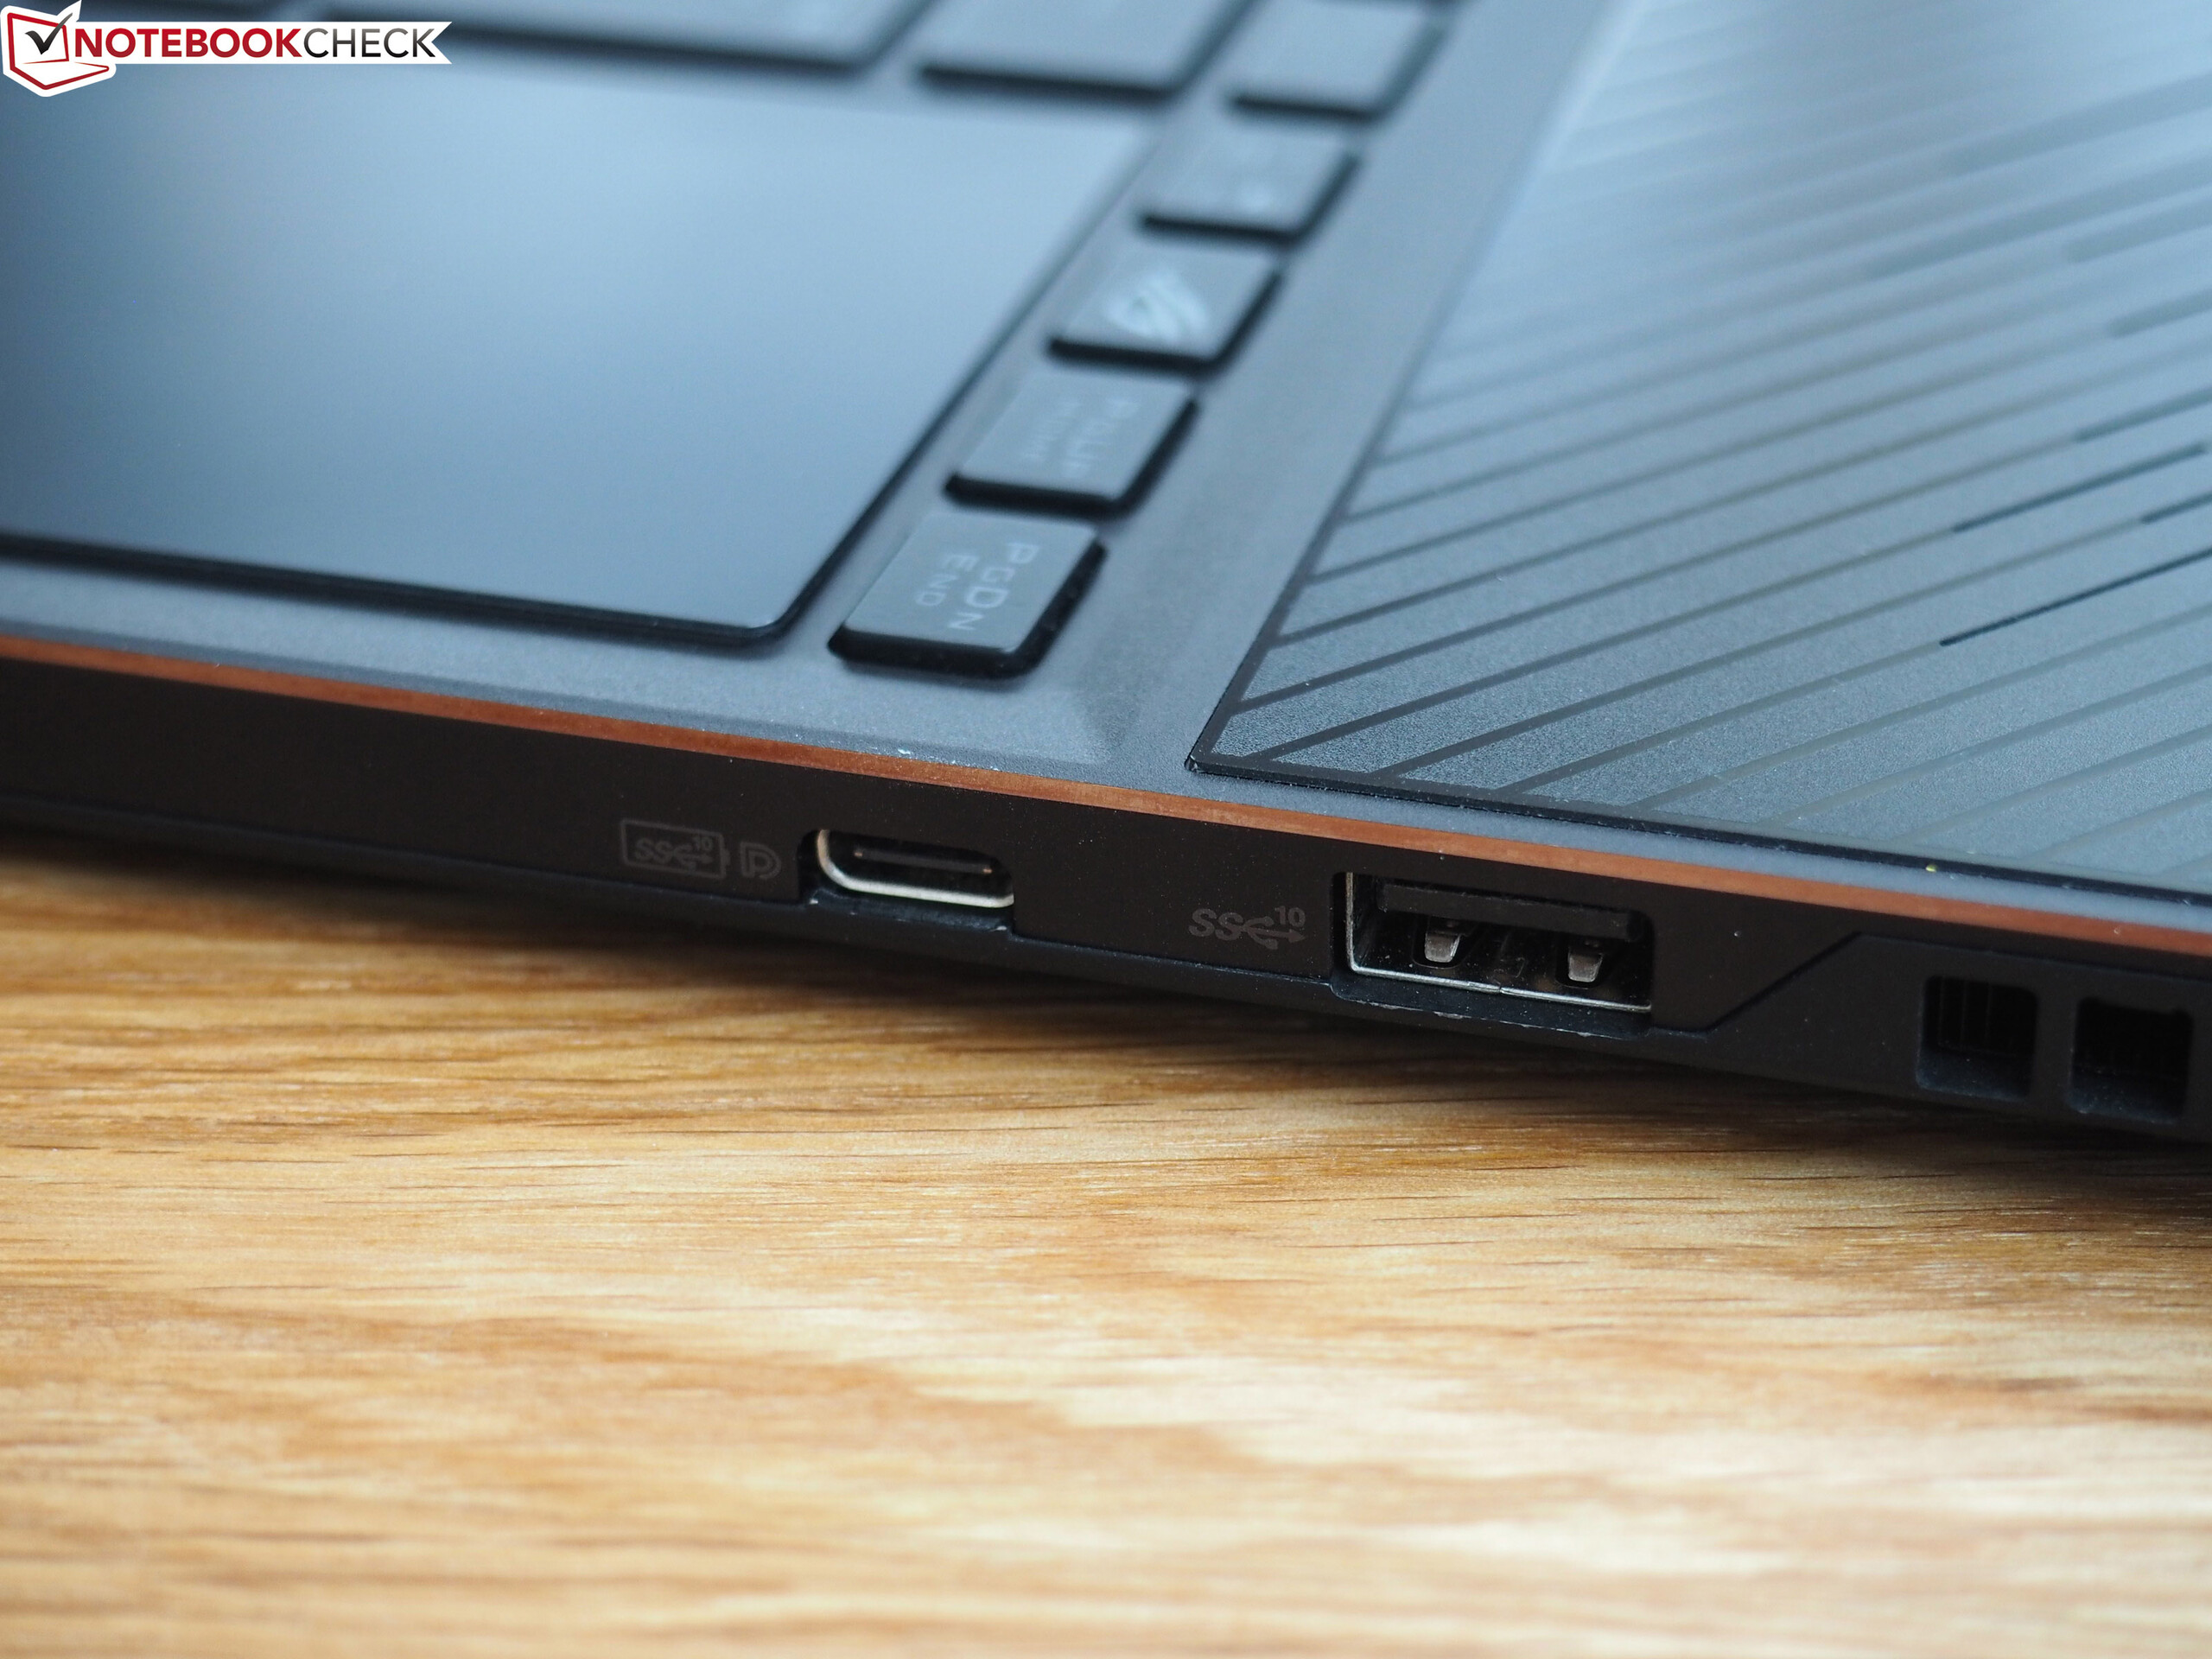
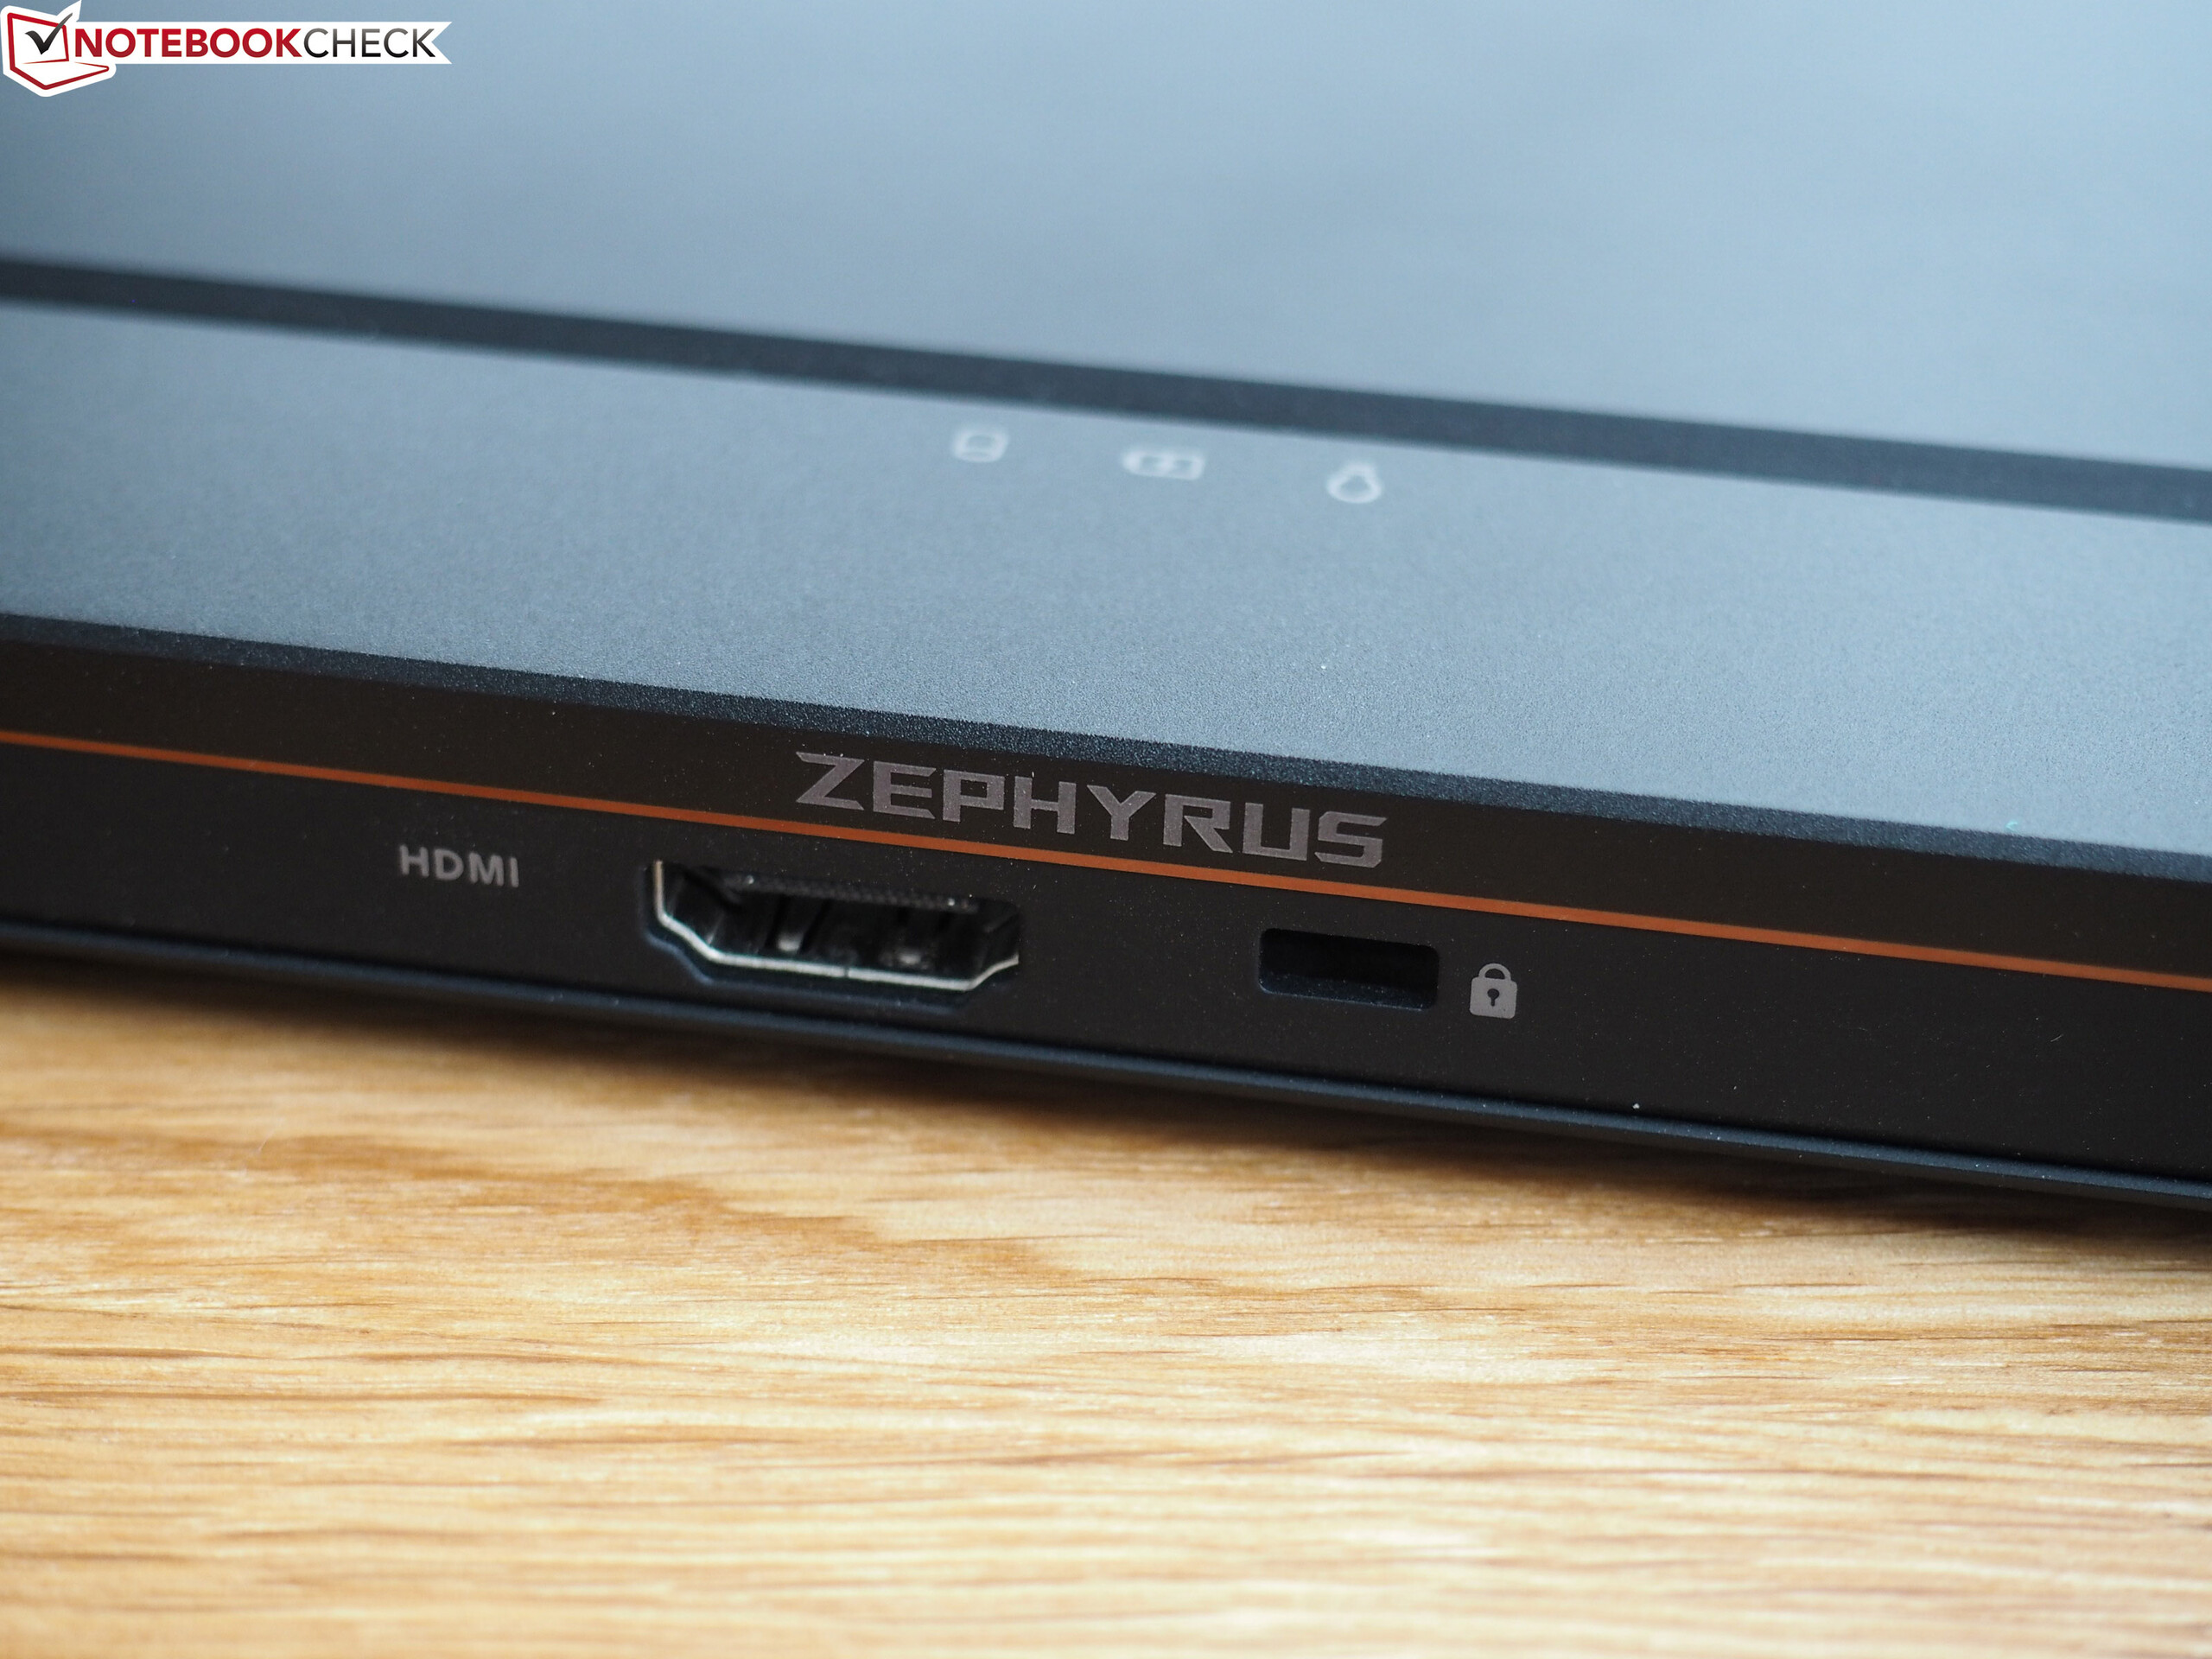
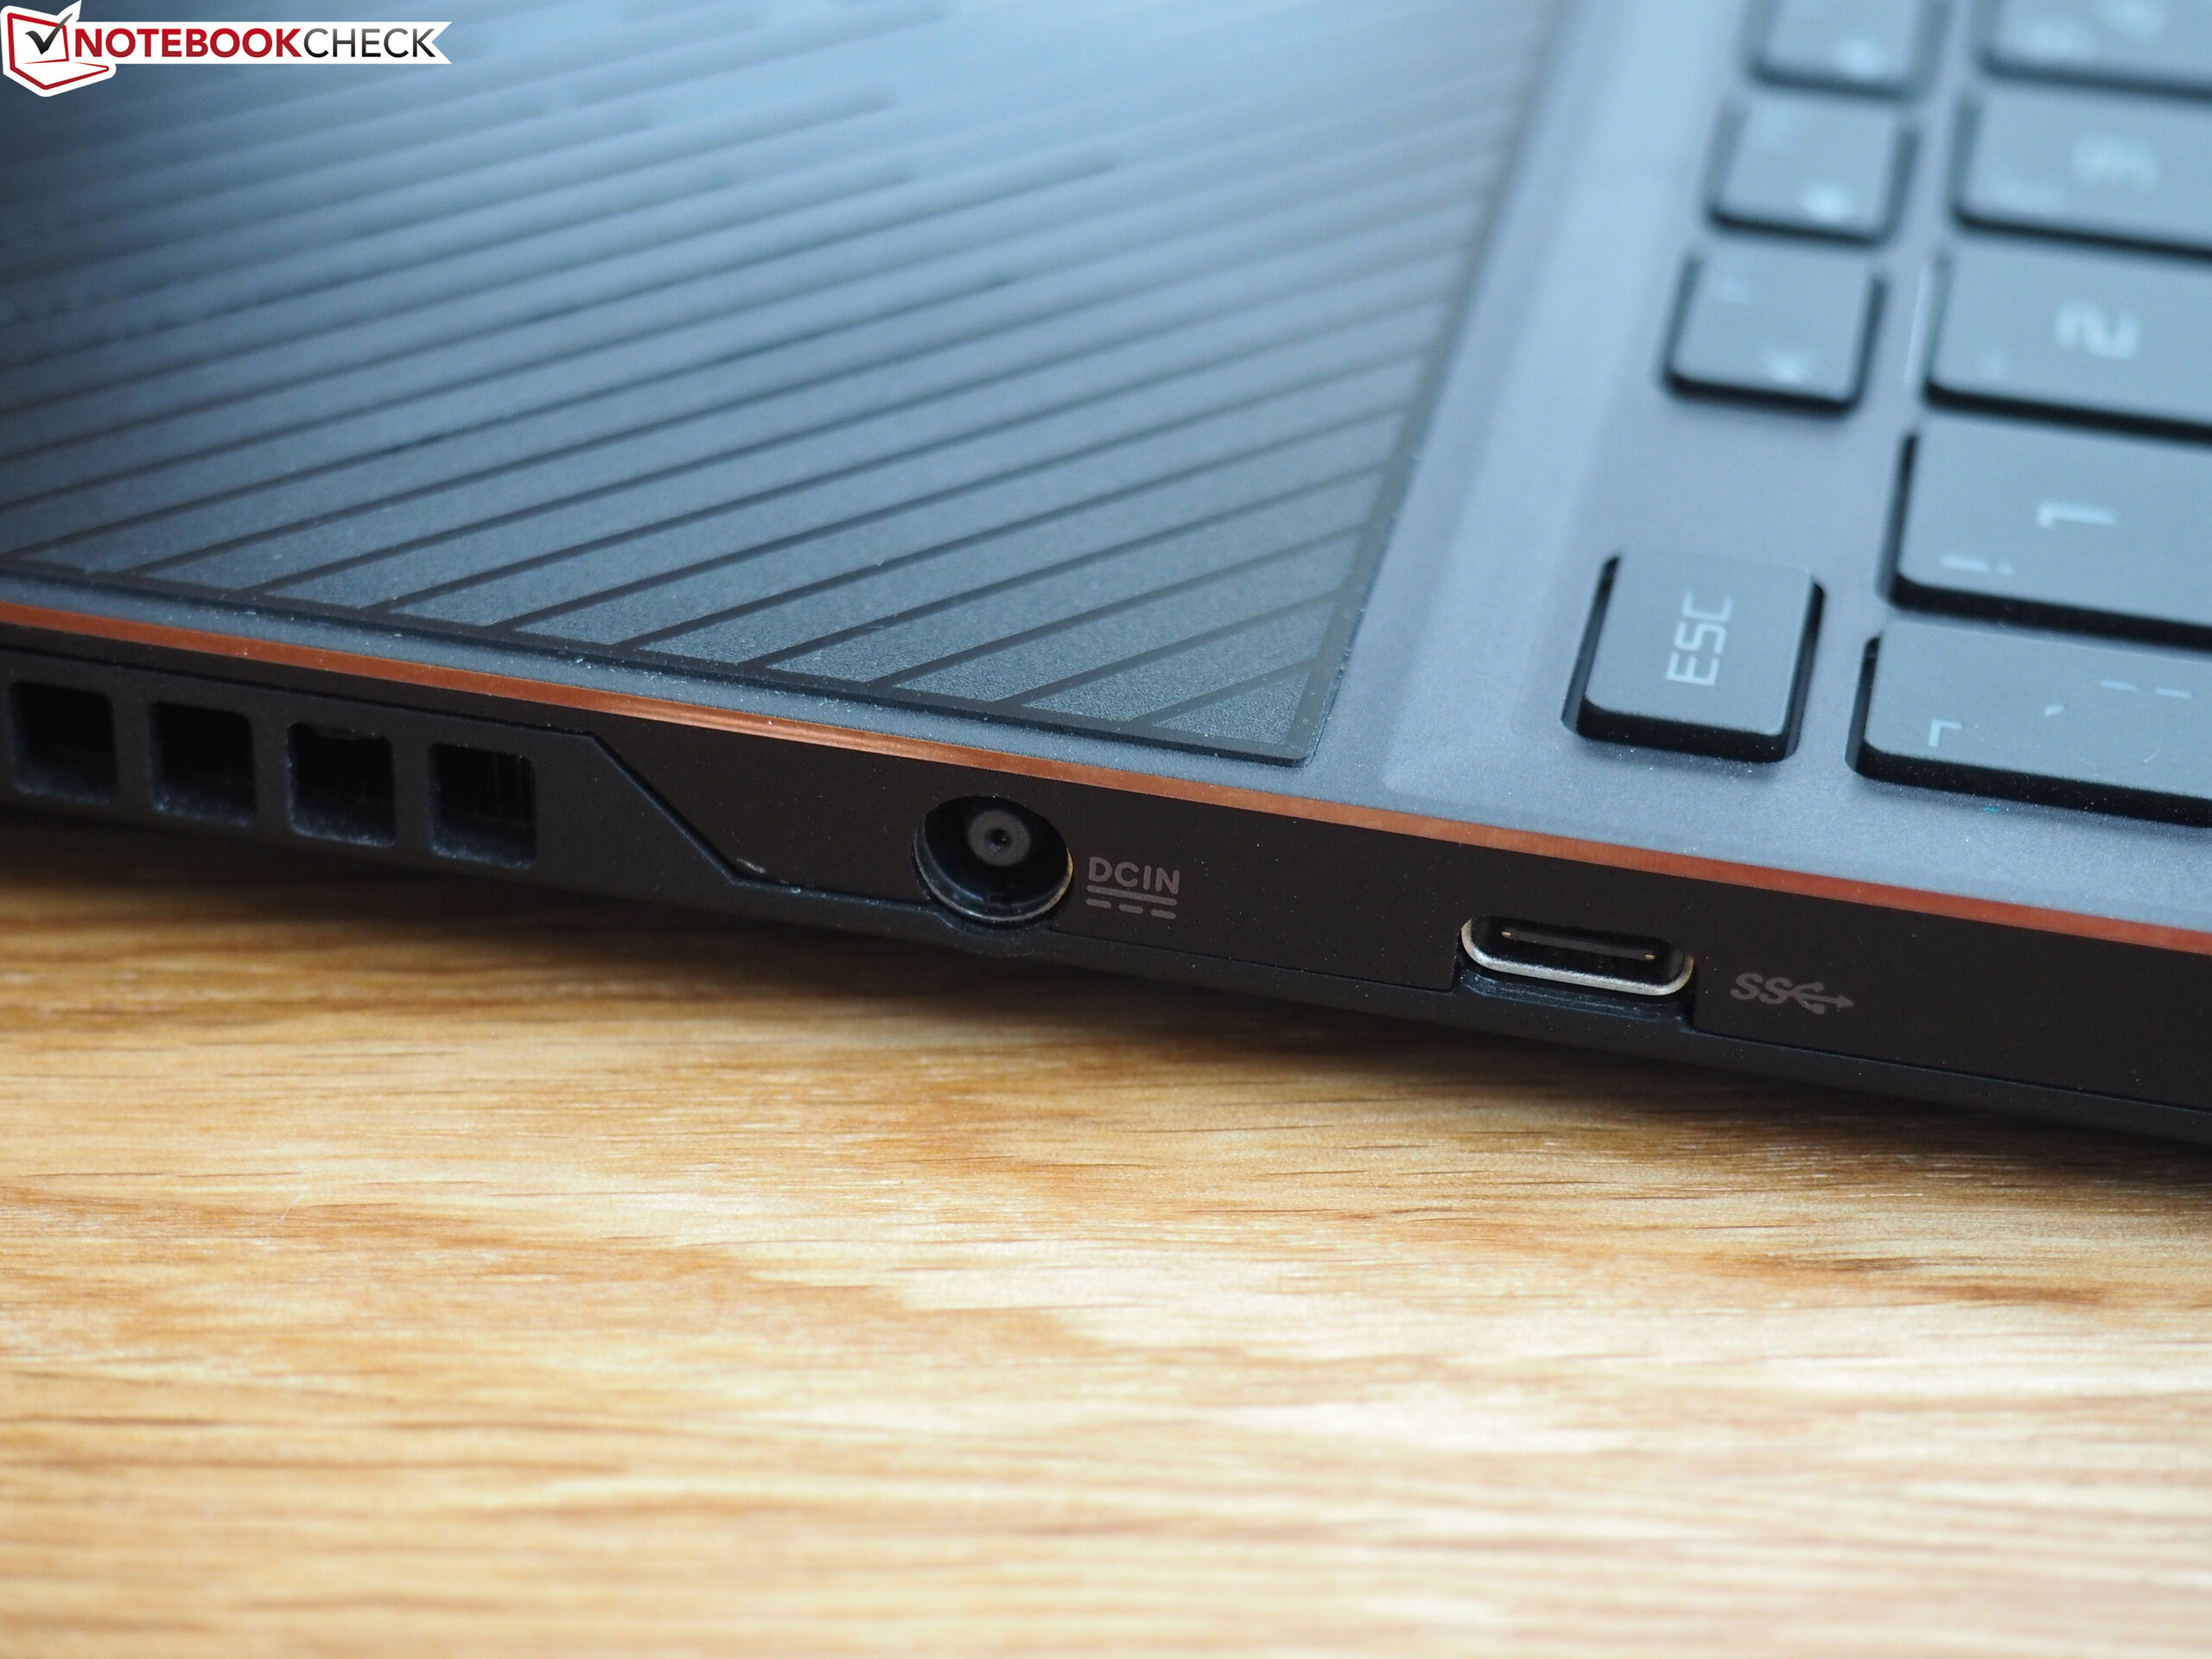
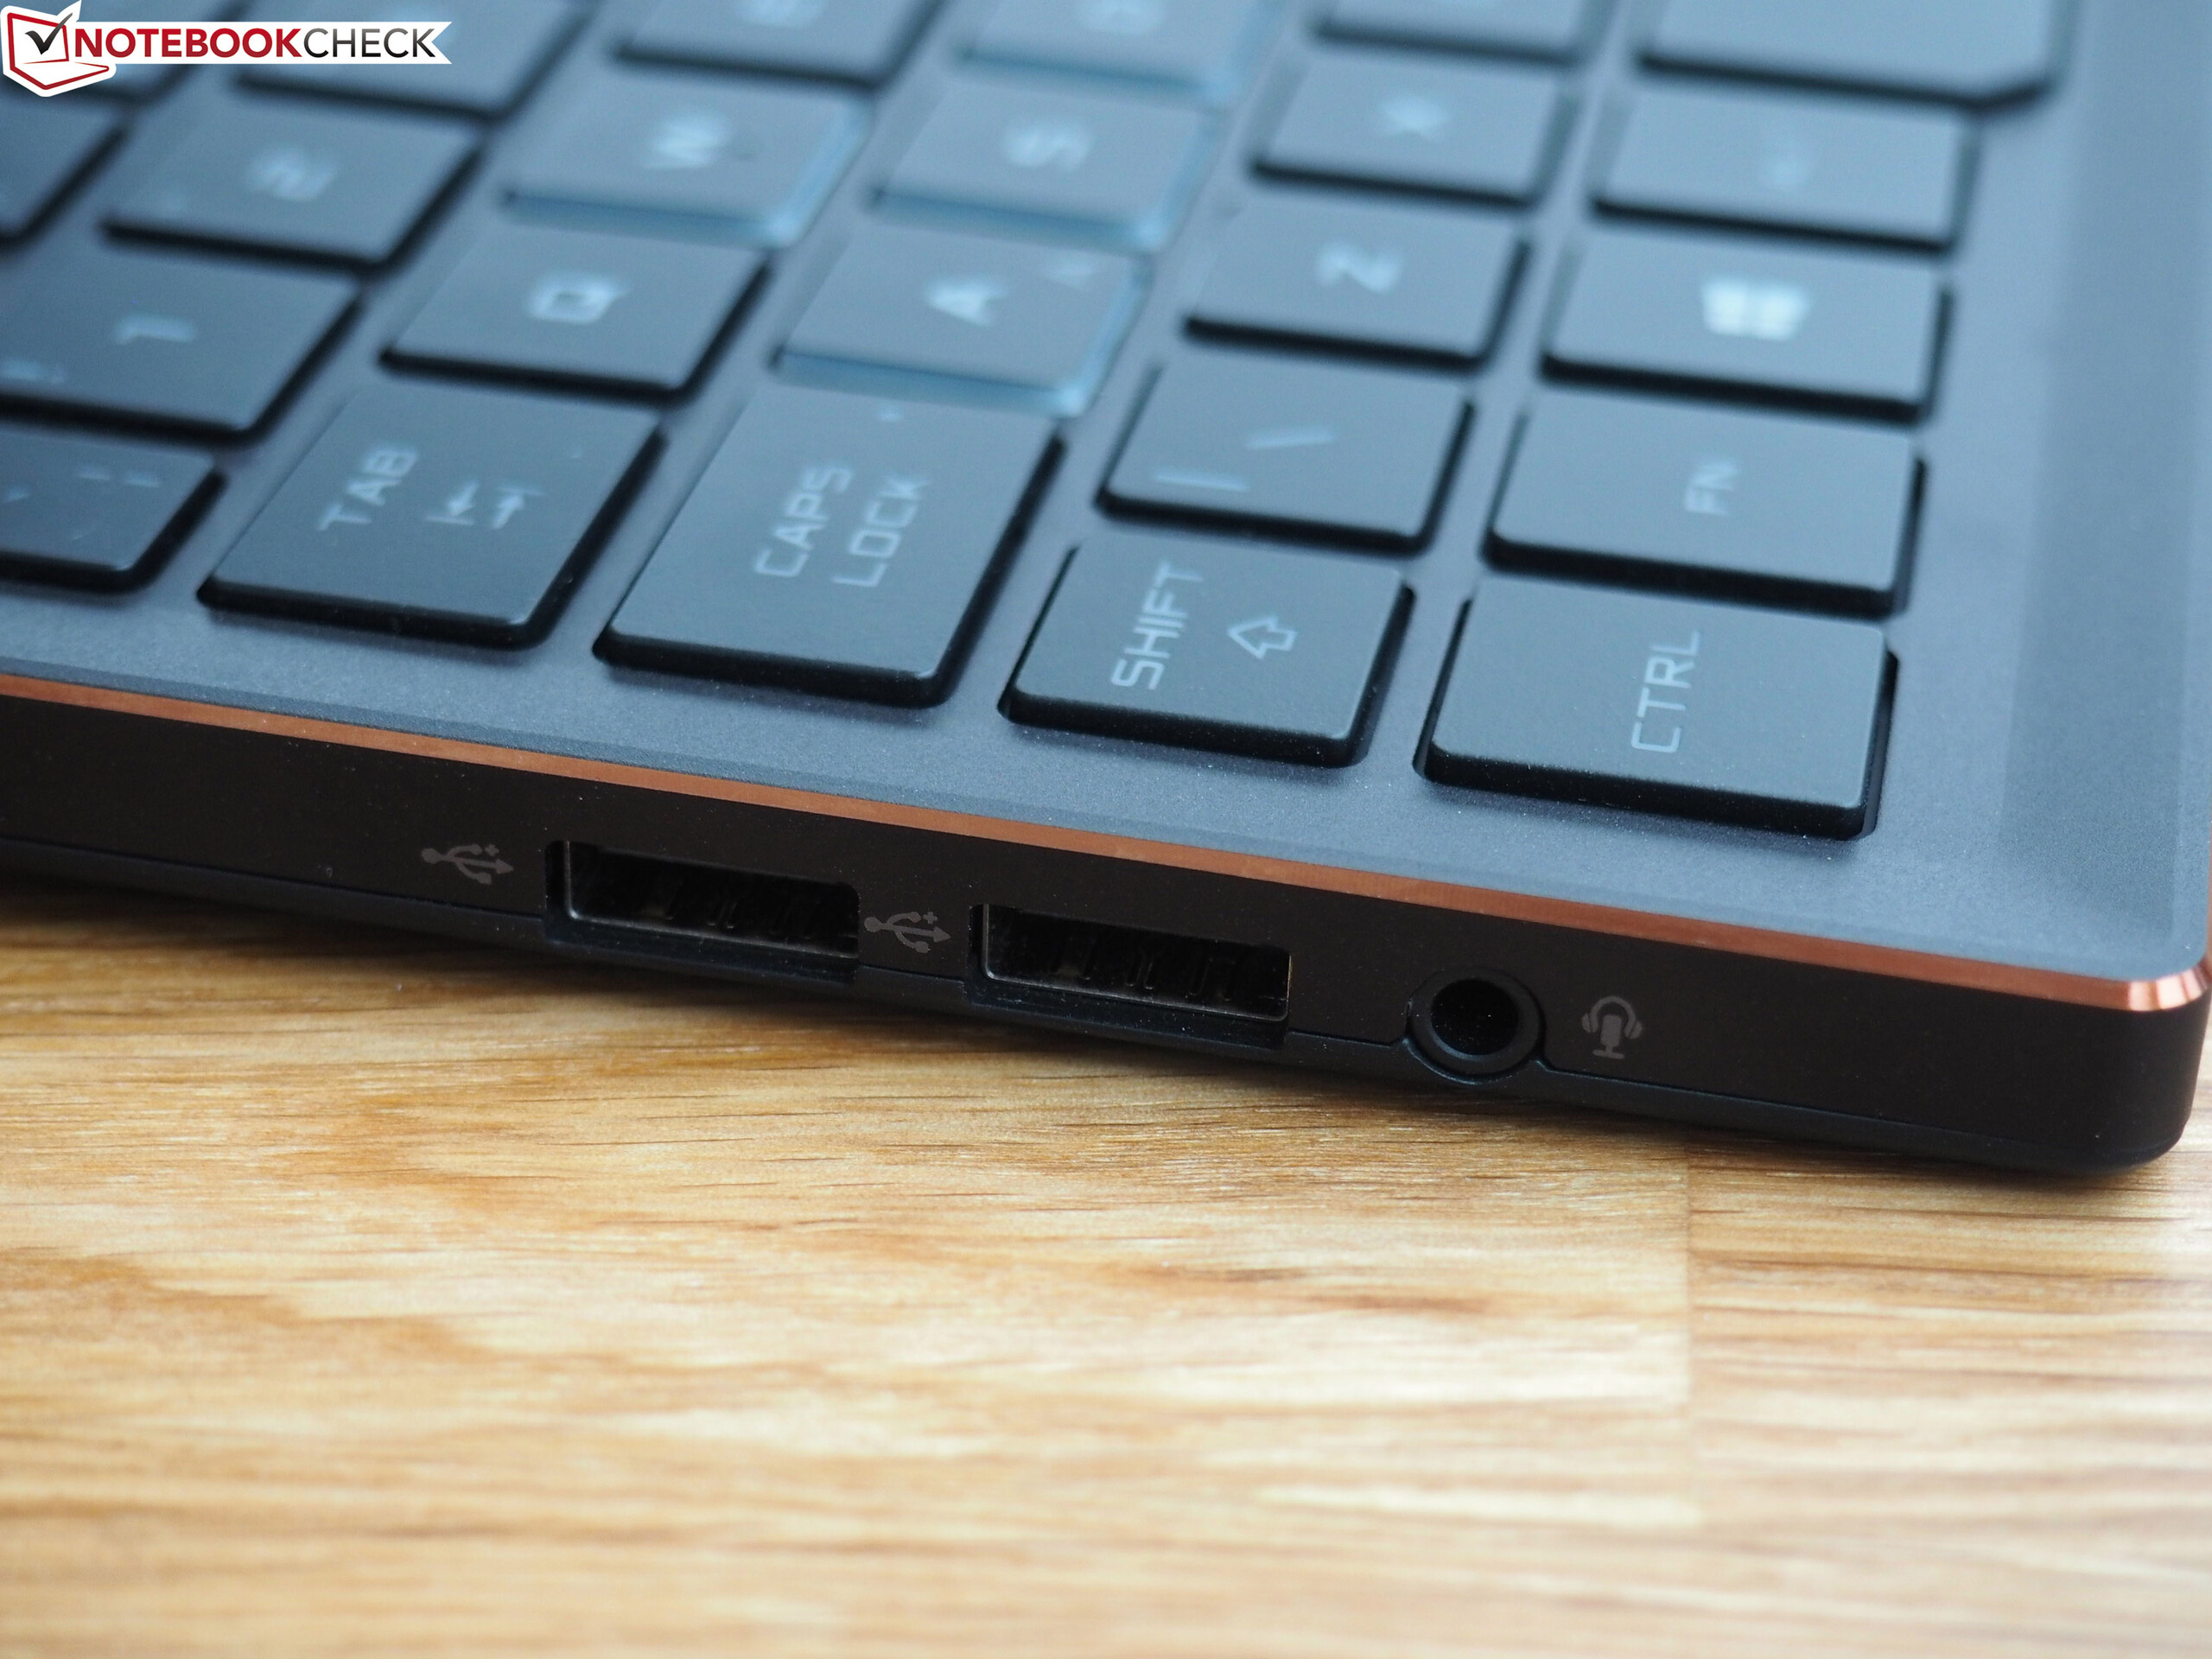
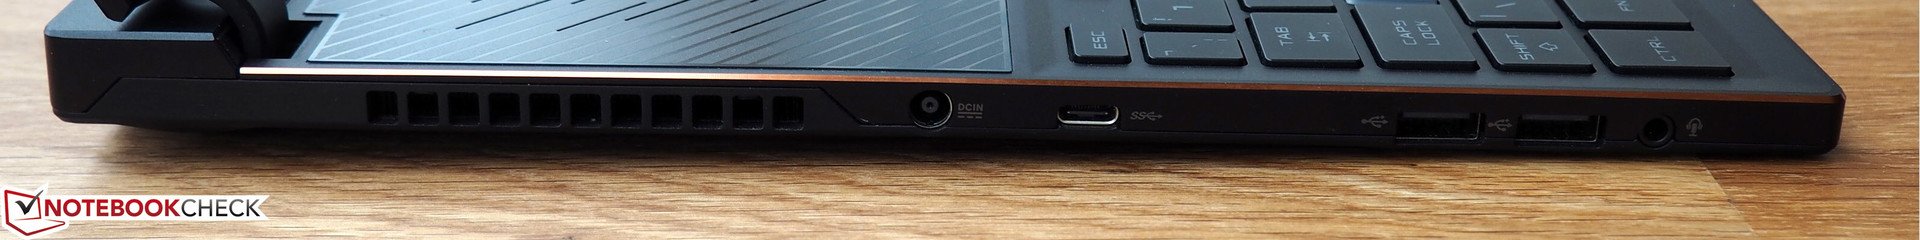
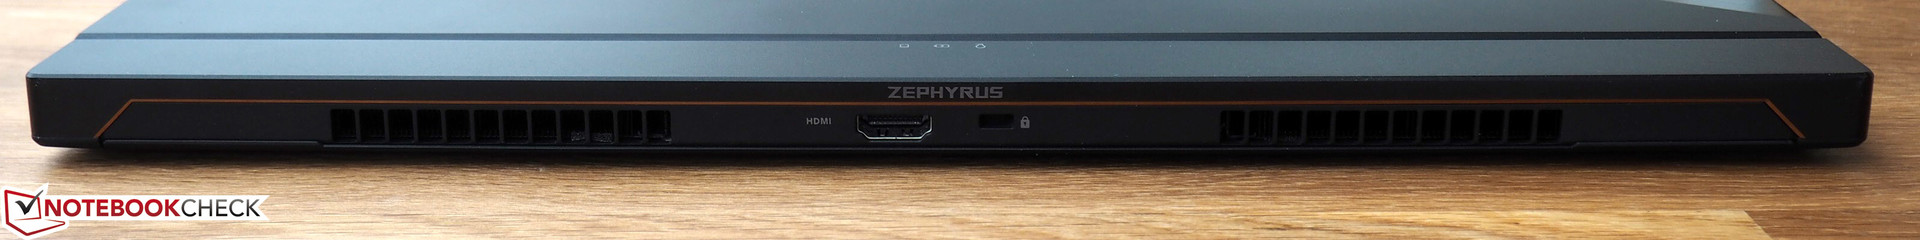
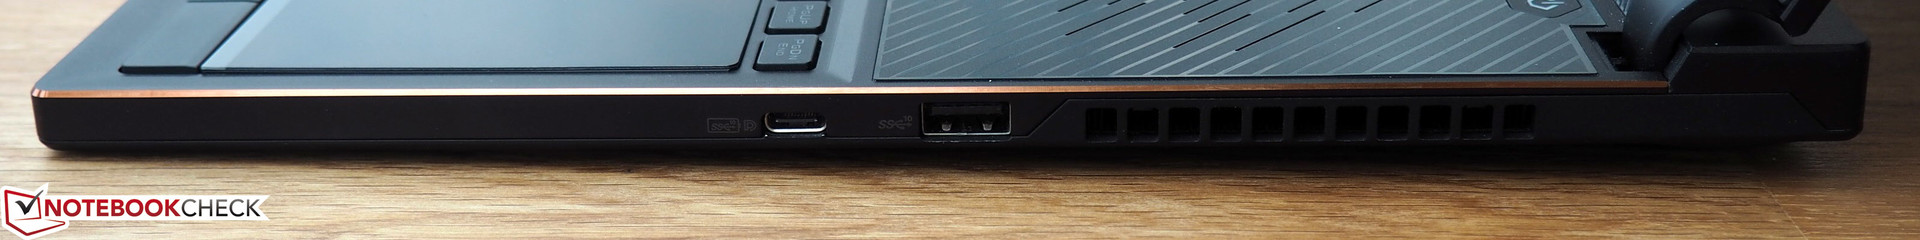
Também continua sendo um mistério para nós porque o teclado não está no lugar habitual para portáteis, por que a variedade de conexões foi reduzida (o GX501 ainda tinha Thunderbolt 3), por que a bateria é desnecessariamente pequena, e porque as opções de manutenção e atualização foram limitadas tão drasticamente (apenas 1 RAM e 1 M.2). Além do Gigabyte Aero 15X v8, o Razer Blade 15 e o MSI GS65 Stealth também podem mostrar como fazer um melhor trabalho.
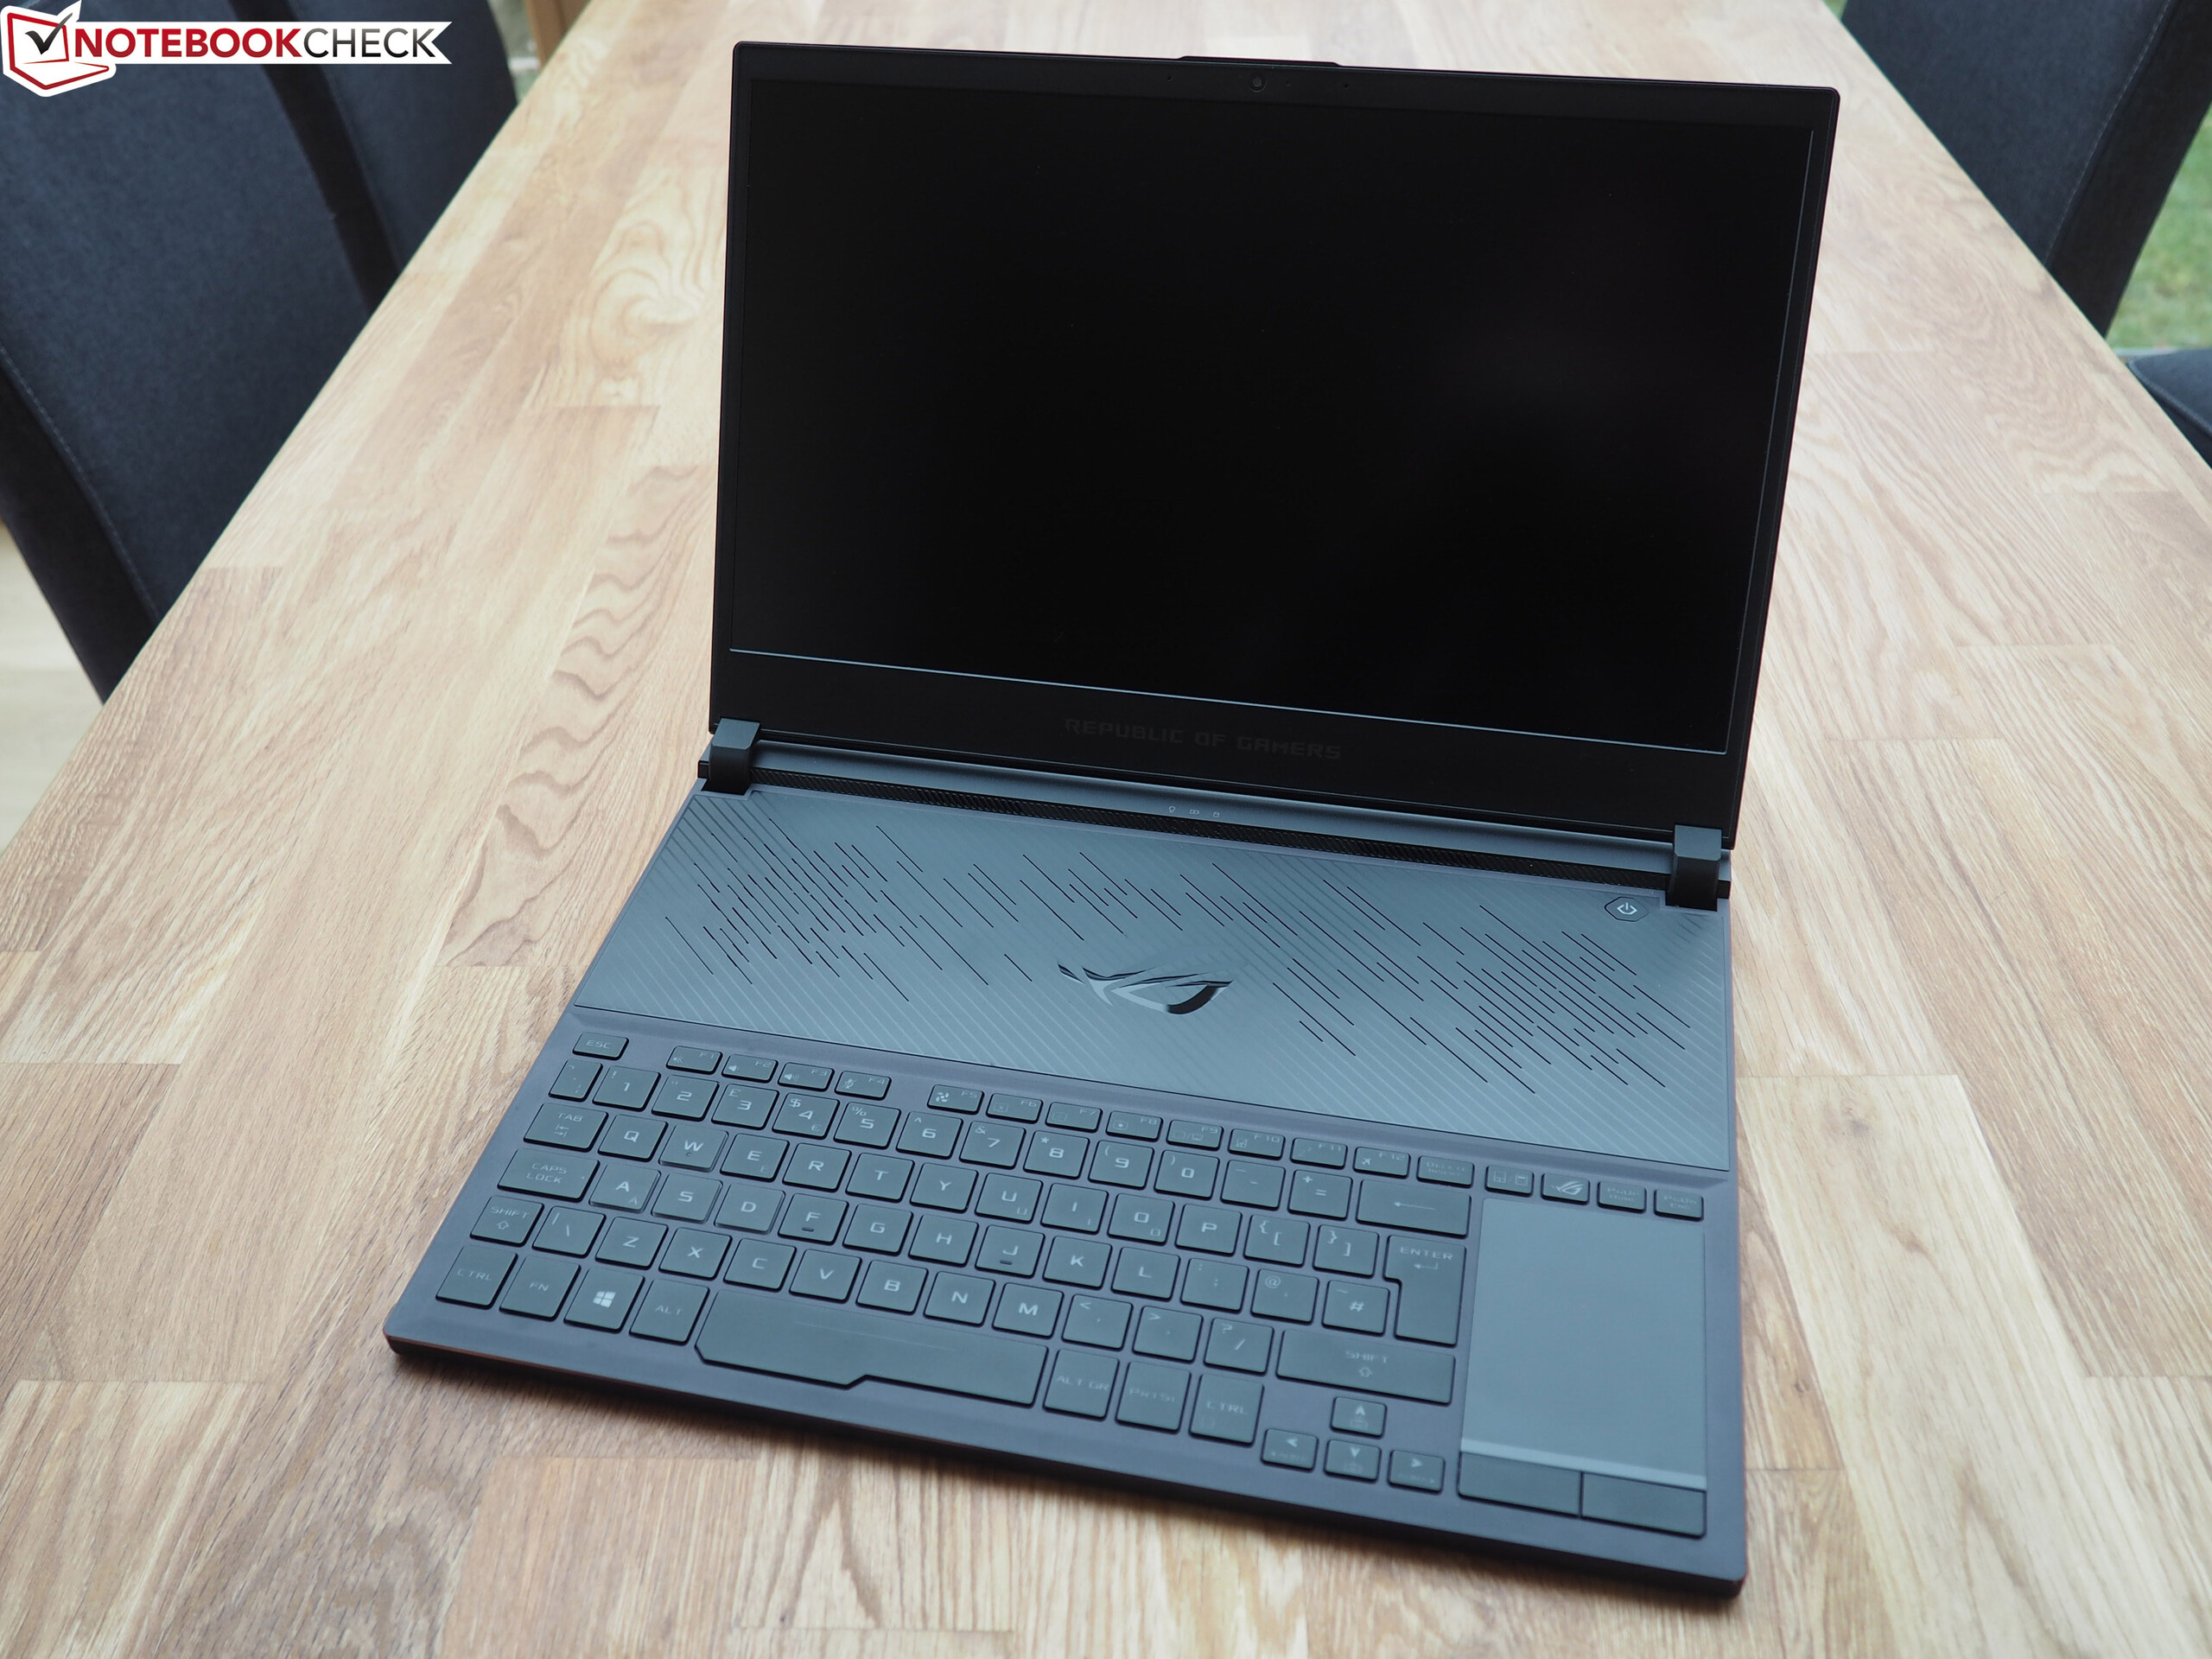
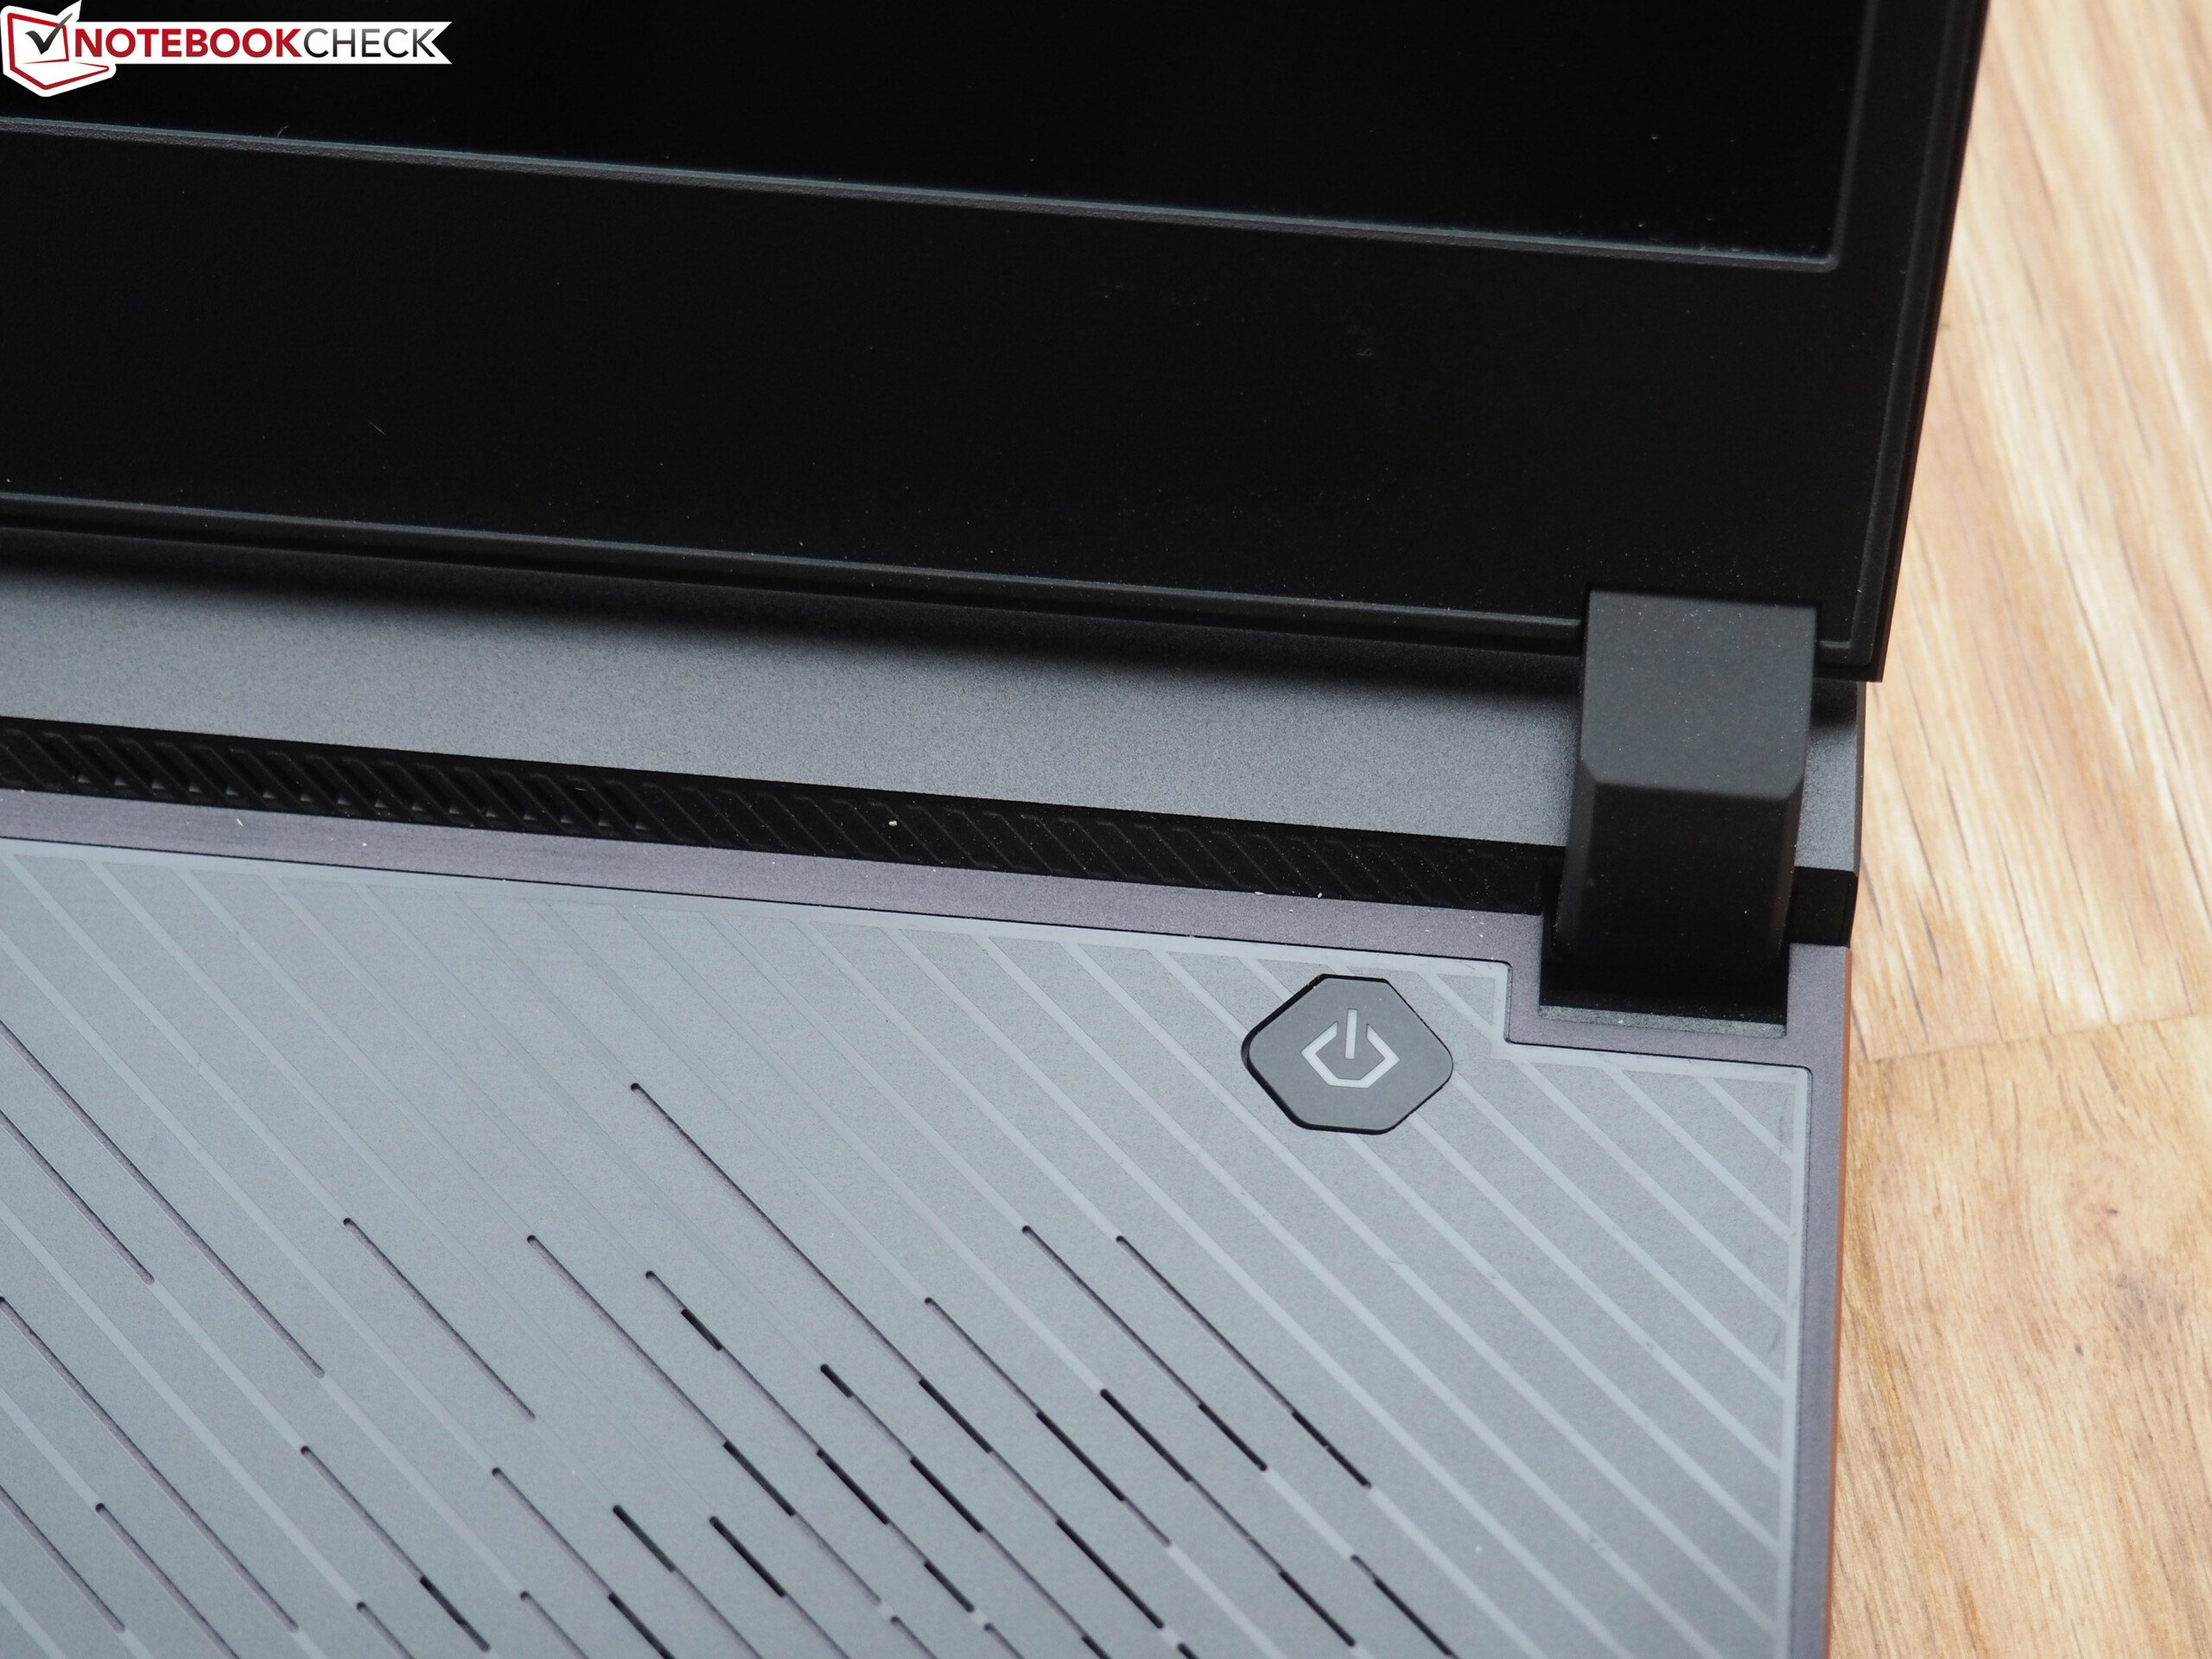
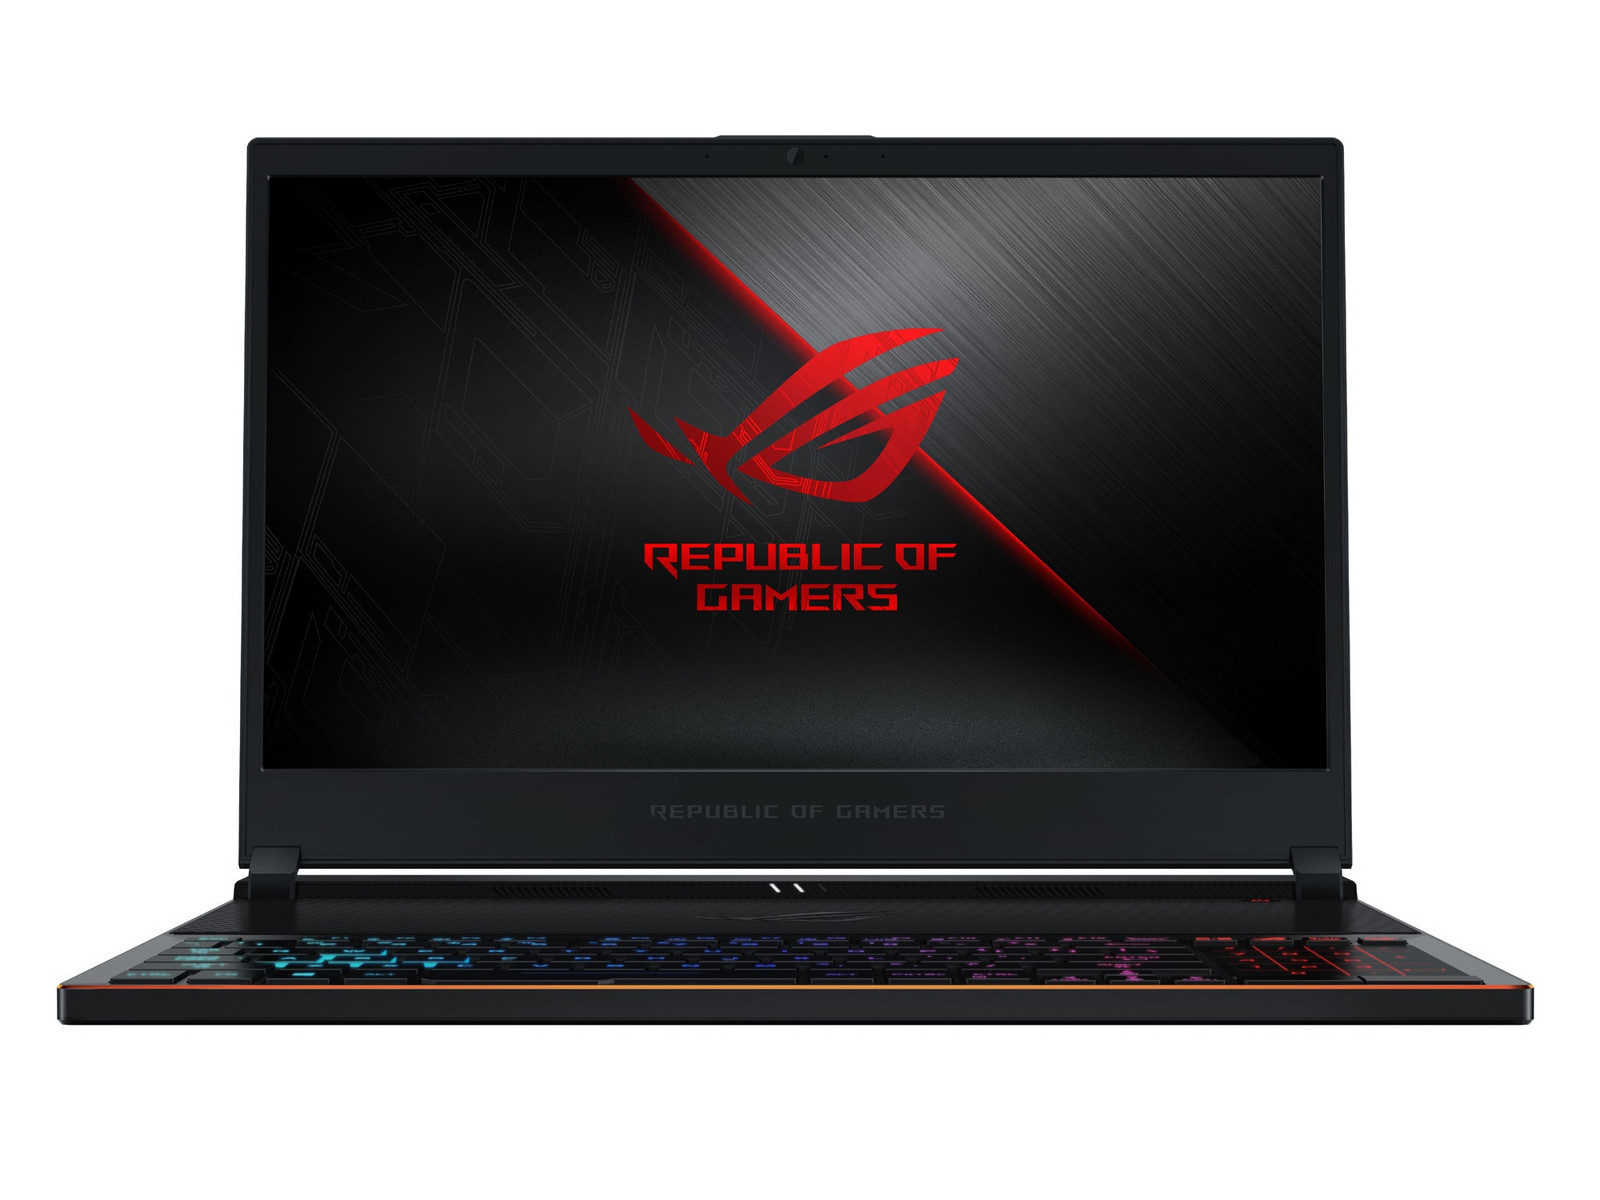
Sem esses concorrentes, o GX531 teria as coisas significativamente mais fáceis, dado que a Asus teve sucesso com muitos outros aspectos do dispositivo para jogos de 15 polegadas, como a carcaça elegante e de alta qualidade, a iluminação RGB e o painel extremamente rápido de 144 Hz. com um alto contraste e cores precisas. No entanto, independentemente dos marcos finos, em geral, o GX531 ainda representa mais um passo atrás do que para frente.
Asus Zephyrus S GX531GS
- 11/06/2018 v6 (old)
Florian Glaser
Price comparison