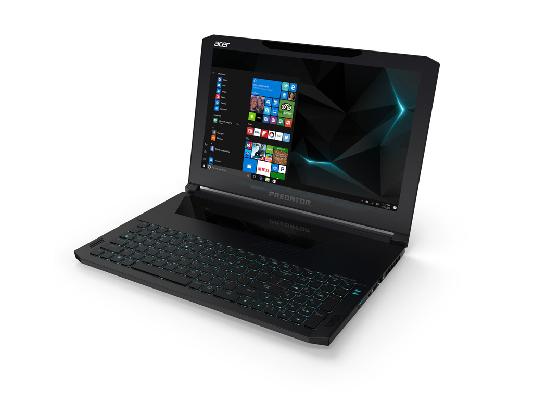
Breve Análise do Portátil Acer Predator Triton 700 (i7-7700HQ, GTX 1080 Max-Q, Full-HD)
| Networking | |
| iperf3 transmit AX12 | |
| MSI GS63VR 7RF-228US | |
| Acer Predator Triton 700 | |
| Aorus X5 v7 | |
| Eurocom Q5 | |
| Asus Zephyrus GX501 | |
| iperf3 receive AX12 | |
| Asus Zephyrus GX501 | |
| Acer Predator Triton 700 | |
| Eurocom Q5 | |
| MSI GS63VR 7RF-228US | |
| Aorus X5 v7 | |
| |||||||||||||||||||||||||
iluminação: 84 %
iluminação com acumulador: 291 cd/m²
Contraste: 1323:1 (Preto: 0.22 cd/m²)
ΔE ColorChecker Calman: 5.52 | ∀{0.5-29.43 Ø4.71}
ΔE Greyscale Calman: 6.59 | ∀{0.09-98 Ø4.96}
89% sRGB (Argyll 1.6.3 3D)
58% AdobeRGB 1998 (Argyll 1.6.3 3D)
63.5% AdobeRGB 1998 (Argyll 3D)
88.7% sRGB (Argyll 3D)
62.5% Display P3 (Argyll 3D)
Gamma: 2.44
CCT: 7816 K
| Acer Predator Triton 700 AUO B156HAN04.2 (AUO42ED), 1920x1080, 15.6" | Asus Zephyrus GX501 AUO B156HAN04.2 (AUO42ED), 1920x1080, 15.6" | Eurocom Q5 ID: LGD04D4, Name: LG Philips LP156UD1-SPB1, 3840x2160, 15.6" | Aorus X5 v7 AU Optronics B156ZAN02.3 (AUO23EB), 3840x2160, 15.6" | MSI GS63VR 7RF-228US 3840x2160, 15.6" | |
|---|---|---|---|---|---|
| Display | 4% | 2% | 4% | -21% | |
| Display P3 Coverage (%) | 62.5 | 64.8 4% | 63 1% | 65.3 4% | 48.21 -23% |
| sRGB Coverage (%) | 88.7 | 91.8 3% | 92.7 5% | 91.9 4% | 72.6 -18% |
| AdobeRGB 1998 Coverage (%) | 63.5 | 65.9 4% | 64.4 1% | 66.3 4% | 49.81 -22% |
| Response Times | 15% | 16% | 7% | 29% | |
| Response Time Grey 50% / Grey 80% * (ms) | 44.8 ? | 40.4 ? 10% | 32.4 ? 28% | 44 ? 2% | 28 ? 37% |
| Response Time Black / White * (ms) | 29.6 ? | 24 ? 19% | 28.8 ? 3% | 26.4 ? 11% | 23.6 ? 20% |
| PWM Frequency (Hz) | 1351 ? | ||||
| Screen | 1% | -19% | 4% | -31% | |
| Brightness middle (cd/m²) | 291 | 328 13% | 287.5 -1% | 307 5% | 274.2 -6% |
| Brightness (cd/m²) | 277 | 305 10% | 279 1% | 297 7% | 263 -5% |
| Brightness Distribution (%) | 84 | 83 -1% | 87 4% | 92 10% | 92 10% |
| Black Level * (cd/m²) | 0.22 | 0.25 -14% | 0.65 -195% | 0.3 -36% | 0.44 -100% |
| Contrast (:1) | 1323 | 1312 -1% | 442 -67% | 1023 -23% | 623 -53% |
| Colorchecker dE 2000 * | 5.52 | 6.02 -9% | 4.5 18% | 4.72 14% | 8 -45% |
| Colorchecker dE 2000 max. * | 10.72 | 10.14 5% | 8.9 17% | 8.07 25% | 14.6 -36% |
| Greyscale dE 2000 * | 6.59 | 6.32 4% | 4.6 30% | 4.79 27% | 9.1 -38% |
| Gamma | 2.44 90% | 2.28 96% | 2.39 92% | 2.42 91% | 2.24 98% |
| CCT | 7816 83% | 8194 79% | 7393 88% | 7690 85% | 5020 129% |
| Color Space (Percent of AdobeRGB 1998) (%) | 58 | 60 3% | 59 2% | 60 3% | 45.7 -21% |
| Color Space (Percent of sRGB) (%) | 89 | 92 3% | 92.3 4% | 92 3% | 72.1 -19% |
| Média Total (Programa/Configurações) | 7% /
4% | -0% /
-10% | 5% /
4% | -8% /
-21% |
* ... menor é melhor
Exibir tempos de resposta
| ↔ Tempo de resposta preto para branco | ||
|---|---|---|
| 29.6 ms ... ascensão ↗ e queda ↘ combinadas | ↗ 15.6 ms ascensão | 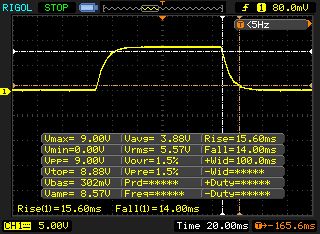 |
| ↘ 14 ms queda | ||
| A tela mostra taxas de resposta relativamente lentas em nossos testes e pode ser muito lenta para os jogadores. Em comparação, todos os dispositivos testados variam de 0.1 (mínimo) a 240 (máximo) ms. » 79 % de todos os dispositivos são melhores. Isso significa que o tempo de resposta medido é pior que a média de todos os dispositivos testados (19.8 ms). | ||
| ↔ Tempo de resposta 50% cinza a 80% cinza | ||
| 44.8 ms ... ascensão ↗ e queda ↘ combinadas | ↗ 21.2 ms ascensão | 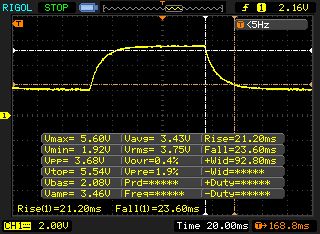 |
| ↘ 23.6 ms queda | ||
| A tela mostra taxas de resposta lentas em nossos testes e será insatisfatória para os jogadores. Em comparação, todos os dispositivos testados variam de 0.165 (mínimo) a 636 (máximo) ms. » 76 % de todos os dispositivos são melhores. Isso significa que o tempo de resposta medido é pior que a média de todos os dispositivos testados (30.9 ms). | ||
Cintilação da tela / PWM (modulação por largura de pulso)
| Tela tremeluzindo / PWM não detectado | 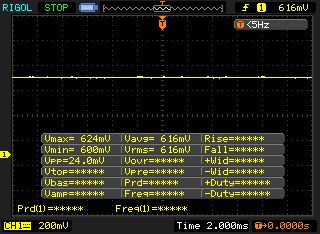 | ||
[pwm_comparison] Em comparação: 52 % de todos os dispositivos testados não usam PWM para escurecer a tela. Se PWM foi detectado, uma média de 7744 (mínimo: 5 - máximo: 343500) Hz foi medida. | |||
| Cinebench R15 | |
| CPU Single 64Bit | |
| Aorus X5 v7 | |
| MSI GS63VR 7RF-228US | |
| Asus Zephyrus GX501 | |
| Acer Predator Triton 700 | |
| Eurocom Q5 | |
| CPU Multi 64Bit | |
| Aorus X5 v7 | |
| MSI GS63VR 7RF-228US | |
| Eurocom Q5 | |
| Asus Zephyrus GX501 | |
| Acer Predator Triton 700 | |
| Cinebench R11.5 | |
| CPU Single 64Bit | |
| Aorus X5 v7 | |
| Acer Predator Triton 700 | |
| Asus Zephyrus GX501 | |
| MSI GS63VR 7RF-228US | |
| Eurocom Q5 | |
| CPU Multi 64Bit | |
| Aorus X5 v7 | |
| MSI GS63VR 7RF-228US | |
| Asus Zephyrus GX501 | |
| Eurocom Q5 | |
| Acer Predator Triton 700 | |
| PCMark 8 | |
| Home Score Accelerated v2 | |
| Acer Predator Triton 700 | |
| Asus Zephyrus GX501 | |
| Aorus X5 v7 | |
| MSI GS63VR 7RF-228US | |
| Eurocom Q5 | |
| Work Score Accelerated v2 | |
| Asus Zephyrus GX501 | |
| MSI GS63VR 7RF-228US | |
| Acer Predator Triton 700 | |
| Eurocom Q5 | |
| PCMark 10 - Score | |
| Acer Predator Triton 700 | |
| Asus Zephyrus GX501 | |
| Eurocom Q5 | |
| PCMark 8 Home Score Accelerated v2 | 5160 pontos | |
| PCMark 8 Work Score Accelerated v2 | 5211 pontos | |
| PCMark 10 Score | 5277 pontos | |
Ajuda | ||
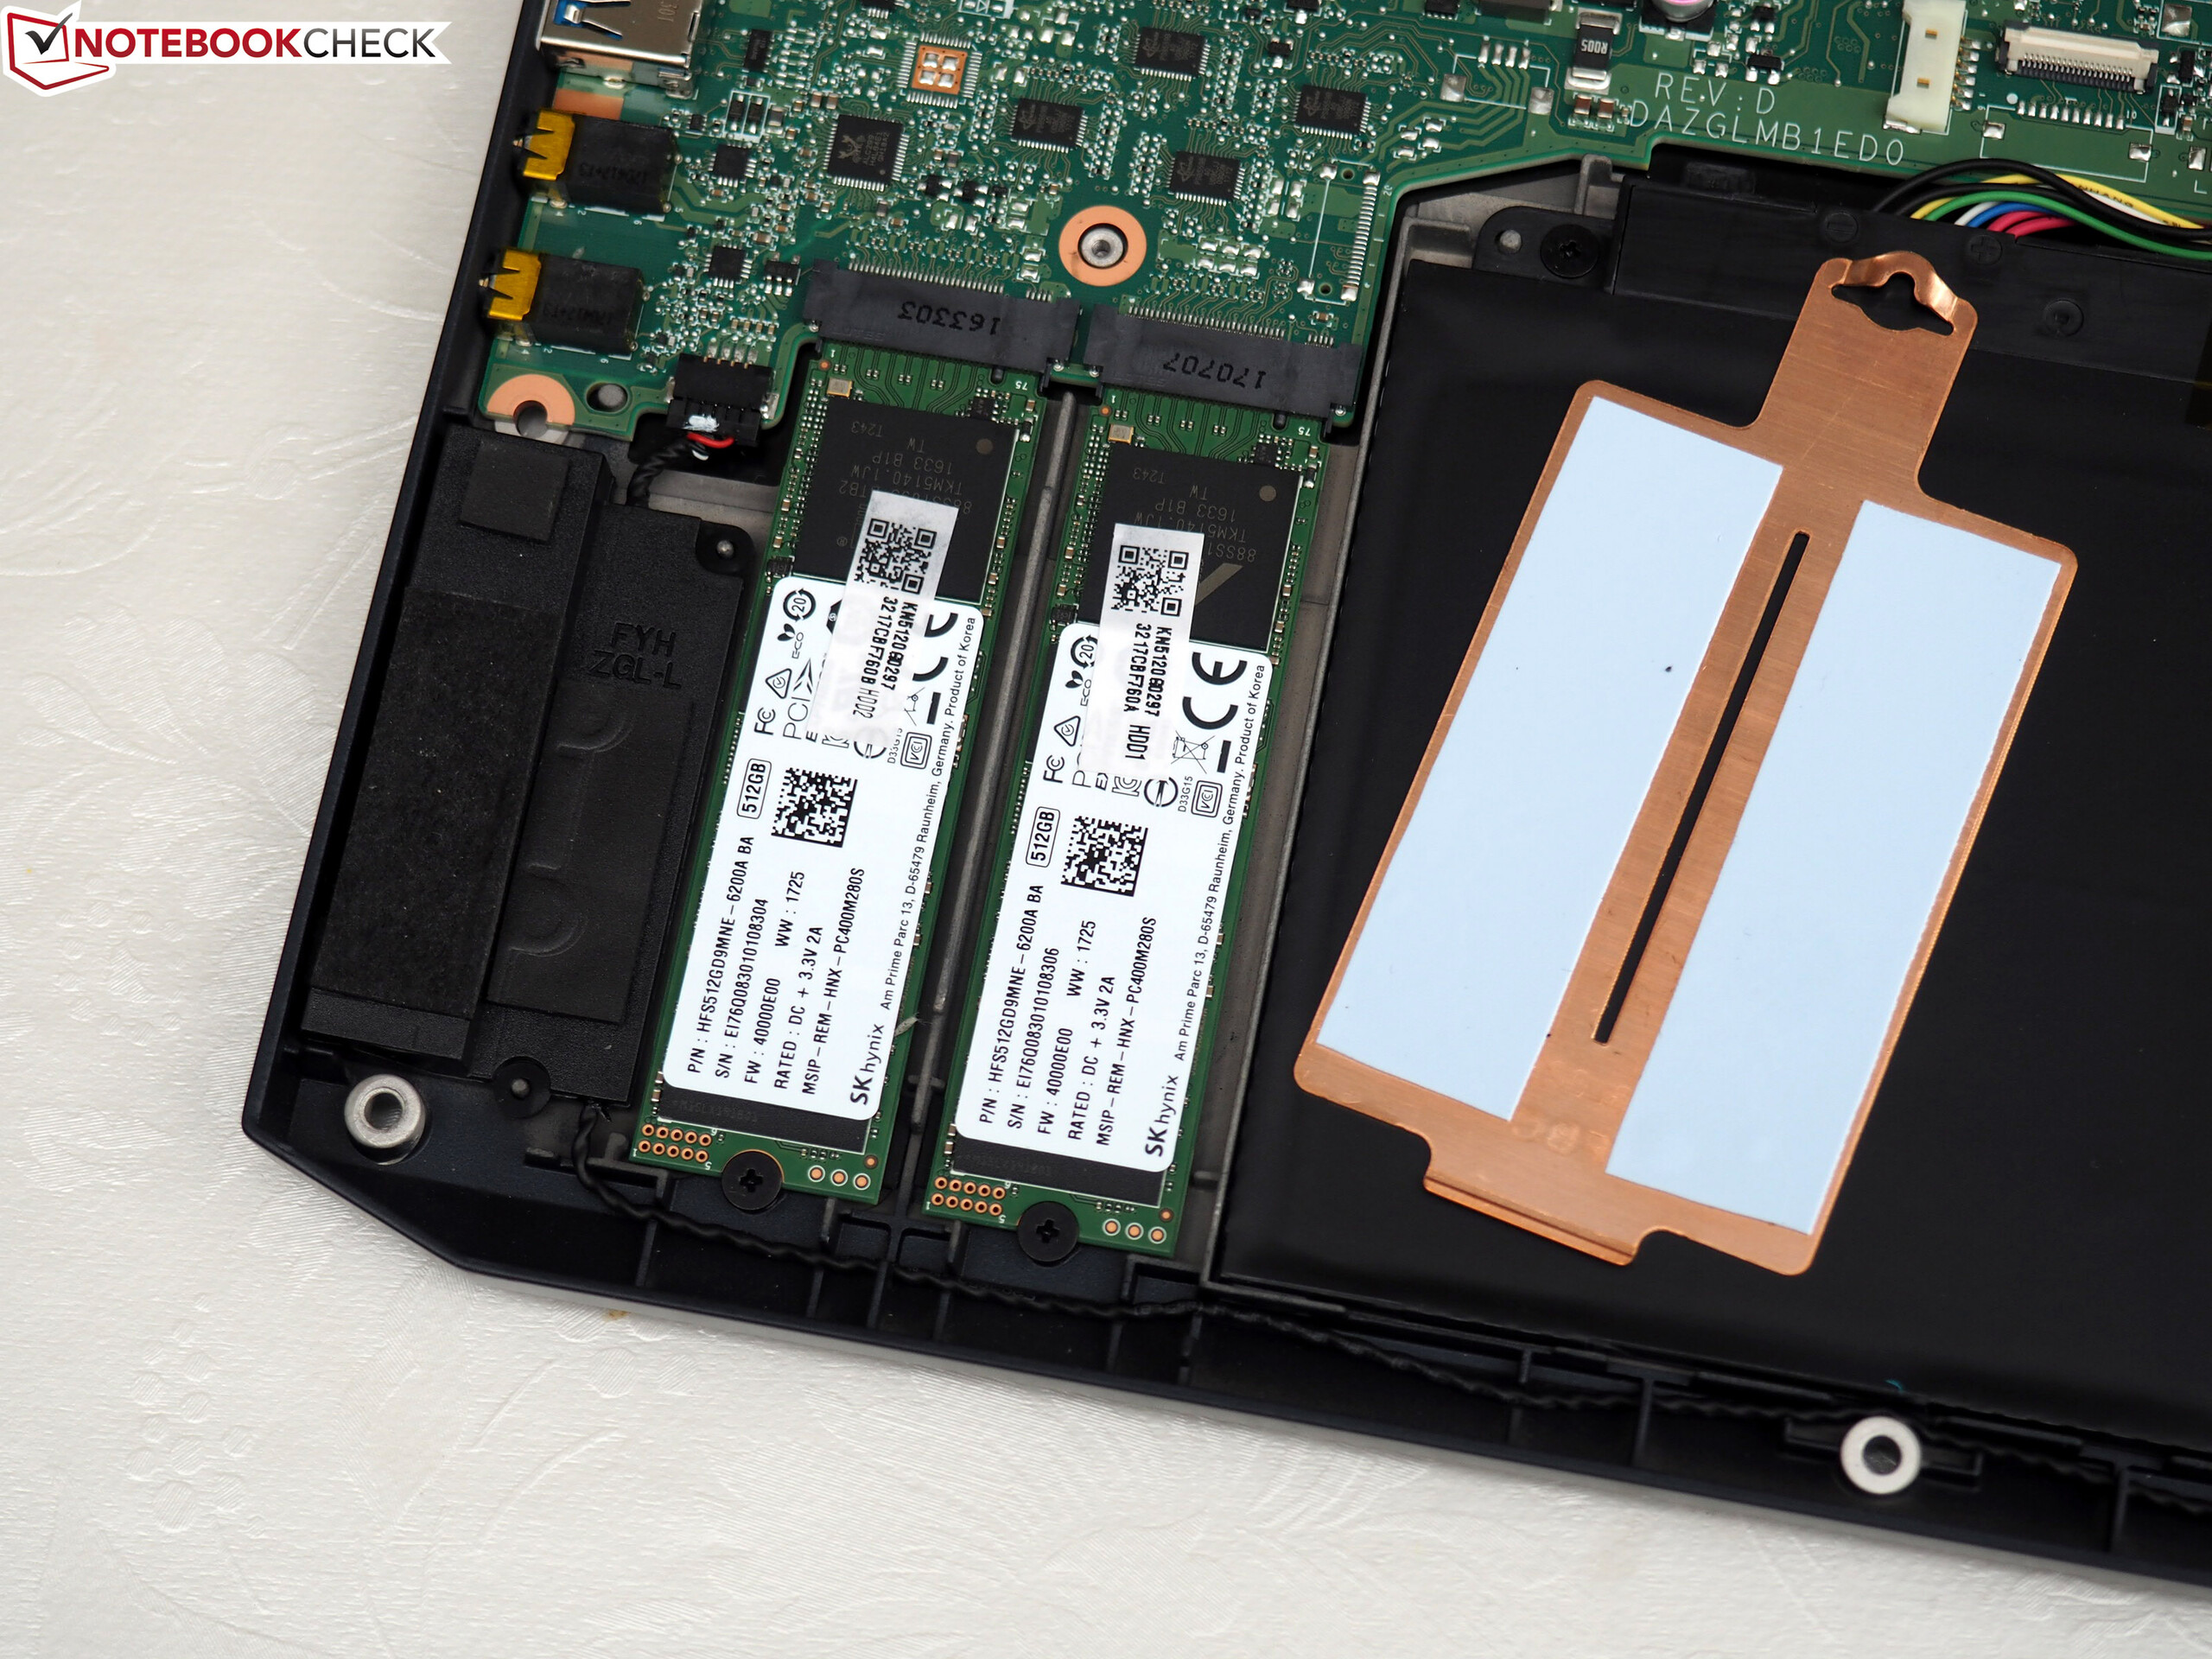
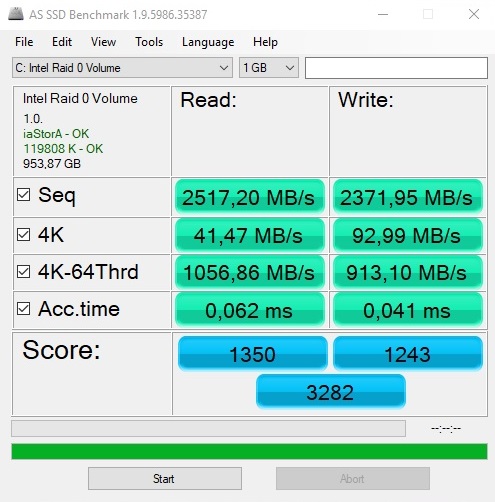
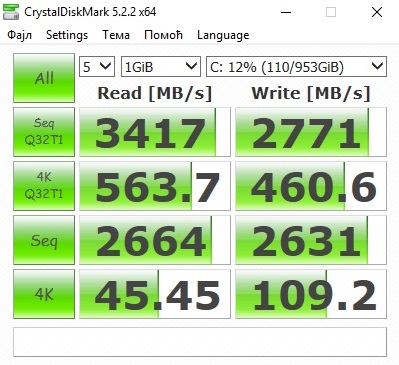
| Acer Predator Triton 700 2x SK Hynix Canvas SC300 512GB M.2 (HFS512G39MND) (RAID 0) | Asus Zephyrus GX501 Samsung SSD SM961 1TB M.2 MZVKW1T0HMLH | Eurocom Q5 Samsung SSD 960 Pro 512 GB m.2 | Aorus X5 v7 Toshiba NVMe THNSN5256GPU7 | MSI GS63VR 7RF-228US Samsung SM961 MZVKW512HMJP m.2 PCI-e | |
|---|---|---|---|---|---|
| CrystalDiskMark 5.2 / 6 | -15% | 10% | |||
| Read Seq Q32T1 (MB/s) | 3417 | 3445 1% | 3381 -1% | ||
| Write Seq Q32T1 (MB/s) | 2771 | 1848 -33% | 2075 -25% | ||
| Read 4K Q32T1 (MB/s) | 564 | 547 -3% | 575 2% | ||
| Write 4K Q32T1 (MB/s) | 460.6 | 463 1% | 498.7 8% | ||
| Read Seq (MB/s) | 2664 | 954 -64% | 2763 4% | ||
| Write Seq (MB/s) | 2631 | 1049 -60% | 2073 -21% | ||
| Read 4K (MB/s) | 45.45 | 45 -1% | 57.2 26% | ||
| Write 4K (MB/s) | 109.2 | 149 36% | 202.6 86% |

| 3DMark - 1920x1080 Fire Strike Graphics | |
| Asus Zephyrus GX501 | |
| Acer Predator Triton 700 | |
| Aorus X5 v7 | |
| Eurocom Q5 | |
| MSI GS63VR 7RF-228US | |
| 3DMark 11 - 1280x720 Performance GPU | |
| Acer Predator Triton 700 | |
| Asus Zephyrus GX501 | |
| Aorus X5 v7 | |
| Eurocom Q5 | |
| MSI GS63VR 7RF-228US | |
| 3DMark 11 Performance | 17113 pontos | |
| 3DMark Ice Storm Standard Score | 140229 pontos | |
| 3DMark Cloud Gate Standard Score | 28416 pontos | |
| 3DMark Fire Strike Score | 14287 pontos | |
Ajuda | ||
| baixo | média | alto | ultra | 4K | |
|---|---|---|---|---|---|
| GTA V (2015) | 167 | 159 | 129 | 72 | 64 |
| The Witcher 3 (2015) | 117.3 | 62.9 | |||
| Farming Simulator 17 (2016) | 195 | 126 | |||
| Resident Evil 7 (2017) | 171 | 142 | |||
| For Honor (2017) | 154 | 115 | |||
| Ghost Recon Wildlands (2017) | 92.1 | 54.5 | |||
| Prey (2017) | 138 | 134 | |||
| Rocket League (2017) | 228 | ||||
| Dirt 4 (2017) | 149 | 85.3 | |||
| Team Fortress 2 (2017) | 137 | 136 | 132 | 132 | 130 |
| Playerunknown's Battlegrounds (PUBG) (2017) | 103 | 81.8 | |||
| F1 2017 (2017) | 135 | 101 | |||
| Ark Survival Evolved (2017) | 56.6 | 38.6 | |||
| X-Plane 11.11 (2018) | 82.3 | 79.2 | 68.8 | 60.4 |
Barulho
| Ocioso |
| 33 / 34 / 40 dB |
| Carga |
| 41 / 48 dB |
 | ||
30 dB silencioso 40 dB(A) audível 50 dB(A) ruidosamente alto |
||
min: | ||
| Acer Predator Triton 700 GeForce GTX 1080 Max-Q, i7-7700HQ | Asus Zephyrus GX501 GeForce GTX 1080 Max-Q, i7-7700HQ | Eurocom Q5 GeForce GTX 1070 Max-Q, i7-7700HQ | Aorus X5 v7 GeForce GTX 1070 Mobile, i7-7820HK | MSI GS63VR 7RF-228US GeForce GTX 1060 Mobile, i7-7700HQ | |
|---|---|---|---|---|---|
| Noise | 5% | 2% | -6% | 4% | |
| desligado / ambiente * (dB) | 31 | 31 -0% | 29 6% | 30 3% | 28.8 7% |
| Idle Minimum * (dB) | 33 | 32 3% | 31.5 5% | 35 -6% | 33.1 -0% |
| Idle Average * (dB) | 34 | 33 3% | 33.8 1% | 36 -6% | 33.1 3% |
| Idle Maximum * (dB) | 40 | 34 15% | 33.8 15% | 40 -0% | 34 15% |
| Load Average * (dB) | 41 | 39 5% | 41.7 -2% | 43 -5% | 37.2 9% |
| Witcher 3 ultra * (dB) | 43 | 42 2% | 41.7 3% | 49 -14% | 46.1 -7% |
| Load Maximum * (dB) | 48 | 46 4% | 54.2 -13% | 55 -15% | 47.1 2% |
* ... menor é melhor
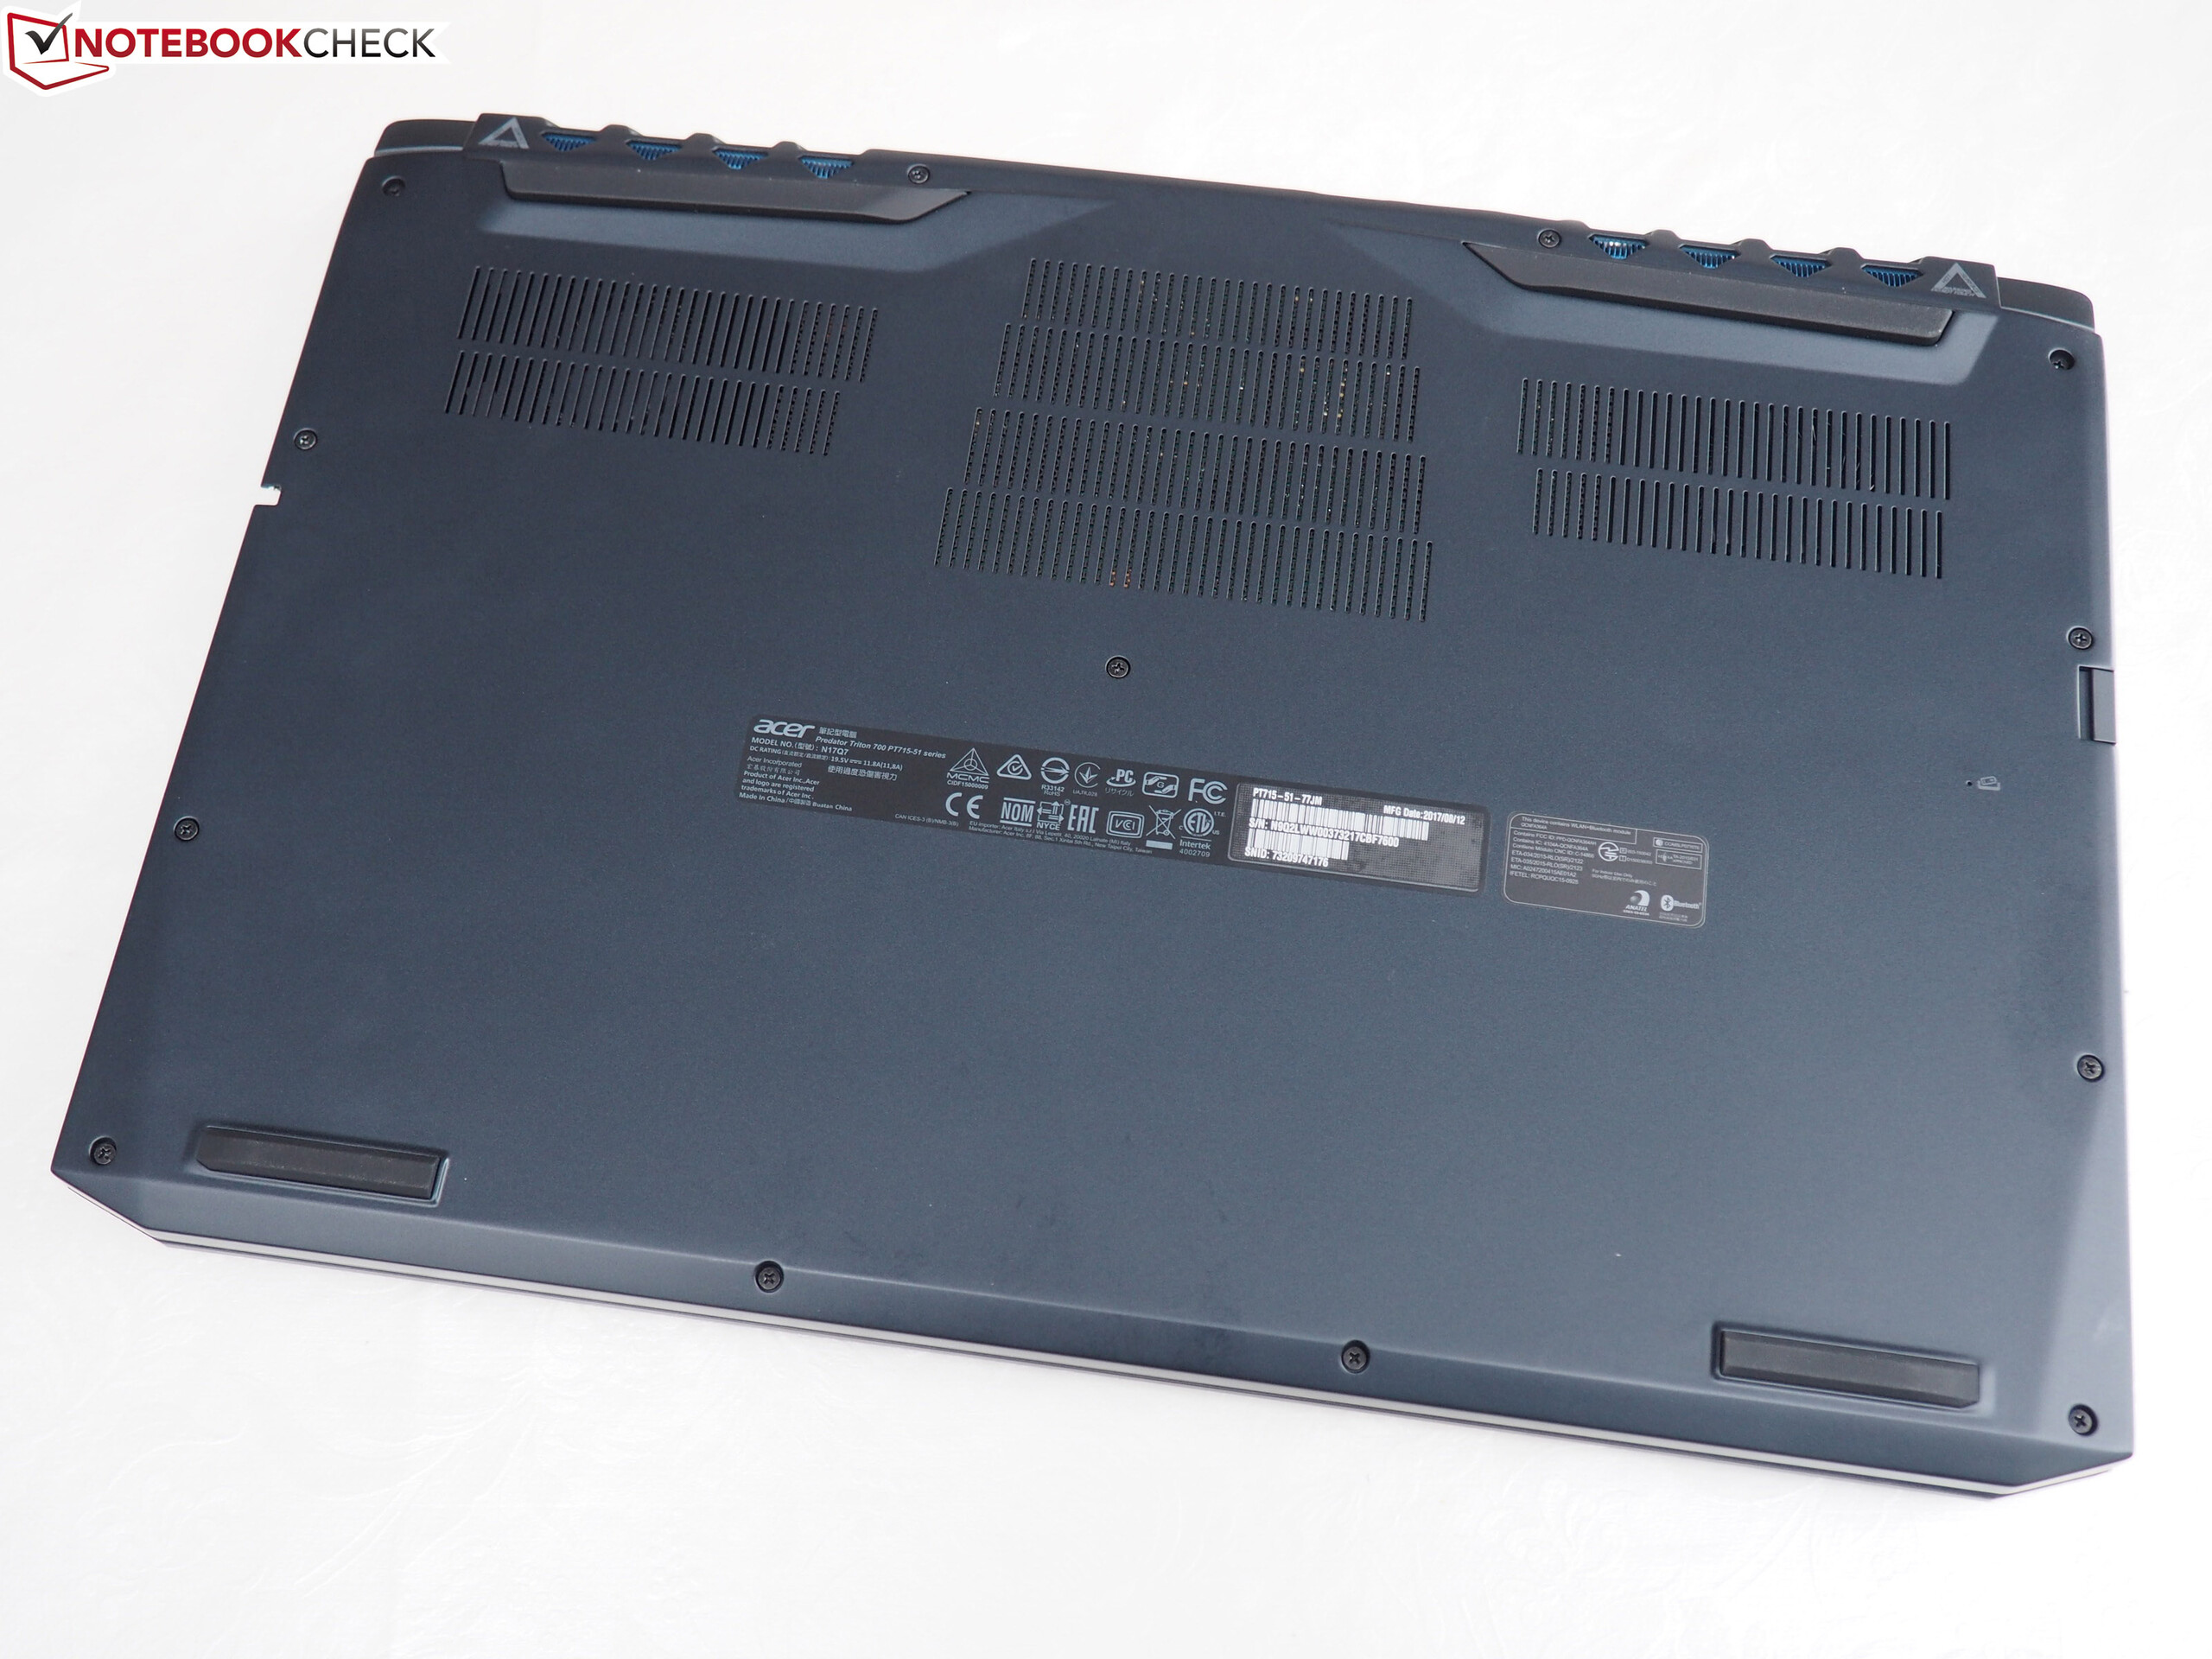
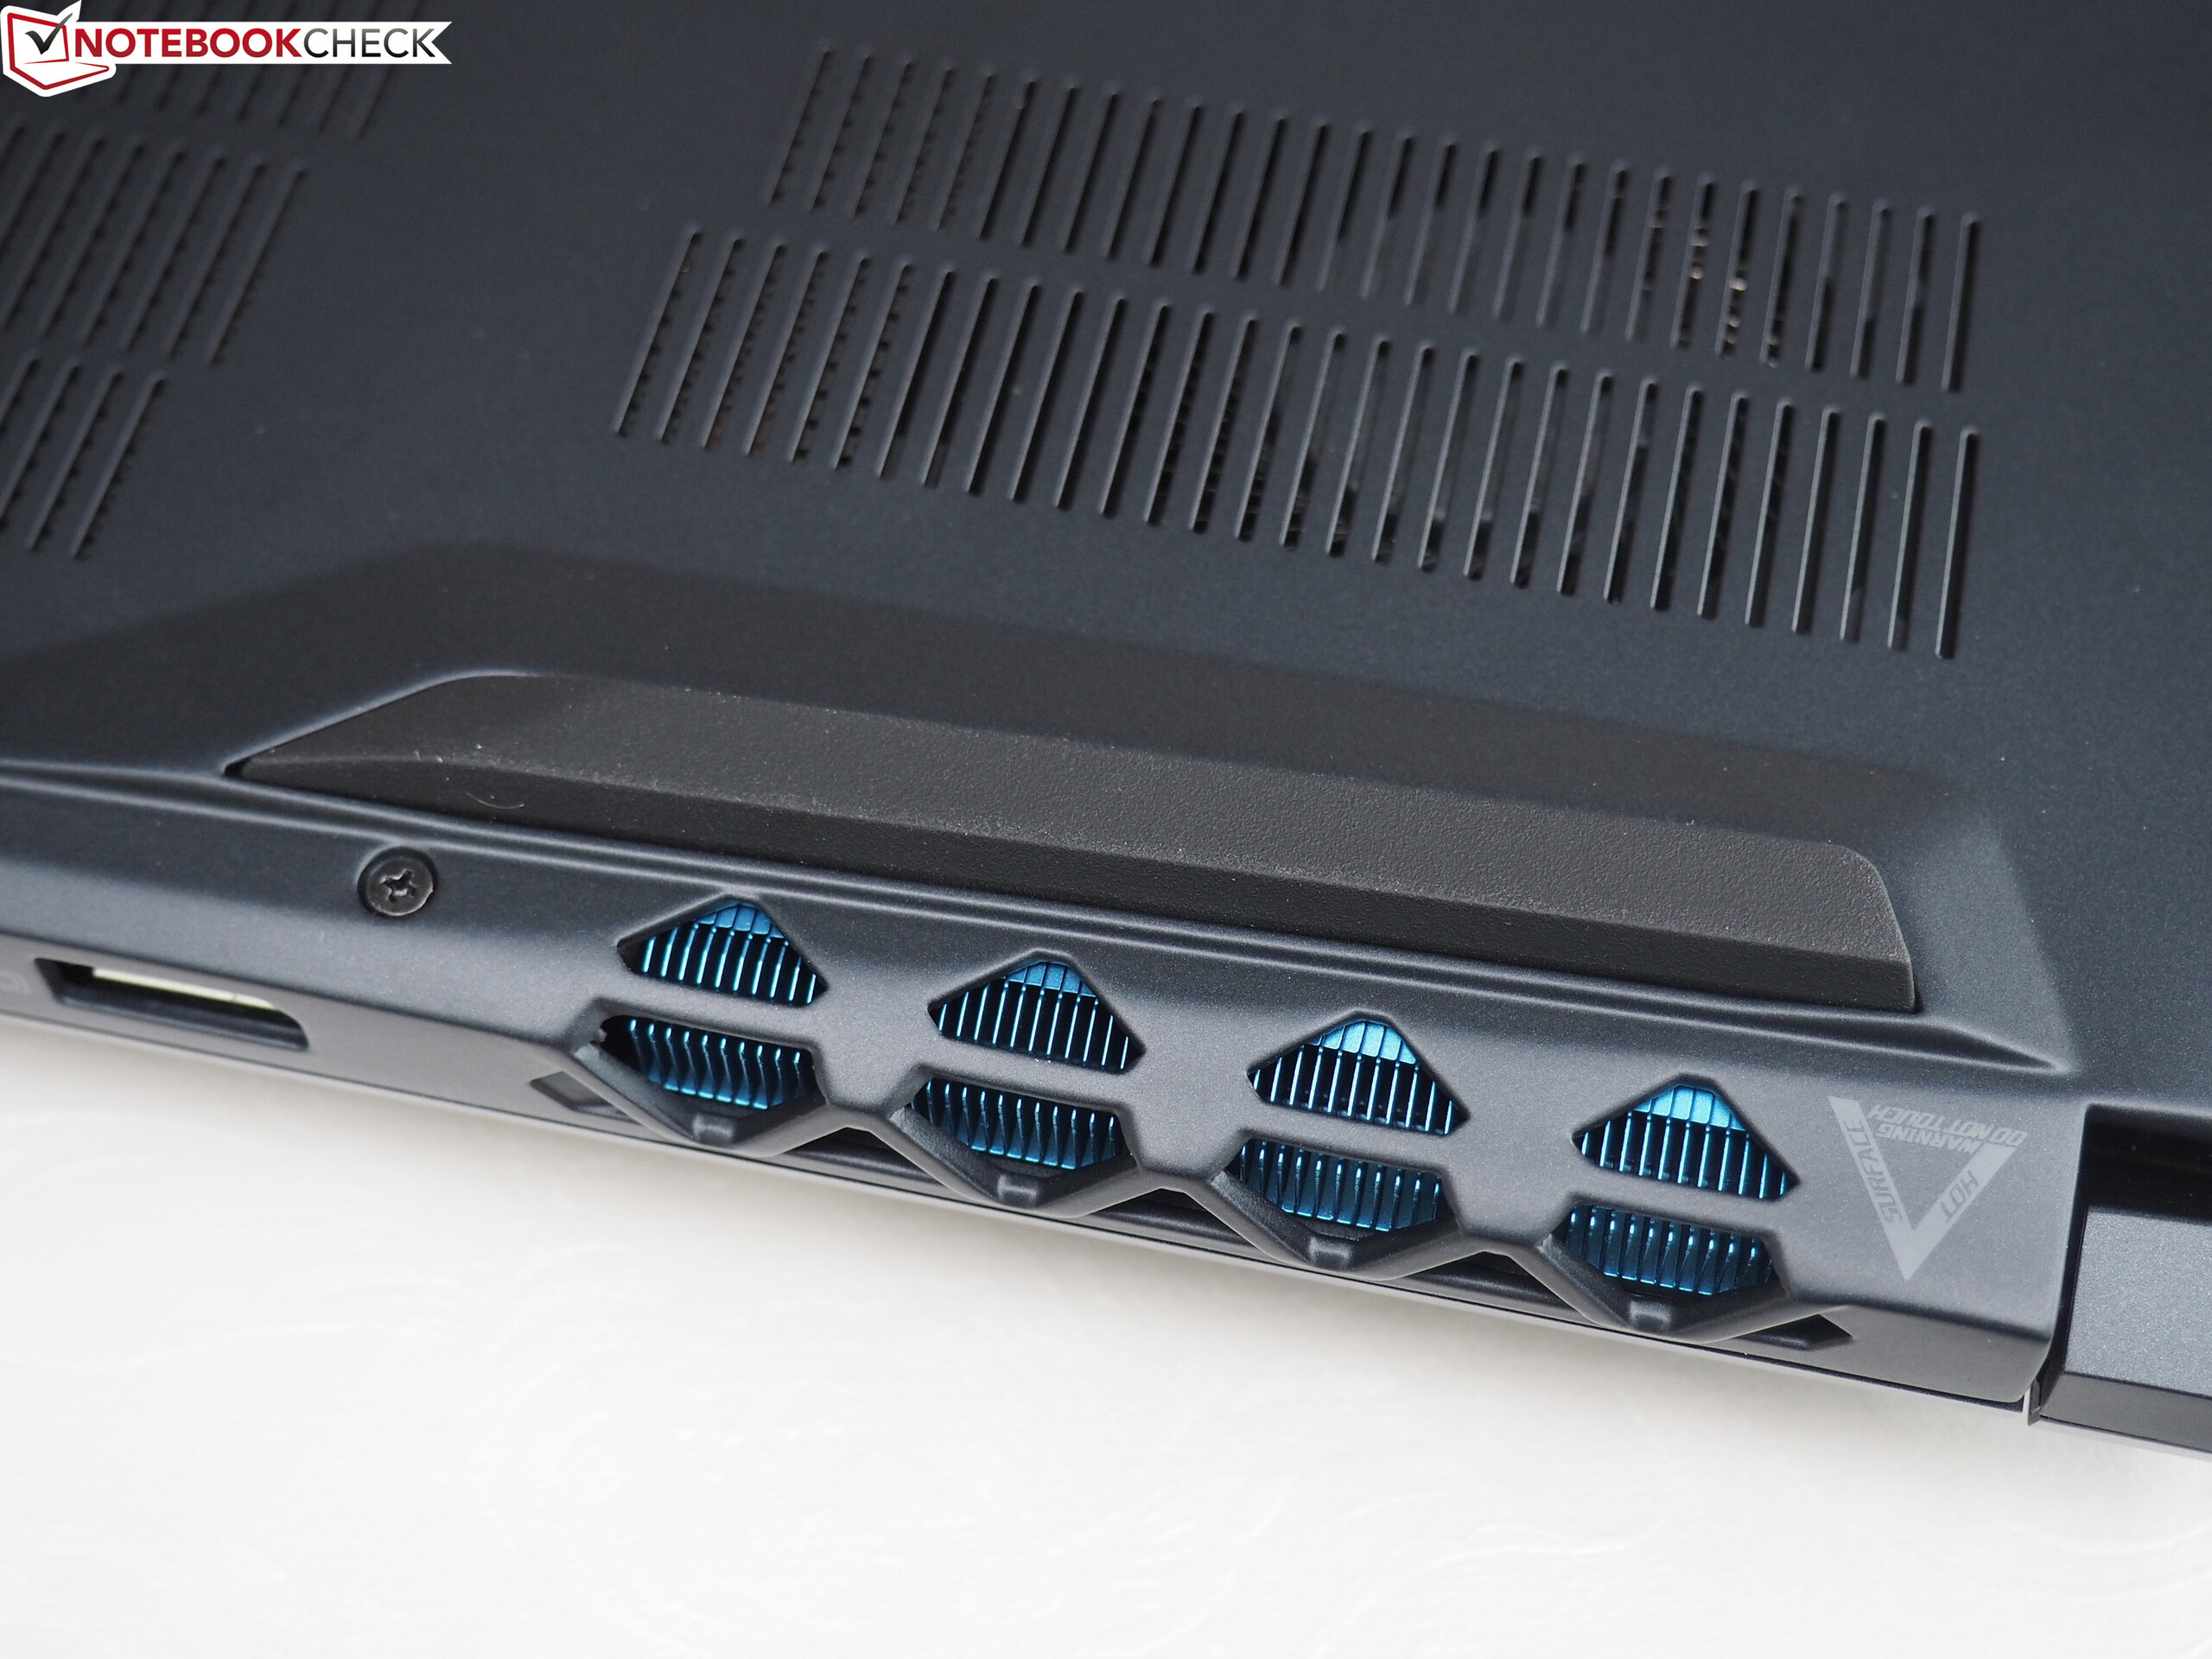
(-) A temperatura máxima no lado superior é 61 °C / 142 F, em comparação com a média de 40.4 °C / 105 F , variando de 21.2 a 68.8 °C para a classe Gaming.
(-) A parte inferior aquece até um máximo de 69 °C / 156 F, em comparação com a média de 43.2 °C / 110 F
(+) Em uso inativo, a temperatura média para o lado superior é 26.8 °C / 80 F, em comparação com a média do dispositivo de 33.9 °C / ### class_avg_f### F.
(-) Jogando The Witcher 3, a temperatura média para o lado superior é 45.7 °C / 114 F, em comparação com a média do dispositivo de 33.9 °C / ## #class_avg_f### F.
(-) Os apoios para as mãos e o touchpad podem ficar muito quentes ao toque, com um máximo de 40 °C / 104 F.
(-) A temperatura média da área do apoio para as mãos de dispositivos semelhantes foi 28.8 °C / 83.8 F (-11.2 °C / -20.2 F).
| Acer Predator Triton 700 GeForce GTX 1080 Max-Q, i7-7700HQ | Asus Zephyrus GX501 GeForce GTX 1080 Max-Q, i7-7700HQ | Eurocom Q5 GeForce GTX 1070 Max-Q, i7-7700HQ | Aorus X5 v7 GeForce GTX 1070 Mobile, i7-7820HK | MSI GS63VR 7RF-228US GeForce GTX 1060 Mobile, i7-7700HQ | |
|---|---|---|---|---|---|
| Heat | 6% | 8% | 5% | 5% | |
| Maximum Upper Side * (°C) | 61 | 57 7% | 56.2 8% | 64 -5% | |
| Maximum Bottom * (°C) | 69 | 54 22% | 61.2 11% | 56 19% | |
| Idle Upper Side * (°C) | 29 | 32 -10% | 27.8 4% | 29 -0% | 28.4 2% |
| Idle Bottom * (°C) | 32 | 31 3% | 29.6 7% | 30 6% | 29.6 7% |
* ... menor é melhor
Acer Predator Triton 700 análise de áudio
(+) | os alto-falantes podem tocar relativamente alto (###valor### dB)
Graves 100 - 315Hz
(-) | quase nenhum baixo - em média 15.2% menor que a mediana
(±) | a linearidade dos graves é média (10.1% delta para a frequência anterior)
Médios 400 - 2.000 Hz
(±) | médios mais altos - em média 8% maior que a mediana
(+) | médios são lineares (6.7% delta para frequência anterior)
Altos 2 - 16 kHz
(+) | agudos equilibrados - apenas 2% longe da mediana
(+) | os máximos são lineares (4.9% delta da frequência anterior)
Geral 100 - 16.000 Hz
(±) | a linearidade do som geral é média (19.9% diferença em relação à mediana)
Comparado com a mesma classe
» 70% de todos os dispositivos testados nesta classe foram melhores, 6% semelhantes, 24% piores
» O melhor teve um delta de 6%, a média foi 18%, o pior foi 132%
Comparado com todos os dispositivos testados
» 51% de todos os dispositivos testados foram melhores, 7% semelhantes, 42% piores
» O melhor teve um delta de 4%, a média foi 23%, o pior foi 134%
Asus Zephyrus GX501 análise de áudio
(+) | os alto-falantes podem tocar relativamente alto (###valor### dB)
Graves 100 - 315Hz
(-) | quase nenhum baixo - em média 23.2% menor que a mediana
(±) | a linearidade dos graves é média (12.5% delta para a frequência anterior)
Médios 400 - 2.000 Hz
(+) | médios equilibrados - apenas 2.4% longe da mediana
(+) | médios são lineares (4.8% delta para frequência anterior)
Altos 2 - 16 kHz
(+) | agudos equilibrados - apenas 2.2% longe da mediana
(+) | os máximos são lineares (2% delta da frequência anterior)
Geral 100 - 16.000 Hz
(±) | a linearidade do som geral é média (16.8% diferença em relação à mediana)
Comparado com a mesma classe
» 44% de todos os dispositivos testados nesta classe foram melhores, 11% semelhantes, 45% piores
» O melhor teve um delta de 6%, a média foi 18%, o pior foi 132%
Comparado com todos os dispositivos testados
» 30% de todos os dispositivos testados foram melhores, 7% semelhantes, 63% piores
» O melhor teve um delta de 4%, a média foi 23%, o pior foi 134%
| desligado | |
| Ocioso | |
| Carga |
|
Key:
min: | |
| Acer Predator Triton 700 GeForce GTX 1080 Max-Q, i7-7700HQ | Asus Zephyrus GX501 GeForce GTX 1080 Max-Q, i7-7700HQ | Eurocom Q5 GeForce GTX 1070 Max-Q, i7-7700HQ | Aorus X5 v7 GeForce GTX 1070 Mobile, i7-7820HK | MSI GS63VR 7RF-228US GeForce GTX 1060 Mobile, i7-7700HQ | |
|---|---|---|---|---|---|
| Power Consumption | 21% | 42% | 1% | 35% | |
| Idle Minimum * (Watt) | 28 | 18 36% | 9 68% | 26 7% | 14.5 48% |
| Idle Average * (Watt) | 33 | 23 30% | 13.5 59% | 31 6% | 17.3 48% |
| Idle Maximum * (Watt) | 41 | 31 24% | 13.7 67% | 36 12% | 17.4 58% |
| Load Average * (Watt) | 94 | 79 16% | 87.8 7% | 93 1% | 93 1% |
| Witcher 3 ultra * (Watt) | 160 | 148 7% | 129 19% | 176 -10% | 128.8 19% |
| Load Maximum * (Watt) | 222 | 196 12% | 158.6 29% | 240 -8% |
* ... menor é melhor
| Acer Predator Triton 700 GeForce GTX 1080 Max-Q, i7-7700HQ, 54 Wh | Asus Zephyrus GX501 GeForce GTX 1080 Max-Q, i7-7700HQ, 50 Wh | Eurocom Q5 GeForce GTX 1070 Max-Q, i7-7700HQ, 55 Wh | Aorus X5 v7 GeForce GTX 1070 Mobile, i7-7820HK, 94 Wh | MSI GS63VR 7RF-228US GeForce GTX 1060 Mobile, i7-7700HQ, 65 Wh | |
|---|---|---|---|---|---|
| Duração da bateria | -1% | 86% | 28% | 76% | |
| Reader / Idle (h) | 2.5 | 3.1 24% | 7.8 212% | 3.5 40% | 6.4 156% |
| H.264 (h) | 1.8 | 2.2 22% | 2.7 50% | ||
| WiFi v1.3 (h) | 2.4 | 2.2 -8% | 4.3 79% | 2.5 4% | 3.9 63% |
| Load (h) | 1.2 | 0.7 -42% | 0.8 -33% | 1.4 17% | 1.3 8% |
Pro
Contra
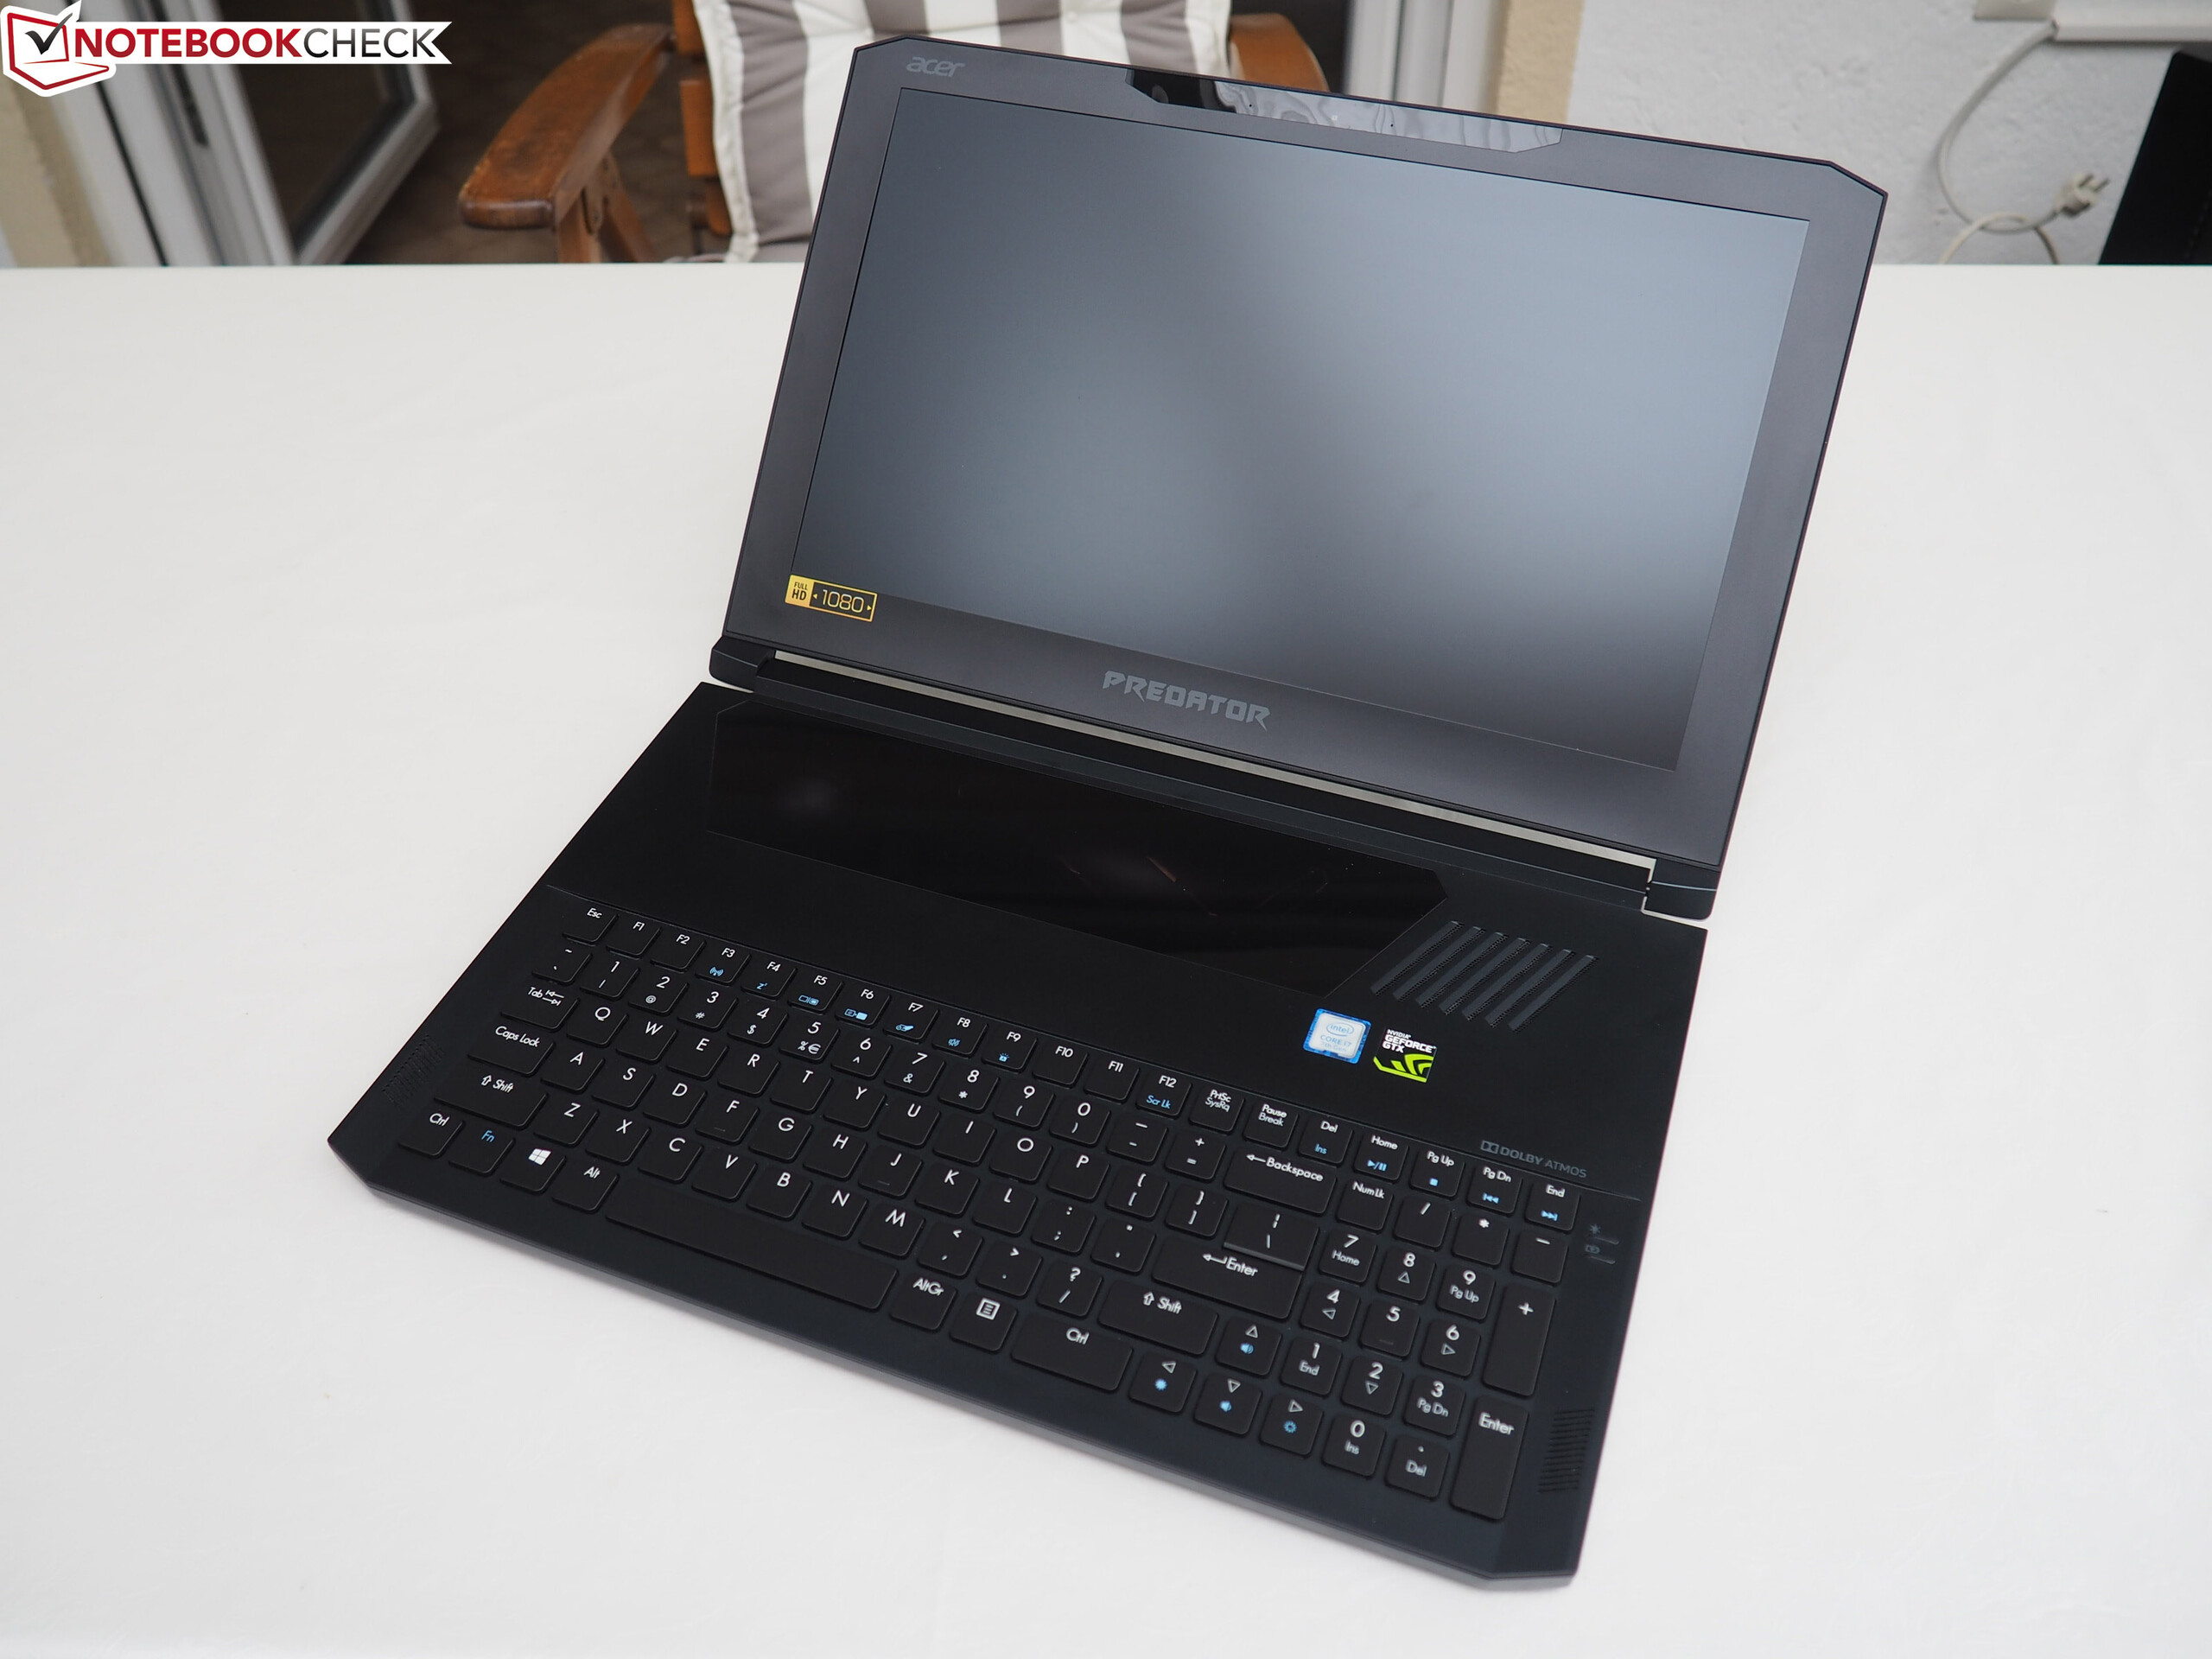
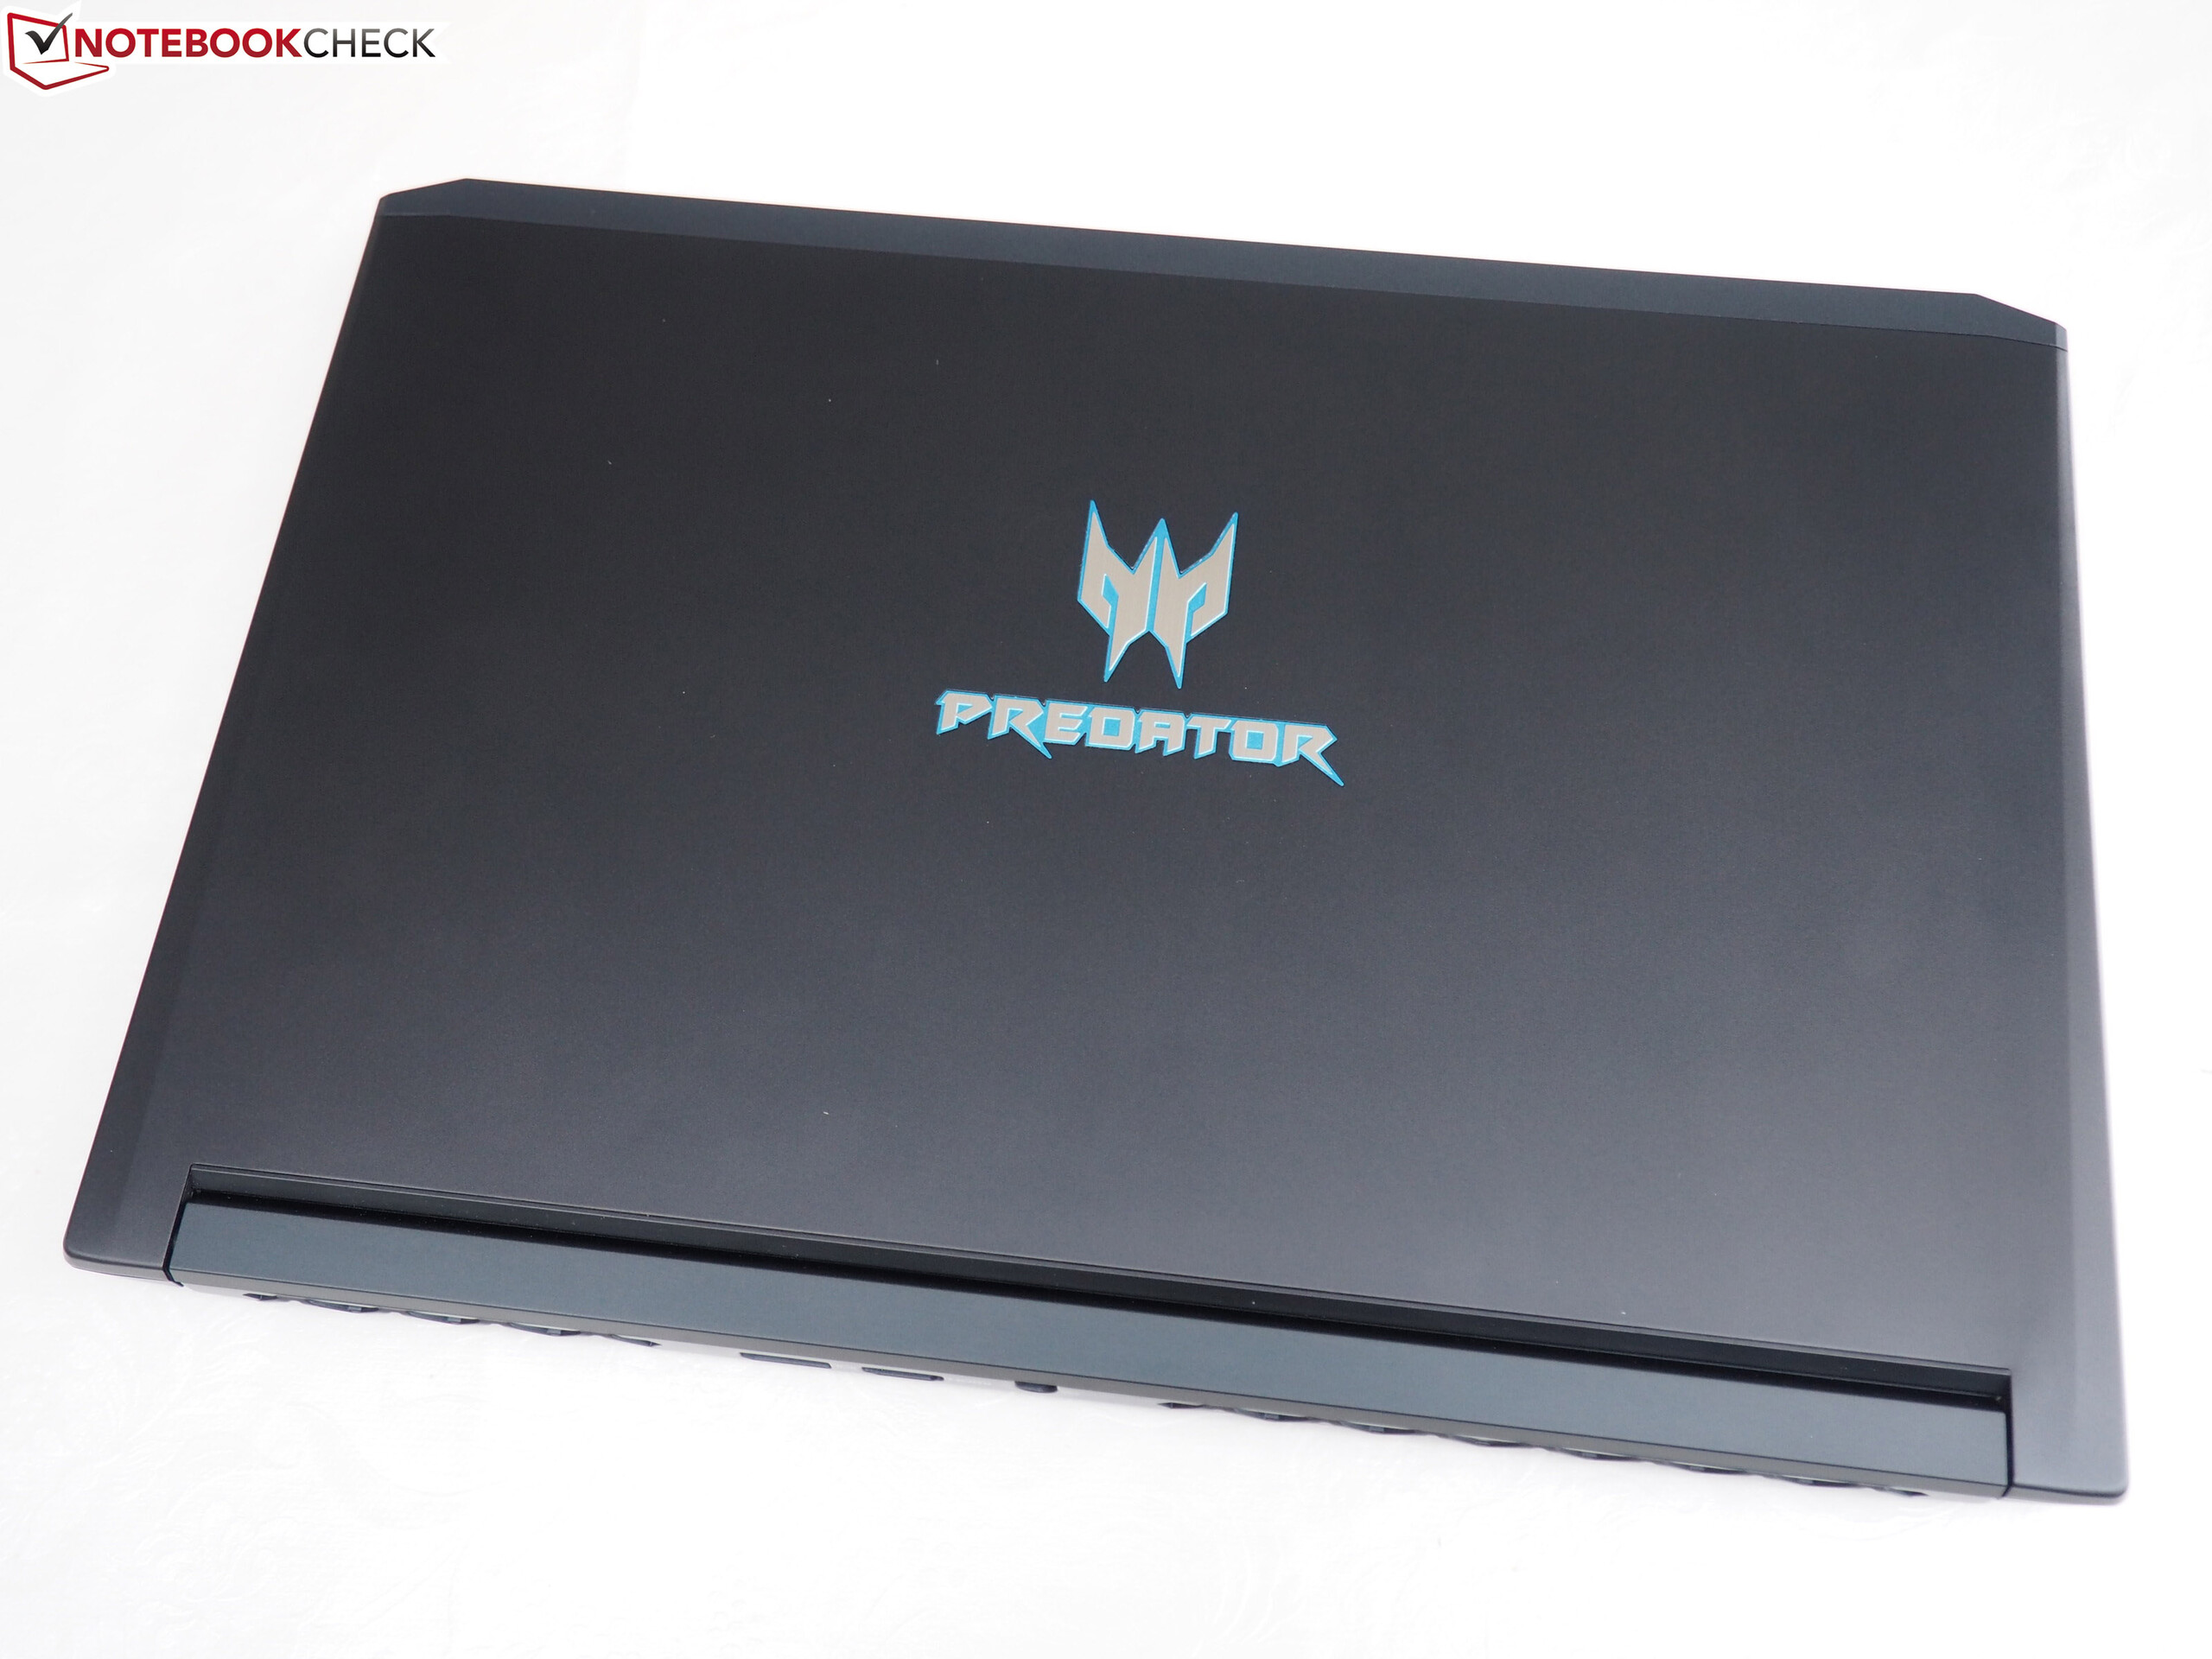
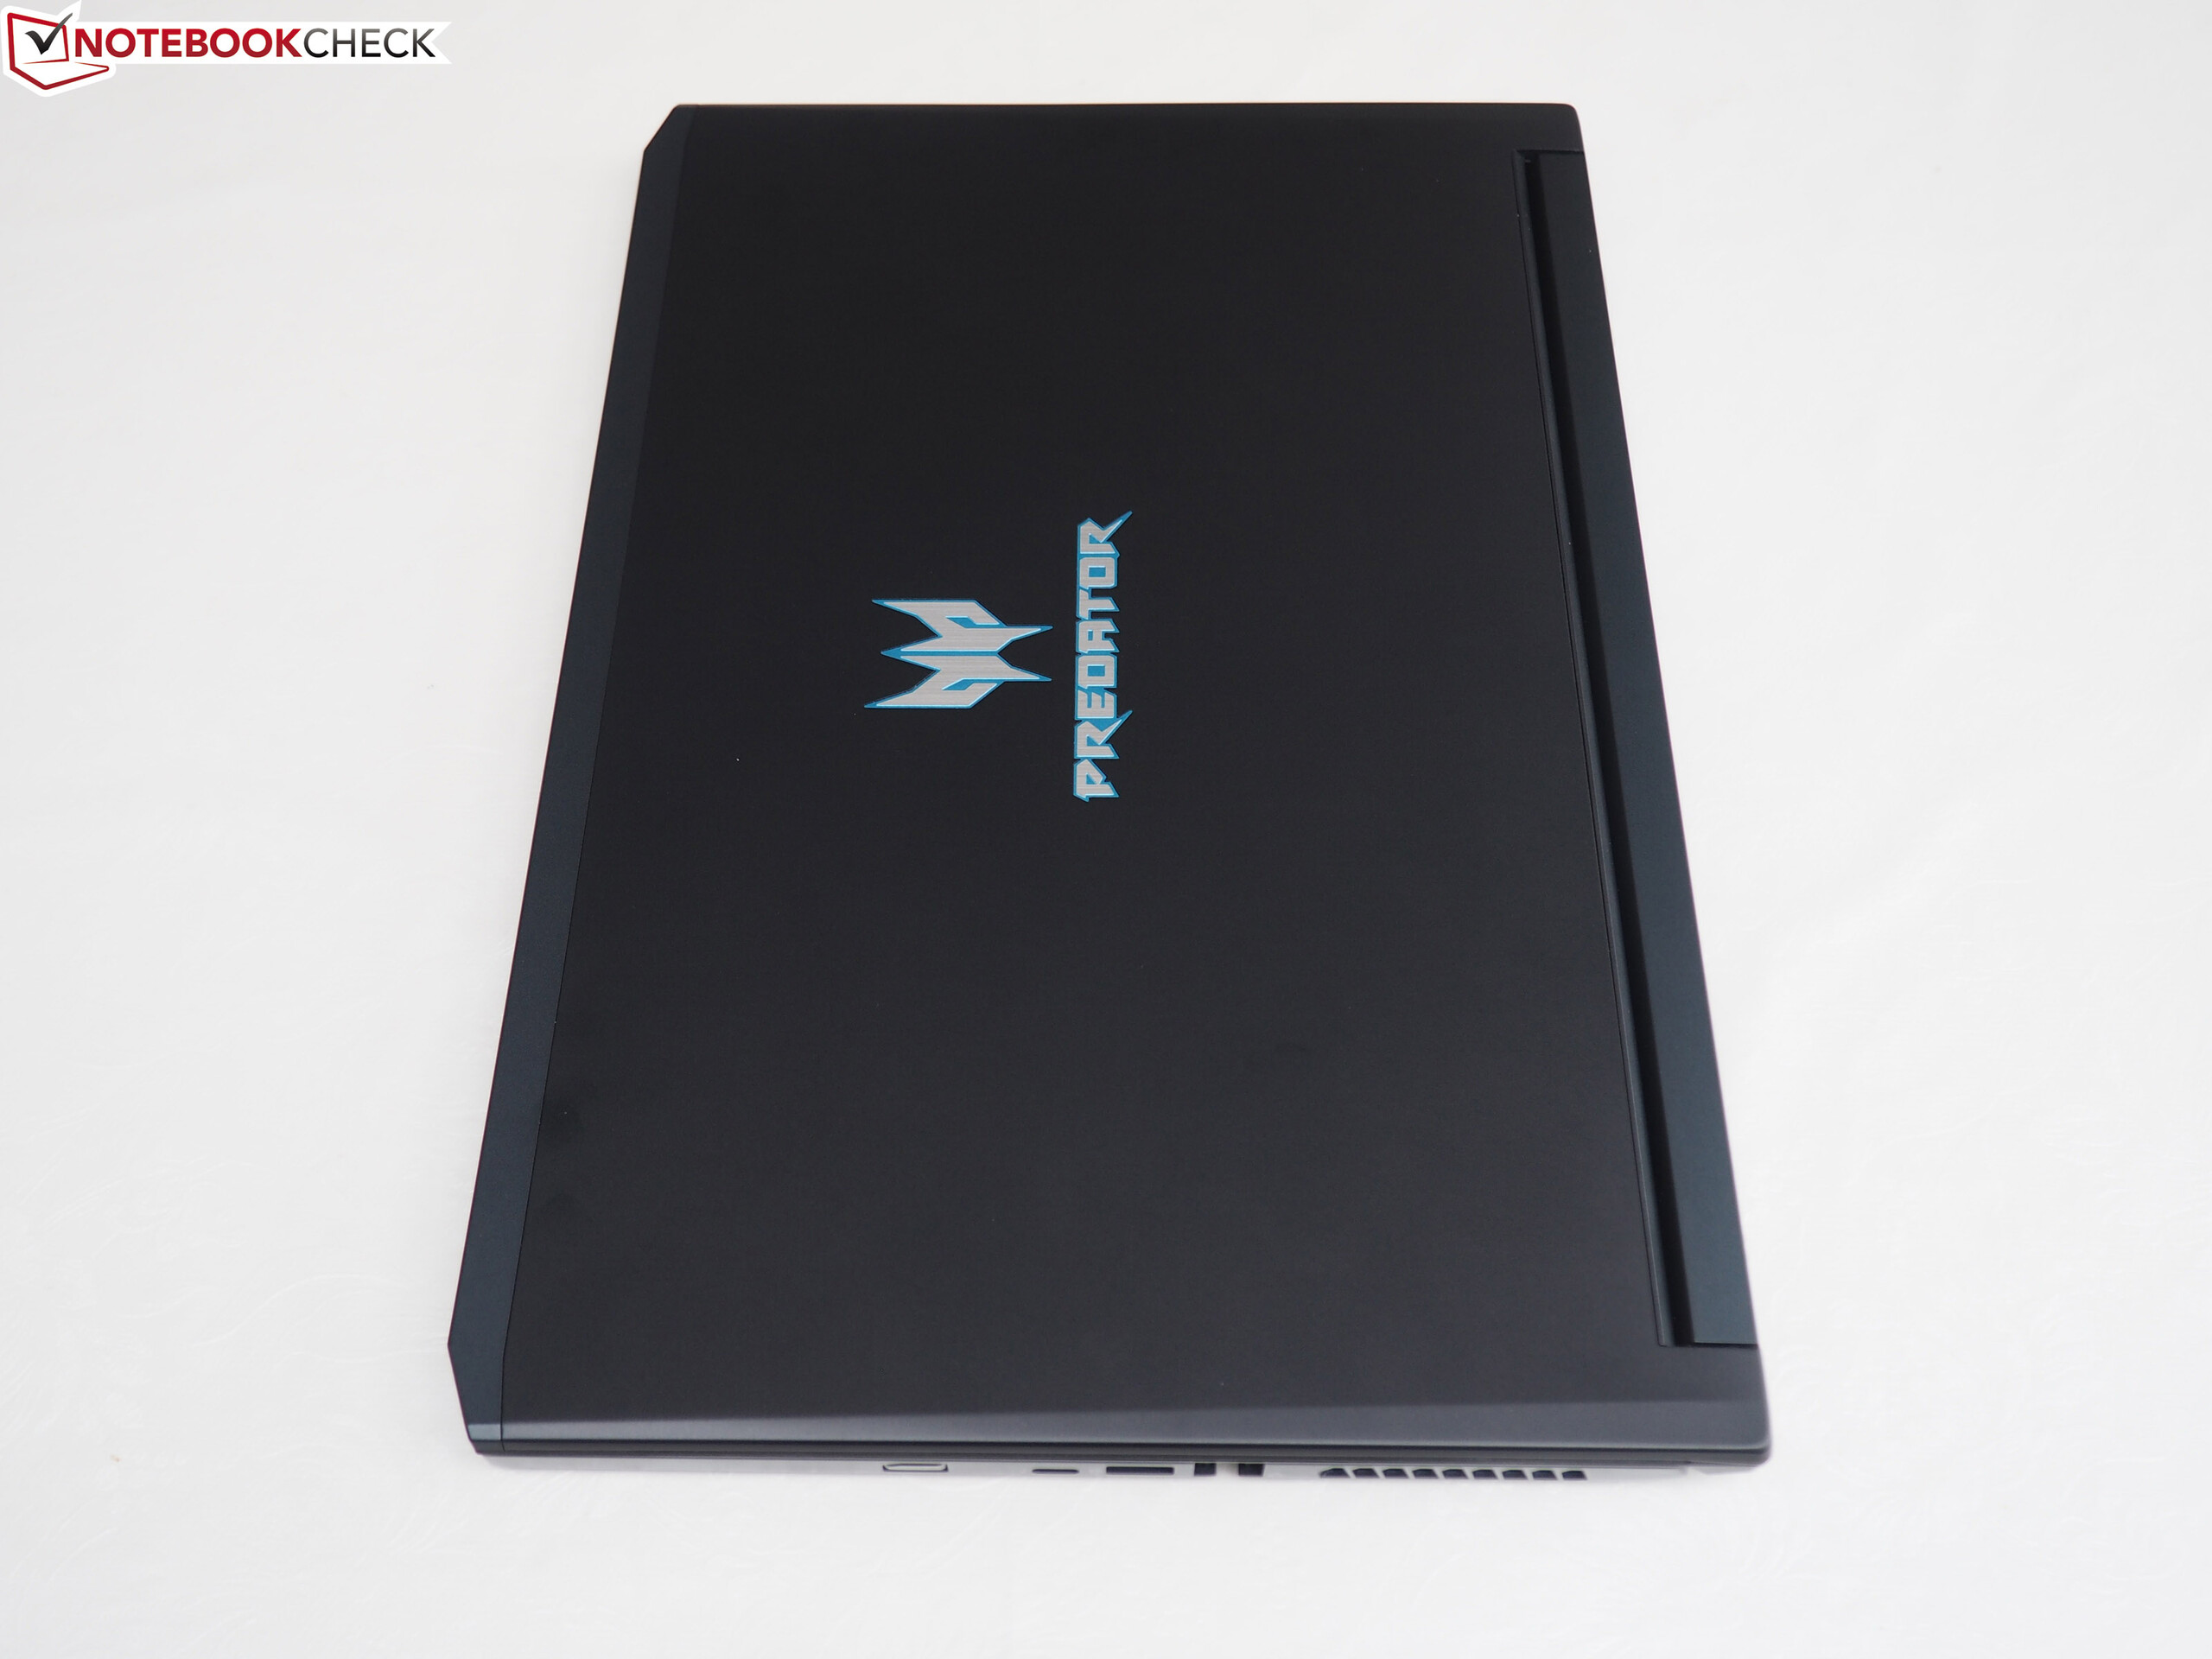
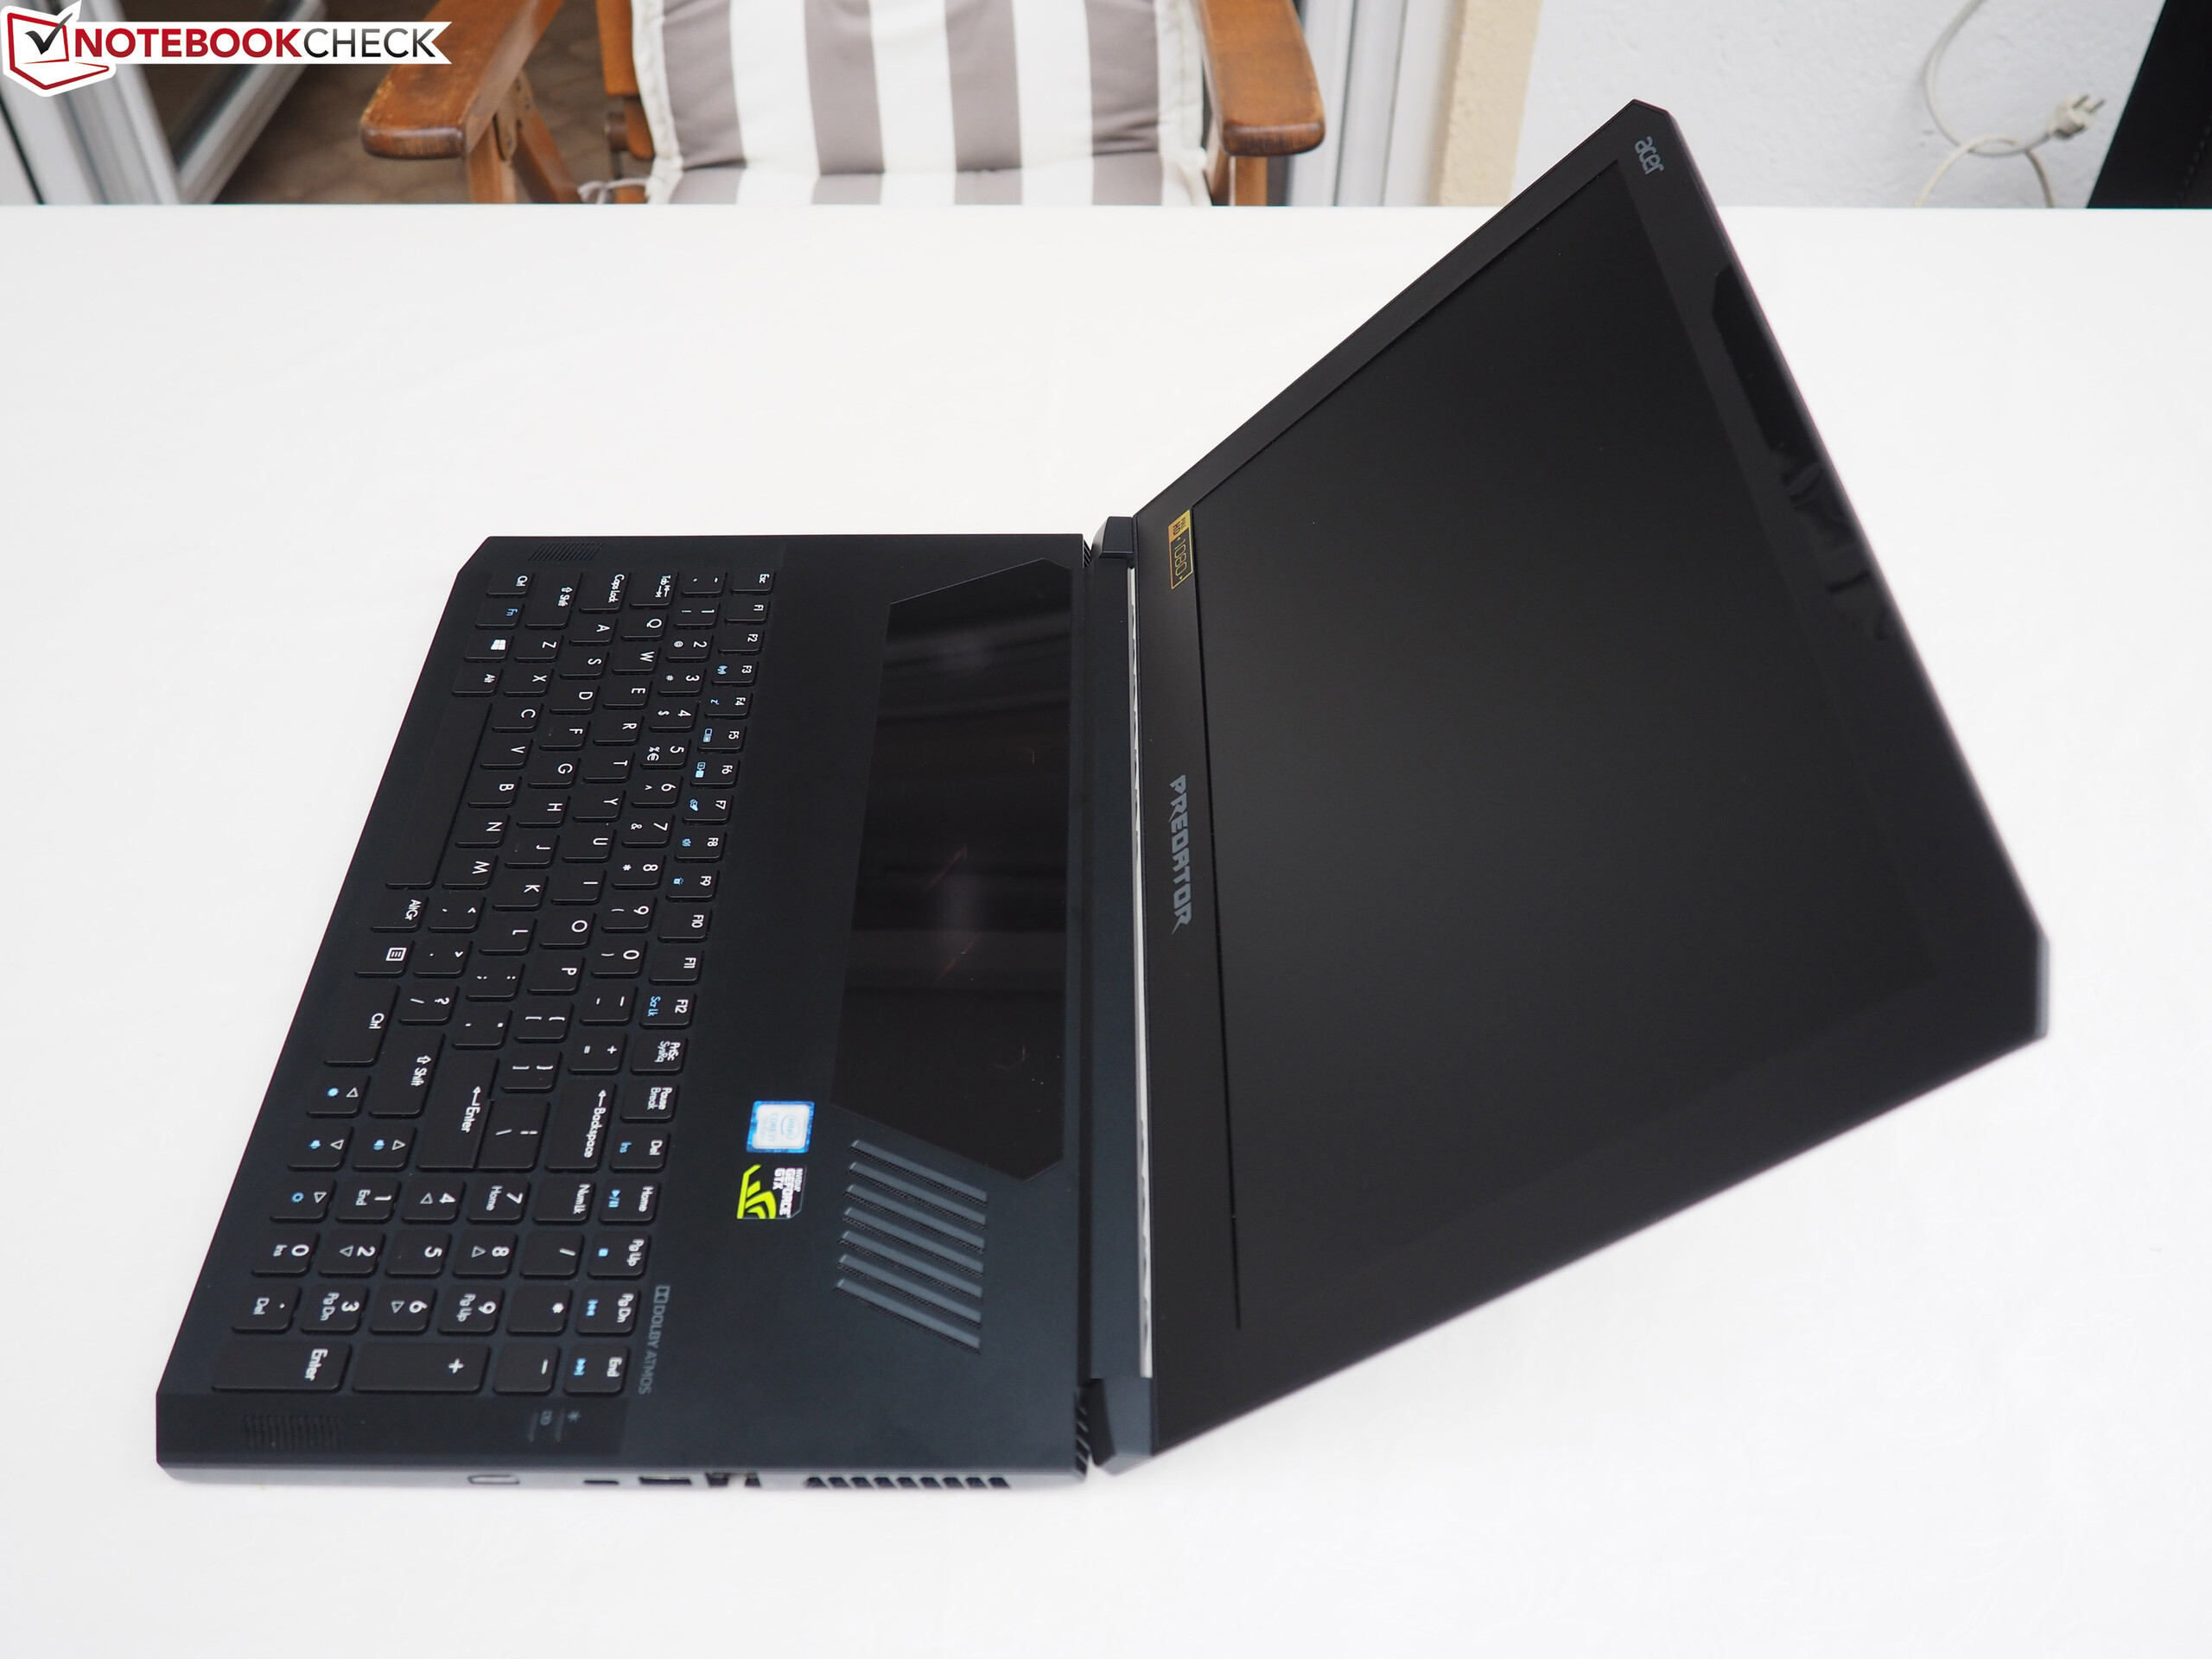
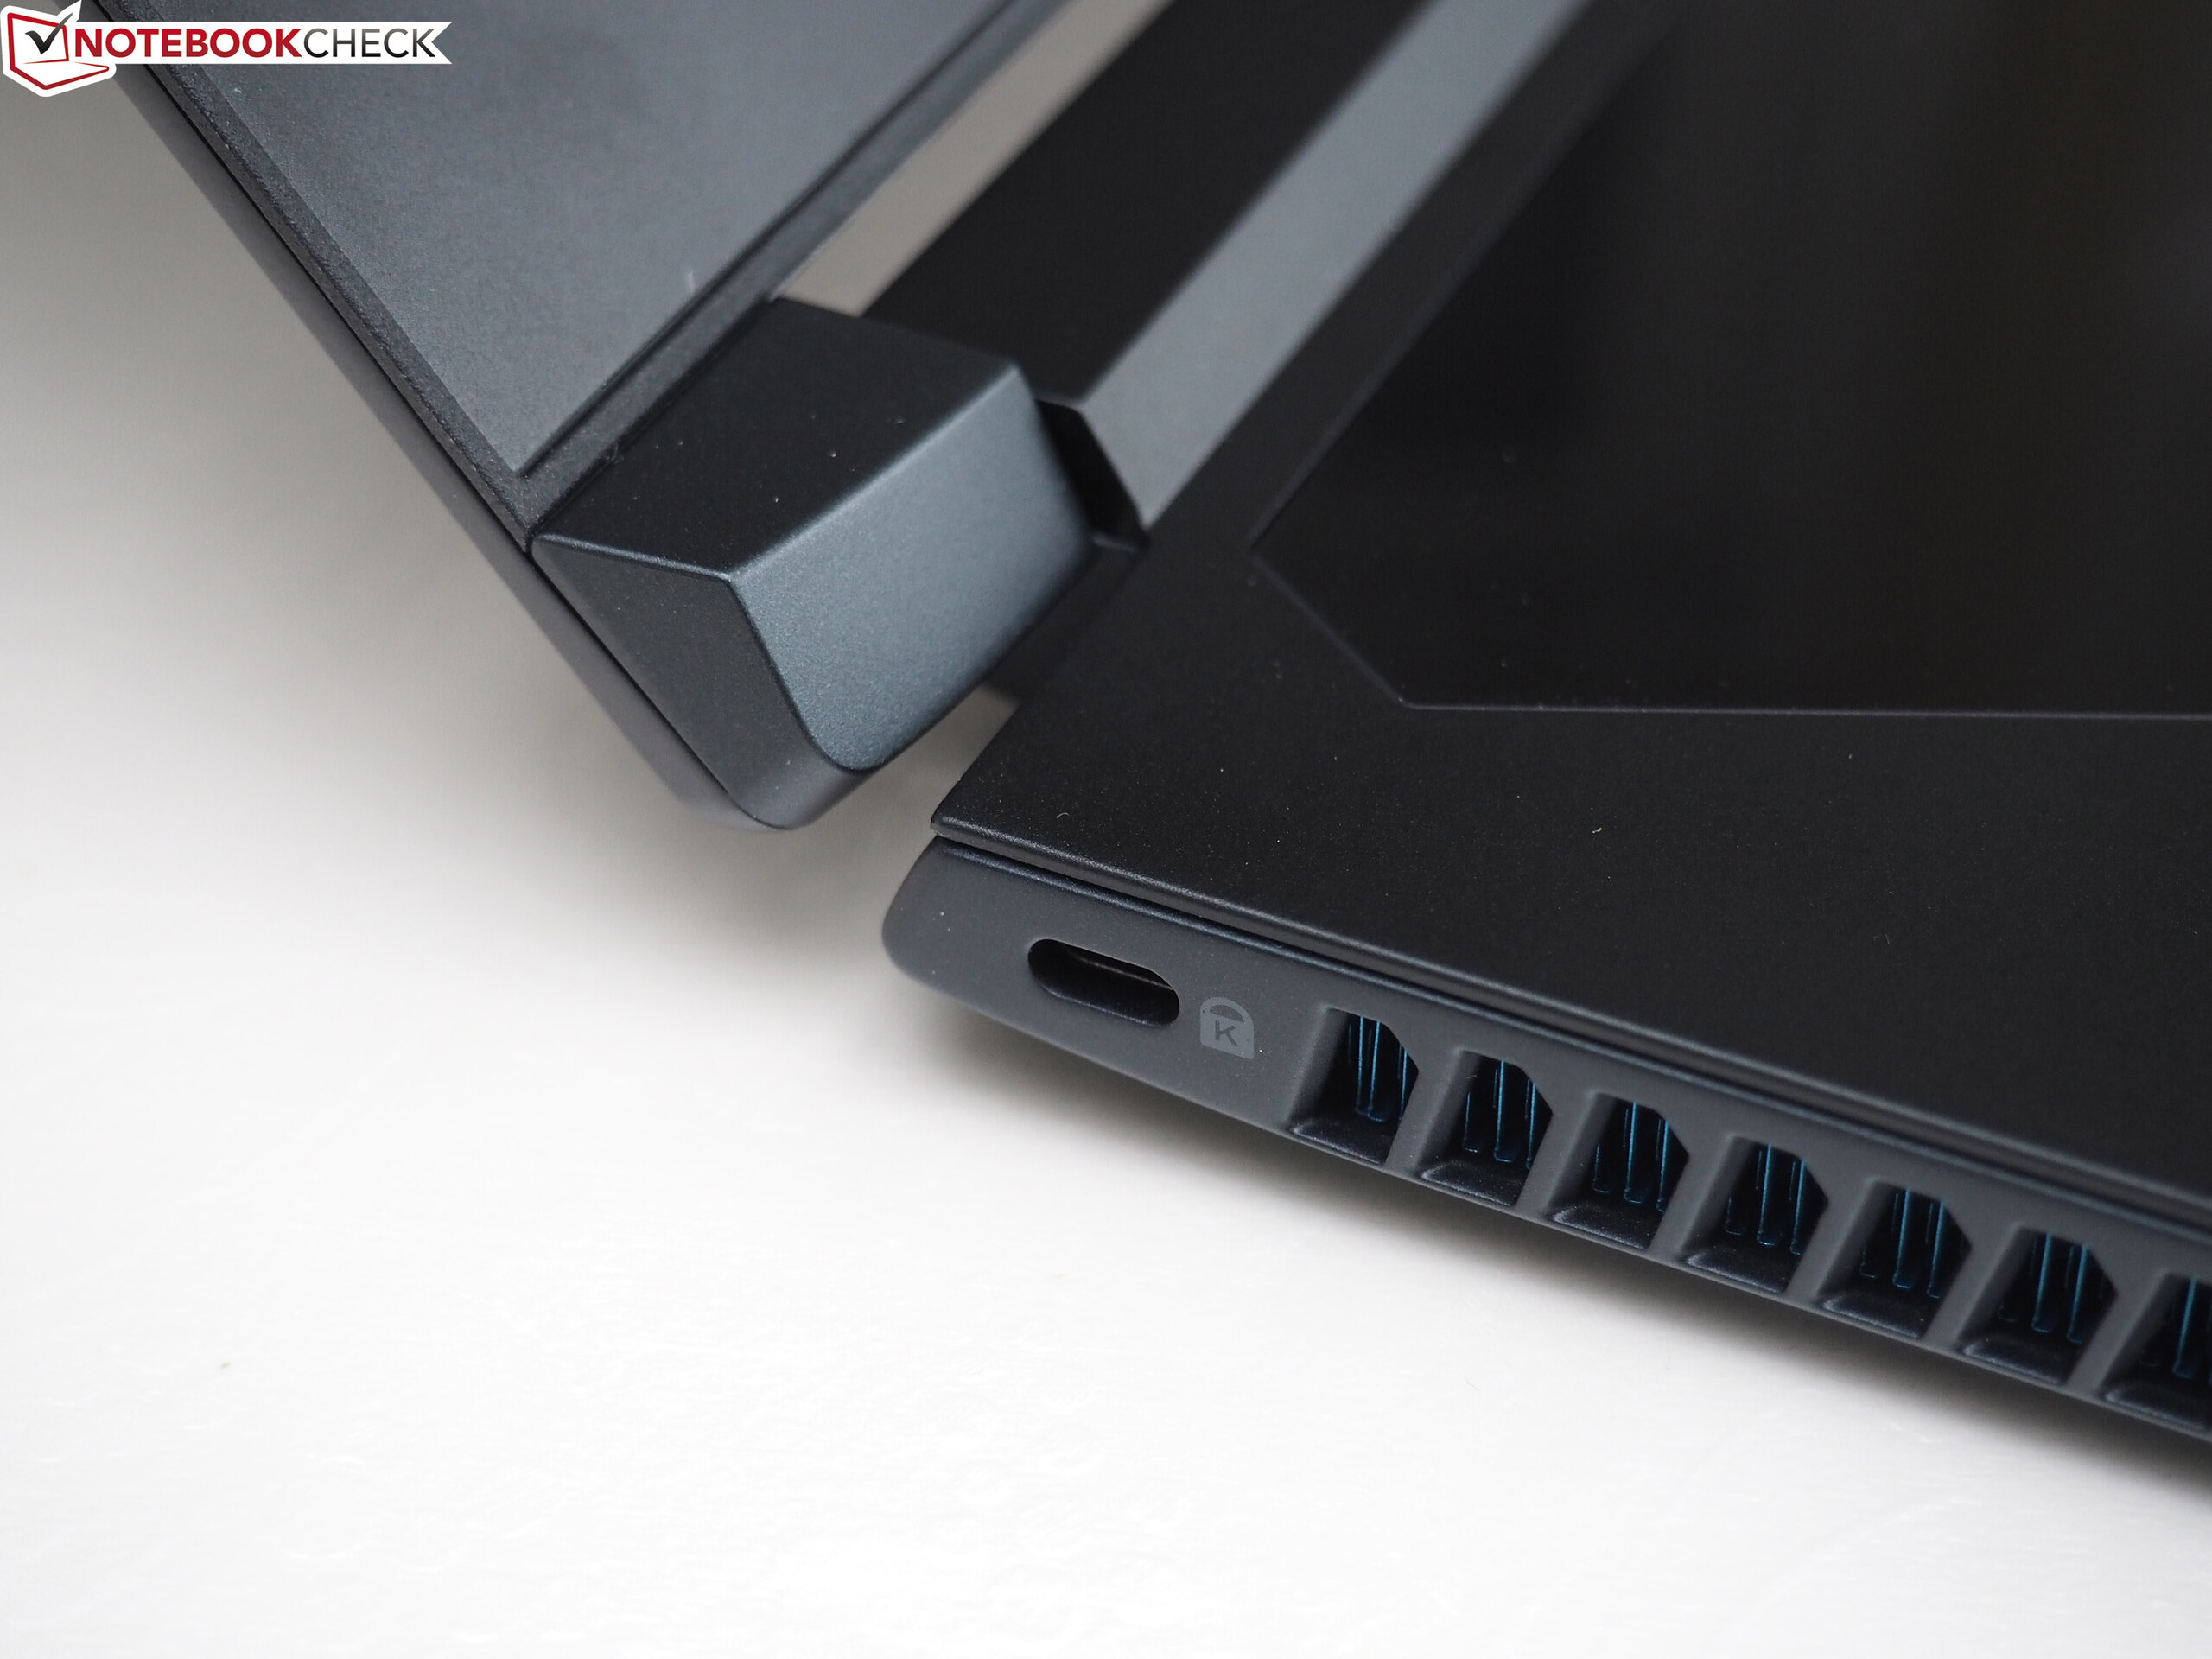
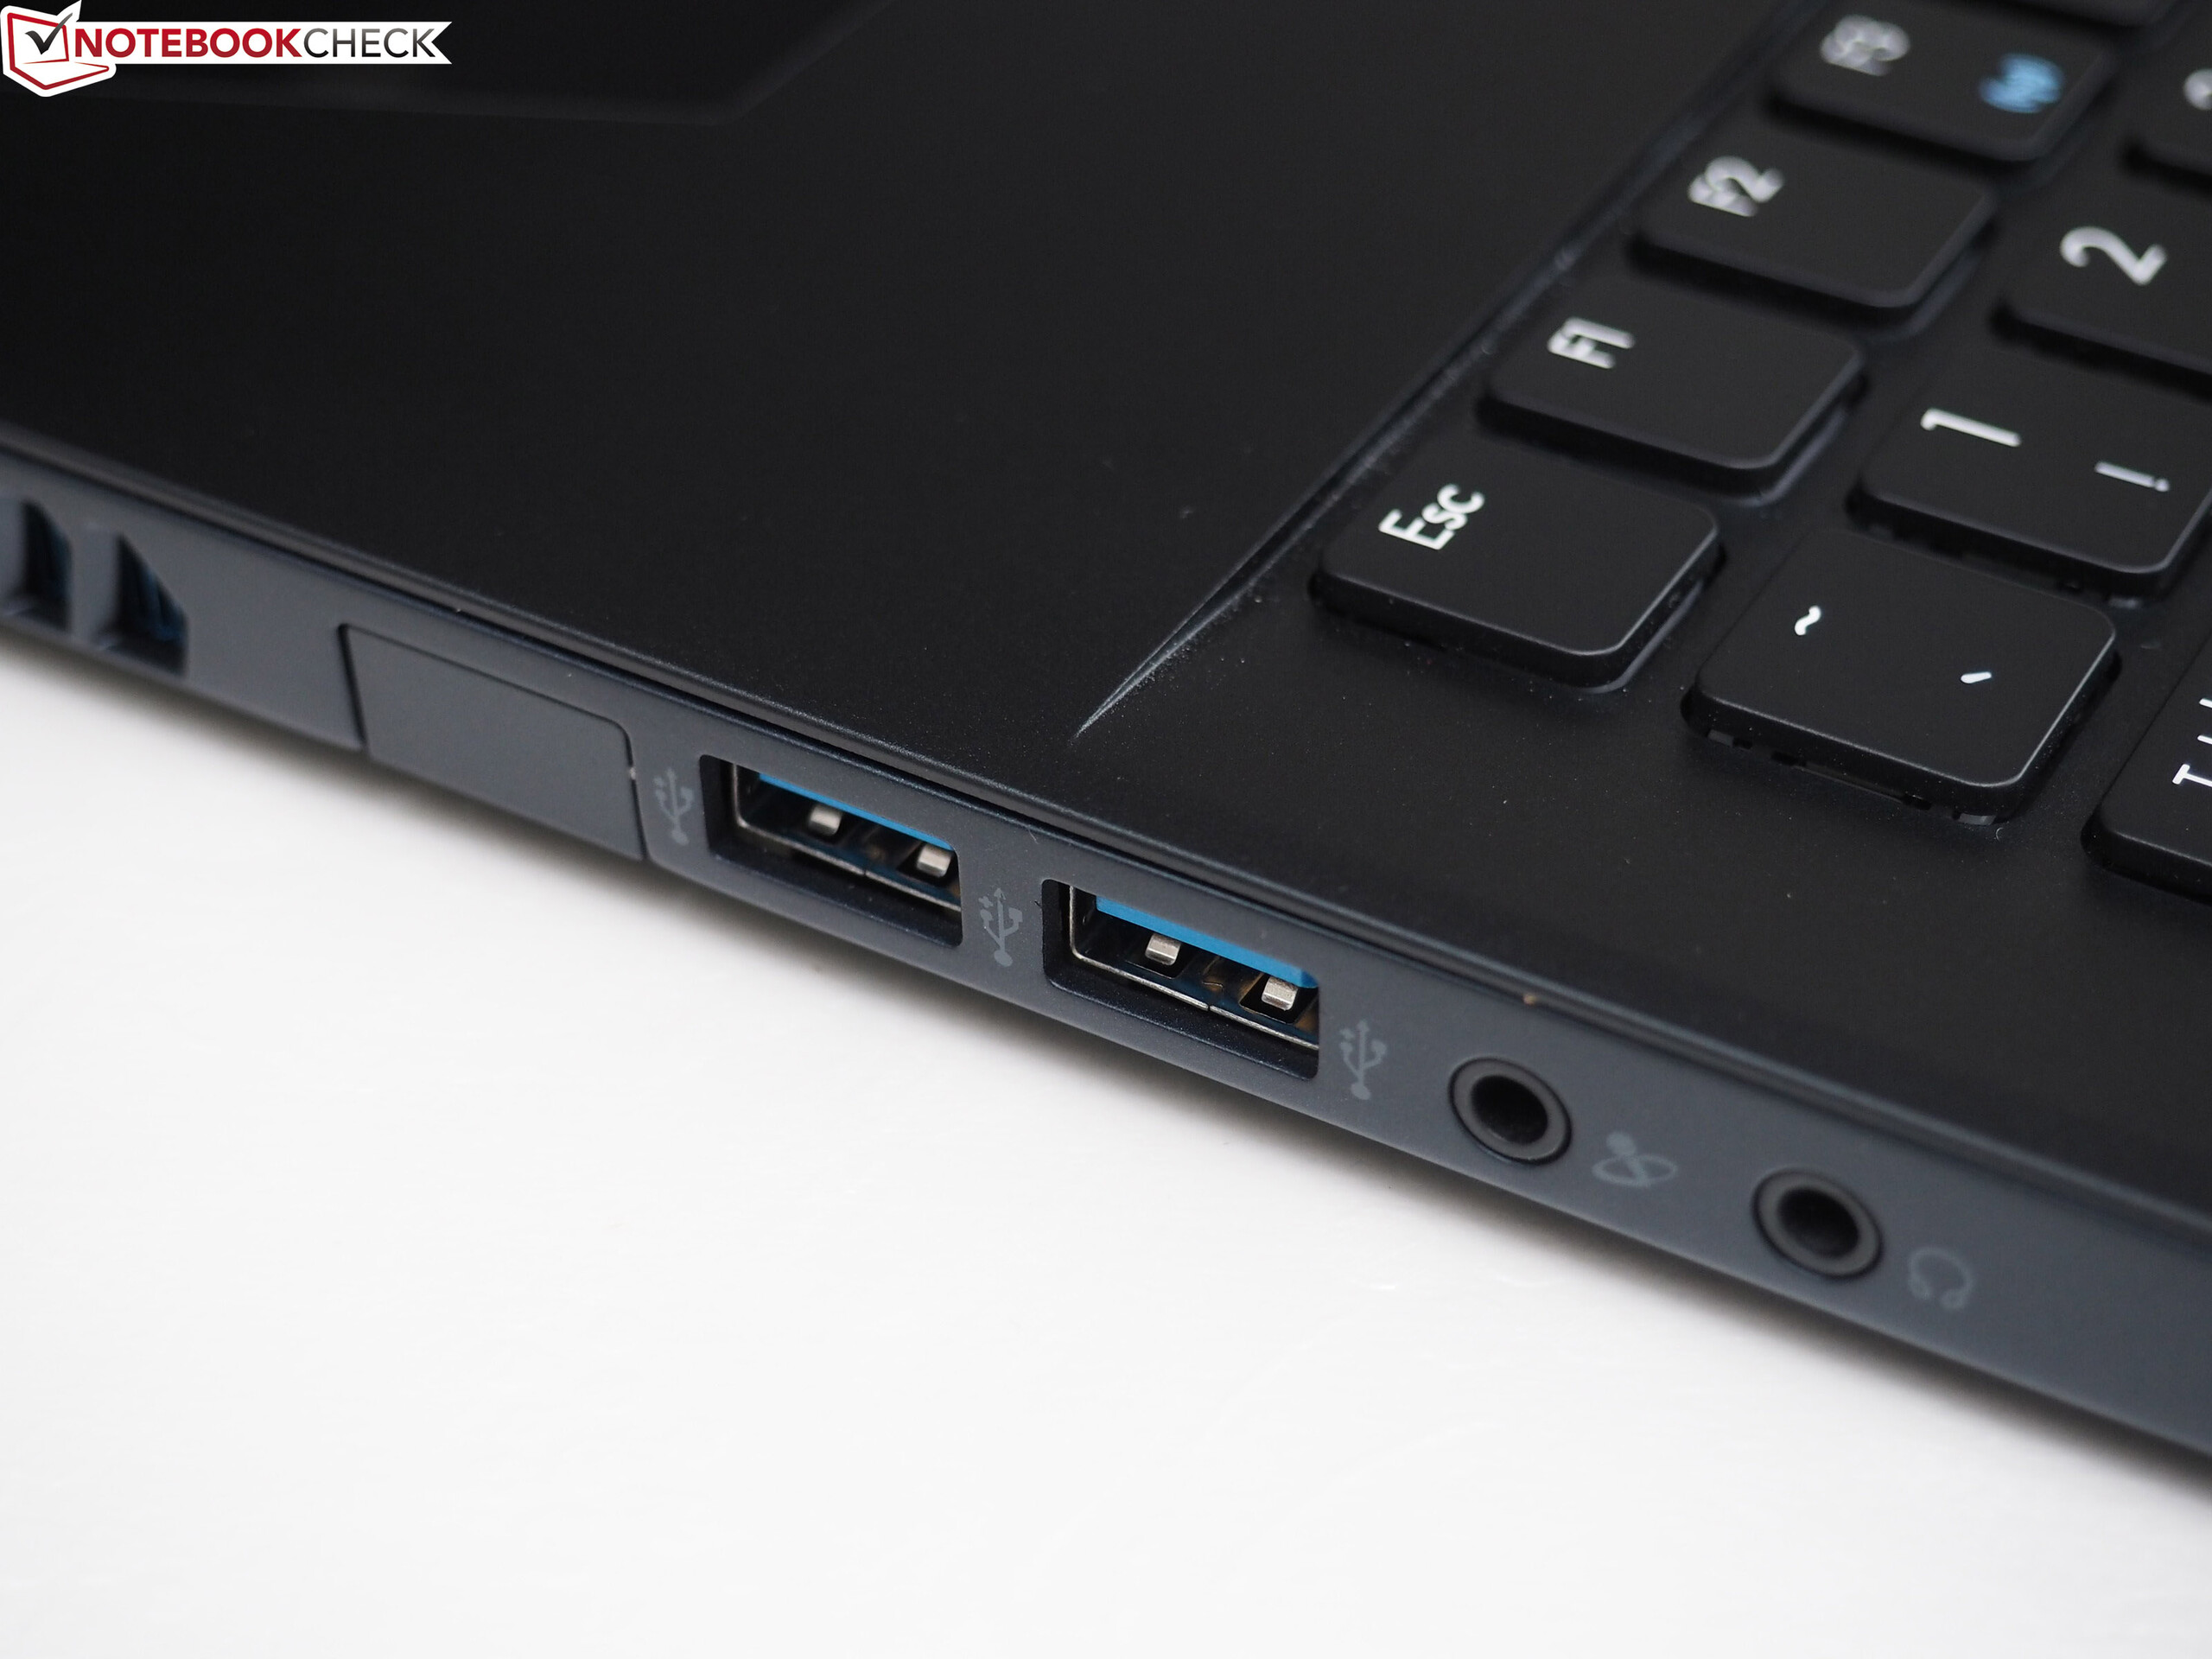
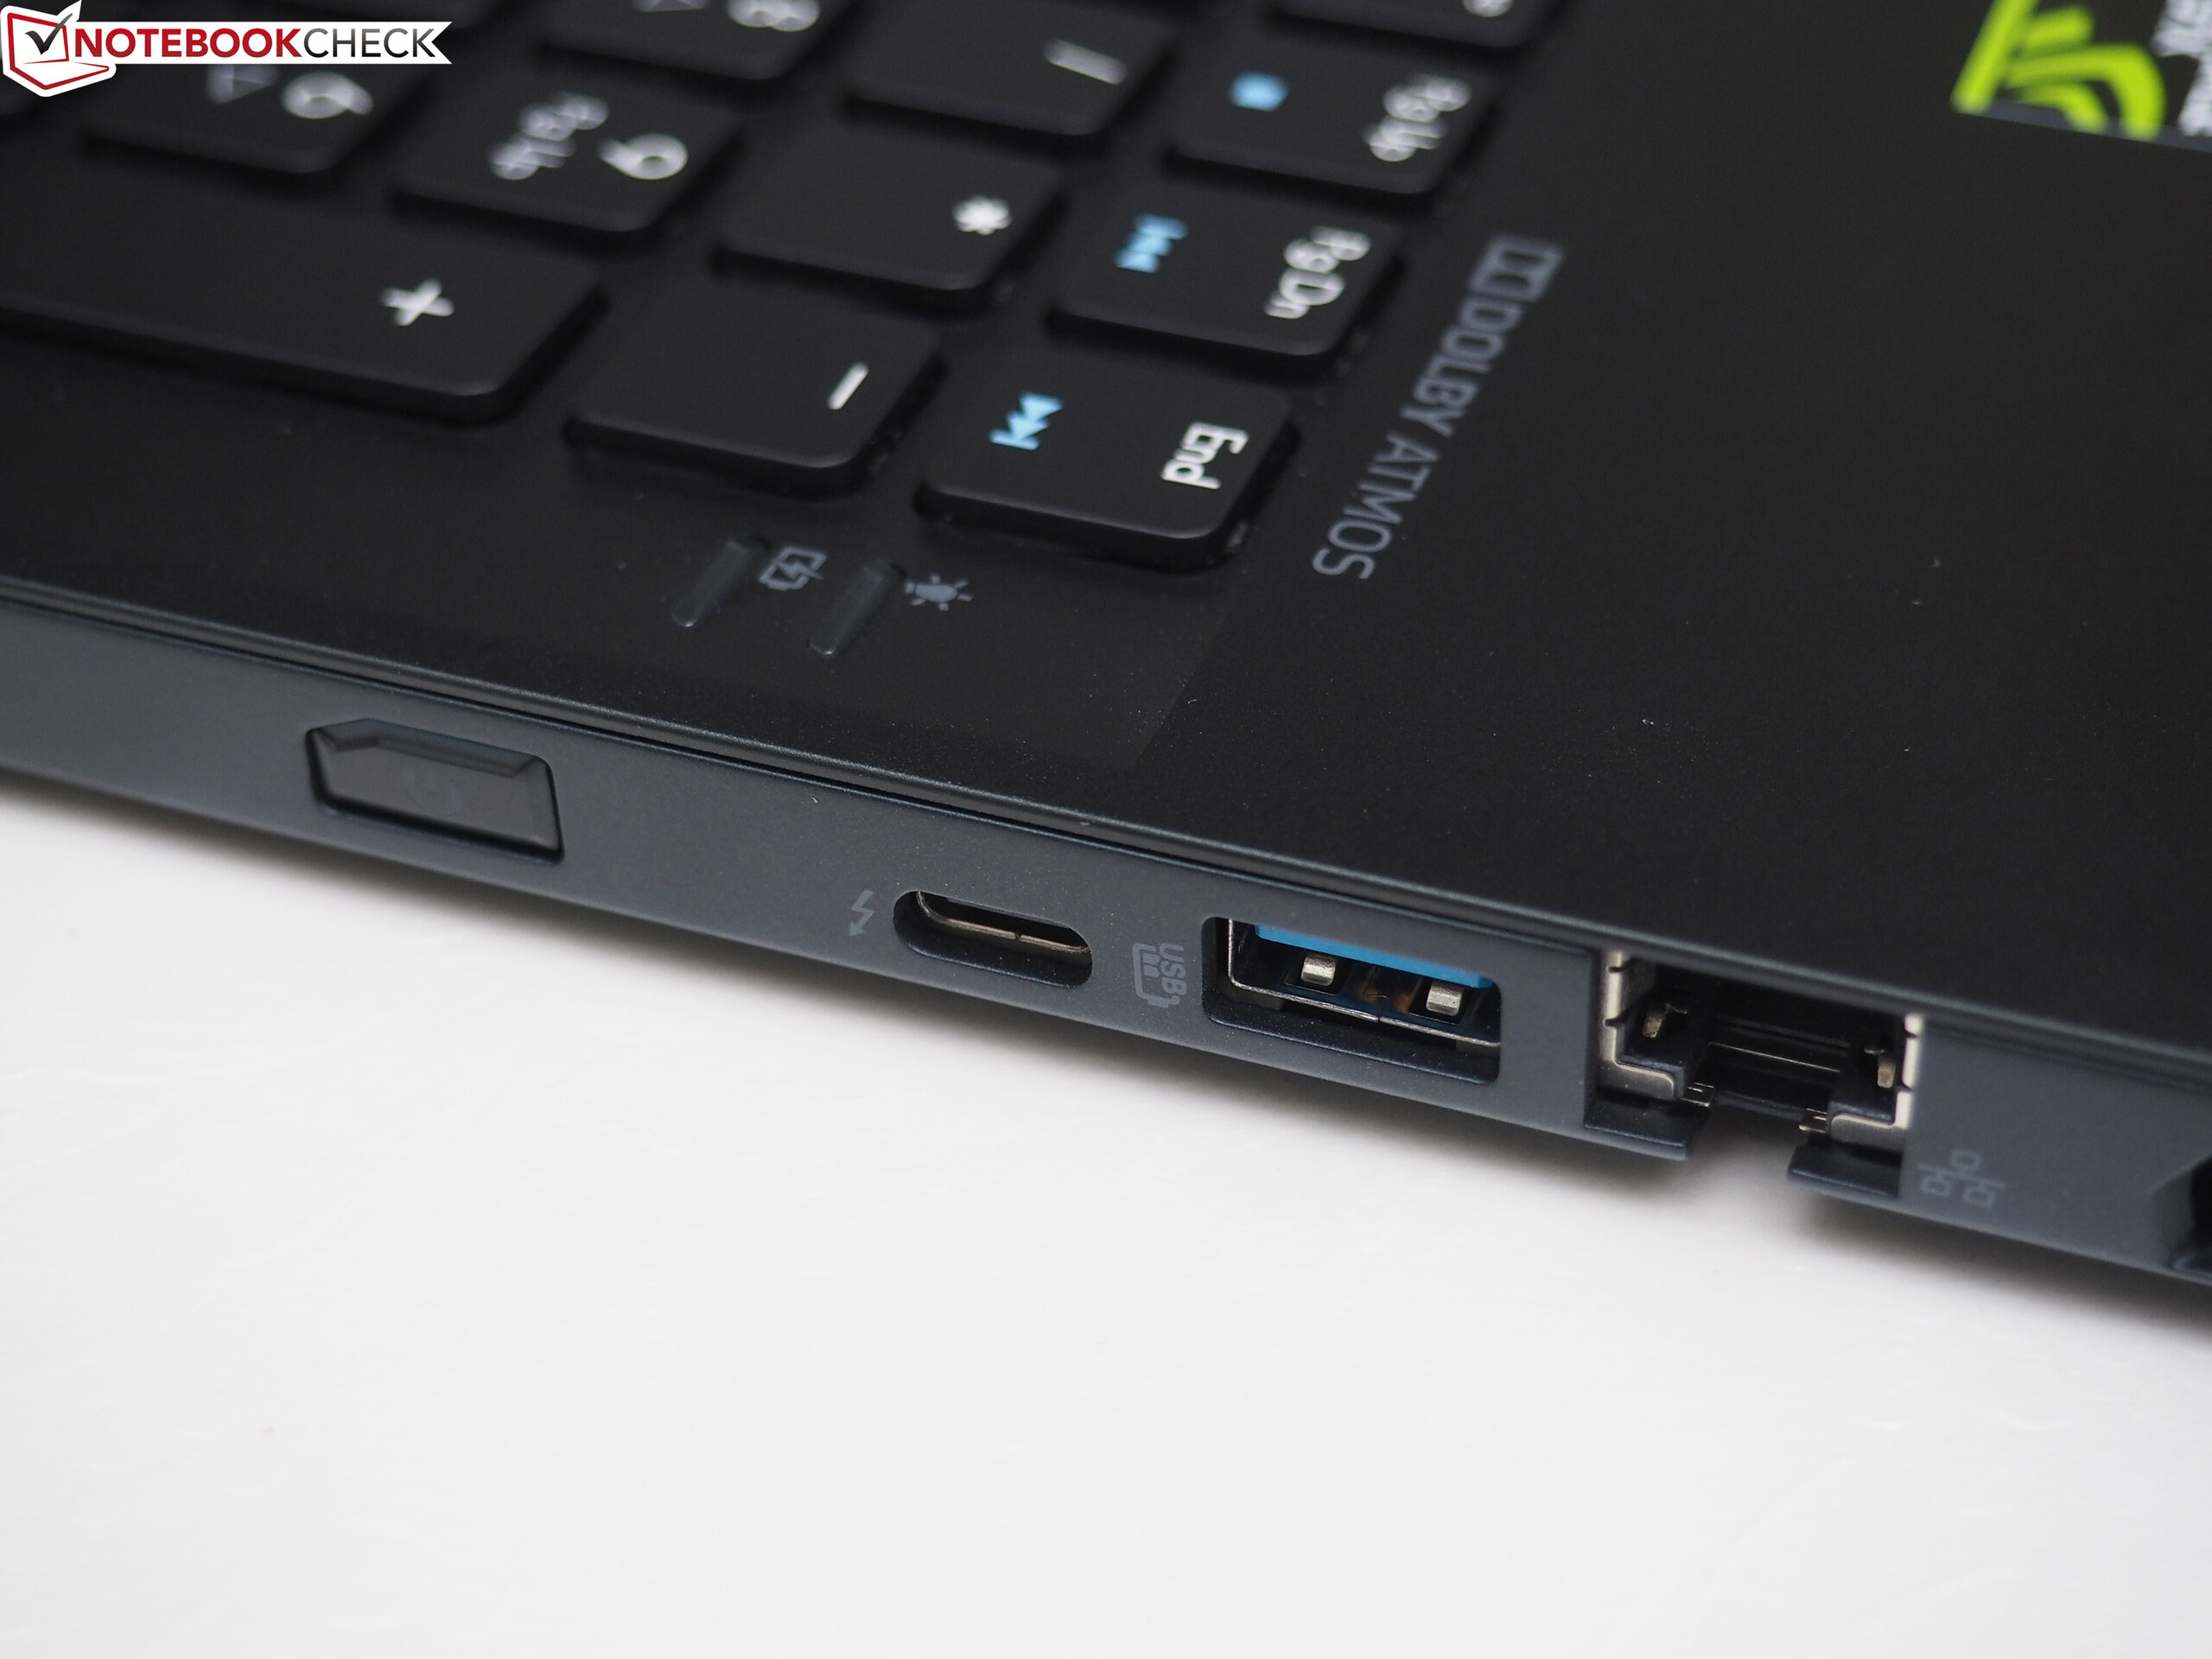
O Acer Predator Triton 700 confronta brutalmente com o ROG Zephyrus e e difícil definir um vencedor. O Triton 700 assume a liderança em termos de carcaça, teclado mecânico, seleção de portas e manutenção, enquanto o Zephyrus ganha pontos com seu touchpad melhor, uma temperatura geral mais baixa e um ruído do sistema mais baixo.
Além disso, ambos os rivais têm mais ou menos os mesmos prós e contras. Uma bateria grande e um touchpad normalmente posicionado, foram trocados por uma carcaça fina. A má qualidade do alto-falante, apesar da marca prestigiada Dolby Atmos, não combina bem com o preço alto. Estamos impressionados com a tela IPS de 120 Hz de alto contraste, porém refletiva, mas com ângulos de visão estáveis, com suporte para G-Sync.
Em conclusão, o Triton 700 e o ROG Zephyrus parecem muito caros e a Nvidia Max-Q policy tem sua parte nisso. Os caçadores de pechinchas que ainda preferem carcaças finas precisam procurar em outro lugar - não há nada para ver aqui. Para os entusiastas dos jogos que pretendem deixar seu portátil na sua mesa de qualquer maneira, recomendamos portáteis mais grossos com uma GTX 1070 ou 1080 regular. No final, o Triton 700 não é aceito na nossa lista "Top 10 de Portáteis para Jogos", mas entra no "Top 10 de Portáteis Finos y Leves para Jogos".
Acer Predator Triton 700
- 09/21/2017 v6 (old)
Florian Glaser
Price comparison