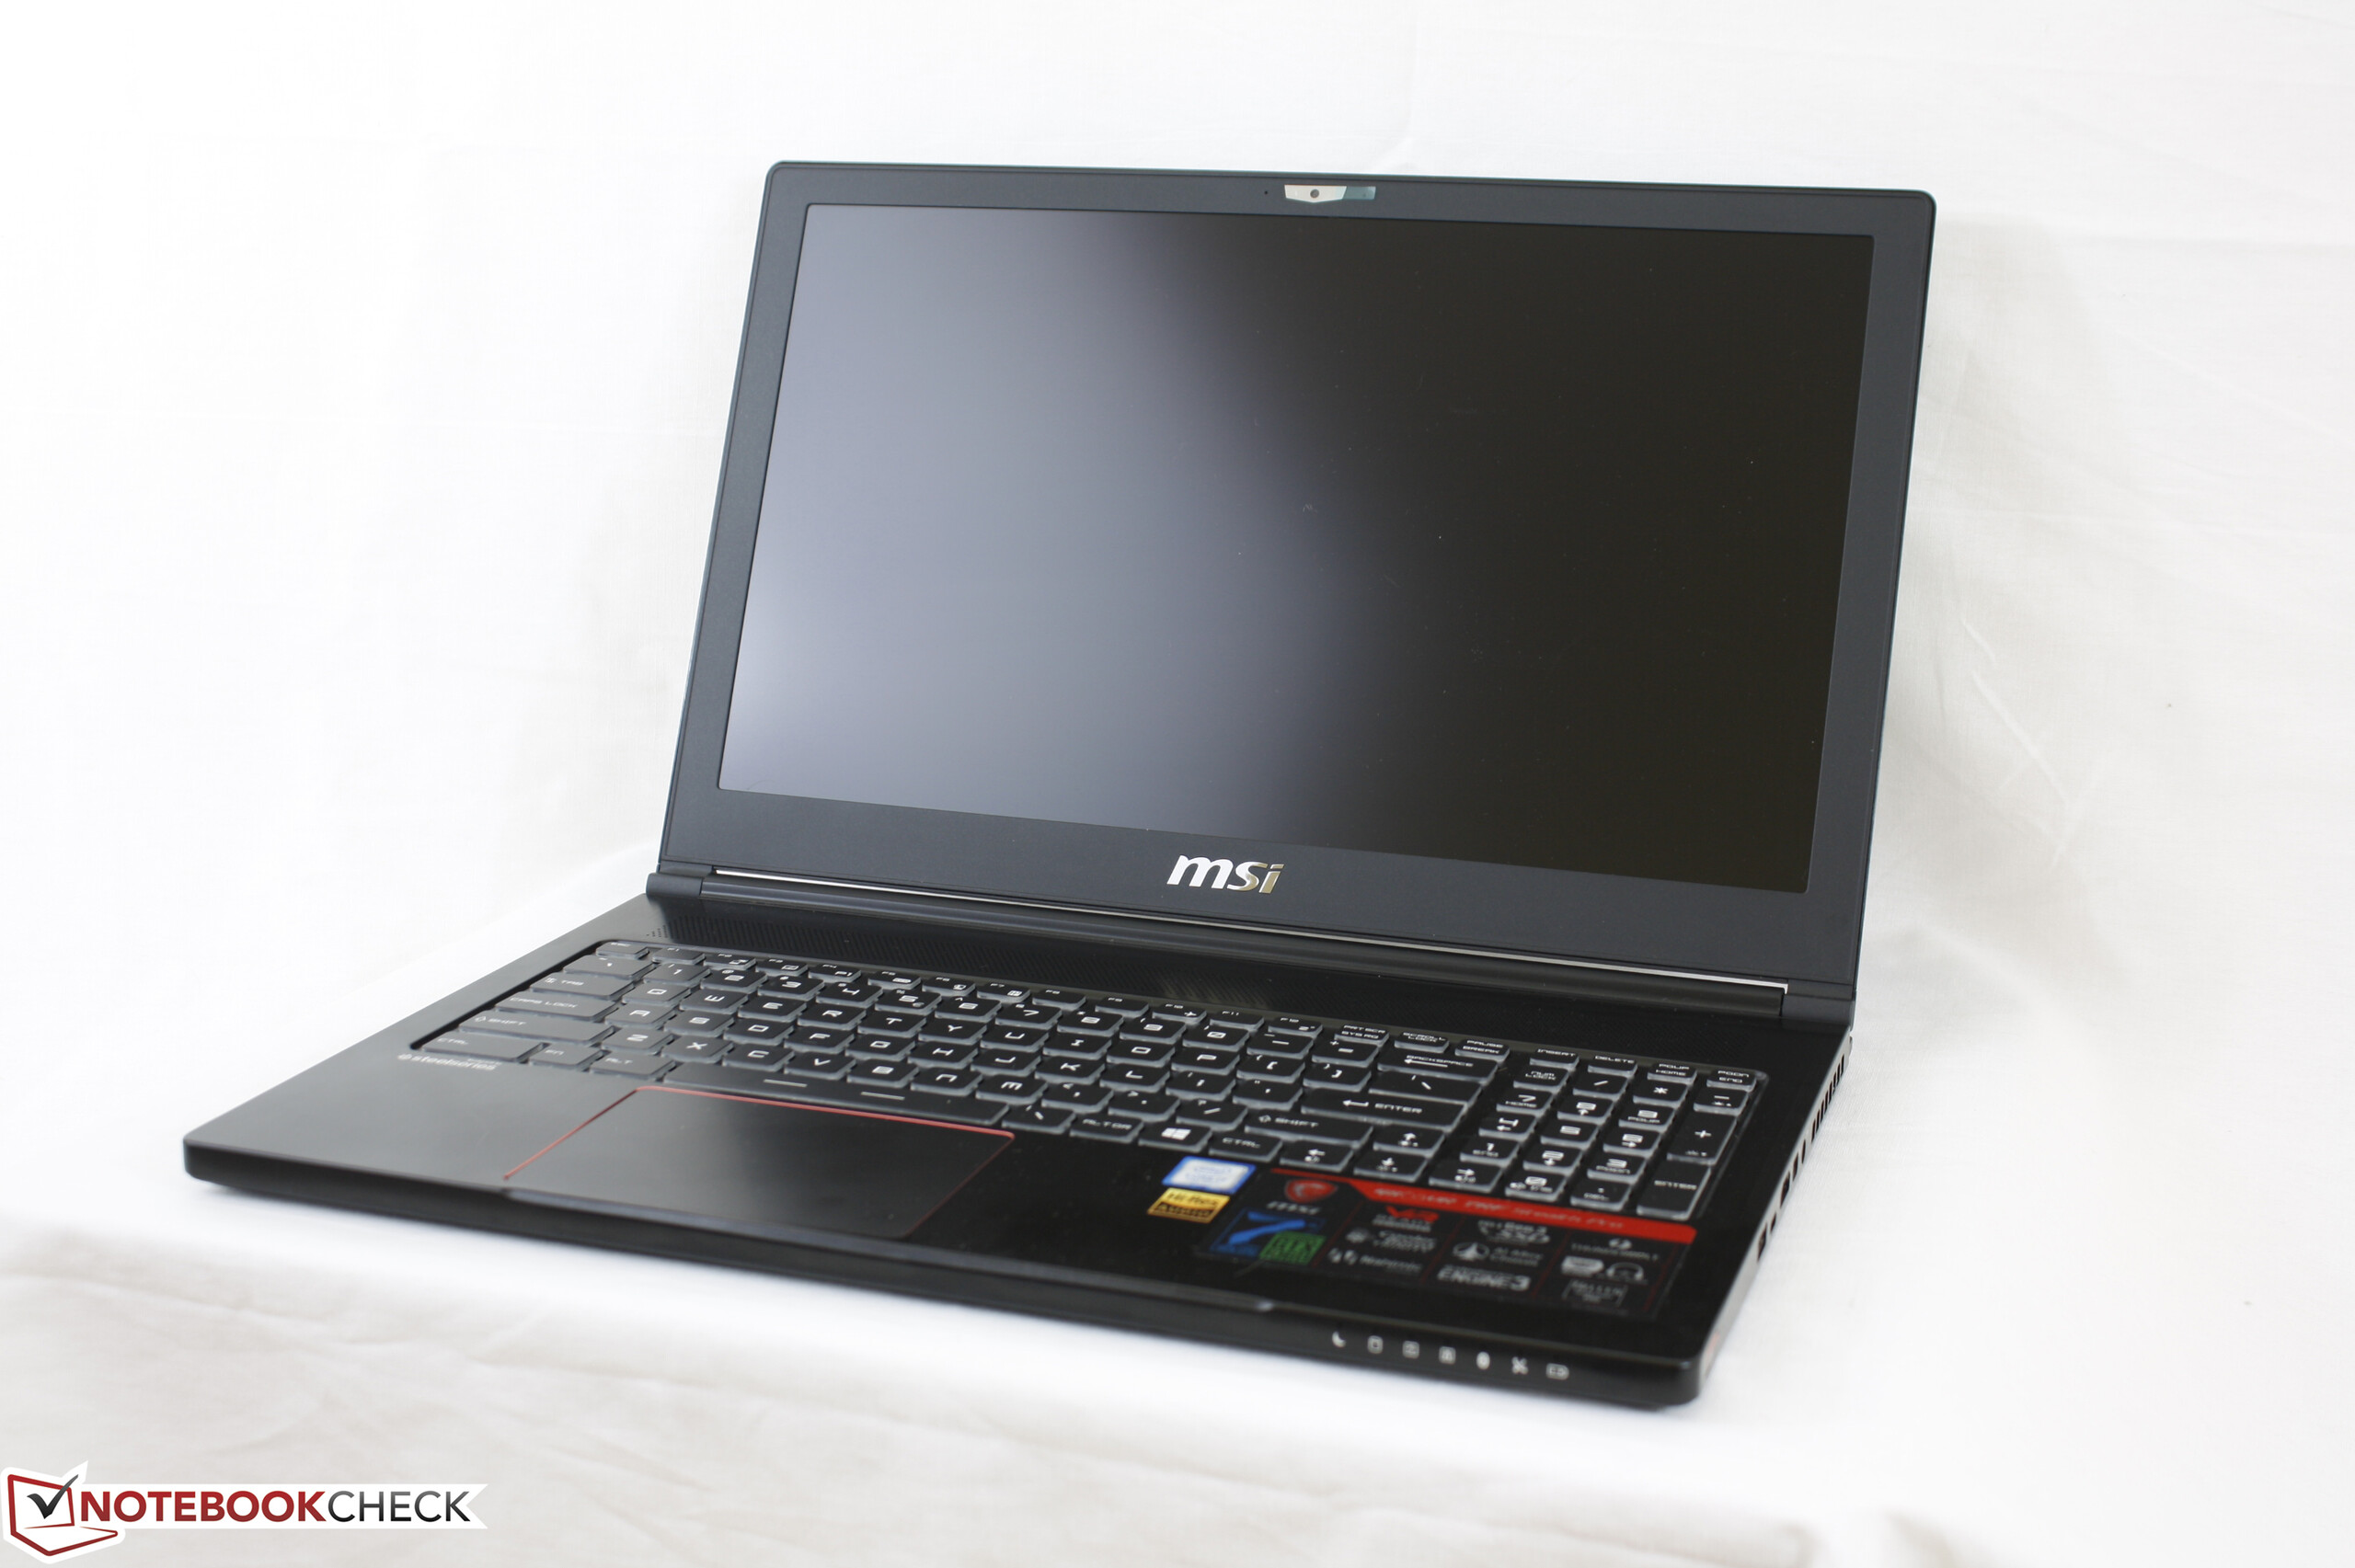
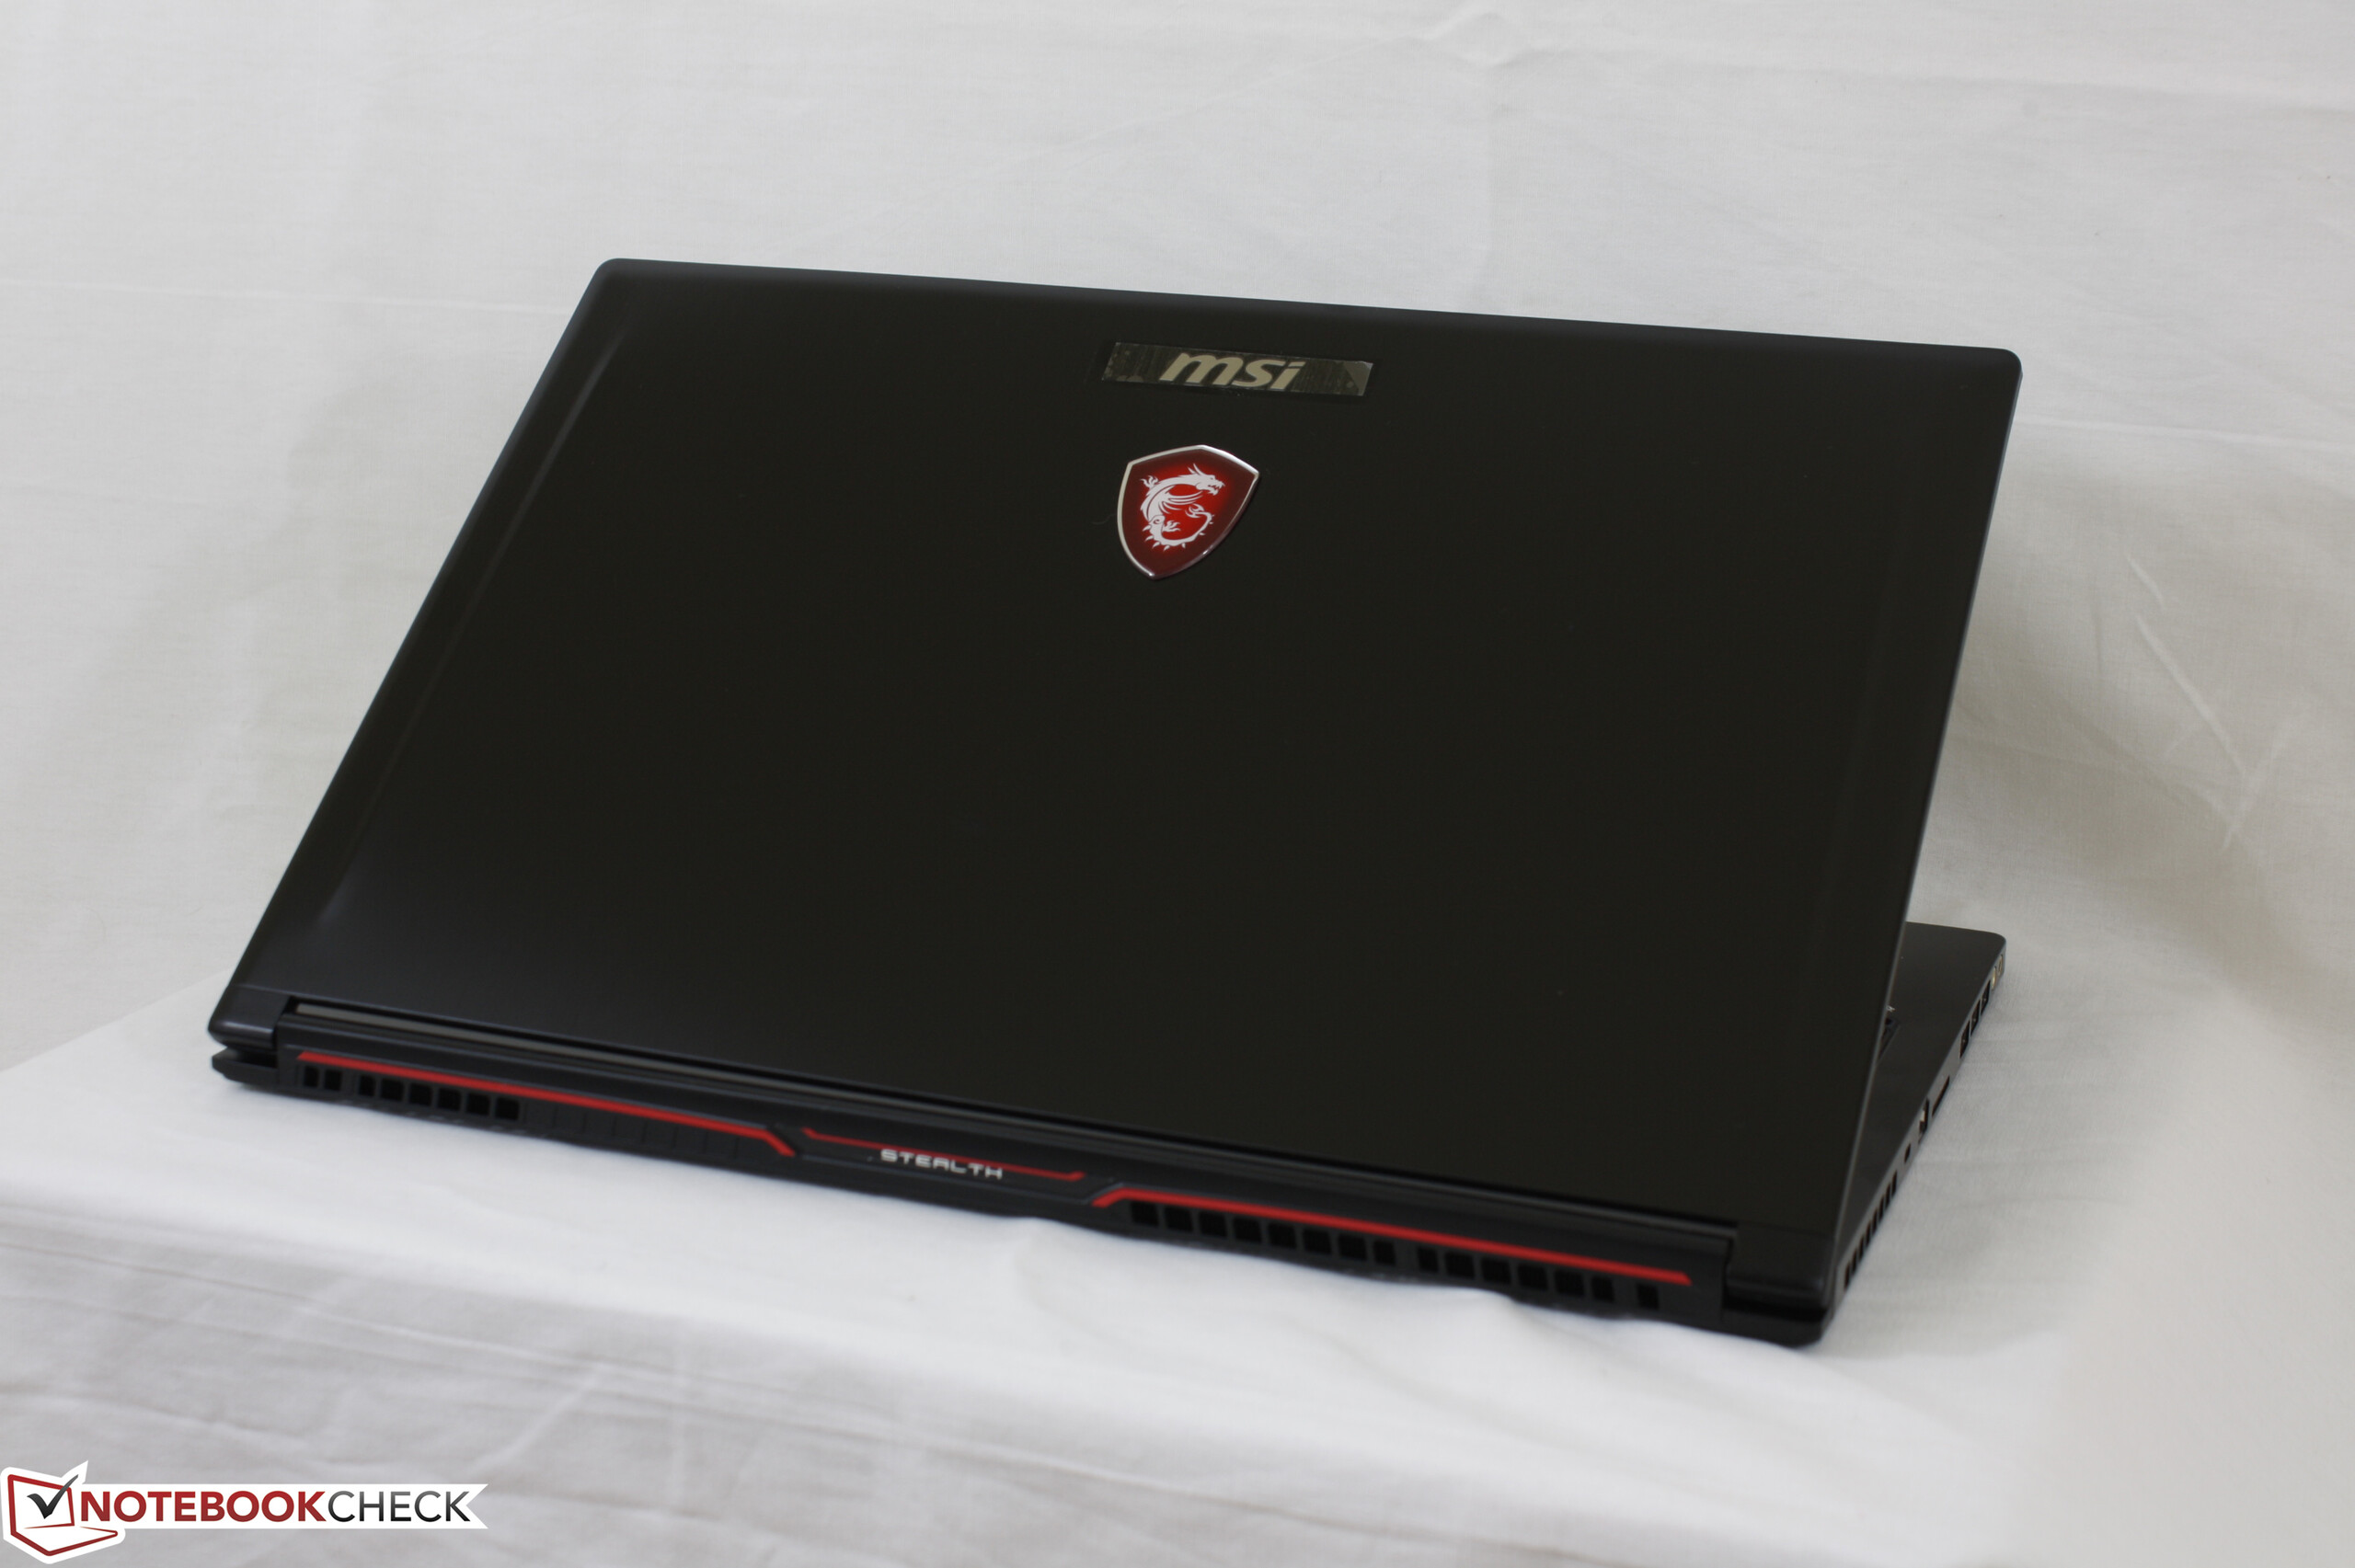
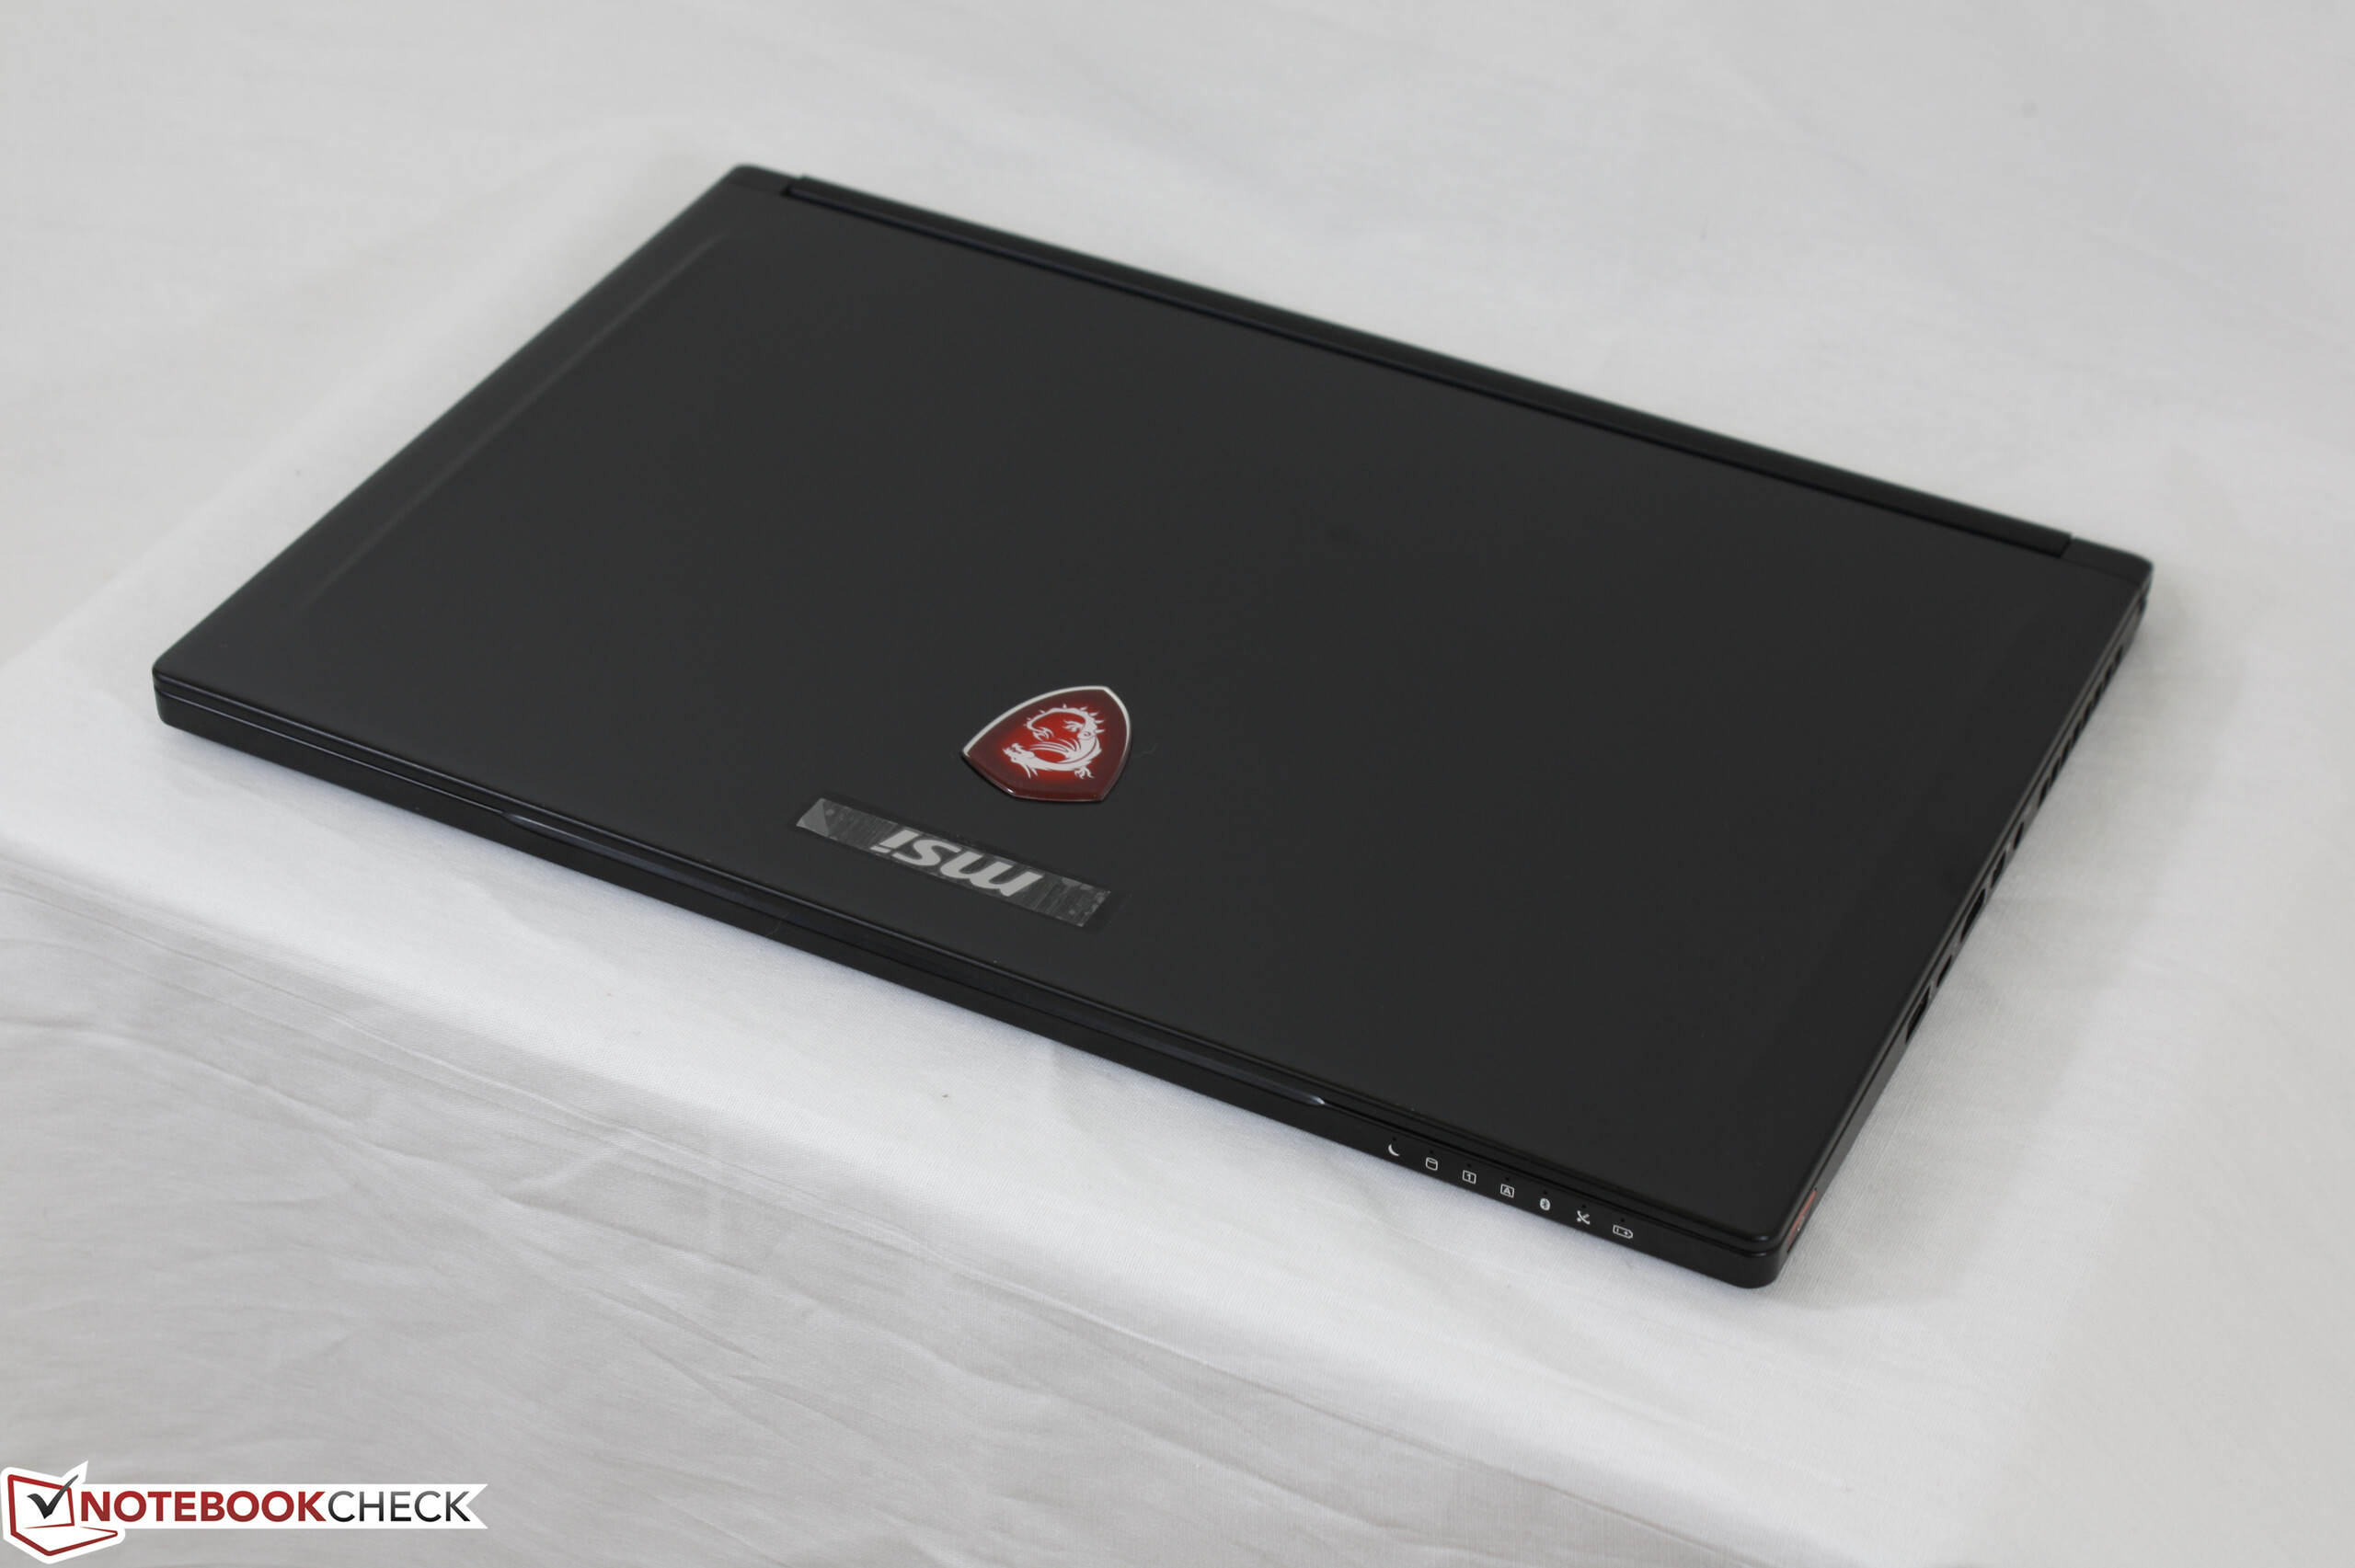
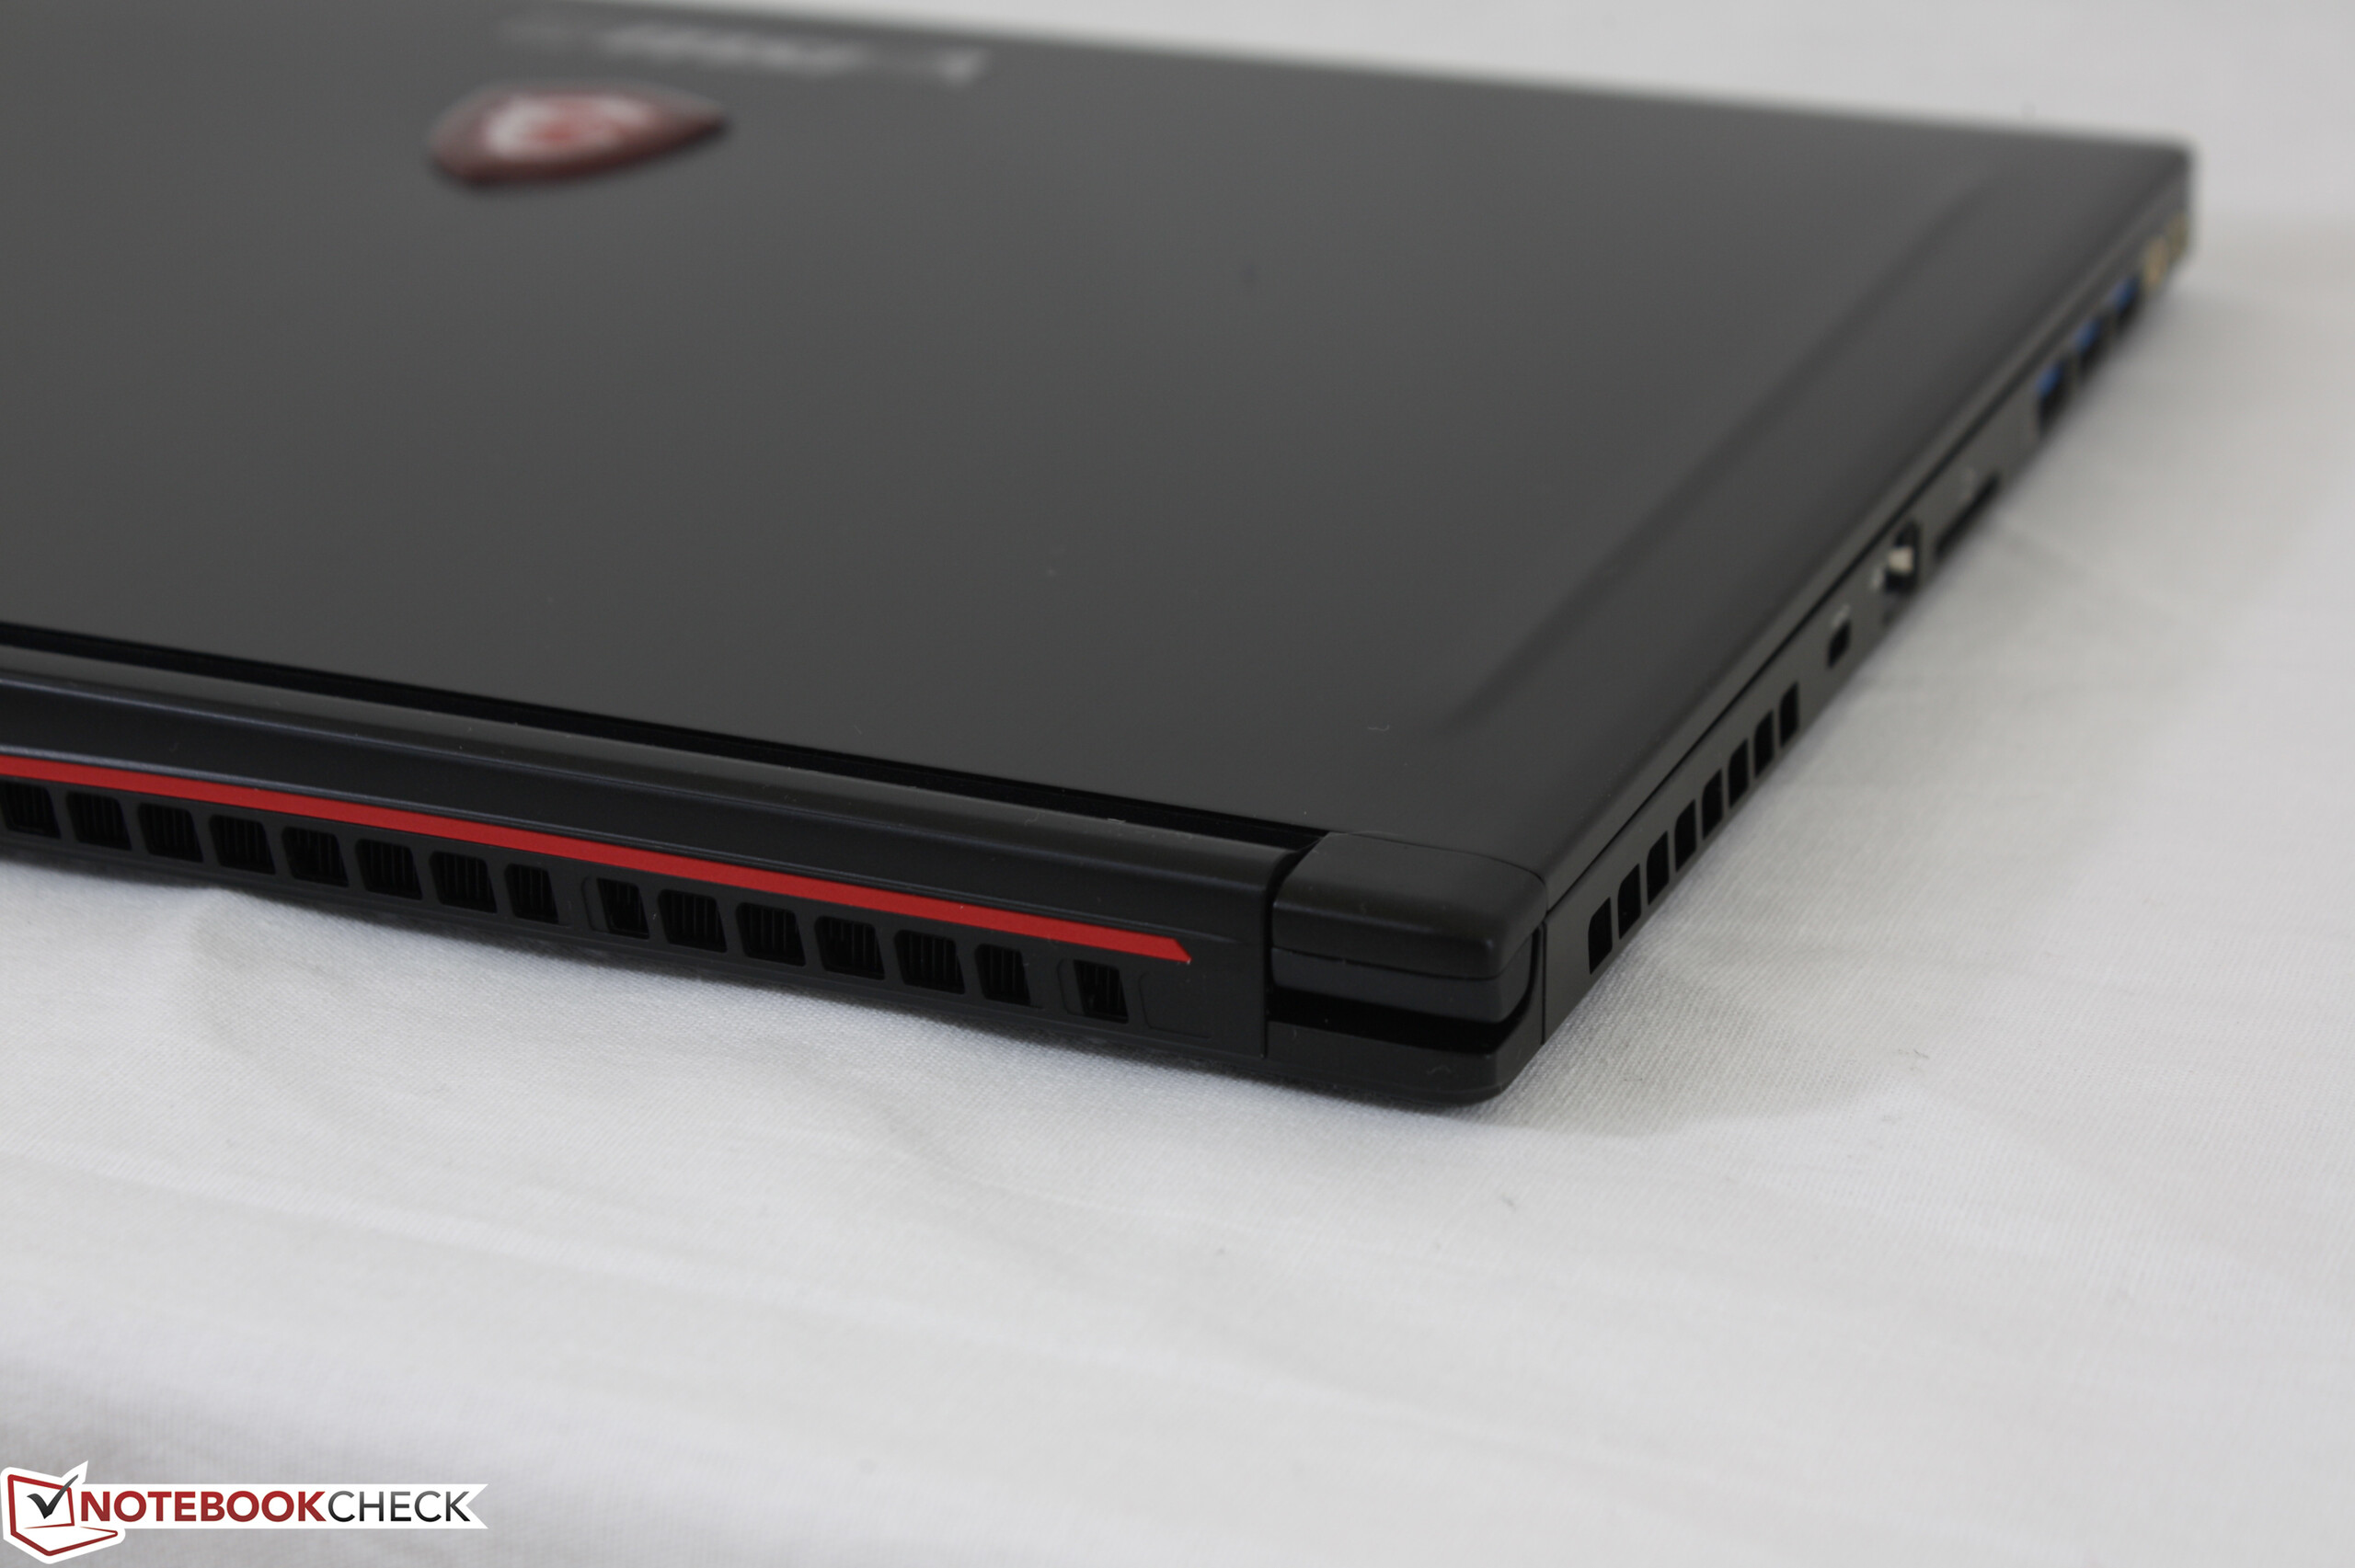
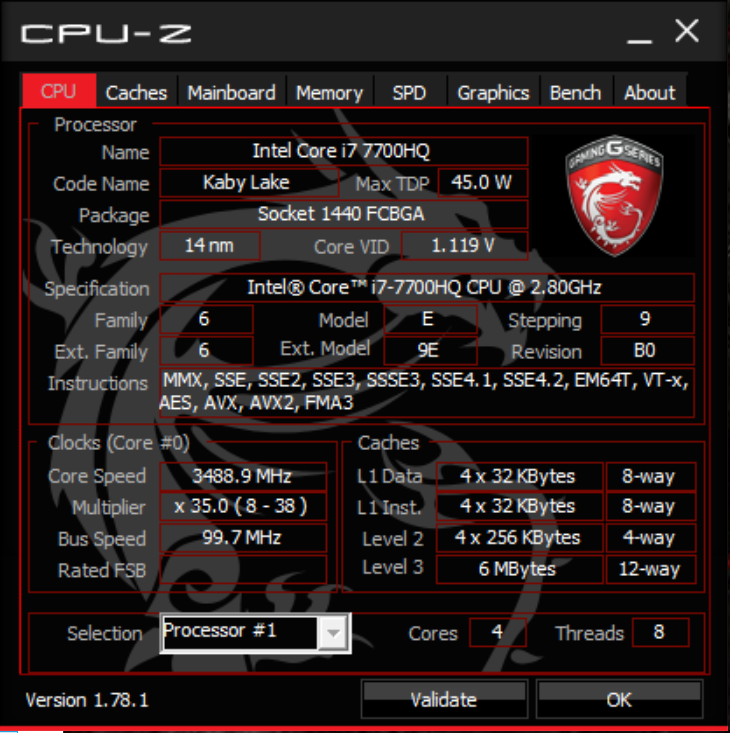
Breve Análise do Portátil MSI GS63VR 7RF (7700HQ, 4K UHD, GTX 1060)


| SD Card Reader | |
| average JPG Copy Test (av. of 3 runs) | |
| Dell XPS 15 9560 (i7-7700HQ, UHD) | |
| Asus FX502VM-AS73 | |
| MSI GS63VR 7RF-228US | |
| maximum AS SSD Seq Read Test (1GB) | |
| Dell XPS 15 9560 (i7-7700HQ, UHD) | |
| Asus FX502VM-AS73 | |
| MSI GS63VR 7RF-228US | |
| Networking | |
| iperf3 transmit AX12 | |
| MSI GS63VR 7RF-228US | |
| Dell XPS 15 9560 (i7-7700HQ, UHD) | |
| Asus FX502VM-AS73 | |
| iperf3 receive AX12 | |
| MSI GS63VR 7RF-228US | |
| Dell XPS 15 9560 (i7-7700HQ, UHD) | |
| Asus FX502VM-AS73 | |
| |||||||||||||||||||||||||
iluminação: 92 %
iluminação com acumulador: 274.2 cd/m²
Contraste: 623:1 (Preto: 0.44 cd/m²)
ΔE ColorChecker Calman: 8 | ∀{0.5-29.43 Ø4.72}
ΔE Greyscale Calman: 9.1 | ∀{0.09-98 Ø4.96}
72.1% sRGB (Argyll 1.6.3 3D)
45.7% AdobeRGB 1998 (Argyll 1.6.3 3D)
49.81% AdobeRGB 1998 (Argyll 3D)
72.6% sRGB (Argyll 3D)
48.21% Display P3 (Argyll 3D)
Gamma: 2.24
CCT: 5020 K
| MSI GS63VR 7RF-228US IPS, 15.6", 3840x2160 | Dell XPS 15 9560 (i7-7700HQ, UHD) IGZO IPS, 15.6", 3840x2160 | Asus FX502VM-AS73 TN LED, 15.6", 1920x1080 | Alienware 15 R3 HPJGK_B156HTN (AUO51ED), TN, 15.6", 1920x1080 | Apple MacBook Pro 15 2016 (2.9 GHz, 460) Apple APPA030, IPS, 15.4", 2880x1800 | |
|---|---|---|---|---|---|
| Display | 75% | -21% | 32% | 73% | |
| Display P3 Coverage (%) | 48.21 | 89.7 86% | 38.28 -21% | 66 37% | 99 105% |
| sRGB Coverage (%) | 72.6 | 100 38% | 56.9 -22% | 90.5 25% | 100 38% |
| AdobeRGB 1998 Coverage (%) | 49.81 | 100 101% | 39.47 -21% | 66.2 33% | 87.3 75% |
| Response Times | -85% | 2% | 30% | -101% | |
| Response Time Grey 50% / Grey 80% * (ms) | 28 ? | 57.2 ? -104% | 28.4 ? -1% | 25 ? 11% | 46 ? -64% |
| Response Time Black / White * (ms) | 23.6 ? | 39.2 ? -66% | 22.4 ? 5% | 12 ? 49% | 56 ? -137% |
| PWM Frequency (Hz) | 1351 ? | 962 | 119000 ? | ||
| Screen | 39% | -11% | 15% | 56% | |
| Brightness middle (cd/m²) | 274.2 | 370.1 35% | 209.5 -24% | 386 41% | 420 53% |
| Brightness (cd/m²) | 263 | 356 35% | 205 -22% | 382 45% | 401 52% |
| Brightness Distribution (%) | 92 | 87 -5% | 92 0% | 93 1% | 90 -2% |
| Black Level * (cd/m²) | 0.44 | 0.37 16% | 0.69 -57% | 0.39 11% | 0.3 32% |
| Contrast (:1) | 623 | 1000 61% | 304 -51% | 990 59% | 1400 125% |
| Colorchecker dE 2000 * | 8 | 5.3 34% | 4.7 41% | 10.2 -27% | 3.33 58% |
| Colorchecker dE 2000 max. * | 14.6 | 9.9 32% | 19.7 -35% | 15.81 -8% | 5.11 65% |
| Greyscale dE 2000 * | 9.1 | 4.6 49% | 1.8 80% | 11.28 -24% | 2.73 70% |
| Gamma | 2.24 98% | 2.31 95% | 2.23 99% | 2.23 99% | 2.48 89% |
| CCT | 5020 129% | 6284 103% | 6975 93% | 11383 57% | 6457 101% |
| Color Space (Percent of AdobeRGB 1998) (%) | 45.7 | 88.3 93% | 36.2 -21% | 59 29% | 78.09 71% |
| Color Space (Percent of sRGB) (%) | 72.1 | 100 39% | 56.6 -21% | 90 25% | 99.97 39% |
| Média Total (Programa/Configurações) | 10% /
30% | -10% /
-11% | 26% /
20% | 9% /
39% |
* ... menor é melhor
Exibir tempos de resposta
| ↔ Tempo de resposta preto para branco | ||
|---|---|---|
| 23.6 ms ... ascensão ↗ e queda ↘ combinadas | ↗ 15.2 ms ascensão | 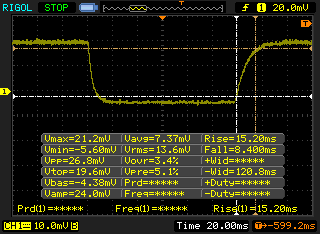 |
| ↘ 8.4 ms queda | ||
| A tela mostra boas taxas de resposta em nossos testes, mas pode ser muito lenta para jogadores competitivos. Em comparação, todos os dispositivos testados variam de 0.1 (mínimo) a 240 (máximo) ms. » 54 % de todos os dispositivos são melhores. Isso significa que o tempo de resposta medido é pior que a média de todos os dispositivos testados (19.8 ms). | ||
| ↔ Tempo de resposta 50% cinza a 80% cinza | ||
| 28 ms ... ascensão ↗ e queda ↘ combinadas | ↗ 15.6 ms ascensão | 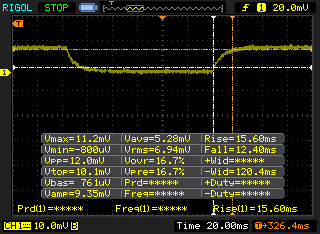 |
| ↘ 12.4 ms queda | ||
| A tela mostra taxas de resposta relativamente lentas em nossos testes e pode ser muito lenta para os jogadores. Em comparação, todos os dispositivos testados variam de 0.165 (mínimo) a 636 (máximo) ms. » 38 % de todos os dispositivos são melhores. Isso significa que o tempo de resposta medido é semelhante à média de todos os dispositivos testados (31 ms). | ||
Cintilação da tela / PWM (modulação por largura de pulso)
| Tela tremeluzindo/PWM detectado | 1351 Hz | ≤ 39 % configuração de brilho | 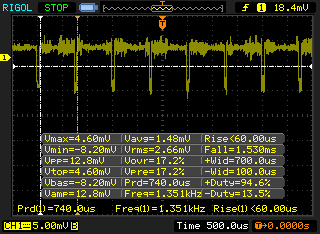 |
A luz de fundo da tela pisca em 1351 Hz (pior caso, por exemplo, utilizando PWM) Cintilação detectada em uma configuração de brilho de 39 % e abaixo. Não deve haver cintilação ou PWM acima desta configuração de brilho. A frequência de 1351 Hz é bastante alta, então a maioria dos usuários sensíveis ao PWM não deve notar nenhuma oscilação. [pwm_comparison] Em comparação: 52 % de todos os dispositivos testados não usam PWM para escurecer a tela. Se PWM foi detectado, uma média de 7747 (mínimo: 5 - máximo: 343500) Hz foi medida. | |||
| Cinebench R15 | |
| CPU Single 64Bit | |
| i7-7700K Gigabyte Z270-Gaming K3 | |
| MSI GS63VR 7RF-228US | |
| Eurocom Sky X7E2 | |
| Asus Strix GL702VSK | |
| EVGA SC17 GTX 1070 | |
| MSI GP62-2QEi781FD | |
| Asus GL702VM-GC102D | |
| Lenovo IdeaPad Y50 | |
| CPU Multi 64Bit | |
| i7-7700K Gigabyte Z270-Gaming K3 | |
| Eurocom Sky X7E2 | |
| MSI GS63VR 7RF-228US | |
| Asus Strix GL702VSK | |
| EVGA SC17 GTX 1070 | |
| MSI GP62-2QEi781FD | |
| Asus GL702VM-GC102D | |
| Lenovo IdeaPad Y50 | |
| Cinebench R11.5 | |
| CPU Single 64Bit | |
| i7-7700K Gigabyte Z270-Gaming K3 | |
| Asus Strix GL702VSK | |
| MSI GS63VR 7RF-228US | |
| Eurocom Sky X7E2 | |
| EVGA SC17 GTX 1070 | |
| MSI GP62-2QEi781FD | |
| Asus GL702VM-GC102D | |
| Lenovo IdeaPad Y50 | |
| CPU Multi 64Bit | |
| i7-7700K Gigabyte Z270-Gaming K3 | |
| Eurocom Sky X7E2 | |
| MSI GS63VR 7RF-228US | |
| Asus Strix GL702VSK | |
| EVGA SC17 GTX 1070 | |
| MSI GP62-2QEi781FD | |
| Asus GL702VM-GC102D | |
| Lenovo IdeaPad Y50 | |
| Cinebench R10 | |
| Rendering Multiple CPUs 32Bit | |
| i7-7700K Gigabyte Z270-Gaming K3 | |
| Eurocom Sky X7E2 | |
| MSI GS63VR 7RF-228US | |
| Asus Strix GL702VSK | |
| EVGA SC17 GTX 1070 | |
| Asus GL702VM-GC102D | |
| MSI GP62-2QEi781FD | |
| Lenovo IdeaPad Y50 | |
| Rendering Single 32Bit | |
| i7-7700K Gigabyte Z270-Gaming K3 | |
| Eurocom Sky X7E2 | |
| Asus Strix GL702VSK | |
| MSI GS63VR 7RF-228US | |
| EVGA SC17 GTX 1070 | |
| MSI GP62-2QEi781FD | |
| Asus GL702VM-GC102D | |
| Lenovo IdeaPad Y50 | |
| wPrime 2.10 - 1024m | |
| Lenovo IdeaPad Y50 | |
| MSI GS63VR 7RF-228US | |
| Asus Strix GL702VSK | |
| EVGA SC17 GTX 1070 | |
| MSI GP62-2QEi781FD | |
| Eurocom Sky X7E2 | |
| i7-7700K Gigabyte Z270-Gaming K3 | |
| 3DMark | |
| 3840x2160 Fire Strike Ultra Physics | |
| Eurocom Sky X7E2 | |
| EVGA SC17 GTX 1070 | |
| MSI GS63VR 7RF-228US | |
| Asus GL702VM-GC102D | |
| Fire Strike Extreme Physics | |
| Eurocom Sky X7E2 | |
| MSI GP62-2QEi781FD | |
| Asus Strix GL702VSK | |
| EVGA SC17 GTX 1070 | |
| MSI GS63VR 7RF-228US | |
| Asus GL702VM-GC102D | |
| Lenovo IdeaPad Y50 | |
| 1920x1080 Fire Strike Physics | |
| i7-7700K Gigabyte Z270-Gaming K3 | |
| Eurocom Sky X7E2 | |
| MSI GP62-2QEi781FD | |
| Asus Strix GL702VSK | |
| EVGA SC17 GTX 1070 | |
| MSI GS63VR 7RF-228US | |
| Asus GL702VM-GC102D | |
| Lenovo IdeaPad Y50 | |
* ... menor é melhor
| PCMark 8 | |
| Home Score Accelerated v2 | |
| Alienware 15 R3 | |
| Asus FX502VM-AS73 | |
| MSI GS63VR 7RF-228US | |
| Gigabyte P55W v7 | |
| Dell XPS 15 9560 (i7-7700HQ, UHD) | |
| Work Score Accelerated v2 | |
| Gigabyte P55W v7 | |
| Alienware 15 R3 | |
| MSI GS63VR 7RF-228US | |
| Dell XPS 15 9560 (i7-7700HQ, UHD) | |
| Asus FX502VM-AS73 | |
| Creative Score Accelerated v2 | |
| Alienware 15 R3 | |
| Asus FX502VM-AS73 | |
| MSI GS63VR 7RF-228US | |
| Dell XPS 15 9560 (i7-7700HQ, UHD) | |
| PCMark 8 Home Score Accelerated v2 | 4141 pontos | |
| PCMark 8 Creative Score Accelerated v2 | 5318 pontos | |
| PCMark 8 Work Score Accelerated v2 | 5268 pontos | |
Ajuda | ||
| MSI GS63VR 7RF-228US Samsung SM961 MZVKW512HMJP m.2 PCI-e | Dell XPS 15 9560 (i7-7700HQ, UHD) Lite-On CX2-8B512-Q11 | Asus FX502VM-AS73 SK Hynix HFS256G39TND-N210A | Alienware 15 R3 | Apple MacBook Pro 15 2016 (2.9 GHz, 460) Apple SSD SM1024L | |
|---|---|---|---|---|---|
| CrystalDiskMark 3.0 | -7% | -64% | -26% | -19% | |
| Read Seq (MB/s) | 2141 | 1684 -21% | 503 -77% | 1123 -48% | 1458 -32% |
| Write Seq (MB/s) | 1621 | 1106 -32% | 138.2 -91% | 429.2 -74% | 1440 -11% |
| Read 512 (MB/s) | 499.7 | 977 96% | 343.5 -31% | 833 67% | 914 83% |
| Write 512 (MB/s) | 1531 | 1119 -27% | 137.8 -91% | 428.1 -72% | 1058 -31% |
| Read 4k (MB/s) | 54.2 | 45.14 -17% | 29.36 -46% | 37.8 -30% | 9.786 -82% |
| Write 4k (MB/s) | 158.2 | 134.1 -15% | 70.9 -55% | 122.9 -22% | 10.9 -93% |
| Read 4k QD32 (MB/s) | 632 | 509 -19% | 369.9 -41% | 542 -14% | 679 7% |
| Write 4k QD32 (MB/s) | 527 | 398.1 -24% | 99.7 -81% | 429.8 -18% | 562 7% |

| 3DMark | |
| 1920x1080 Fire Strike Graphics | |
| Asus Strix GL702VSK | |
| Asus Strix GTX 980 Ti Desktop PC | |
| Nvidia GeForce GTX 1060 Founders Edition 6 GB | |
| Asus FX502VM-AS73 | |
| MSI GS63VR 7RF-228US | |
| Razer Blade (2016) FHD | |
| Asus Strix GL502VY-DS71 | |
| Schenker XMG P407 | |
| 3840x2160 Fire Strike Ultra Graphics | |
| Asus Strix GTX 980 Ti Desktop PC | |
| Nvidia GeForce GTX 1060 Founders Edition 6 GB | |
| Asus FX502VM-AS73 | |
| MSI GS63VR 7RF-228US | |
| Razer Blade (2016) FHD | |
| Asus Strix GL502VY-DS71 | |
| Schenker XMG P407 | |
| Fire Strike Extreme Graphics | |
| Asus Strix GL702VSK | |
| Asus Strix GTX 980 Ti Desktop PC | |
| Asus FX502VM-AS73 | |
| MSI GS63VR 7RF-228US | |
| Razer Blade (2016) FHD | |
| Asus Strix GL502VY-DS71 | |
| Schenker XMG P407 | |
| 3DMark 11 | |
| 1280x720 Performance GPU | |
| Asus Strix GTX 980 Ti Desktop PC | |
| Asus Strix GL702VSK | |
| Nvidia GeForce GTX 1060 Founders Edition 6 GB | |
| Asus FX502VM-AS73 | |
| MSI GS63VR 7RF-228US | |
| Razer Blade (2016) FHD | |
| Asus Strix GL502VY-DS71 | |
| Schenker XMG P407 | |
| 1280x720 Performance Combined | |
| Asus Strix GTX 980 Ti Desktop PC | |
| Nvidia GeForce GTX 1060 Founders Edition 6 GB | |
| Asus FX502VM-AS73 | |
| MSI GS63VR 7RF-228US | |
| Asus Strix GL502VY-DS71 | |
| Razer Blade (2016) FHD | |
| Schenker XMG P407 | |
| Asus Strix GL702VSK | |
| 3DMark 11 Performance | 12530 pontos | |
| 3DMark Cloud Gate Standard Score | 17664 pontos | |
| 3DMark Fire Strike Score | 9485 pontos | |
| 3DMark Fire Strike Extreme Score | 5047 pontos | |
Ajuda | ||
| baixo | média | alto | ultra | 4K | |
|---|---|---|---|---|---|
| BioShock Infinite (2013) | 100.6 | ||||
| Metro: Last Light (2013) | 78.1 | ||||
| Thief (2014) | 74.9 | ||||
| The Witcher 3 (2015) | 76 | 39.4 | 26.3 | ||
| Batman: Arkham Knight (2015) | 58 | 29 | |||
| Metal Gear Solid V (2015) | 60 | 40.8 | |||
| Fallout 4 (2015) | 64 | 26.2 | |||
| Rise of the Tomb Raider (2016) | 64.1 | 25.5 | |||
| Doom (2016) | 92.3 | 30.5 | |||
| Overwatch (2016) | 104.6 | 54.5 | |||
| Mafia 3 (2016) | 43.6 | 13.1 |
| Fallout 4 - 3840x2160 High Preset AA:T AF:16x | |
| Eurocom Tornado F5 Killer Edition | |
| Gigabyte P57X v7 | |
| Nvidia GeForce GTX 1060 Founders Edition 6 GB | |
| MSI GS63VR 7RF-228US | |
| MSI GE72 7RE-046 | |
| Dell XPS 15 9560 (i7-7700HQ, UHD) | |
| The Witcher 3 - 3840x2160 High Graphics & Postprocessing (Nvidia HairWorks Off) | |
| Eurocom Tornado F5 Killer Edition | |
| Nvidia GeForce GTX 1060 Founders Edition 6 GB | |
| MSI GS63VR 7RF-228US | |
| MSI GE72 7RE-046 | |
| Batman: Arkham Knight - 3840x2160 High / On (Interactive Smoke & Paper Debris Off) AA:SM AF:8x | |
| Eurocom Tornado F5 Killer Edition | |
| Gigabyte P57X v7 | |
| Nvidia GeForce GTX 1060 Founders Edition 6 GB | |
| MSI GS63VR 7RF-228US | |
| MSI GE72 7RE-046 | |
| Dell XPS 15 9560 (i7-7700HQ, UHD) | |
| Rise of the Tomb Raider - 3840x2160 High Preset AA:FX AF:4x | |
| Eurocom Tornado F5 Killer Edition | |
| Gigabyte P57X v7 | |
| Nvidia GeForce GTX 1060 Founders Edition 6 GB | |
| Nvidia GeForce GTX 1060 Founders Edition 6 GB | |
| MSI GS63VR 7RF-228US | |
| MSI GE72 7RE-046 | |
| Dell XPS 15 9560 (i7-7700HQ, UHD) | |
| Doom - 3840x2160 High Preset AA:FX | |
| Eurocom Tornado F5 Killer Edition | |
| Nvidia GeForce GTX 1060 Founders Edition 6 GB | |
| MSI GS63VR 7RF-228US | |
| MSI GE72 7RE-046 | |
| Dell XPS 15 9560 (i7-7700HQ, UHD) | |
| Overwatch - 3840x2160 High (Render Scale 100 %) AA:SM AF:4x | |
| Eurocom Tornado F5 Killer Edition | |
| Nvidia GeForce GTX 1060 Founders Edition 6 GB | |
| MSI GS63VR 7RF-228US | |
| MSI GE72 7RE-046 | |
| Dell XPS 15 9560 (i7-7700HQ, UHD) | |
| Mafia 3 - 3840x2160 High Preset | |
| Eurocom Tornado F5 Killer Edition | |
| MSI GS63VR 7RF-228US | |
| MSI GE72 7RE-046 | |
Barulho
| Ocioso |
| 33.1 / 33.1 / 34 dB |
| Carga |
| 37.2 / 47.1 dB |
 | ||
30 dB silencioso 40 dB(A) audível 50 dB(A) ruidosamente alto |
||
min: | ||
| MSI GS63VR 7RF-228US GeForce GTX 1060 Mobile, i7-7700HQ, Samsung SM961 MZVKW512HMJP m.2 PCI-e | Dell XPS 15 9560 (i7-7700HQ, UHD) GeForce GTX 1050 Mobile, i7-7700HQ, Lite-On CX2-8B512-Q11 | Asus FX502VM-AS73 GeForce GTX 1060 Mobile, i7-7700HQ, SK Hynix HFS256G39TND-N210A | Alienware 15 R3 GeForce GTX 1070 Mobile, i7-7700HQ | Apple MacBook Pro 15 2016 (2.9 GHz, 460) Radeon Pro 460, 6920HQ, Apple SSD SM1024L | MSI GS60 6QE-002US GeForce GTX 970M, 6700HQ, Samsung SM951 MZHPV128 m.2 PCI-e | |
|---|---|---|---|---|---|---|
| Noise | -1% | -2% | -10% | 6% | -5% | |
| desligado / ambiente * (dB) | 28.8 | 28.4 1% | 28.7 -0% | 30 -4% | 29 -1% | |
| Idle Minimum * (dB) | 33.1 | 29 12% | 30.6 8% | 31 6% | 30.3 8% | 35.2 -6% |
| Idle Average * (dB) | 33.1 | 29 12% | 30.6 8% | 32 3% | 30.3 8% | 35.3 -7% |
| Idle Maximum * (dB) | 34 | 32.2 5% | 31 9% | 42 -24% | 30.3 11% | 35.5 -4% |
| Load Average * (dB) | 37.2 | 47.1 -27% | 46.2 -24% | 49 -32% | 35.1 6% | 40.4 -9% |
| Witcher 3 ultra * (dB) | 46.1 | 52 -13% | ||||
| Load Maximum * (dB) | 47.1 | 47.1 -0% | 52.3 -11% | 50 -6% | 46 2% | 47.2 -0% |
* ... menor é melhor
(±) Jogando The Witcher 3, a temperatura média para o lado superior é 35.1 °C / 95 F, em comparação com a média do dispositivo de 33.9 °C / ## #class_avg_f### F.
(+) Os apoios para as mãos e o touchpad estão atingindo a temperatura máxima da pele (32.4 °C / 90.3 F) e, portanto, não estão quentes.
(-) A temperatura média da área do apoio para as mãos de dispositivos semelhantes foi 28.8 °C / 83.8 F (-3.6 °C / -6.5 F).
MSI GS63VR 7RF-228US análise de áudio
(±) | o volume do alto-falante é médio, mas bom (###valor### dB)
Graves 100 - 315Hz
(-) | quase nenhum baixo - em média 25.3% menor que a mediana
(±) | a linearidade dos graves é média (12.4% delta para a frequência anterior)
Médios 400 - 2.000 Hz
(+) | médios equilibrados - apenas 3.3% longe da mediana
(±) | a linearidade dos médios é média (7% delta para frequência anterior)
Altos 2 - 16 kHz
(±) | máximos mais altos - em média 8.1% maior que a mediana
(±) | a linearidade dos máximos é média (8.6% delta para frequência anterior)
Geral 100 - 16.000 Hz
(±) | a linearidade do som geral é média (28.4% diferença em relação à mediana)
Comparado com a mesma classe
» 94% de todos os dispositivos testados nesta classe foram melhores, 1% semelhantes, 4% piores
» O melhor teve um delta de 6%, a média foi 18%, o pior foi 132%
Comparado com todos os dispositivos testados
» 86% de todos os dispositivos testados foram melhores, 3% semelhantes, 12% piores
» O melhor teve um delta de 4%, a média foi 23%, o pior foi 134%
Apple MacBook 12 (Early 2016) 1.1 GHz análise de áudio
(+) | os alto-falantes podem tocar relativamente alto (###valor### dB)
Graves 100 - 315Hz
(±) | graves reduzidos - em média 11.3% menor que a mediana
(±) | a linearidade dos graves é média (14.2% delta para a frequência anterior)
Médios 400 - 2.000 Hz
(+) | médios equilibrados - apenas 2.4% longe da mediana
(+) | médios são lineares (5.5% delta para frequência anterior)
Altos 2 - 16 kHz
(+) | agudos equilibrados - apenas 2% longe da mediana
(+) | os máximos são lineares (4.5% delta da frequência anterior)
Geral 100 - 16.000 Hz
(+) | o som geral é linear (10.2% diferença em relação à mediana)
Comparado com a mesma classe
» 7% de todos os dispositivos testados nesta classe foram melhores, 2% semelhantes, 90% piores
» O melhor teve um delta de 5%, a média foi 18%, o pior foi 53%
Comparado com todos os dispositivos testados
» 5% de todos os dispositivos testados foram melhores, 1% semelhantes, 94% piores
» O melhor teve um delta de 4%, a média foi 23%, o pior foi 134%
| desligado | |
| Ocioso | |
| Carga |
|
Key:
min: | |
| MSI GS63VR 7RF-228US i7-7700HQ, GeForce GTX 1060 Mobile, Samsung SM961 MZVKW512HMJP m.2 PCI-e, IPS, 3840x2160, 15.6" | Dell XPS 15 9560 (i7-7700HQ, UHD) i7-7700HQ, GeForce GTX 1050 Mobile, Lite-On CX2-8B512-Q11, IGZO IPS, 3840x2160, 15.6" | Asus FX502VM-AS73 i7-7700HQ, GeForce GTX 1060 Mobile, SK Hynix HFS256G39TND-N210A, TN LED, 1920x1080, 15.6" | Alienware 15 R3 i7-7700HQ, GeForce GTX 1070 Mobile, , TN, 1920x1080, 15.6" | Gigabyte P55W v7 i7-7700HQ, GeForce GTX 1060 Mobile, Liteonit CV3-8D256, IPS, 1920x1080, 15.6" | MSI GS63VR-6RF16H22 Stealth Pro 6700HQ, GeForce GTX 1060 Mobile, Samsung SM951 MZVPV256HDGL m.2 PCI-e, IPS, 1920x1080, 15.6" | |
|---|---|---|---|---|---|---|
| Power Consumption | 7% | 2% | -31% | 21% | -27% | |
| Idle Minimum * (Watt) | 14.5 | 11.9 18% | 14.9 -3% | 19 -31% | 8 45% | 18 -24% |
| Idle Average * (Watt) | 17.3 | 17.1 1% | 15.1 13% | 23 -33% | 13 25% | 22 -27% |
| Idle Maximum * (Watt) | 17.4 | 17.3 1% | 15.2 13% | 29 -67% | 18 -3% | 30 -72% |
| Load Average * (Watt) | 93 | 94.7 -2% | 105.8 -14% | 85 9% | 76 18% | 77 17% |
| Witcher 3 ultra * (Watt) | 128.8 | 104.8 19% | ||||
| Load Maximum * (Watt) | 122 | 148.8 | 192 | 143 | 165 |
* ... menor é melhor
| MSI GS63VR 7RF-228US i7-7700HQ, GeForce GTX 1060 Mobile, 65 Wh | Dell XPS 15 9560 (i7-7700HQ, UHD) i7-7700HQ, GeForce GTX 1050 Mobile, 97 Wh | Asus FX502VM-AS73 i7-7700HQ, GeForce GTX 1060 Mobile, 64 Wh | Alienware 15 R3 i7-7700HQ, GeForce GTX 1070 Mobile, 99 Wh | Apple MacBook Pro 15 2016 (2.9 GHz, 460) 6920HQ, Radeon Pro 460, 76 Wh | |
|---|---|---|---|---|---|
| Duração da bateria | 78% | -1% | 15% | 67% | |
| Reader / Idle (h) | 6.4 | 13.9 117% | 6.1 -5% | 6.4 0% | |
| WiFi v1.3 (h) | 3.9 | 7.2 85% | 4.6 18% | 4.4 13% | 10.3 164% |
| Load (h) | 1.3 | 1.7 31% | 1.1 -15% | 1.7 31% | 0.9 -31% |
Pro
Contra

O GS60 original esteve na frente o tempo todo. O design superfino do chassi e as opções 4K UHD combinados de forma muito pobre com processadores Broadwell e Maxwell mesmo com se dito chassi fosse visualmente atraente. Afortunadamente, o hardware da Intel e Nvidia finalmente está chegando perto da visão original da MSI de fornecer desempenho de jogos de nível de entusiasta em um portátil superfino que não é muito maior a um MacBook Pro 15. A Kaby Lake e Pascal se desempenham de forma admirável sem maiores problemas de afogamentos durante o tempo que estivemos com a unidade. Combine isto com a surpreendente portabilidade do sistema e você tem um portátil que é quase perfeito tanto para a escola como para jogos.
As desvantagens são notórias e variadas. Sim, a GS63VR pode substituir e superar o XPS 15, MacBook Pro 15, e inclusive o grande ROG G752, mas espere um chassi mais flexível com um ruído de ventoinha de alta frequência durante o uso. Duração da bateria, qualidade do som, e o brilho da iluminação de fundo poderia ter sido melhor e um "modo silencioso" real para o processamento de textos teria sido uma boa solução. Além disso, entrando mais fundo no seu desempenho mostrará que a CPU é incapaz de manter as velocidades Turbo Boost no máximo e que a temperatura da GPU será mais quente que em portáteis de jogos maiores.
O SKY base de 1080p é uma recomendação mais fácil sobre a opção 4K UHD. A não ser que jogar com a resolução nativa de 4K UHD com configurações baixas-médias sem G-Sync, soa atraente, o GTX 1060 anda lida melhor com uma tela 1080p. Além disso, o painel 1080p oferece maior contraste e cores mais amplas que o painel 4K UHD para um preço mais econômico, portanto, os usuários do 4K UHD estão essencialmente desistindo de um painel de qualidade por esses pixels mais densos.
O GS63VR funciona de forma um pouco mais silenciosa que o GS60 enquanto oferece boosts massivos no desempenho. Embora sua proeza nos jogos não deve ser subestimada, sua tela, duração da bateria, e rigidez do chassi não melhoraram tanto como o hardware no seu interior.
MSI GS63VR 7RF-228US
- 03/24/2017 v6 (old)
Allen Ngo
Price comparison
