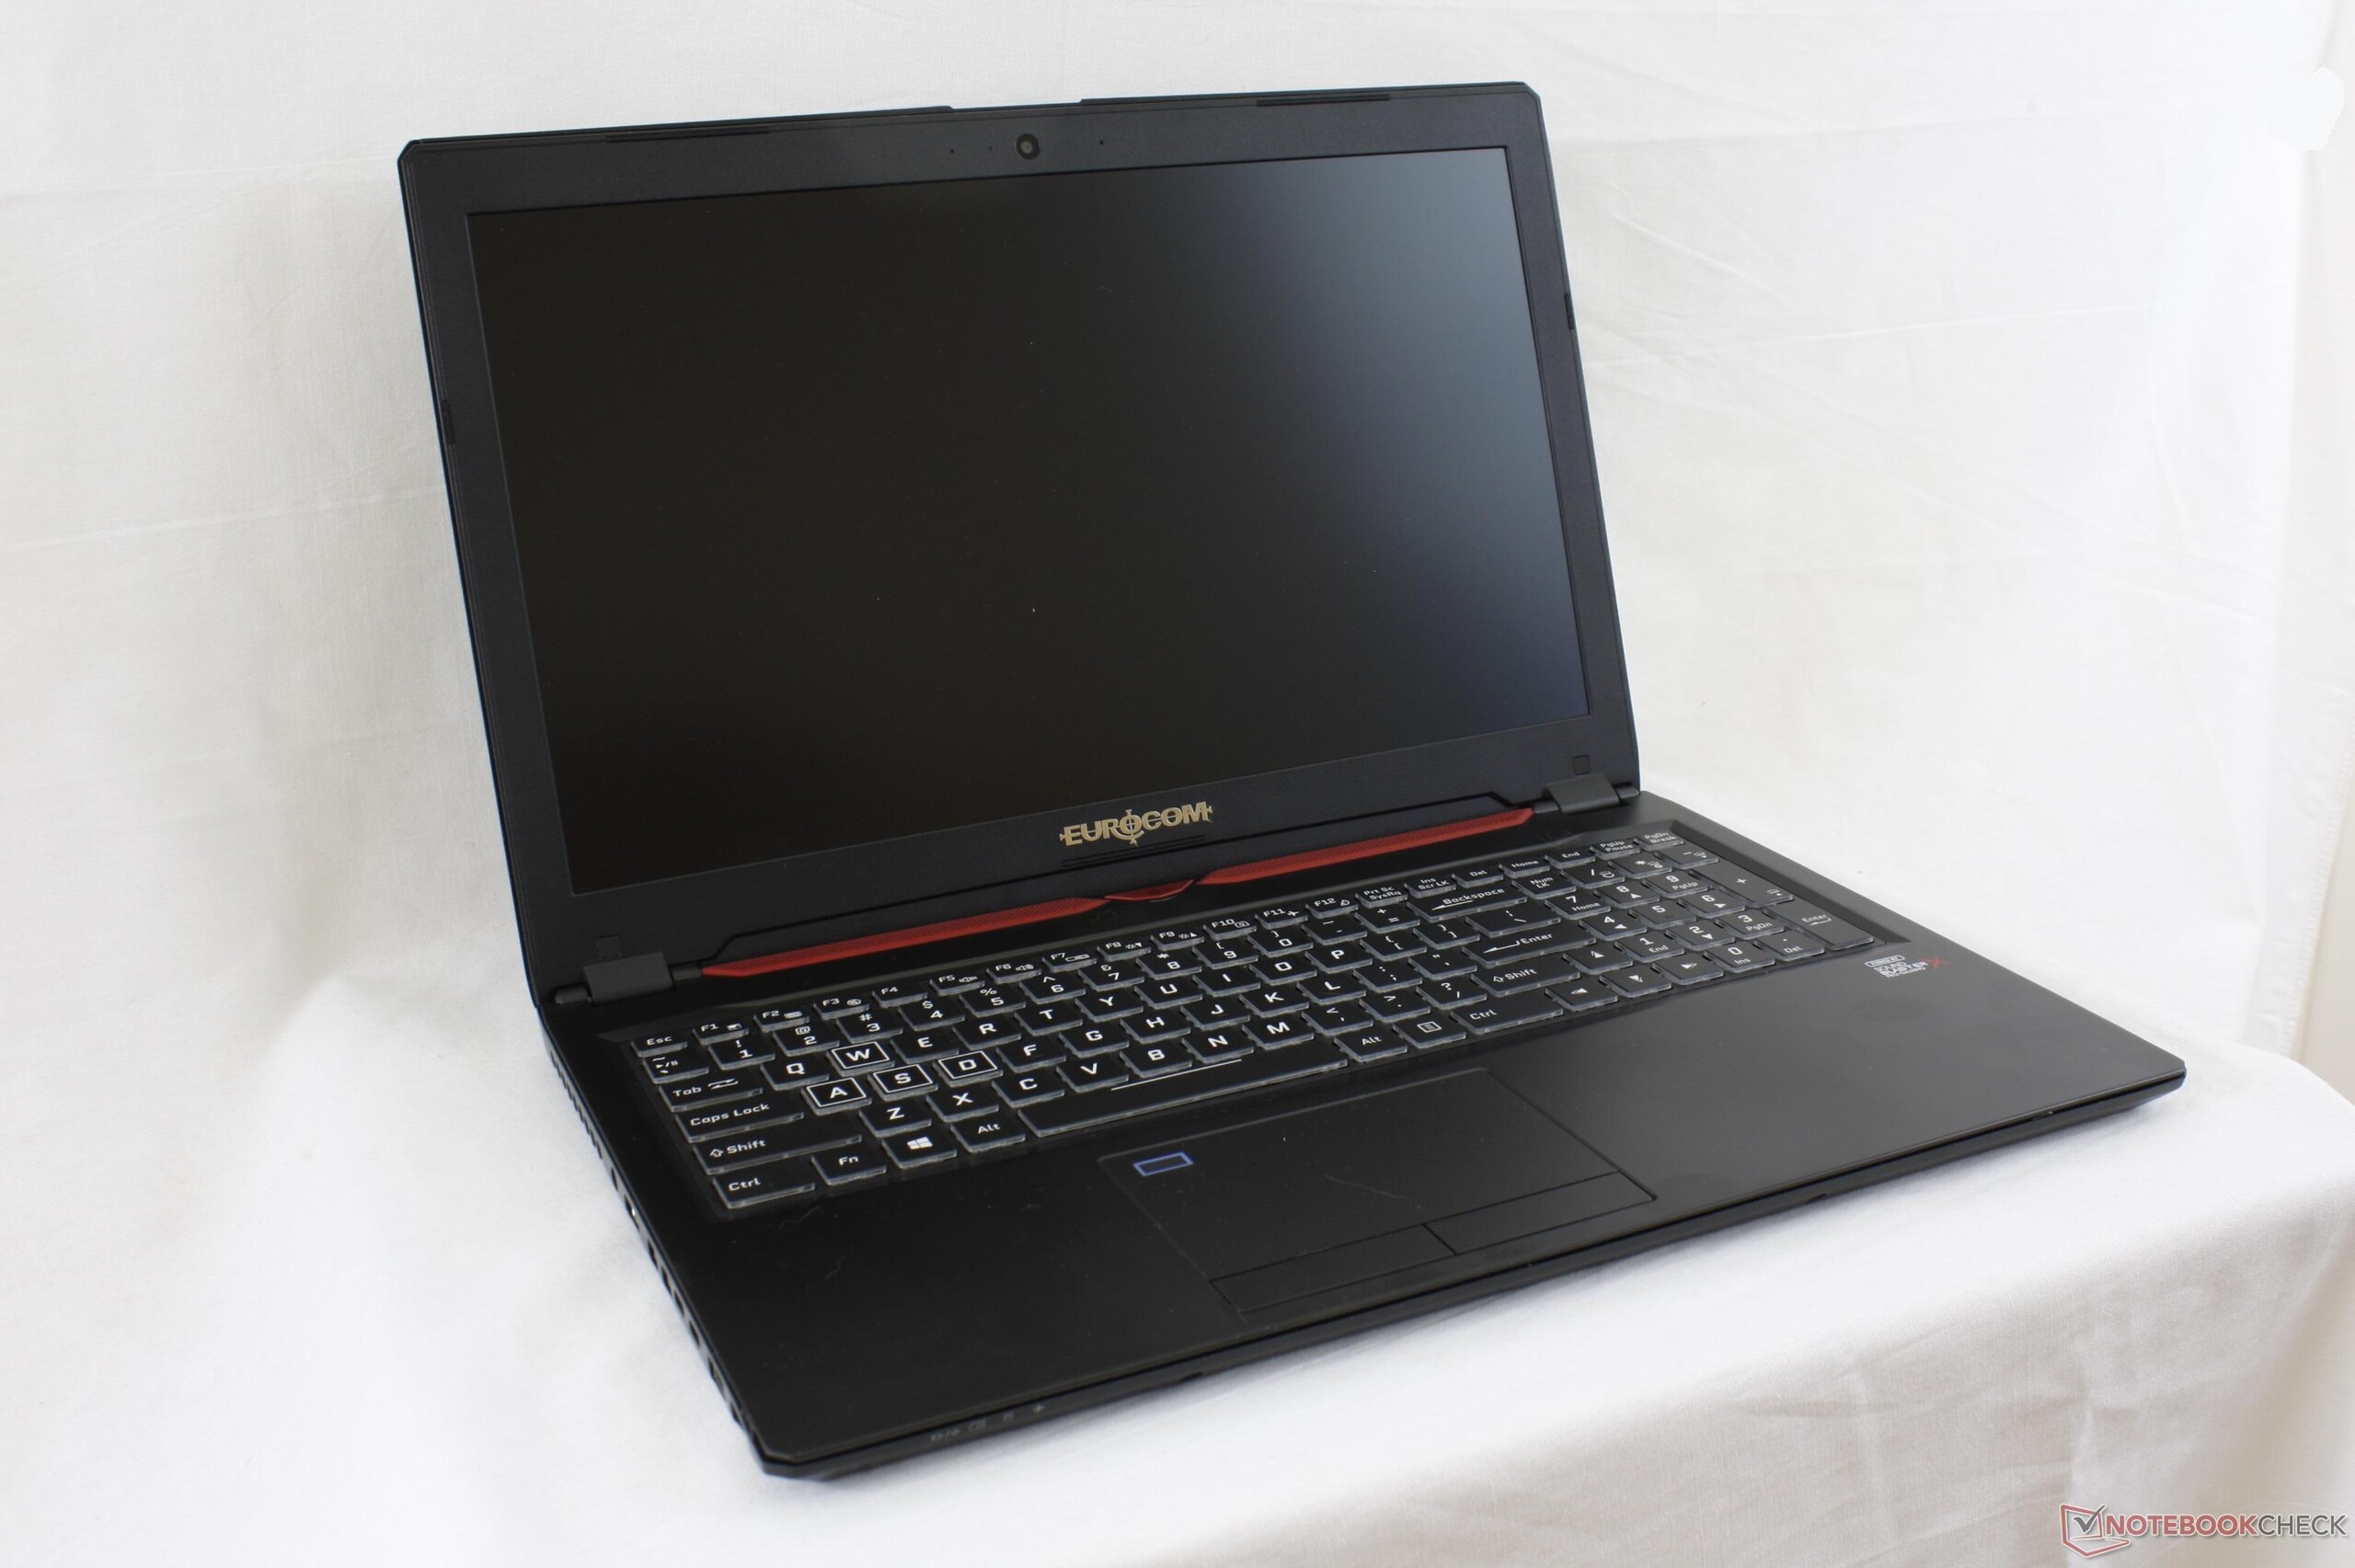
Breve Análise do Portátil Eurocom Q5 (Clevo P957HR, i7-7700HQ, GTX 1070 Max-Q)


| SD Card Reader | |
| average JPG Copy Test (av. of 3 runs) | |
| Eurocom Q5 | |
| HP Omen 15-ce002ng | |
| MSI GS63VR-6RF16H22 Stealth Pro | |
| maximum AS SSD Seq Read Test (1GB) | |
| Eurocom Q5 | |
| HP Omen 15-ce002ng | |
| MSI GS63VR-6RF16H22 Stealth Pro | |
| Networking | |
| iperf3 transmit AX12 | |
| Alienware 15 R3 | |
| Eurocom Q5 | |
| Asus Zephyrus GX501VS | |
| iperf3 receive AX12 | |
| Alienware 15 R3 | |
| Eurocom Q5 | |
| Asus Zephyrus GX501VS | |
| |||||||||||||||||||||||||
iluminação: 87 %
iluminação com acumulador: 287.5 cd/m²
Contraste: 442:1 (Preto: 0.65 cd/m²)
ΔE ColorChecker Calman: 4.5 | ∀{0.5-29.43 Ø4.73}
ΔE Greyscale Calman: 4.6 | ∀{0.09-98 Ø4.97}
92.3% sRGB (Argyll 1.6.3 3D)
59% AdobeRGB 1998 (Argyll 1.6.3 3D)
64.4% AdobeRGB 1998 (Argyll 3D)
92.7% sRGB (Argyll 3D)
63% Display P3 (Argyll 3D)
Gamma: 2.39
CCT: 7393 K
| Eurocom Q5 ID: LGD04D4, Name: LG Philips LP156UD1-SPB1, IPS, 15.6", 3840x2160 | Asus Zephyrus GX501VS ID: AUO42ED, Name: AU Optronics B156HAN04.2, IPS, 15.6", 1920x1080 | HP Omen 15-ce002ng AUO42ED, IPS, 15.6", 1920x1080 | MSI GS63VR-6RF16H22 Stealth Pro Samsung 156HL01-104 (SDC324C) , IPS, 15.6", 1920x1080 | Gigabyte P56XT LG Philips LP156WF6 (LGD046F), IPS, 15.6", 1920x1080 | Alienware 15 R3 HPJGK_B156HTN (AUO51ED), TN, 15.6", 1920x1080 | |
|---|---|---|---|---|---|---|
| Display | -4% | 2% | 7% | -3% | 2% | |
| Display P3 Coverage (%) | 63 | 62.1 -1% | 65.8 4% | 67.8 8% | 64.8 3% | 66 5% |
| sRGB Coverage (%) | 92.7 | 85.6 -8% | 90.9 -2% | 97.4 5% | 84.6 -9% | 90.5 -2% |
| AdobeRGB 1998 Coverage (%) | 64.4 | 62.4 -3% | 66.5 3% | 69.7 8% | 61.8 -4% | 66.2 3% |
| Response Times | 1% | -21% | 10% | -1% | 41% | |
| Response Time Grey 50% / Grey 80% * (ms) | 32.4 ? | 33.2 ? -2% | 43.2 ? -33% | 37.2 ? -15% | 25 ? 23% | |
| Response Time Black / White * (ms) | 28.8 ? | 28 ? 3% | 31.2 ? -8% | 26 ? 10% | 24.8 ? 14% | 12 ? 58% |
| PWM Frequency (Hz) | 202 ? | 20000 ? | ||||
| Screen | 25% | 32% | 23% | 6% | -11% | |
| Brightness middle (cd/m²) | 287.5 | 307.1 7% | 304 6% | 293 2% | 301 5% | 386 34% |
| Brightness (cd/m²) | 279 | 309 11% | 289 4% | 279 0% | 280 0% | 382 37% |
| Brightness Distribution (%) | 87 | 86 -1% | 86 -1% | 84 -3% | 87 0% | 93 7% |
| Black Level * (cd/m²) | 0.65 | 0.35 46% | 0.26 60% | 0.33 49% | 0.32 51% | 0.39 40% |
| Contrast (:1) | 442 | 877 98% | 1169 164% | 888 101% | 941 113% | 990 124% |
| Colorchecker dE 2000 * | 4.5 | 3.4 24% | 3.46 23% | 3.59 20% | 6.21 -38% | 10.2 -127% |
| Colorchecker dE 2000 max. * | 8.9 | 8.2 8% | 7.72 13% | 5.79 35% | 10.78 -21% | 15.81 -78% |
| Greyscale dE 2000 * | 4.6 | 1.4 70% | 2.46 47% | 3.86 16% | 6.08 -32% | 11.28 -145% |
| Gamma | 2.39 92% | 2.19 100% | 2.38 92% | 2.53 87% | 2.31 95% | 2.23 99% |
| CCT | 7393 88% | 6558 99% | 6915 94% | 7229 90% | 7375 88% | 11383 57% |
| Color Space (Percent of AdobeRGB 1998) (%) | 59 | 55.6 -6% | 59 0% | 63 7% | 55 -7% | 59 0% |
| Color Space (Percent of sRGB) (%) | 92.3 | 85 -8% | 91 -1% | 97 5% | 84 -9% | 90 -2% |
| Média Total (Programa/Configurações) | 7% /
16% | 4% /
19% | 13% /
19% | 1% /
3% | 11% /
-2% |
* ... menor é melhor
Exibir tempos de resposta
| ↔ Tempo de resposta preto para branco | ||
|---|---|---|
| 28.8 ms ... ascensão ↗ e queda ↘ combinadas | ↗ 18.8 ms ascensão | 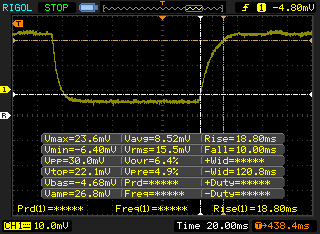 |
| ↘ 10 ms queda | ||
| A tela mostra taxas de resposta relativamente lentas em nossos testes e pode ser muito lenta para os jogadores. Em comparação, todos os dispositivos testados variam de 0.1 (mínimo) a 240 (máximo) ms. » 76 % de todos os dispositivos são melhores. Isso significa que o tempo de resposta medido é pior que a média de todos os dispositivos testados (19.9 ms). | ||
| ↔ Tempo de resposta 50% cinza a 80% cinza | ||
| 32.4 ms ... ascensão ↗ e queda ↘ combinadas | ↗ 16 ms ascensão | 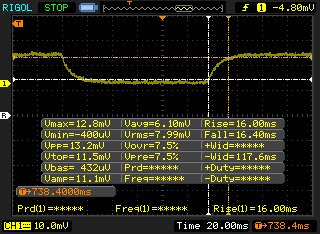 |
| ↘ 16.4 ms queda | ||
| A tela mostra taxas de resposta lentas em nossos testes e será insatisfatória para os jogadores. Em comparação, todos os dispositivos testados variam de 0.165 (mínimo) a 636 (máximo) ms. » 44 % de todos os dispositivos são melhores. Isso significa que o tempo de resposta medido é semelhante à média de todos os dispositivos testados (31.1 ms). | ||
Cintilação da tela / PWM (modulação por largura de pulso)
| Tela tremeluzindo / PWM não detectado | 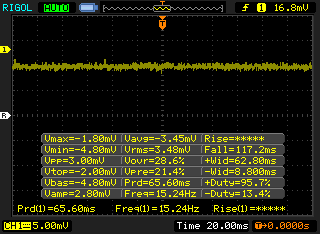 | ||
[pwm_comparison] Em comparação: 52 % de todos os dispositivos testados não usam PWM para escurecer a tela. Se PWM foi detectado, uma média de 7791 (mínimo: 5 - máximo: 343500) Hz foi medida. | |||
| wPrime 2.10 - 1024m | |
| Lenovo IdeaPad Y50 | |
| Eurocom Q5 | |
| EVGA SC17 GTX 1070 | |
| Asus Zephyrus GX501VS | |
| Gigabyte P55 V4 | |
| Eurocom Tornado F5 | |
* ... menor é melhor
| PCMark 8 | |
| Home Score Accelerated v2 | |
| Eurocom Tornado F5 | |
| Asus Zephyrus GX501VS | |
| MSI GS63VR-6RF16H22 Stealth Pro | |
| Eurocom Q5 | |
| Work Score Accelerated v2 | |
| Eurocom Tornado F5 | |
| Asus Zephyrus GX501VS | |
| Eurocom Q5 | |
| MSI GS63VR-6RF16H22 Stealth Pro | |
| Creative Score Accelerated v2 | |
| Eurocom Tornado F5 | |
| Asus Zephyrus GX501VS | |
| MSI GS63VR-6RF16H22 Stealth Pro | |
| Eurocom Q5 | |
| PCMark 8 Home Score Accelerated v2 | 3829 pontos | |
| PCMark 8 Creative Score Accelerated v2 | 4926 pontos | |
| PCMark 8 Work Score Accelerated v2 | 4891 pontos | |
| PCMark 10 Score | 5119 pontos | |
Ajuda | ||
| Eurocom Q5 Samsung SSD 960 Pro 512 GB m.2 | Asus Zephyrus GX501VS Samsung SM961 MZVPW256HEGL | EVGA SC17 GTX 1070 Samsung SM951 MZVPV256 m.2 | Eurocom Tornado F5 Samsung SSD 960 Pro 512 GB m.2 | Alienware 17 R4 SK Hynix PC300 NVMe 512 GB | |
|---|---|---|---|---|---|
| AS SSD | -5% | -22% | 17% | -53% | |
| Copy Game MB/s (MB/s) | 682 | 719 5% | 1034 52% | 1310 92% | 574 -16% |
| Copy Program MB/s (MB/s) | 301.5 | 383.3 27% | 470 56% | 635 111% | 446.1 48% |
| Copy ISO MB/s (MB/s) | 1967 | 1795 -9% | 1337 -32% | 1614 -18% | 1227 -38% |
| Score Total (Points) | 4001 | 3995 0% | 2328 -42% | 3943 -1% | 2072 -48% |
| Score Write (Points) | 1705 | 1293 -24% | 487 -71% | 1689 -1% | 858 -50% |
| Score Read (Points) | 1529 | 1818 19% | 1238 -19% | 1512 -1% | 831 -46% |
| Access Time Write * (ms) | 0.028 | 0.032 -14% | 0.033 -18% | 0.024 14% | 0.123 -339% |
| Access Time Read * (ms) | 0.036 | 0.047 -31% | 0.049 -36% | 0.03 17% | 0.042 -17% |
| 4K-64 Write (MB/s) | 1366 | 1035 -24% | 260.9 -81% | 1334 -2% | 671 -51% |
| 4K-64 Read (MB/s) | 1231 | 1527 24% | 999 -19% | 1179 -4% | 620 -50% |
| 4K Write (MB/s) | 136.2 | 117.3 -14% | 112.1 -18% | 150.5 10% | 113.4 -17% |
| 4K Read (MB/s) | 49.3 | 50.2 2% | 45.64 -7% | 51 3% | 35.61 -28% |
| Seq Write (MB/s) | 2029 | 1409 -31% | 1144 -44% | 2046 1% | 735 -64% |
| Seq Read (MB/s) | 2493 | 2412 -3% | 1934 -22% | 2819 13% | 1752 -30% |
* ... menor é melhor

| 3DMark | |
| 1920x1080 Fire Strike Graphics | |
| MSI GT75VR 7RF-012 Titan Pro | |
| Asus Zephyrus GX501 | |
| Asus Zephyrus GX501VS | |
| Eurocom Q5 | |
| Nvidia GeForce GTX 1060 Founders Edition 6 GB | |
| HP Omen 15-ce002ng | |
| Eurocom P5 Pro Extreme | |
| MSI GP62 7REX-1045US | |
| Dell Inspiron 15 7000 7567 Gaming (Core i5-7300HQ, GTX 1050) | |
| 3840x2160 Fire Strike Ultra Graphics | |
| Asus Zephyrus GX501 | |
| Asus Zephyrus GX501VS | |
| Eurocom Q5 | |
| Nvidia GeForce GTX 1060 Founders Edition 6 GB | |
| MSI GP62 7REX-1045US | |
| Dell Inspiron 15 7000 7567 Gaming (Core i5-7300HQ, GTX 1050) | |
| 3DMark 11 | |
| 1280x720 Performance GPU | |
| MSI GT75VR 7RF-012 Titan Pro | |
| Asus Zephyrus GX501 | |
| Asus Zephyrus GX501VS | |
| Eurocom Q5 | |
| Nvidia GeForce GTX 1060 Founders Edition 6 GB | |
| HP Omen 15-ce002ng | |
| Eurocom P5 Pro Extreme | |
| MSI GP62 7REX-1045US | |
| Dell Inspiron 15 7000 7567 Gaming (Core i5-7300HQ, GTX 1050) | |
| 1280x720 Performance Combined | |
| Nvidia GeForce GTX 1060 Founders Edition 6 GB | |
| MSI GT75VR 7RF-012 Titan Pro | |
| Eurocom P5 Pro Extreme | |
| Eurocom Q5 | |
| Asus Zephyrus GX501VS | |
| HP Omen 15-ce002ng | |
| Asus Zephyrus GX501 | |
| MSI GP62 7REX-1045US | |
| Dell Inspiron 15 7000 7567 Gaming (Core i5-7300HQ, GTX 1050) | |
| 3DMark 11 Performance | 14947 pontos | |
| 3DMark Cloud Gate Standard Score | 25659 pontos | |
| 3DMark Fire Strike Score | 12028 pontos | |
| 3DMark Fire Strike Extreme Score | 6354 pontos | |
Ajuda | ||
| Rise of the Tomb Raider - 1920x1080 Very High Preset AA:FX AF:16x | |
| Aorus X7 DT v6 | |
| Asus Zephyrus GX501 | |
| MSI Gaming Z GeForce GTX 1070 OC Bios Desktop PC | |
| Eurocom Sky MX5 R3 | |
| Asus Zephyrus GX501VS | |
| Eurocom Q5 | |
| MSI GS43VR 7RE-069US | |
| Asus Strix GL502VY-DS71 | |
| HP Omen 15-ce002ng | |
| Asus Strix GL502VT-DS74 | |
| BioShock Infinite - 1920x1080 Ultra Preset, DX11 (DDOF) | |
| Aorus X7 DT v6 | |
| MSI Gaming Z GeForce GTX 1070 OC Bios Desktop PC | |
| Aorus X7 v7 | |
| Eurocom Sky MX5 R3 | |
| Asus Zephyrus GX501VS | |
| Eurocom Q5 | |
| MSI GS43VR 7RE-069US | |
| Asus Strix GL502VY-DS71 | |
| Asus Strix GL502VT-DS74 | |
| Fallout 4 - 1920x1080 Ultra Preset AA:T AF:16x | |
| Aorus X7 DT v6 | |
| MSI Gaming Z GeForce GTX 1070 OC Bios Desktop PC | |
| Eurocom Sky MX5 R3 | |
| Asus Zephyrus GX501VS | |
| Eurocom Q5 | |
| MSI GS43VR 7RE-069US | |
| Asus Strix GL502VY-DS71 | |
| Asus Strix GL502VT-DS74 | |
| baixo | média | alto | ultra | 4K | |
|---|---|---|---|---|---|
| Guild Wars 2 (2012) | 62.2 | ||||
| BioShock Infinite (2013) | 130.5 | ||||
| Metro: Last Light (2013) | 96.5 | ||||
| Thief (2014) | 95.1 | ||||
| The Witcher 3 (2015) | 46 | ||||
| Batman: Arkham Knight (2015) | 73 | 37 | |||
| Metal Gear Solid V (2015) | 60 | 59 | |||
| Fallout 4 (2015) | 88.4 | 34.3 | |||
| Rise of the Tomb Raider (2016) | 79.7 | 33.6 | |||
| Ashes of the Singularity (2016) | 67 | 65.2 | |||
| Overwatch (2016) | 136.2 | 70.1 | |||
| Mafia 3 (2016) | 51.6 | 20.6 | |||
| Prey (2017) | 138.7 | 48.1 | |||
| Dirt 4 (2017) | 71.8 | 40.5 | |||
| F1 2017 (2017) | 80 | 36 |
Barulho
| Ocioso |
| 31.5 / 33.8 / 33.8 dB |
| Carga |
| 41.7 / 54.2 dB |
 | ||
30 dB silencioso 40 dB(A) audível 50 dB(A) ruidosamente alto |
||
min: | ||
| Eurocom Q5 GeForce GTX 1070 Max-Q, i7-7700HQ, Samsung SSD 960 Pro 512 GB m.2 | Asus Zephyrus GX501VS GeForce GTX 1070 Max-Q, i7-7700HQ, Samsung SM961 MZVPW256HEGL | Gigabyte P56XT GeForce GTX 1070 Mobile, i7-7700HQ, LiteOn CX2-8B256 | Alienware 15 R3 GeForce GTX 1070 Mobile, i7-7700HQ | EVGA SC15 GeForce GTX 1060 Mobile, i7-7700HQ, Toshiba NVMe THNSN5256GPU7 | HP Omen 15-ce002ng GeForce GTX 1060 Max-Q, i7-7700HQ, Samsung PM961 MZVLW256HEHP | |
|---|---|---|---|---|---|---|
| Noise | 9% | -4% | -5% | 4% | 1% | |
| desligado / ambiente * (dB) | 29 | 28.5 2% | 30 -3% | 30 -3% | 28 3% | 30 -3% |
| Idle Minimum * (dB) | 31.5 | 28.5 10% | 34 -8% | 31 2% | 31.9 -1% | 30 5% |
| Idle Average * (dB) | 33.8 | 28.5 16% | 35 -4% | 32 5% | 32 5% | 33 2% |
| Idle Maximum * (dB) | 33.8 | 30.1 11% | 39 -15% | 42 -24% | 32 5% | 37 -9% |
| Load Average * (dB) | 41.7 | 35.2 16% | 39 6% | 49 -18% | 36.5 12% | 41 2% |
| Witcher 3 ultra * (dB) | 41.7 | 41.7 -0% | 48 -15% | 40.3 3% | 42 -1% | |
| Load Maximum * (dB) | 54.2 | 48.8 10% | 49 10% | 50 8% | 53.4 1% | 50 8% |
* ... menor é melhor
(-) A temperatura máxima no lado superior é 56.2 °C / 133 F, em comparação com a média de 40.4 °C / 105 F , variando de 21.2 a 68.8 °C para a classe Gaming.
(-) A parte inferior aquece até um máximo de 61.2 °C / 142 F, em comparação com a média de 43.2 °C / 110 F
(+) Em uso inativo, a temperatura média para o lado superior é 27.1 °C / 81 F, em comparação com a média do dispositivo de 33.9 °C / ### class_avg_f### F.
(-) Jogando The Witcher 3, a temperatura média para o lado superior é 41.9 °C / 107 F, em comparação com a média do dispositivo de 33.9 °C / ## #class_avg_f### F.
(±) Os apoios para as mãos e o touchpad podem ficar muito quentes ao toque, com um máximo de 38.6 °C / 101.5 F.
(-) A temperatura média da área do apoio para as mãos de dispositivos semelhantes foi 28.8 °C / 83.8 F (-9.8 °C / -17.7 F).
Eurocom Q5 análise de áudio
(-) | alto-falantes não muito altos (###valor### dB)
Graves 100 - 315Hz
(-) | quase nenhum baixo - em média 24% menor que a mediana
(+) | o baixo é linear (3.8% delta para a frequência anterior)
Médios 400 - 2.000 Hz
(±) | médios mais altos - em média 6.2% maior que a mediana
(±) | a linearidade dos médios é média (12.9% delta para frequência anterior)
Altos 2 - 16 kHz
(+) | agudos equilibrados - apenas 1.5% longe da mediana
(+) | os máximos são lineares (5.7% delta da frequência anterior)
Geral 100 - 16.000 Hz
(-) | o som geral não é linear (35.3% diferença em relação à mediana)
Comparado com a mesma classe
» 99% de todos os dispositivos testados nesta classe foram melhores, 0% semelhantes, 1% piores
» O melhor teve um delta de 6%, a média foi 18%, o pior foi 132%
Comparado com todos os dispositivos testados
» 93% de todos os dispositivos testados foram melhores, 1% semelhantes, 6% piores
» O melhor teve um delta de 4%, a média foi 24%, o pior foi 134%
Apple MacBook 12 (Early 2016) 1.1 GHz análise de áudio
(+) | os alto-falantes podem tocar relativamente alto (###valor### dB)
Graves 100 - 315Hz
(±) | graves reduzidos - em média 11.3% menor que a mediana
(±) | a linearidade dos graves é média (14.2% delta para a frequência anterior)
Médios 400 - 2.000 Hz
(+) | médios equilibrados - apenas 2.4% longe da mediana
(+) | médios são lineares (5.5% delta para frequência anterior)
Altos 2 - 16 kHz
(+) | agudos equilibrados - apenas 2% longe da mediana
(+) | os máximos são lineares (4.5% delta da frequência anterior)
Geral 100 - 16.000 Hz
(+) | o som geral é linear (10.2% diferença em relação à mediana)
Comparado com a mesma classe
» 7% de todos os dispositivos testados nesta classe foram melhores, 2% semelhantes, 91% piores
» O melhor teve um delta de 5%, a média foi 18%, o pior foi 53%
Comparado com todos os dispositivos testados
» 5% de todos os dispositivos testados foram melhores, 1% semelhantes, 94% piores
» O melhor teve um delta de 4%, a média foi 24%, o pior foi 134%
| desligado | |
| Ocioso | |
| Carga |
|
Key:
min: | |
| Eurocom Q5 i7-7700HQ, GeForce GTX 1070 Max-Q, Samsung SSD 960 Pro 512 GB m.2, IPS, 3840x2160, 15.6" | Asus Zephyrus GX501VS i7-7700HQ, GeForce GTX 1070 Max-Q, Samsung SM961 MZVPW256HEGL, IPS, 1920x1080, 15.6" | Asus Zephyrus GX501 i7-7700HQ, GeForce GTX 1080 Max-Q, Samsung SSD SM961 1TB M.2 MZVKW1T0HMLH, IPS, 1920x1080, 15.6" | EVGA SC15 i7-7700HQ, GeForce GTX 1060 Mobile, Toshiba NVMe THNSN5256GPU7, , 1920x1080, 15.6" | Gigabyte P56XT i7-7700HQ, GeForce GTX 1070 Mobile, LiteOn CX2-8B256, IPS, 1920x1080, 15.6" | HP Omen 15-ce002ng i7-7700HQ, GeForce GTX 1060 Max-Q, Samsung PM961 MZVLW256HEHP, IPS, 1920x1080, 15.6" | |
|---|---|---|---|---|---|---|
| Power Consumption | -37% | -54% | -61% | -30% | -43% | |
| Idle Minimum * (Watt) | 9 | 19.1 -112% | 18 -100% | 25.8 -187% | 13 -44% | 18 -100% |
| Idle Average * (Watt) | 13.5 | 20.8 -54% | 23 -70% | 26.6 -97% | 17 -26% | 23 -70% |
| Idle Maximum * (Watt) | 13.7 | 21.8 -59% | 31 -126% | 26.7 -95% | 22 -61% | 30 -119% |
| Load Average * (Watt) | 87.8 | 73.7 16% | 79 10% | 80.3 9% | 85 3% | 85 3% |
| Witcher 3 ultra * (Watt) | 129 | 130.2 -1% | 148 -15% | 121.2 6% | 154 -19% | 96 26% |
| Load Maximum * (Watt) | 158.6 | 173.1 -9% | 196 -24% | 159.3 -0% | 208 -31% | 158 -0% |
* ... menor é melhor
| Eurocom Q5 i7-7700HQ, GeForce GTX 1070 Max-Q, 55 Wh | Asus Zephyrus GX501VS i7-7700HQ, GeForce GTX 1070 Max-Q, 50 Wh | HP Omen 15-ce002ng i7-7700HQ, GeForce GTX 1060 Max-Q, 70 Wh | Gigabyte P56XT i7-7700HQ, GeForce GTX 1070 Mobile, 91.2 Wh | EVGA SC15 i7-7700HQ, GeForce GTX 1060 Mobile, 62 Wh | Alienware 15 R3 i7-7700HQ, GeForce GTX 1070 Mobile, 99 Wh | |
|---|---|---|---|---|---|---|
| Duração da bateria | -31% | -2% | 74% | -4% | 32% | |
| Reader / Idle (h) | 7.8 | 3.8 -51% | 4.3 -45% | 9.5 22% | 3.7 -53% | 6.4 -18% |
| WiFi v1.3 (h) | 4.3 | 2.5 -42% | 3.3 -23% | 6.4 49% | 2.8 -35% | 4.4 2% |
| Load (h) | 0.8 | 0.8 0% | 1.3 63% | 2 150% | 1.4 75% | 1.7 113% |
Pro
Contra
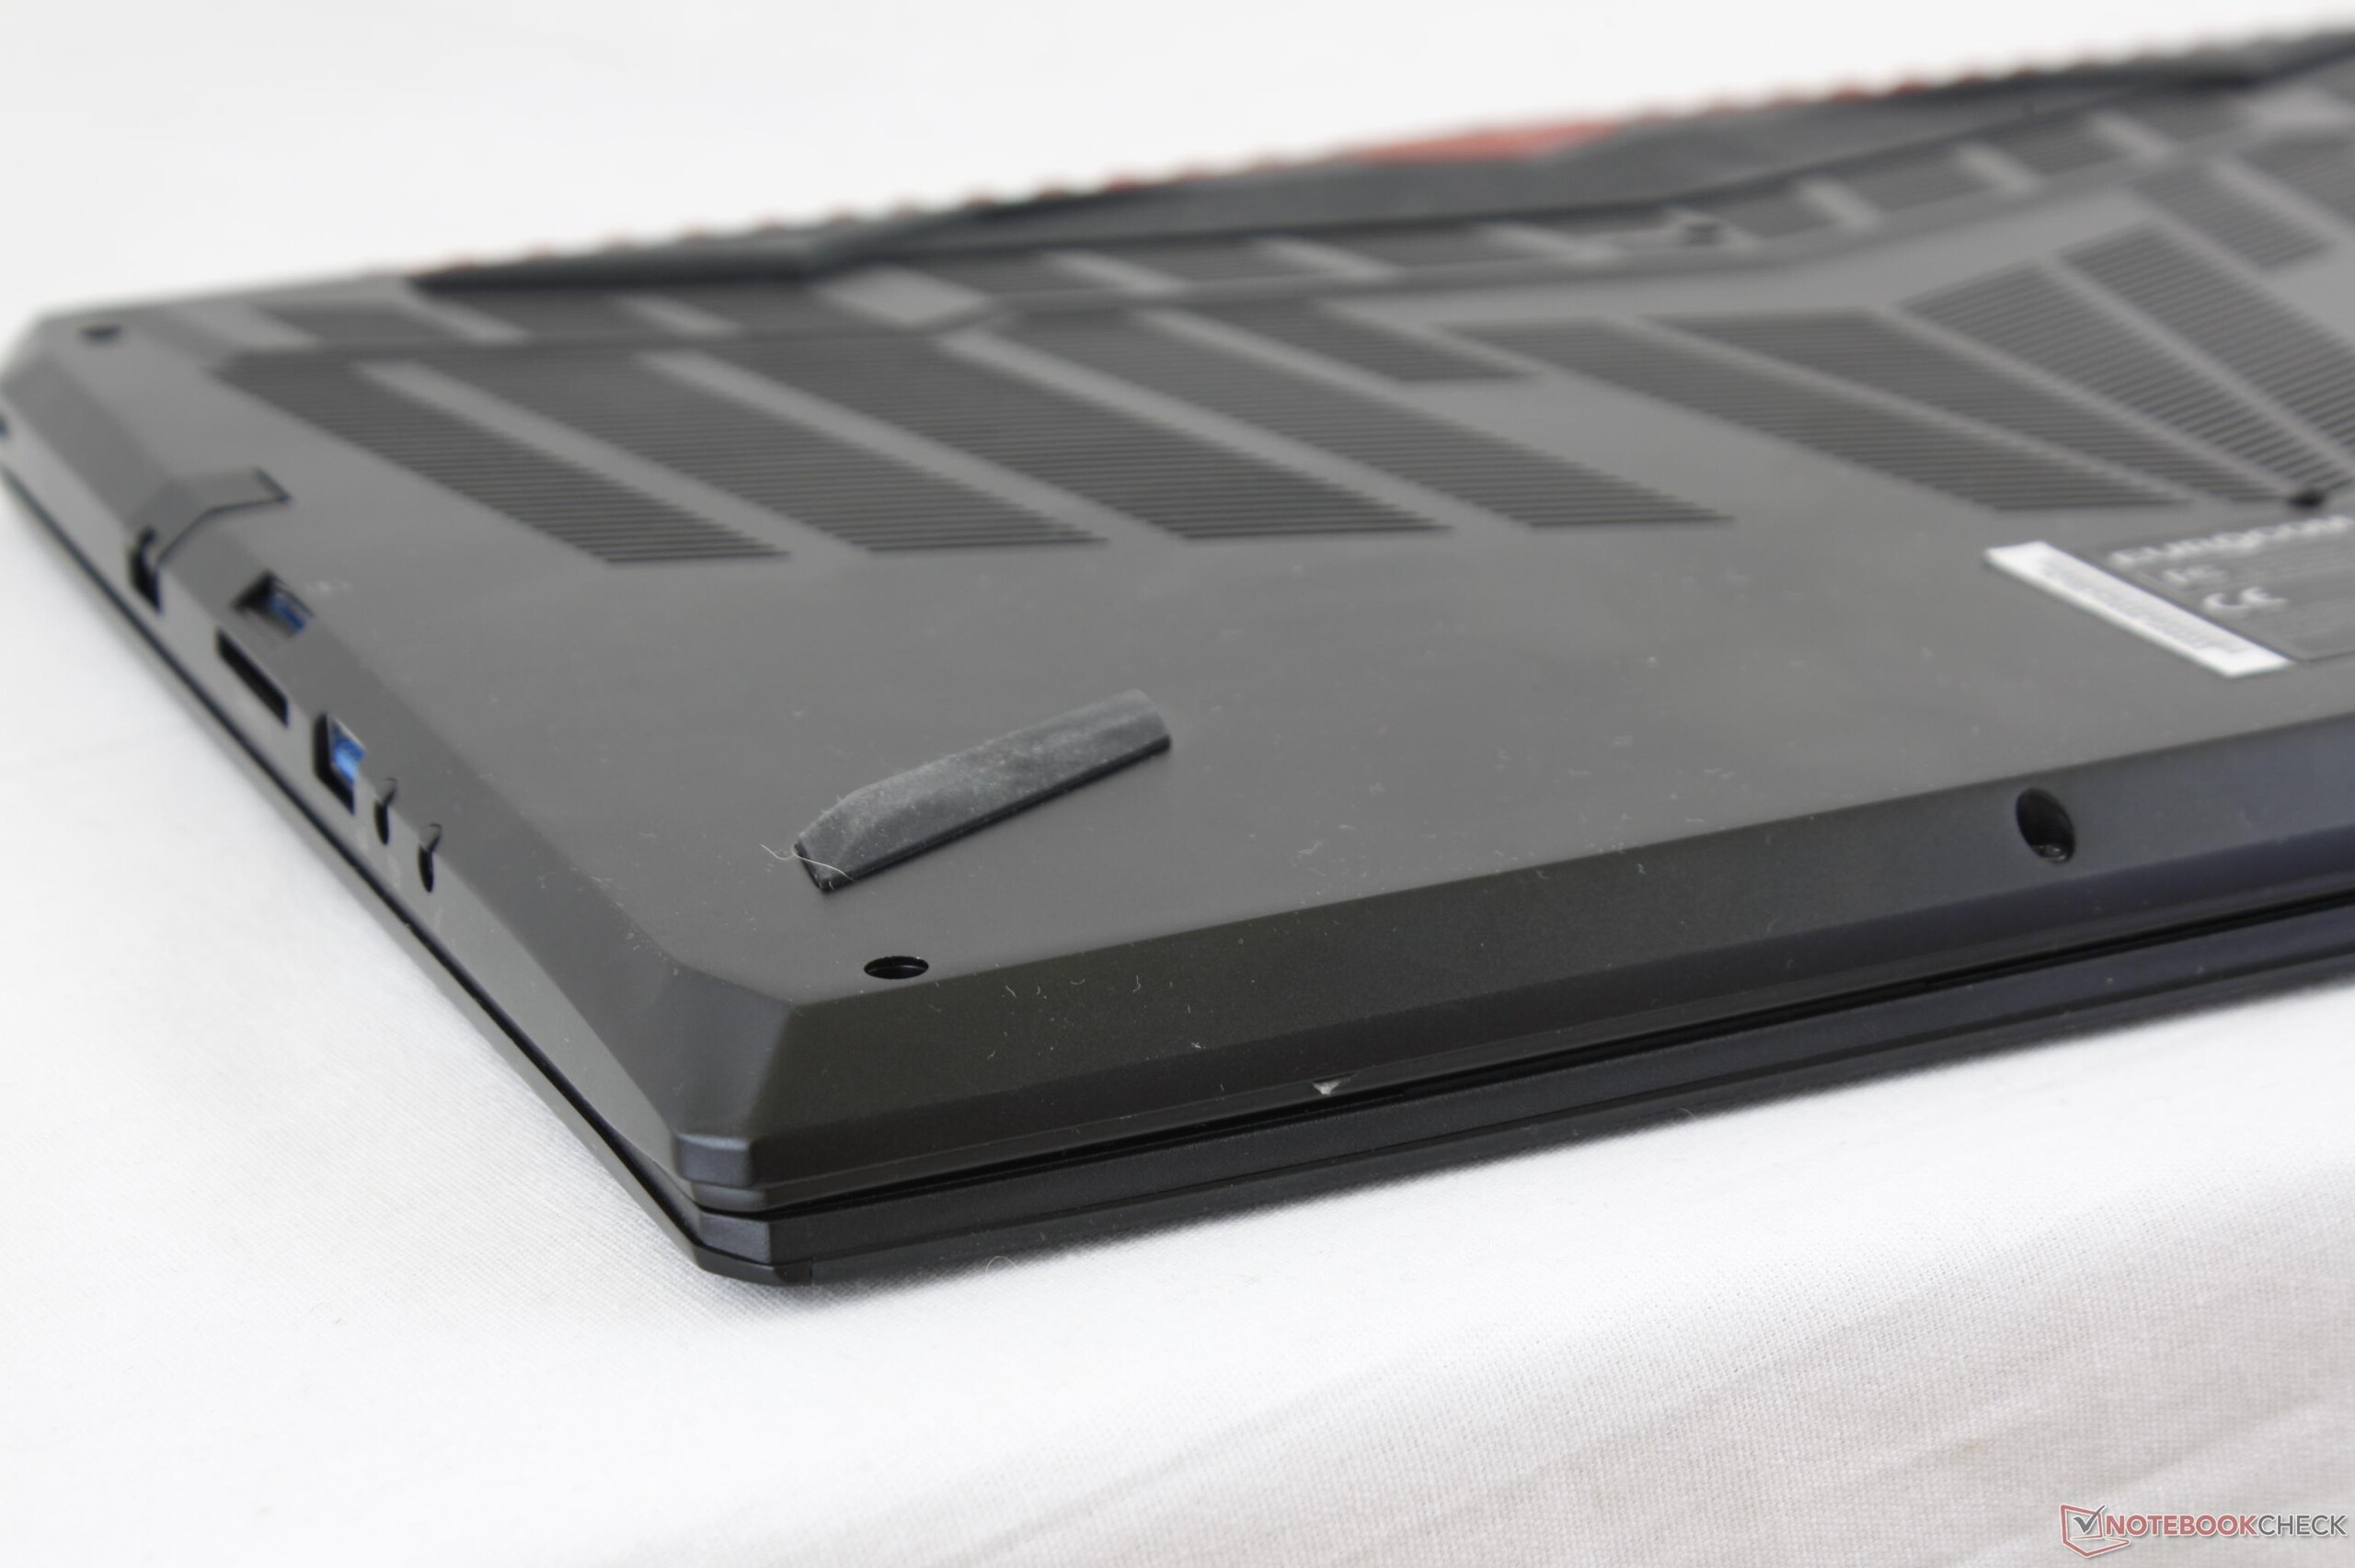
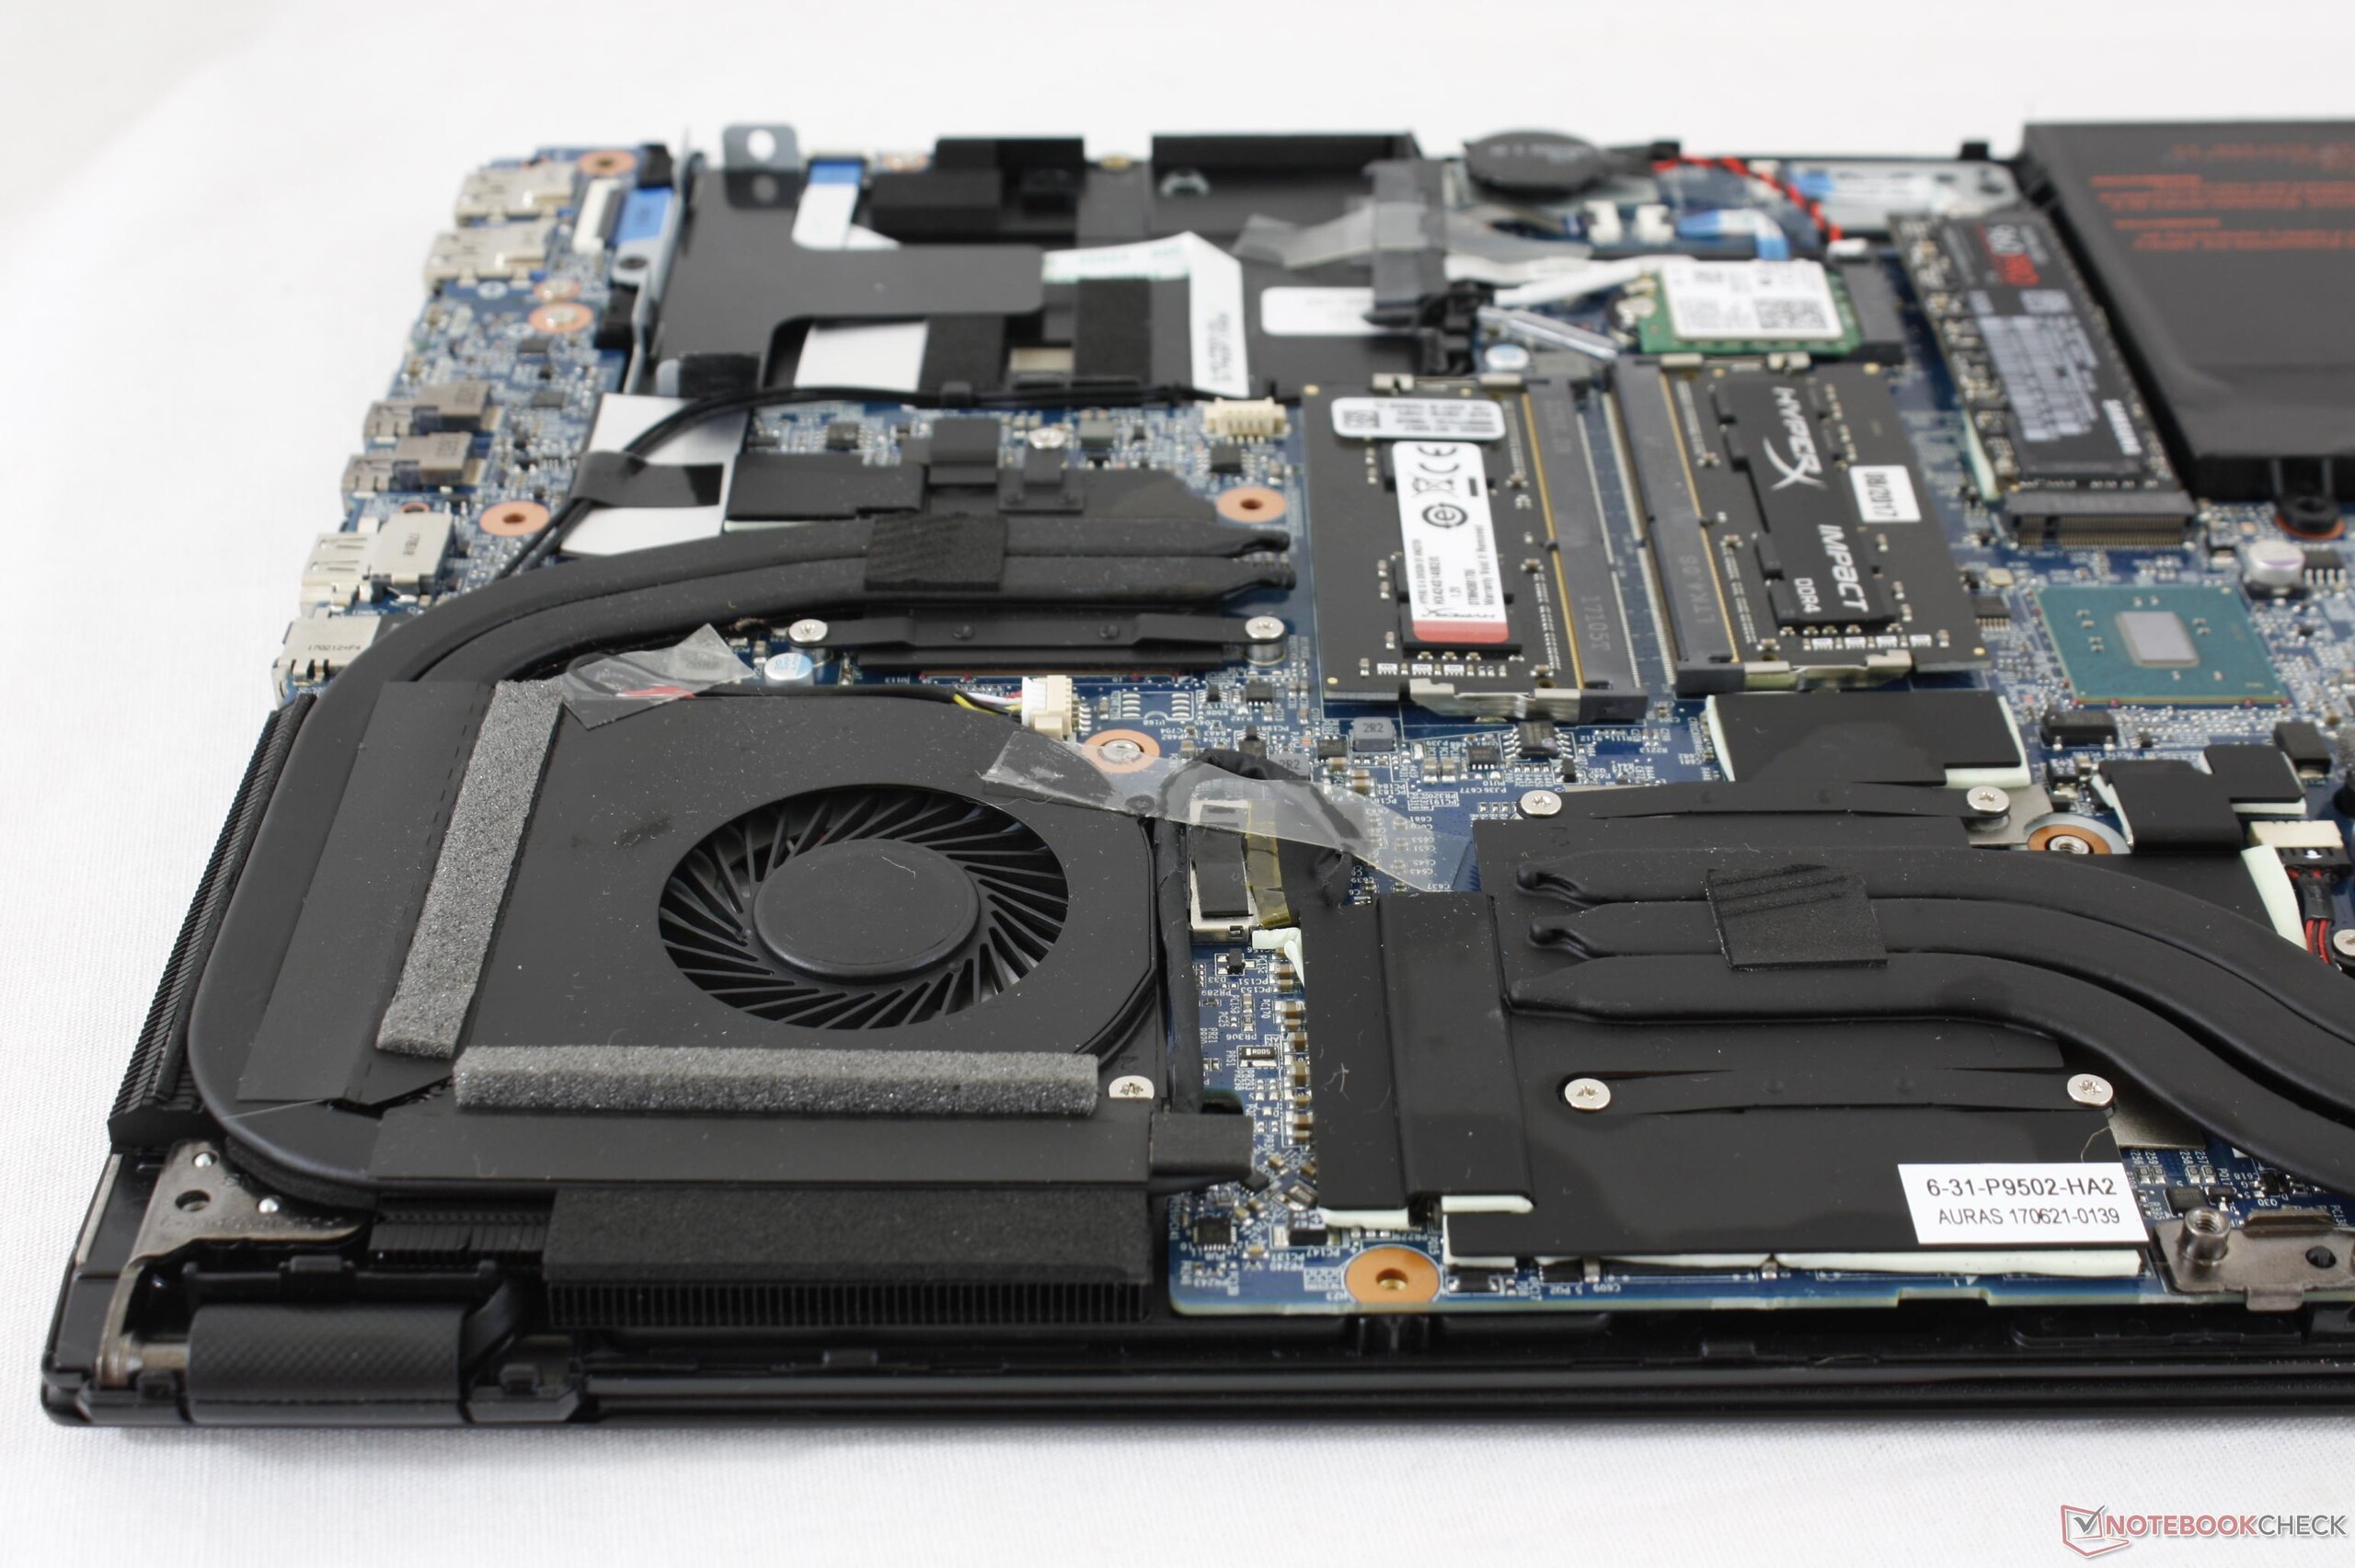
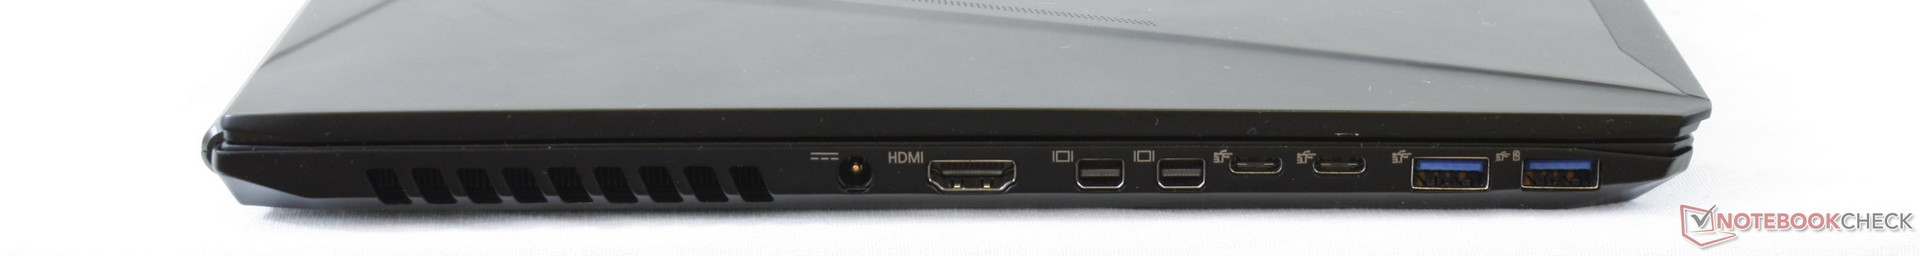
No valor nominal, o Q5 é quase tudo o que queríamos de um portátil de jogos Max-Q. Facilidade de manutenção, perfil fino e atraente, múltiplas opções de tela, duas baías internas de armazenamento, muitas portas, Optimus e até suporte para SIM. No entanto, indo mais fundo nos detalhes, o sistema tem um longo caminho a percorrer contra os modelos de Max-Q concorrentes, como o Zephyrus.
Por um lado, o modo automático predefinido da ventoinha deve ser alterado para atender aos padrões de ruído da ventoinha Max-Q. Os usuários terão que ajustar a velocidade da ventoinha manualmente para 55% para uma experiência "real" de Max-Q. Caso não consiga fazer isso, o Q5 funcionará tão alto quanto os portáteis de jogos que não são Max-Q que não estão equipados com gráficos GTX 1070 ou melhores. Afinal, por que comprar um portátil Max-Q se ele não funcionar mais silencioso do que uma alternativa ultrafina mais poderosa?
Em segundo lugar, as temperaturas do núcleo são mais quentes do que no Zephyrus quando ajustado para a configuração de velocidade do ventilador de 55 por cento. Assim, quando submetidos às mesmas cargas de jogos e leituras de ruído da ventoinha idênticas, o portátil Asus ainda funcionará frio.
Por fim, o GTX 1070 Max-Q no Q5 é consistentemente mais lento que o da mesma GPU na alternativa Asus. Sua velocidade mais lenta, em combinação com temperaturas mais elevadas do núcleo, pode ser um impedimento para os olhos de gamers hardcore. Se você quiser o melhor que a GTX 1070 Max-Q tem para oferecer, o Q5 não é a melhor opção de portátil. Se os amplos recursos auxiliares e as opções de conectividade forem importantes em relação ao barebone Zephyr, no entanto, o Q5 mais econômico ainda poderia ser um portátil Max-Q convincente.
É claro que o Q5 e sua solução de resfriamento ainda não foram totalmente otimizados para o Max-Q, pois as velocidades e as temperaturas são desfavoráveis contra a concorrência. Futuros SKUs equipados com o menos exigente GTX 1060 Max-Q teoricamente seriam uma melhor combinação para este chassi em particular. Além disso, os recursos auxiliares e opções configuráveis fora da CPU e GPU são os mais abundantes ainda para um portátil superfino Max-Q.
Eurocom Q5
- 09/07/2017 v6 (old)
Allen Ngo
Price comparison
