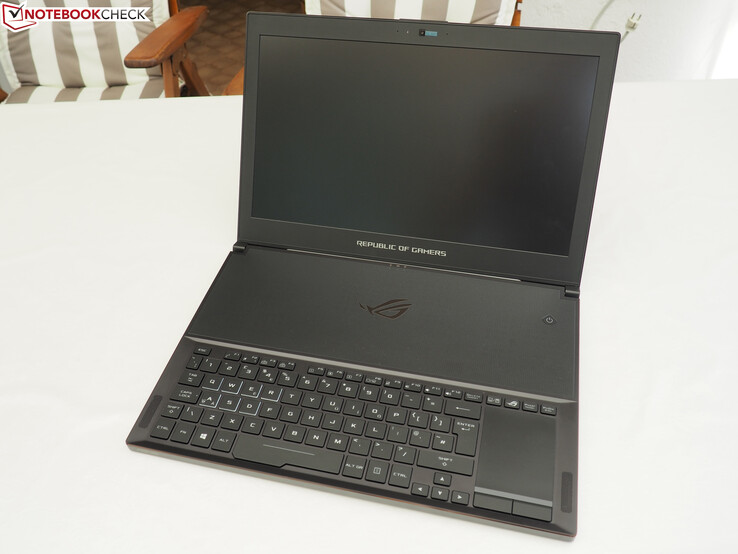
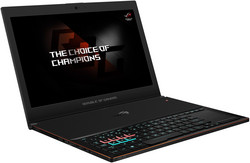
Breve Análise do Portátil Asus ROG Zephyrus GX501
Os Top 10
» Os Top 10 Portáteis Multimídia
» Os Top 10 Portáteis de Jogos
» Os Top 10 Portáteis Leves para Jogos
» Os Top 10 Portáteis Acessíveis de Escritório/Empresariais
» Os Top 10 Portáteis Premium de Escritório/Empresariais
» Os Top 10 dos Portáteis Workstation
» Os Top 10 Subportáteis
» Os Top 10 Ultrabooks
» Os Top 10 Conversíveis
» Os Top 10 Tablets
» Os Top 10 Smartphones
» A melhores Telas de Portáteis Analisadas Pela Notebookcheck
» Top 10 dos portáteis abaixo dos 500 Euros da Notebookcheck
» Top 10 dos Portáteis abaixo dos 300 Euros
Size Comparison
| |||||||||||||||||||||||||
iluminação: 83 %
iluminação com acumulador: 328 cd/m²
Contraste: 1312:1 (Preto: 0.25 cd/m²)
ΔE ColorChecker Calman: 6.02 | ∀{0.5-29.43 Ø4.76}
ΔE Greyscale Calman: 6.32 | ∀{0.09-98 Ø5}
92% sRGB (Argyll 1.6.3 3D)
60% AdobeRGB 1998 (Argyll 1.6.3 3D)
65.9% AdobeRGB 1998 (Argyll 3D)
91.8% sRGB (Argyll 3D)
64.8% Display P3 (Argyll 3D)
Gamma: 2.28
CCT: 8194 K
| Asus Zephyrus GX501 AUO B156HAN04.2 (AUO42ED), 1920x1080 | Alienware 15 R3 HPJGK_B156HTN (AUO51ED), 1920x1080 | Schenker XMG P507 PRO AUO B156HTN05.2 (AUO52ED), 1920x1080 | Asus FX502VM-AS73 1920x1080 | Gigabyte Aero 15 N156HCA-EA1 (CMN15D7), 1920x1080 | MSI GS63VR 7RF-228US 3840x2160 | |
|---|---|---|---|---|---|---|
| Display | 0% | -1% | -40% | 1% | -24% | |
| Display P3 Coverage (%) | 64.8 | 66 2% | 66.4 2% | 38.28 -41% | 65.2 1% | 48.21 -26% |
| sRGB Coverage (%) | 91.8 | 90.5 -1% | 88.9 -3% | 56.9 -38% | 92.5 1% | 72.6 -21% |
| AdobeRGB 1998 Coverage (%) | 65.9 | 66.2 0% | 65.1 -1% | 39.47 -40% | 66.5 1% | 49.81 -24% |
| Response Times | 44% | 46% | 19% | -20% | 17% | |
| Response Time Grey 50% / Grey 80% * (ms) | 40.4 ? | 25 ? 38% | 24 ? 41% | 28.4 ? 30% | 42.8 ? -6% | 28 ? 31% |
| Response Time Black / White * (ms) | 24 ? | 12 ? 50% | 12 ? 50% | 22.4 ? 7% | 32 ? -33% | 23.6 ? 2% |
| PWM Frequency (Hz) | 26000 ? | 1351 ? | ||||
| Screen | -23% | -30% | -39% | -3% | -32% | |
| Brightness middle (cd/m²) | 328 | 386 18% | 357 9% | 209.5 -36% | 320 -2% | 274.2 -16% |
| Brightness (cd/m²) | 305 | 382 25% | 365 20% | 205 -33% | 316 4% | 263 -14% |
| Brightness Distribution (%) | 83 | 93 12% | 85 2% | 92 11% | 90 8% | 92 11% |
| Black Level * (cd/m²) | 0.25 | 0.39 -56% | 0.5 -100% | 0.69 -176% | 0.36 -44% | 0.44 -76% |
| Contrast (:1) | 1312 | 990 -25% | 714 -46% | 304 -77% | 889 -32% | 623 -53% |
| Colorchecker dE 2000 * | 6.02 | 10.2 -69% | 9.93 -65% | 4.7 22% | 4.62 23% | 8 -33% |
| Colorchecker dE 2000 max. * | 10.14 | 15.81 -56% | 14.87 -47% | 19.7 -94% | 9.75 4% | 14.6 -44% |
| Greyscale dE 2000 * | 6.32 | 11.28 -78% | 10.32 -63% | 1.8 72% | 6 5% | 9.1 -44% |
| Gamma | 2.28 96% | 2.23 99% | 2.11 104% | 2.23 99% | 2.46 89% | 2.24 98% |
| CCT | 8194 79% | 11383 57% | 10096 64% | 6975 93% | 6761 96% | 5020 129% |
| Color Space (Percent of AdobeRGB 1998) (%) | 60 | 59 -2% | 58 -3% | 36.2 -40% | 60 0% | 45.7 -24% |
| Color Space (Percent of sRGB) (%) | 92 | 90 -2% | 89 -3% | 56.6 -38% | 92 0% | 72.1 -22% |
| Média Total (Programa/Configurações) | 7% /
-10% | 5% /
-14% | -20% /
-31% | -7% /
-5% | -13% /
-24% |
* ... menor é melhor
Exibir tempos de resposta
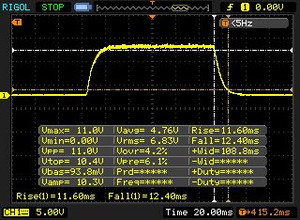
| ↔ Tempo de resposta preto para branco | ||
|---|---|---|
| 24 ms ... ascensão ↗ e queda ↘ combinadas | ↗ 11.6 ms ascensão | |
| ↘ 12.4 ms queda | ||
| A tela mostra boas taxas de resposta em nossos testes, mas pode ser muito lenta para jogadores competitivos. Em comparação, todos os dispositivos testados variam de 0.1 (mínimo) a 240 (máximo) ms. » 53 % de todos os dispositivos são melhores. Isso significa que o tempo de resposta medido é pior que a média de todos os dispositivos testados (20.1 ms). | ||
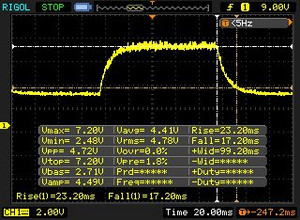
| ↔ Tempo de resposta 50% cinza a 80% cinza | ||
| 40.4 ms ... ascensão ↗ e queda ↘ combinadas | ↗ 23.2 ms ascensão | |
| ↘ 17.2 ms queda | ||
| A tela mostra taxas de resposta lentas em nossos testes e será insatisfatória para os jogadores. Em comparação, todos os dispositivos testados variam de 0.165 (mínimo) a 636 (máximo) ms. » 63 % de todos os dispositivos são melhores. Isso significa que o tempo de resposta medido é pior que a média de todos os dispositivos testados (31.5 ms). | ||
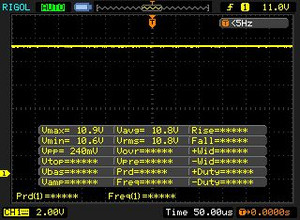
Cintilação da tela / PWM (modulação por largura de pulso)
| Tela tremeluzindo / PWM não detectado | |||
[pwm_comparison] Em comparação: 53 % de todos os dispositivos testados não usam PWM para escurecer a tela. Se PWM foi detectado, uma média de 8039 (mínimo: 5 - máximo: 343500) Hz foi medida. | |||
| PCMark 8 | |
| Home Score Accelerated v2 | |
| Asus Zephyrus GX501 | |
| Alienware 15 R3 | |
| Asus FX502VM-AS73 | |
| Schenker XMG P507 PRO | |
| Gigabyte Aero 15 | |
| MSI GS63VR 7RF-228US | |
| Work Score Accelerated v2 | |
| Alienware 15 R3 | |
| Gigabyte Aero 15 | |
| Asus Zephyrus GX501 | |
| MSI GS63VR 7RF-228US | |
| Schenker XMG P507 PRO | |
| Asus FX502VM-AS73 | |
| PCMark 10 - Score | |
| Asus Zephyrus GX501 | |
| PCMark 8 Home Score Accelerated v2 | 5057 pontos | |
| PCMark 8 Work Score Accelerated v2 | 5289 pontos | |
| PCMark 10 Score | 5125 pontos | |
Ajuda | ||
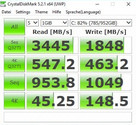
| Asus Zephyrus GX501 Samsung SSD SM961 1TB M.2 MZVKW1T0HMLH | Schenker XMG A517 Samsung SSD 960 Evo 500GB m.2 NVMe | Asus FX553VD-DM249T Hynix HFS128G39TND | |
|---|---|---|---|
| CrystalDiskMark 5.2 / 6 | 28% | -65% | |
| Read Seq Q32T1 (MB/s) | 3445 | 3389 -2% | 549 -84% |
| Write Seq Q32T1 (MB/s) | 1848 | 1706 -8% | 136.4 -93% |
| Read 4K Q32T1 (MB/s) | 547 | 627 15% | 288.6 -47% |
| Write 4K Q32T1 (MB/s) | 463 | 591 28% | 136.1 -71% |
| Read Seq (MB/s) | 954 | 1856 95% | 507 -47% |
| Write Seq (MB/s) | 1049 | 1652 57% | 135.9 -87% |
| Read 4K (MB/s) | 45 | 49 9% | 28.6 -36% |
| Write 4K (MB/s) | 149 | 196 32% | 71.2 -52% |
| 3DMark - 1920x1080 Fire Strike Graphics | |
| MSI GT73VR 7RF-296 | |
| Asus Zephyrus GX501 | |
| Alienware 15 R3 | |
| Schenker XMG P507 PRO | |
| Asus FX502VM-AS73 | |
| MSI GS63VR 7RF-228US | |
| Gigabyte Aero 15 | |
| 3DMark 11 - 1280x720 Performance GPU | |
| MSI GT73VR 7RF-296 | |
| Asus Zephyrus GX501 | |
| Alienware 15 R3 | |
| Schenker XMG P507 PRO | |
| Asus FX502VM-AS73 | |
| MSI GS63VR 7RF-228US | |
| Gigabyte Aero 15 | |
| Unigine Heaven 4.0 - Extreme Preset DX11 | |
| MSI GT73VR 7RF-296 | |
| Asus Zephyrus GX501 | |
| Alienware 15 R3 | |
| Schenker XMG P507 PRO | |
| Gigabyte Aero 15 | |
| 3DMark Vantage P Result | 39562 pontos | |
| 3DMark 11 Performance | 16821 pontos | |
| 3DMark Ice Storm Standard Score | 140964 pontos | |
| 3DMark Cloud Gate Standard Score | 27935 pontos | |
| 3DMark Fire Strike Score | 14260 pontos | |
| 3DMark Time Spy Score | 5390 pontos | |
Ajuda | ||
| The Witcher 3 | |
| 3840x2160 High Graphics & Postprocessing (Nvidia HairWorks Off) | |
| Asus G800VI Prototype | |
| Asus Zephyrus GX501 | |
| MSI GT62VR-6RE16H21 | |
| Schenker XMG P507 | |
| 1920x1080 Ultra Graphics & Postprocessing (HBAO+) | |
| Asus G800VI Prototype | |
| Asus Zephyrus GX501 | |
| MSI GT62VR-6RE16H21 | |
| Schenker XMG P507 | |
| Batman: Arkham Knight | |
| 3840x2160 High / On (Interactive Smoke & Paper Debris Off) AA:SM AF:8x | |
| Asus G800VI Prototype | |
| Asus Zephyrus GX501 | |
| MSI GT62VR-6RE16H21 | |
| Schenker XMG P507 | |
| 1920x1080 High / On AA:SM AF:16x | |
| Asus G800VI Prototype | |
| Asus Zephyrus GX501 | |
| MSI GT62VR-6RE16H21 | |
| Schenker XMG P507 | |
| Star Wars Battlefront | |
| 3840x2160 High Preset AA:FX | |
| Asus G800VI Prototype | |
| Asus Zephyrus GX501 | |
| MSI GT62VR-6RE16H21 | |
| Schenker XMG P507 | |
| 1920x1080 Ultra Preset AA:FX | |
| Asus G800VI Prototype | |
| Asus Zephyrus GX501 | |
| MSI GT62VR-6RE16H21 | |
| Schenker XMG P507 | |
| Assassin's Creed Syndicate | |
| 3840x2160 High Preset AA:FX | |
| Asus G800VI Prototype | |
| Asus Zephyrus GX501 | |
| MSI GT62VR-6RE16H21 | |
| Schenker XMG P507 | |
| 1920x1080 Ultra High Preset AA:4x MSAA + FX | |
| Asus G800VI Prototype | |
| Asus Zephyrus GX501 | |
| MSI GT62VR-6RE16H21 | |
| Schenker XMG P507 | |
| Rainbow Six Siege | |
| 3840x2160 High Preset AA:T AF:4x | |
| Asus G800VI Prototype | |
| Asus Zephyrus GX501 | |
| MSI GT62VR-6RE16H21 | |
| Schenker XMG P507 | |
| 1920x1080 Ultra Preset AA:T AF:16x | |
| Asus G800VI Prototype | |
| Asus Zephyrus GX501 | |
| MSI GT62VR-6RE16H21 | |
| Schenker XMG P507 | |
| Rise of the Tomb Raider | |
| 3840x2160 High Preset AA:FX AF:4x | |
| Asus G800VI Prototype | |
| Asus Zephyrus GX501 | |
| MSI GT62VR-6RE16H21 | |
| Schenker XMG P507 | |
| 1920x1080 Very High Preset AA:FX AF:16x | |
| Asus G800VI Prototype | |
| Asus Zephyrus GX501 | |
| MSI GT62VR-6RE16H21 | |
| Schenker XMG P507 | |
| Far Cry Primal | |
| 3840x2160 High Preset AA:SM | |
| Asus G800VI Prototype | |
| Asus Zephyrus GX501 | |
| MSI GT62VR-6RE16H21 | |
| Schenker XMG P507 | |
| 1920x1080 Ultra Preset AA:SM | |
| Asus G800VI Prototype | |
| Asus Zephyrus GX501 | |
| MSI GT62VR-6RE16H21 | |
| Schenker XMG P507 | |
| The Division | |
| 3840x2160 High Preset AF:8x | |
| Asus G800VI Prototype | |
| Asus Zephyrus GX501 | |
| MSI GT62VR-6RE16H21 | |
| Schenker XMG P507 | |
| 1920x1080 Ultra Preset AF:16x | |
| Asus G800VI Prototype | |
| Asus Zephyrus GX501 | |
| MSI GT62VR-6RE16H21 | |
| Schenker XMG P507 | |
| Doom | |
| 3840x2160 High Preset AA:FX | |
| Asus G800VI Prototype | |
| Asus Zephyrus GX501 | |
| MSI GT62VR-6RE16H21 | |
| Schenker XMG P507 | |
| 1920x1080 Ultra Preset AA:SM | |
| Asus G800VI Prototype | |
| Asus Zephyrus GX501 | |
| MSI GT62VR-6RE16H21 | |
| Schenker XMG P507 | |
| Mirror's Edge Catalyst | |
| 3840x2160 High Preset AF:16x | |
| Asus G800VI Prototype | |
| Asus Zephyrus GX501 | |
| MSI GT62VR-6RE16H21 | |
| Schenker XMG P507 | |
| 1920x1080 Ultra Preset AF:16x | |
| Asus G800VI Prototype | |
| Asus Zephyrus GX501 | |
| MSI GT62VR-6RE16H21 | |
| Schenker XMG P507 | |
| Deus Ex Mankind Divided | |
| 3840x2160 High Preset AF:4x | |
| MSI GT73VR 7RF-296 | |
| Asus Zephyrus GX501 | |
| Asus G752VS | |
| 1920x1080 Ultra Preset AA:2xMS AF:8x | |
| MSI GT73VR 7RF-296 | |
| Asus Zephyrus GX501 | |
| Asus G752VS | |
| Battlefield 1 | |
| 3840x2160 High Preset AA:T | |
| MSI GT73VR 7RF-296 | |
| Asus G752VS | |
| Asus Zephyrus GX501 | |
| 1920x1080 Ultra Preset AA:T | |
| MSI GT73VR 7RF-296 | |
| Asus G752VS | |
| Asus Zephyrus GX501 | |
| Titanfall 2 | |
| 3840x2160 High / Enabled AA:TS AF:8x | |
| MSI GT73VR 7RF-296 | |
| Asus Zephyrus GX501 | |
| Asus G752VS | |
| 1920x1080 Very High (Insane Texture Quality) / Enabled AA:TS AF:16x | |
| MSI GT73VR 7RF-296 | |
| Asus Zephyrus GX501 | |
| Asus G752VS | |
| Call of Duty Infinite Warfare | |
| 3840x2160 High / On AA:FX | |
| MSI GT73VR 7RF-296 | |
| Asus Zephyrus GX501 | |
| Asus G752VS | |
| MSI GT62VR | |
| 1920x1080 Ultra / On AA:T2X SM | |
| MSI GT73VR 7RF-296 | |
| Asus Zephyrus GX501 | |
| Asus G752VS | |
| MSI GT62VR | |
| Dishonored 2 | |
| 3840x2160 High Preset AA:TX | |
| MSI GT73VR 7RF-296 | |
| Asus Zephyrus GX501 | |
| Asus G752VS | |
| MSI GT62VR | |
| 1920x1080 Ultra Preset AA:TX | |
| MSI GT73VR 7RF-296 | |
| Asus Zephyrus GX501 | |
| Asus G752VS | |
| MSI GT62VR | |
| Watch Dogs 2 | |
| 3840x2160 High Preset | |
| MSI GT73VR 7RF-296 | |
| Asus Zephyrus GX501 | |
| Asus G752VS | |
| MSI GT62VR | |
| 1920x1080 Ultra Preset | |
| MSI GT73VR 7RF-296 | |
| Asus Zephyrus GX501 | |
| Asus G752VS | |
| MSI GT62VR | |
| Resident Evil 7 | |
| 3840x2160 High / On AA:FXAA+T | |
| Asus Zephyrus GX501 | |
| Asus G752VS | |
| MSI GT62VR | |
| 1920x1080 Very High / On AA:FXAA+T | |
| Asus Zephyrus GX501 | |
| Asus G752VS | |
| MSI GT62VR | |
| For Honor | |
| 3840x2160 High Preset AA:T AF:8x | |
| Asus Zephyrus GX501 | |
| Asus G752VS | |
| MSI GT62VR | |
| 1920x1080 Extreme Preset AA:T AF:16x | |
| Asus Zephyrus GX501 | |
| Asus G752VS | |
| MSI GT62VR | |
| Ghost Recon Wildlands | |
| 3840x2160 Very High Preset AA:T AF:8x | |
| Asus Zephyrus GX501 | |
| Asus G752VS | |
| MSI GT62VR | |
| 1920x1080 Ultra Preset AA:T AF:16x | |
| Asus Zephyrus GX501 | |
| Asus G752VS | |
| MSI GT62VR | |
| Mass Effect Andromeda | |
| 3840x2160 High Preset (Resolution Scale Mode off) AA:T | |
| Asus Zephyrus GX501 | |
| Asus G752VS | |
| MSI GT62VR | |
| 1920x1080 Ultra Preset (Resolution Scale Mode off) AA:T | |
| Asus G752VS | |
| Asus Zephyrus GX501 | |
| MSI GT62VR | |
| Prey | |
| 3840x2160 High Preset AA:2TX SM AF:8x | |
| Asus G752VS | |
| Asus Zephyrus GX501 | |
| MSI GT62VR | |
| 1920x1080 Very High Preset AA:2TX SM AF:16x | |
| Asus G752VS | |
| Asus Zephyrus GX501 | |
| MSI GT62VR | |
| Rocket League | |
| 3840x2160 High Quality AA:High FX | |
| Asus Zephyrus GX501 | |
| Asus G752VS | |
| MSI GT62VR | |
| 1920x1080 High Quality AA:High FX | |
| Asus Zephyrus GX501 | |
| Asus G752VS | |
| MSI GT62VR | |
| Dirt 4 - 1920x1080 Ultra Preset AA:4xMS AF:16x | |
| Asus Zephyrus GX501 | |
| Asus G752VS | |
| MSI GT62VR | |
| baixo | média | alto | ultra | QHD | 4K | |
|---|---|---|---|---|---|---|
| The Witcher 3 (2015) | 118 | 61.9 | 43.7 | |||
| Batman: Arkham Knight (2015) | 124 | 88 | 48 | |||
| Star Wars Battlefront (2015) | 164 | 144 | 55.6 | |||
| Assassin's Creed Syndicate (2015) | 74.4 | 50.3 | 40 | |||
| Rainbow Six Siege (2015) | 197 | 172 | 65.7 | |||
| Rise of the Tomb Raider (2016) | 125 | 105 | 43.6 | |||
| Far Cry Primal (2016) | 92 | 87 | 41 | |||
| The Division (2016) | 107 | 83.8 | 40.8 | |||
| Doom (2016) | 134 | 128 | 53.9 | |||
| Mirror's Edge Catalyst (2016) | 106 | 97.8 | 38.8 | |||
| Deus Ex Mankind Divided (2016) | 87.3 | 47.9 | 29.6 | |||
| Battlefield 1 (2016) | 130 | 113 | 49 | |||
| Titanfall 2 (2016) | 131 | 113 | 46.6 | |||
| Call of Duty Infinite Warfare (2016) | 123 | 118 | 63.7 | |||
| Dishonored 2 (2016) | 78.2 | 66.5 | 43.4 | |||
| Watch Dogs 2 (2016) | 86.7 | 66.7 | 34.9 | |||
| Resident Evil 7 (2017) | 166 | 140 | 47.4 | |||
| For Honor (2017) | 155 | 115 | 47.9 | |||
| Ghost Recon Wildlands (2017) | 86.7 | 51.9 | 34.1 | |||
| Mass Effect Andromeda (2017) | 81.4 | 73.2 | 35.1 | |||
| Warhammer 40.000: Dawn of War III (2017) | 88 | 86 | 41.9 | |||
| Prey (2017) | 135 | 131 | 50.5 | |||
| Rocket League (2017) | 235 | 103 | ||||
| Dirt 4 (2017) | 136 | 88.4 | ||||
| Team Fortress 2 (2017) | 124 | 125 | ||||
| Playerunknown's Battlegrounds (PUBG) (2017) | 125 | 111 | 104 | 79 | 27.1 | |
| Final Fantasy XV Benchmark (2018) | 130 | 86 | 64 | 27.2 | ||
| Far Cry New Dawn (2019) | 66 | 38 | ||||
| Dirt Rally 2.0 (2019) | 75 | 55.9 | 33.7 | |||
| The Division 2 (2019) | 74 | 51.5 | 27.8 | |||
| League of Legends (2019) | 145 | 144 |
Barulho
| Ocioso |
| 32 / 33 / 34 dB |
| Carga |
| 39 / 46 dB |
 | ||
30 dB silencioso 40 dB(A) audível 50 dB(A) ruidosamente alto |
||
min: | ||
| Asus Zephyrus GX501 GeForce GTX 1080 Max-Q, i7-7700HQ | Alienware 15 R3 GeForce GTX 1070 Mobile, i7-7700HQ | Schenker XMG P507 PRO GeForce GTX 1070 Mobile, i7-7700HQ | Asus FX502VM-AS73 GeForce GTX 1060 Mobile, i7-7700HQ | Gigabyte Aero 15 GeForce GTX 1060 Mobile, i7-7700HQ | MSI GS63VR 7RF-228US GeForce GTX 1060 Mobile, i7-7700HQ | |
|---|---|---|---|---|---|---|
| Noise | -8% | -11% | -1% | -2% | -0% | |
| desligado / ambiente * (dB) | 31 | 30 3% | 31 -0% | 28.7 7% | 31 -0% | 28.8 7% |
| Idle Minimum * (dB) | 32 | 31 3% | 33 -3% | 30.6 4% | 32 -0% | 33.1 -3% |
| Idle Average * (dB) | 33 | 32 3% | 34 -3% | 30.6 7% | 33 -0% | 33.1 -0% |
| Idle Maximum * (dB) | 34 | 42 -24% | 44 -29% | 31 9% | 34 -0% | 34 -0% |
| Load Average * (dB) | 39 | 49 -26% | 46 -18% | 46.2 -18% | 39 -0% | 37.2 5% |
| Witcher 3 ultra * (dB) | 42 | 43 -2% | 46.1 -10% | |||
| Load Maximum * (dB) | 46 | 50 -9% | 52 -13% | 52.3 -14% | 50 -9% | 47.1 -2% |
* ... menor é melhor
(-) A temperatura máxima no lado superior é 57 °C / 135 F, em comparação com a média de 40.4 °C / 105 F , variando de 21.2 a 68.8 °C para a classe Gaming.
(-) A parte inferior aquece até um máximo de 54 °C / 129 F, em comparação com a média de 43.3 °C / 110 F
(+) Em uso inativo, a temperatura média para o lado superior é 30.7 °C / 87 F, em comparação com a média do dispositivo de 33.9 °C / ### class_avg_f### F.
(-) Jogando The Witcher 3, a temperatura média para o lado superior é 46.8 °C / 116 F, em comparação com a média do dispositivo de 33.9 °C / ## #class_avg_f### F.
(-) Os apoios para as mãos e o touchpad podem ficar muito quentes ao toque, com um máximo de 42 °C / 107.6 F.
(-) A temperatura média da área do apoio para as mãos de dispositivos semelhantes foi 28.8 °C / 83.8 F (-13.2 °C / -23.8 F).
| Asus Zephyrus GX501 GeForce GTX 1080 Max-Q, i7-7700HQ | Alienware 15 R3 GeForce GTX 1070 Mobile, i7-7700HQ | Schenker XMG P507 PRO GeForce GTX 1070 Mobile, i7-7700HQ | Asus FX502VM-AS73 GeForce GTX 1060 Mobile, i7-7700HQ | Gigabyte Aero 15 GeForce GTX 1060 Mobile, i7-7700HQ | MSI GS63VR 7RF-228US GeForce GTX 1060 Mobile, i7-7700HQ | |
|---|---|---|---|---|---|---|
| Heat | -4% | -2% | 3% | 9% | 8% | |
| Maximum Upper Side * (°C) | 57 | 46 19% | 49.2 14% | 53.2 7% | 56 2% | |
| Maximum Bottom * (°C) | 54 | 51.8 4% | 62 -15% | 56.8 -5% | 61 -13% | |
| Idle Upper Side * (°C) | 32 | 36.5 -14% | 32.4 -1% | 28.8 10% | 25 22% | 28.4 11% |
| Idle Bottom * (°C) | 31 | 38.2 -23% | 33 -6% | 31.4 -1% | 24 23% | 29.6 5% |
* ... menor é melhor
Asus Zephyrus GX501 análise de áudio
(+) | os alto-falantes podem tocar relativamente alto (###valor### dB)
Graves 100 - 315Hz
(-) | quase nenhum baixo - em média 23.2% menor que a mediana
(±) | a linearidade dos graves é média (12.5% delta para a frequência anterior)
Médios 400 - 2.000 Hz
(+) | médios equilibrados - apenas 2.4% longe da mediana
(+) | médios são lineares (4.8% delta para frequência anterior)
Altos 2 - 16 kHz
(+) | agudos equilibrados - apenas 2.2% longe da mediana
(+) | os máximos são lineares (2% delta da frequência anterior)
Geral 100 - 16.000 Hz
(±) | a linearidade do som geral é média (16.8% diferença em relação à mediana)
Comparado com a mesma classe
» 43% de todos os dispositivos testados nesta classe foram melhores, 11% semelhantes, 46% piores
» O melhor teve um delta de 6%, a média foi 18%, o pior foi 132%
Comparado com todos os dispositivos testados
» 29% de todos os dispositivos testados foram melhores, 8% semelhantes, 64% piores
» O melhor teve um delta de 4%, a média foi 24%, o pior foi 134%
Gigabyte Aero 15 análise de áudio
(±) | o volume do alto-falante é médio, mas bom (###valor### dB)
Graves 100 - 315Hz
(-) | quase nenhum baixo - em média 23.3% menor que a mediana
(±) | a linearidade dos graves é média (10.7% delta para a frequência anterior)
Médios 400 - 2.000 Hz
(+) | médios equilibrados - apenas 1.8% longe da mediana
(+) | médios são lineares (4.1% delta para frequência anterior)
Altos 2 - 16 kHz
(+) | agudos equilibrados - apenas 2.6% longe da mediana
(+) | os máximos são lineares (5.1% delta da frequência anterior)
Geral 100 - 16.000 Hz
(±) | a linearidade do som geral é média (18.3% diferença em relação à mediana)
Comparado com a mesma classe
» 54% de todos os dispositivos testados nesta classe foram melhores, 7% semelhantes, 39% piores
» O melhor teve um delta de 5%, a média foi 17%, o pior foi 45%
Comparado com todos os dispositivos testados
» 39% de todos os dispositivos testados foram melhores, 8% semelhantes, 53% piores
» O melhor teve um delta de 4%, a média foi 24%, o pior foi 134%
| desligado | |
| Ocioso | |
| Carga |
|
Key:
min: | |
| Asus Zephyrus GX501 GeForce GTX 1080 Max-Q, i7-7700HQ | Alienware 15 R3 GeForce GTX 1070 Mobile, i7-7700HQ | Schenker XMG P507 PRO GeForce GTX 1070 Mobile, i7-7700HQ | Asus FX502VM-AS73 GeForce GTX 1060 Mobile, i7-7700HQ | Gigabyte Aero 15 GeForce GTX 1060 Mobile, i7-7700HQ | MSI GS63VR 7RF-228US GeForce GTX 1060 Mobile, i7-7700HQ | |
|---|---|---|---|---|---|---|
| Power Consumption | -1% | 11% | 18% | 24% | 17% | |
| Idle Minimum * (Watt) | 18 | 19 -6% | 14 22% | 14.9 17% | 12 33% | 14.5 19% |
| Idle Average * (Watt) | 23 | 23 -0% | 18 22% | 15.1 34% | 15 35% | 17.3 25% |
| Idle Maximum * (Watt) | 31 | 29 6% | 24 23% | 15.2 51% | 20 35% | 17.4 44% |
| Load Average * (Watt) | 79 | 85 -8% | 87 -10% | 105.8 -34% | 82 -4% | 93 -18% |
| Witcher 3 ultra * (Watt) | 148 | 111 25% | 128.8 13% | |||
| Load Maximum * (Watt) | 196 | 192 2% | 201 -3% | 148.8 24% | 161 18% |
* ... menor é melhor
| Asus Zephyrus GX501 GeForce GTX 1080 Max-Q, i7-7700HQ, 50 Wh | Alienware 15 R3 GeForce GTX 1070 Mobile, i7-7700HQ, 99 Wh | Schenker XMG P507 PRO GeForce GTX 1070 Mobile, i7-7700HQ, 60 Wh | Asus FX502VM-AS73 GeForce GTX 1060 Mobile, i7-7700HQ, 64 Wh | Gigabyte Aero 15 GeForce GTX 1060 Mobile, i7-7700HQ, 94.24 Wh | MSI GS63VR 7RF-228US GeForce GTX 1060 Mobile, i7-7700HQ, 65 Wh | |
|---|---|---|---|---|---|---|
| Duração da bateria | 112% | 57% | 88% | 220% | 90% | |
| Reader / Idle (h) | 3.1 | 6.4 106% | 6.1 97% | 10.6 242% | 6.4 106% | |
| H.264 (h) | 2.2 | 4.4 100% | 3.6 64% | 7.7 250% | ||
| WiFi v1.3 (h) | 2.2 | 4.4 100% | 3.3 50% | 4.6 109% | 7 218% | 3.9 77% |
| Load (h) | 0.7 | 1.7 143% | 1.1 57% | 1.9 171% | 1.3 86% |
Pro
Contra
O veredicto sobre o ROG Zephyrus GX501 de 3.000 euros depende principalmente de duas coisas: 1) O dinheiro é um problema? E: 2) Quão importante é o aspecto de mobilidade? Os usuários dispostos a pagar muito por um portátil extremamente fino e potente recebem uma carcaça muito elegante e comparativamente leve. Possui excelentes materiais, um painel de 120 Hz com suporte para G-Sync e um nível de desempenho que - nesta classe - é incomparável até agora.
No entanto, se você é mais consciente de preços e não se importa com cada detalhe, o GX501 de repente parece muito menos atraente. O conceito ultrafino não afeta apenas as temperaturas (o chassi esquenta muito sob uso intenso), mas também a manutenção, os dispositivos de entrada, a seleção de portas (sem leitor de cartões, sem RJ45-LAN) e especialmente o tempo de duração da bateria, o qual é decepcionantemente curto para um portátil supostamente móvel de até 3 horas.
Portáteis mais grossos com GTX 1070 como o Asus Strix GL502VS não fazem tantos compromissos e são mais acessíveis.
Em suma, o Zephyrus GX501 ainda obtém uma avaliação "boa" e entrará no ranking dos Top 10 para portáteis de jogos leves e fino na seguinte atualização.
Asus Zephyrus GX501
- 07/13/2017 v6 (old)
Florian Glaser, Klaus Hinum, J. Simon Leitner


