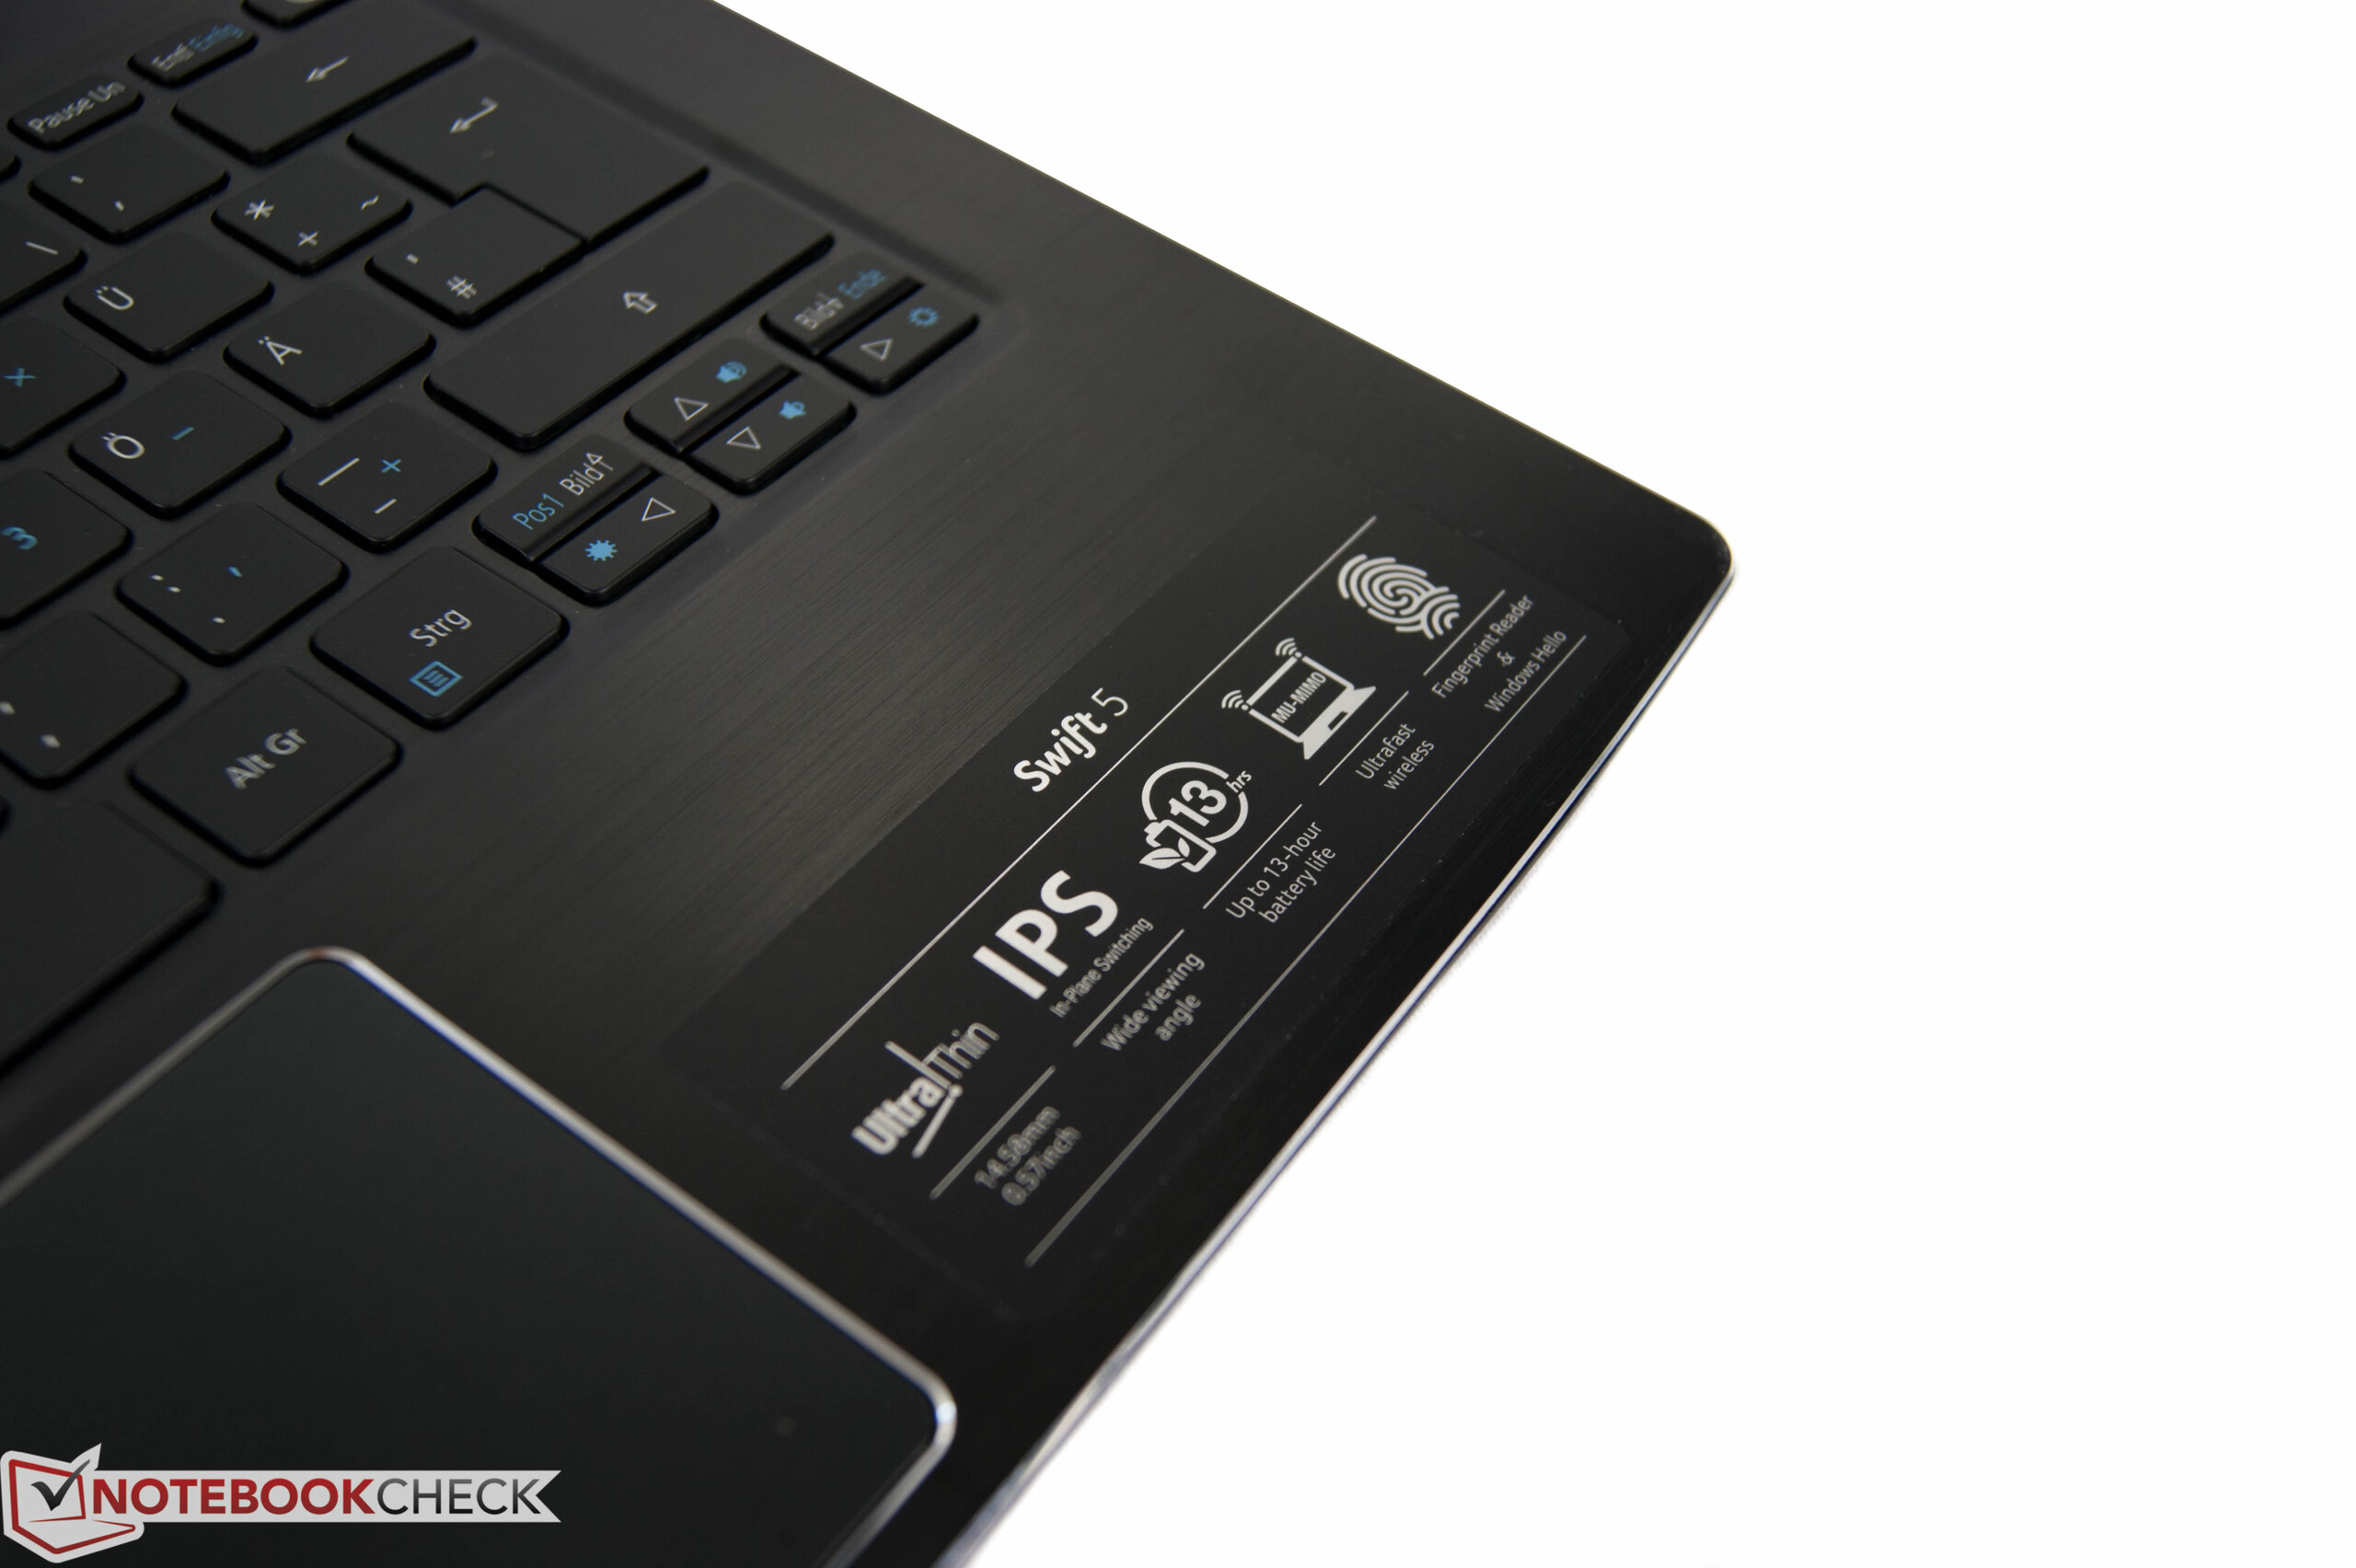
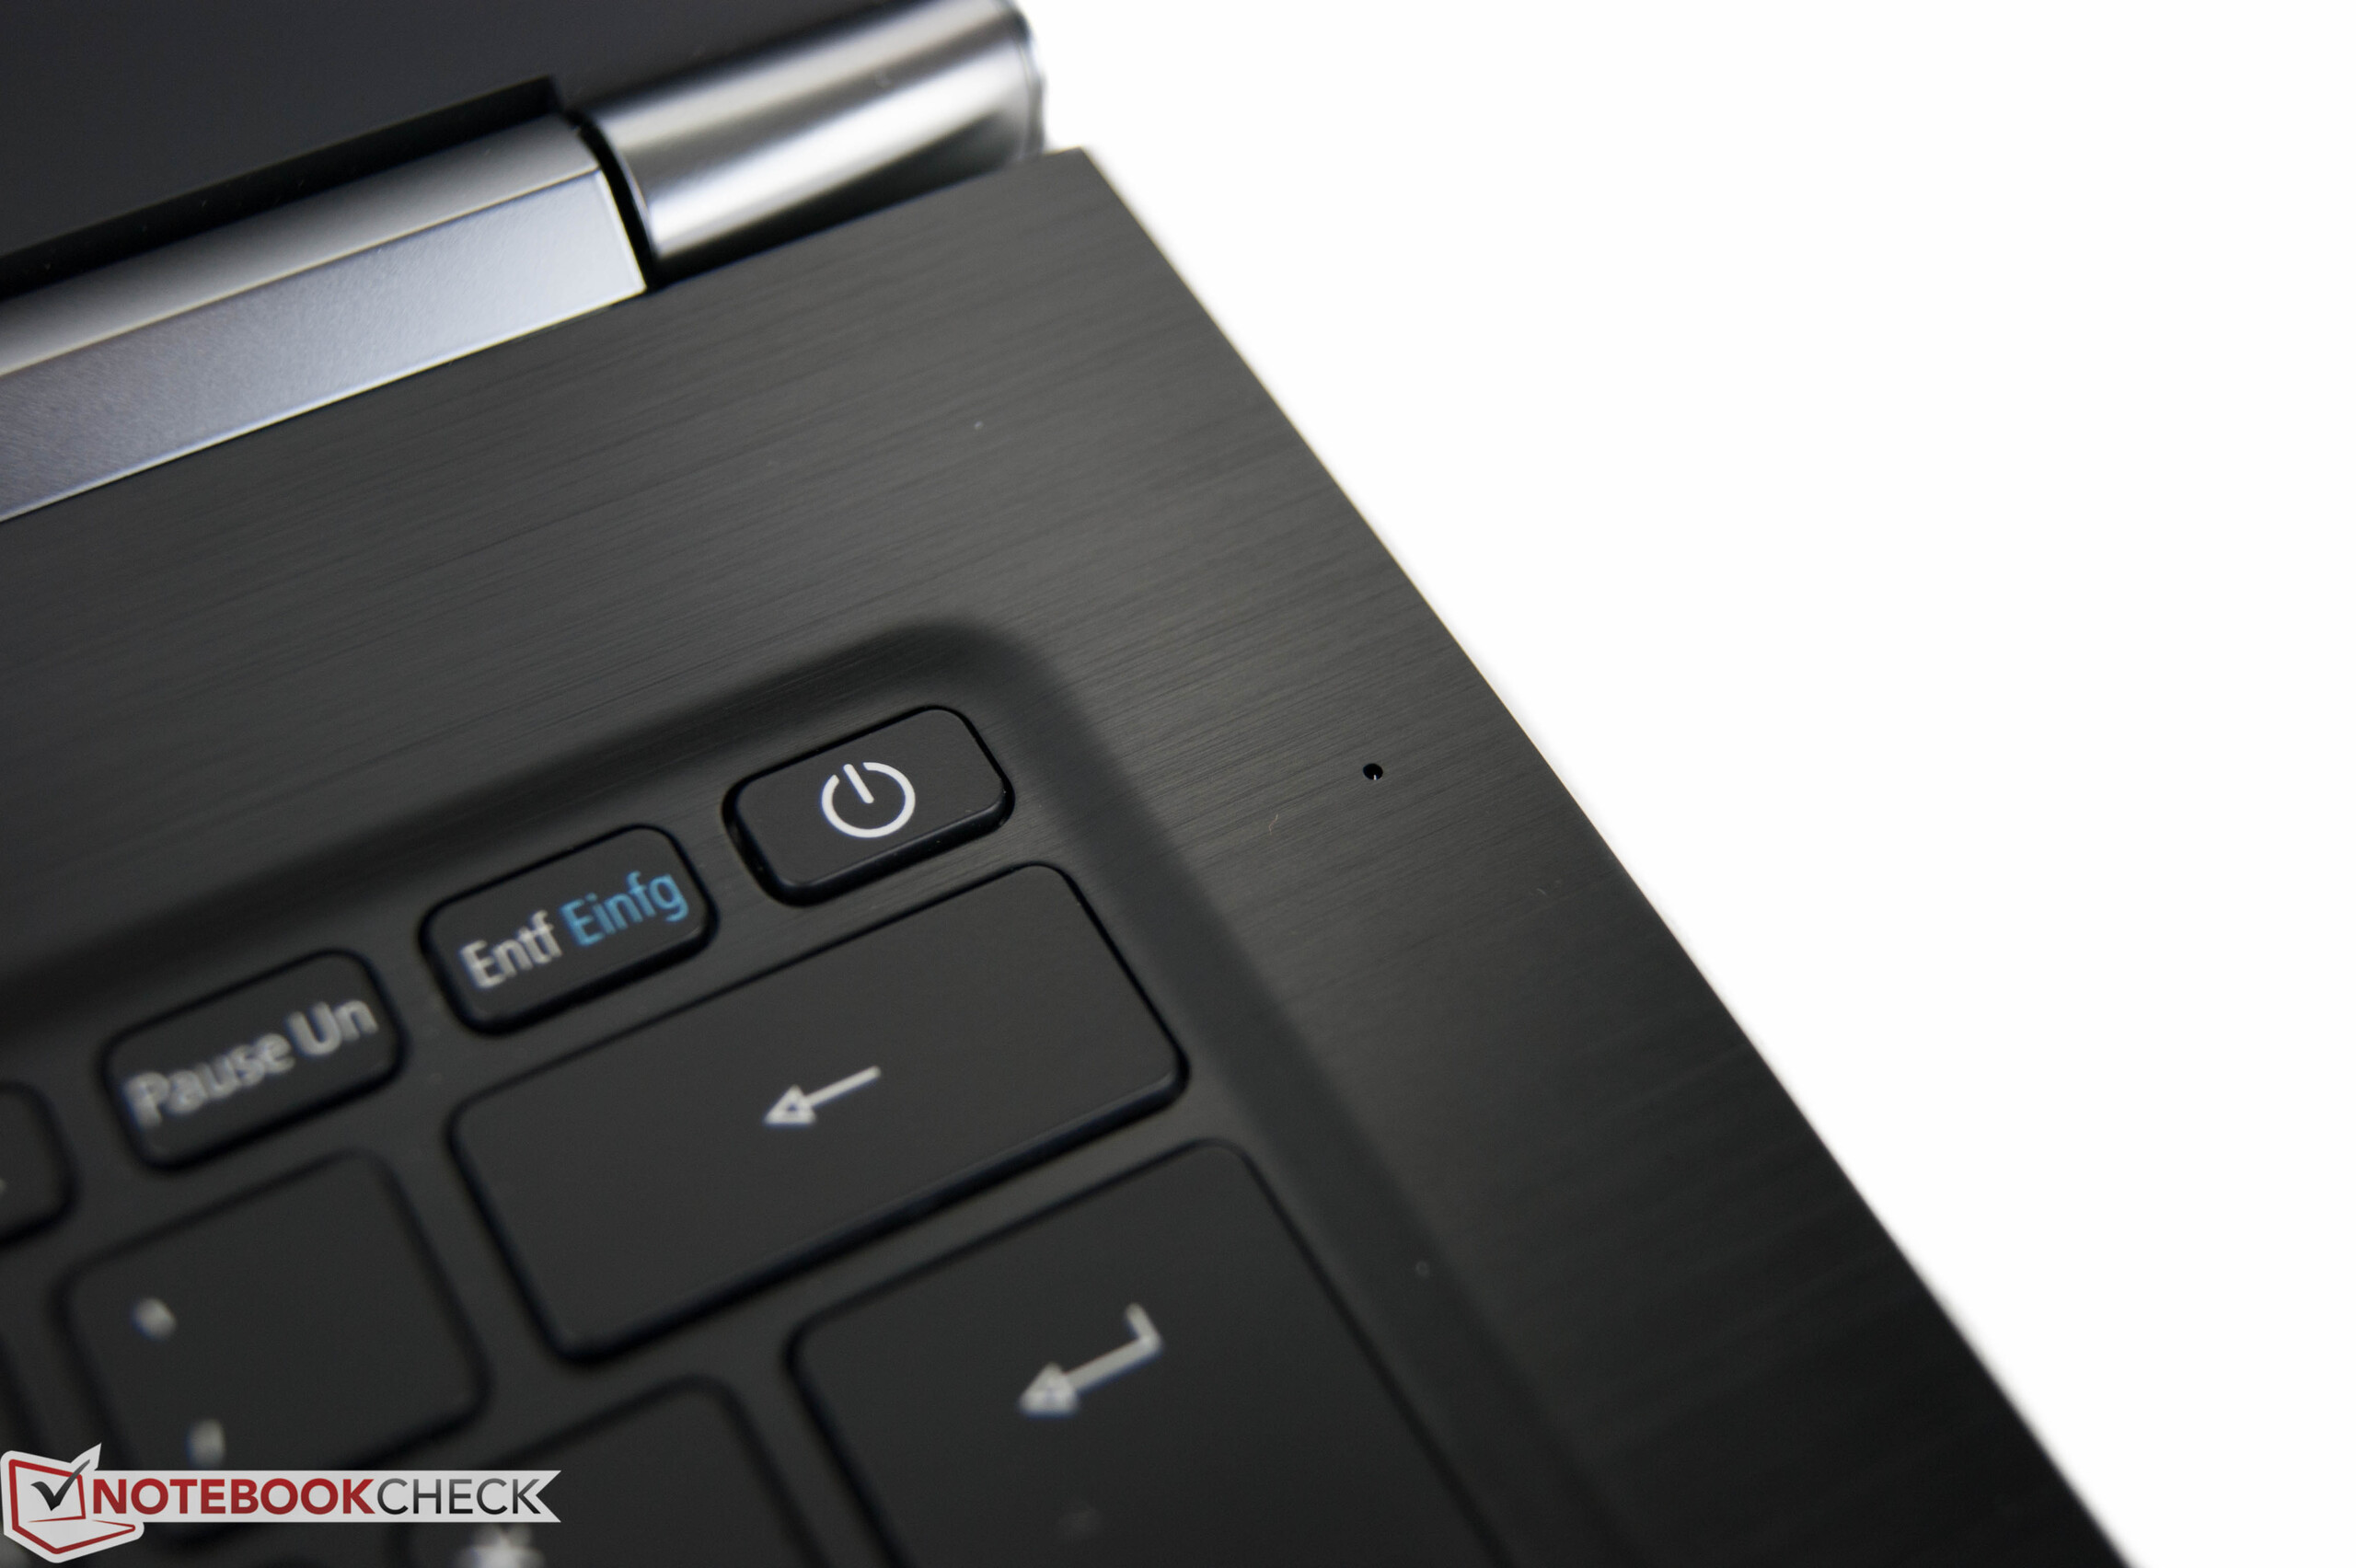
Breve Análise do Portátil Acer Swift 5 SF514-51-59AV


| SD Card Reader | |
| average JPG Copy Test (av. of 3 runs) | |
| Dell XPS 13 9360 FHD i5 | |
| Lenovo IdeaPad 510S-13IKB 80V00026GE | |
| Acer Swift 5 SF514-51-59AV | |
| Medion Akoya S3409-MD60234 | |
| maximum AS SSD Seq Read Test (1GB) | |
| Dell XPS 13 9360 FHD i5 | |
| Acer Swift 5 SF514-51-59AV | |
| Lenovo IdeaPad 510S-13IKB 80V00026GE | |
| Medion Akoya S3409-MD60234 | |
| Networking | |
| iperf Server (receive) TCP 1 m | |
| Asus Zenbook 3 UX390UA-GS041T (jseb) | |
| Acer Swift 5 SF514-51-59AV (jseb) | |
| Medion Akoya S3409-MD60234 (jseb) | |
| Lenovo IdeaPad 510S-13IKB 80V00026GE | |
| iperf Client (transmit) TCP 1 m | |
| Acer Swift 5 SF514-51-59AV (jseb) | |
| Asus Zenbook 3 UX390UA-GS041T (jseb) | |
| Medion Akoya S3409-MD60234 (jseb) | |
| Lenovo IdeaPad 510S-13IKB 80V00026GE | |
| |||||||||||||||||||||||||
iluminação: 79 %
iluminação com acumulador: 393 cd/m²
Contraste: 1355:1 (Preto: 0.29 cd/m²)
ΔE ColorChecker Calman: 6.17 | ∀{0.5-29.43 Ø4.71}
ΔE Greyscale Calman: 6.8 | ∀{0.09-98 Ø4.96}
91% sRGB (Argyll 1.6.3 3D)
51% AdobeRGB 1998 (Argyll 1.6.3 3D)
64.3% AdobeRGB 1998 (Argyll 3D)
91.3% sRGB (Argyll 3D)
62.8% Display P3 (Argyll 3D)
Gamma: 2.27
CCT: 6873 K
| Acer Swift 5 SF514-51-59AV AU Optronics B140HAN3.2, , 1920x1080, 14" | Lenovo IdeaPad 510S-13IKB 80V00026GE LG Philips LP133WF2-SPL1, , 1920x1080, 13.3" | Medion Akoya S3409-MD60234 LG Philips LP133QD1-SPA3, , 3200x1800, 13.3" | Dell XPS 13 9360 FHD i5 Sharp SHP1449 LQ133M1, , 1920x1080, 13.3" | Asus Zenbook 3 UX390UA-GS041T AUO B125HAN03.0 AUO306D, , 1920x1080, 12.5" | |
|---|---|---|---|---|---|
| Display | -38% | -1% | -21% | 1% | |
| Display P3 Coverage (%) | 62.8 | 38.61 -39% | 64.6 3% | 48.94 -22% | 64.7 3% |
| sRGB Coverage (%) | 91.3 | 57.9 -37% | 87.3 -4% | 73.3 -20% | 89.6 -2% |
| AdobeRGB 1998 Coverage (%) | 64.3 | 39.92 -38% | 63.8 -1% | 50.5 -21% | 65.4 2% |
| Response Times | 19% | 22% | 9% | 24% | |
| Response Time Grey 50% / Grey 80% * (ms) | 51 ? | 39 ? 24% | 34 ? 33% | 32.8 ? 36% | 30 ? 41% |
| Response Time Black / White * (ms) | 28 ? | 24 ? 14% | 25 ? 11% | 33.2 ? -19% | 26 ? 7% |
| PWM Frequency (Hz) | 250 ? | 50 ? | |||
| Screen | -10% | -10% | 4% | 1% | |
| Brightness middle (cd/m²) | 393 | 259 -34% | 295 -25% | 351.2 -11% | 355 -10% |
| Brightness (cd/m²) | 338 | 253 -25% | 283 -16% | 325 -4% | 341 1% |
| Brightness Distribution (%) | 79 | 82 4% | 88 11% | 89 13% | 87 10% |
| Black Level * (cd/m²) | 0.29 | 0.33 -14% | 0.65 -124% | 0.195 33% | 0.3 -3% |
| Contrast (:1) | 1355 | 785 -42% | 454 -66% | 1801 33% | 1183 -13% |
| Colorchecker dE 2000 * | 6.17 | 5.12 17% | 4 35% | 7.4 -20% | 5.97 3% |
| Colorchecker dE 2000 max. * | 11.21 | 10.12 10% | 7.26 35% | 9.08 19% | 10.55 6% |
| Greyscale dE 2000 * | 6.8 | 3.8 44% | 3.38 50% | 6.71 1% | 6.45 5% |
| Gamma | 2.27 97% | 2.39 92% | 2.38 92% | 2.74 80% | 2.45 90% |
| CCT | 6873 95% | 7405 88% | 6520 100% | 7222 90% | 7694 84% |
| Color Space (Percent of AdobeRGB 1998) (%) | 51 | 37 -27% | 57 12% | 50.48 -1% | 58 14% |
| Color Space (Percent of sRGB) (%) | 91 | 58 -36% | 85 -7% | 73.31 -19% | 89 -2% |
| Média Total (Programa/Configurações) | -10% /
-12% | 4% /
-4% | -3% /
-0% | 9% /
4% |
* ... menor é melhor
Exibir tempos de resposta
| ↔ Tempo de resposta preto para branco | ||
|---|---|---|
| 28 ms ... ascensão ↗ e queda ↘ combinadas | ↗ 7 ms ascensão | 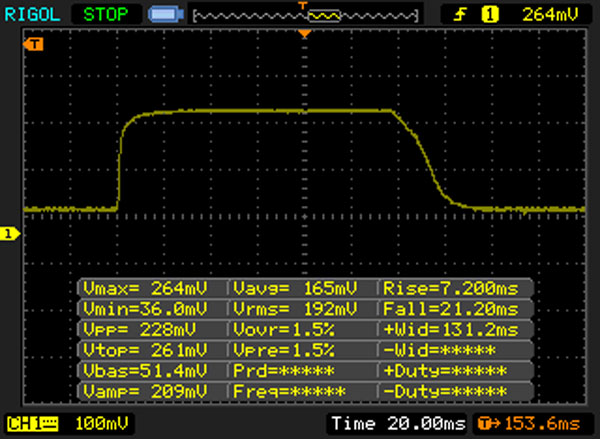 |
| ↘ 21 ms queda | ||
| A tela mostra taxas de resposta relativamente lentas em nossos testes e pode ser muito lenta para os jogadores. Em comparação, todos os dispositivos testados variam de 0.1 (mínimo) a 240 (máximo) ms. » 71 % de todos os dispositivos são melhores. Isso significa que o tempo de resposta medido é pior que a média de todos os dispositivos testados (19.8 ms). | ||
| ↔ Tempo de resposta 50% cinza a 80% cinza | ||
| 51 ms ... ascensão ↗ e queda ↘ combinadas | ↗ 20 ms ascensão | 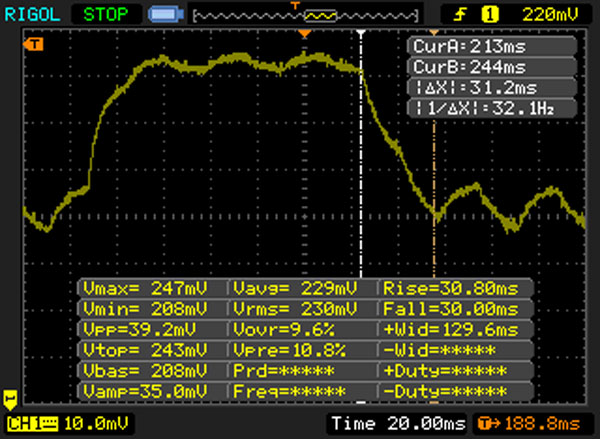 |
| ↘ 31 ms queda | ||
| A tela mostra taxas de resposta lentas em nossos testes e será insatisfatória para os jogadores. Em comparação, todos os dispositivos testados variam de 0.165 (mínimo) a 636 (máximo) ms. » 87 % de todos os dispositivos são melhores. Isso significa que o tempo de resposta medido é pior que a média de todos os dispositivos testados (31 ms). | ||
Cintilação da tela / PWM (modulação por largura de pulso)
| Tela tremeluzindo / PWM não detectado | ||
[pwm_comparison] Em comparação: 52 % de todos os dispositivos testados não usam PWM para escurecer a tela. Se PWM foi detectado, uma média de 7754 (mínimo: 5 - máximo: 343500) Hz foi medida. | ||
| PCMark 8 - Home Score Accelerated v2 | |
| Lenovo IdeaPad 510S-13IKB 80V00026GE | |
| Dell XPS 13 9360 FHD i5 | |
| Acer Swift 5 SF514-51-59AV | |
| Medion Akoya S3409-MD60234 | |
| Asus Zenbook 3 UX390UA-GS041T | |
| PCMark 7 Score | 5367 pontos | |
| PCMark 8 Home Score Accelerated v2 | 3370 pontos | |
Ajuda | ||
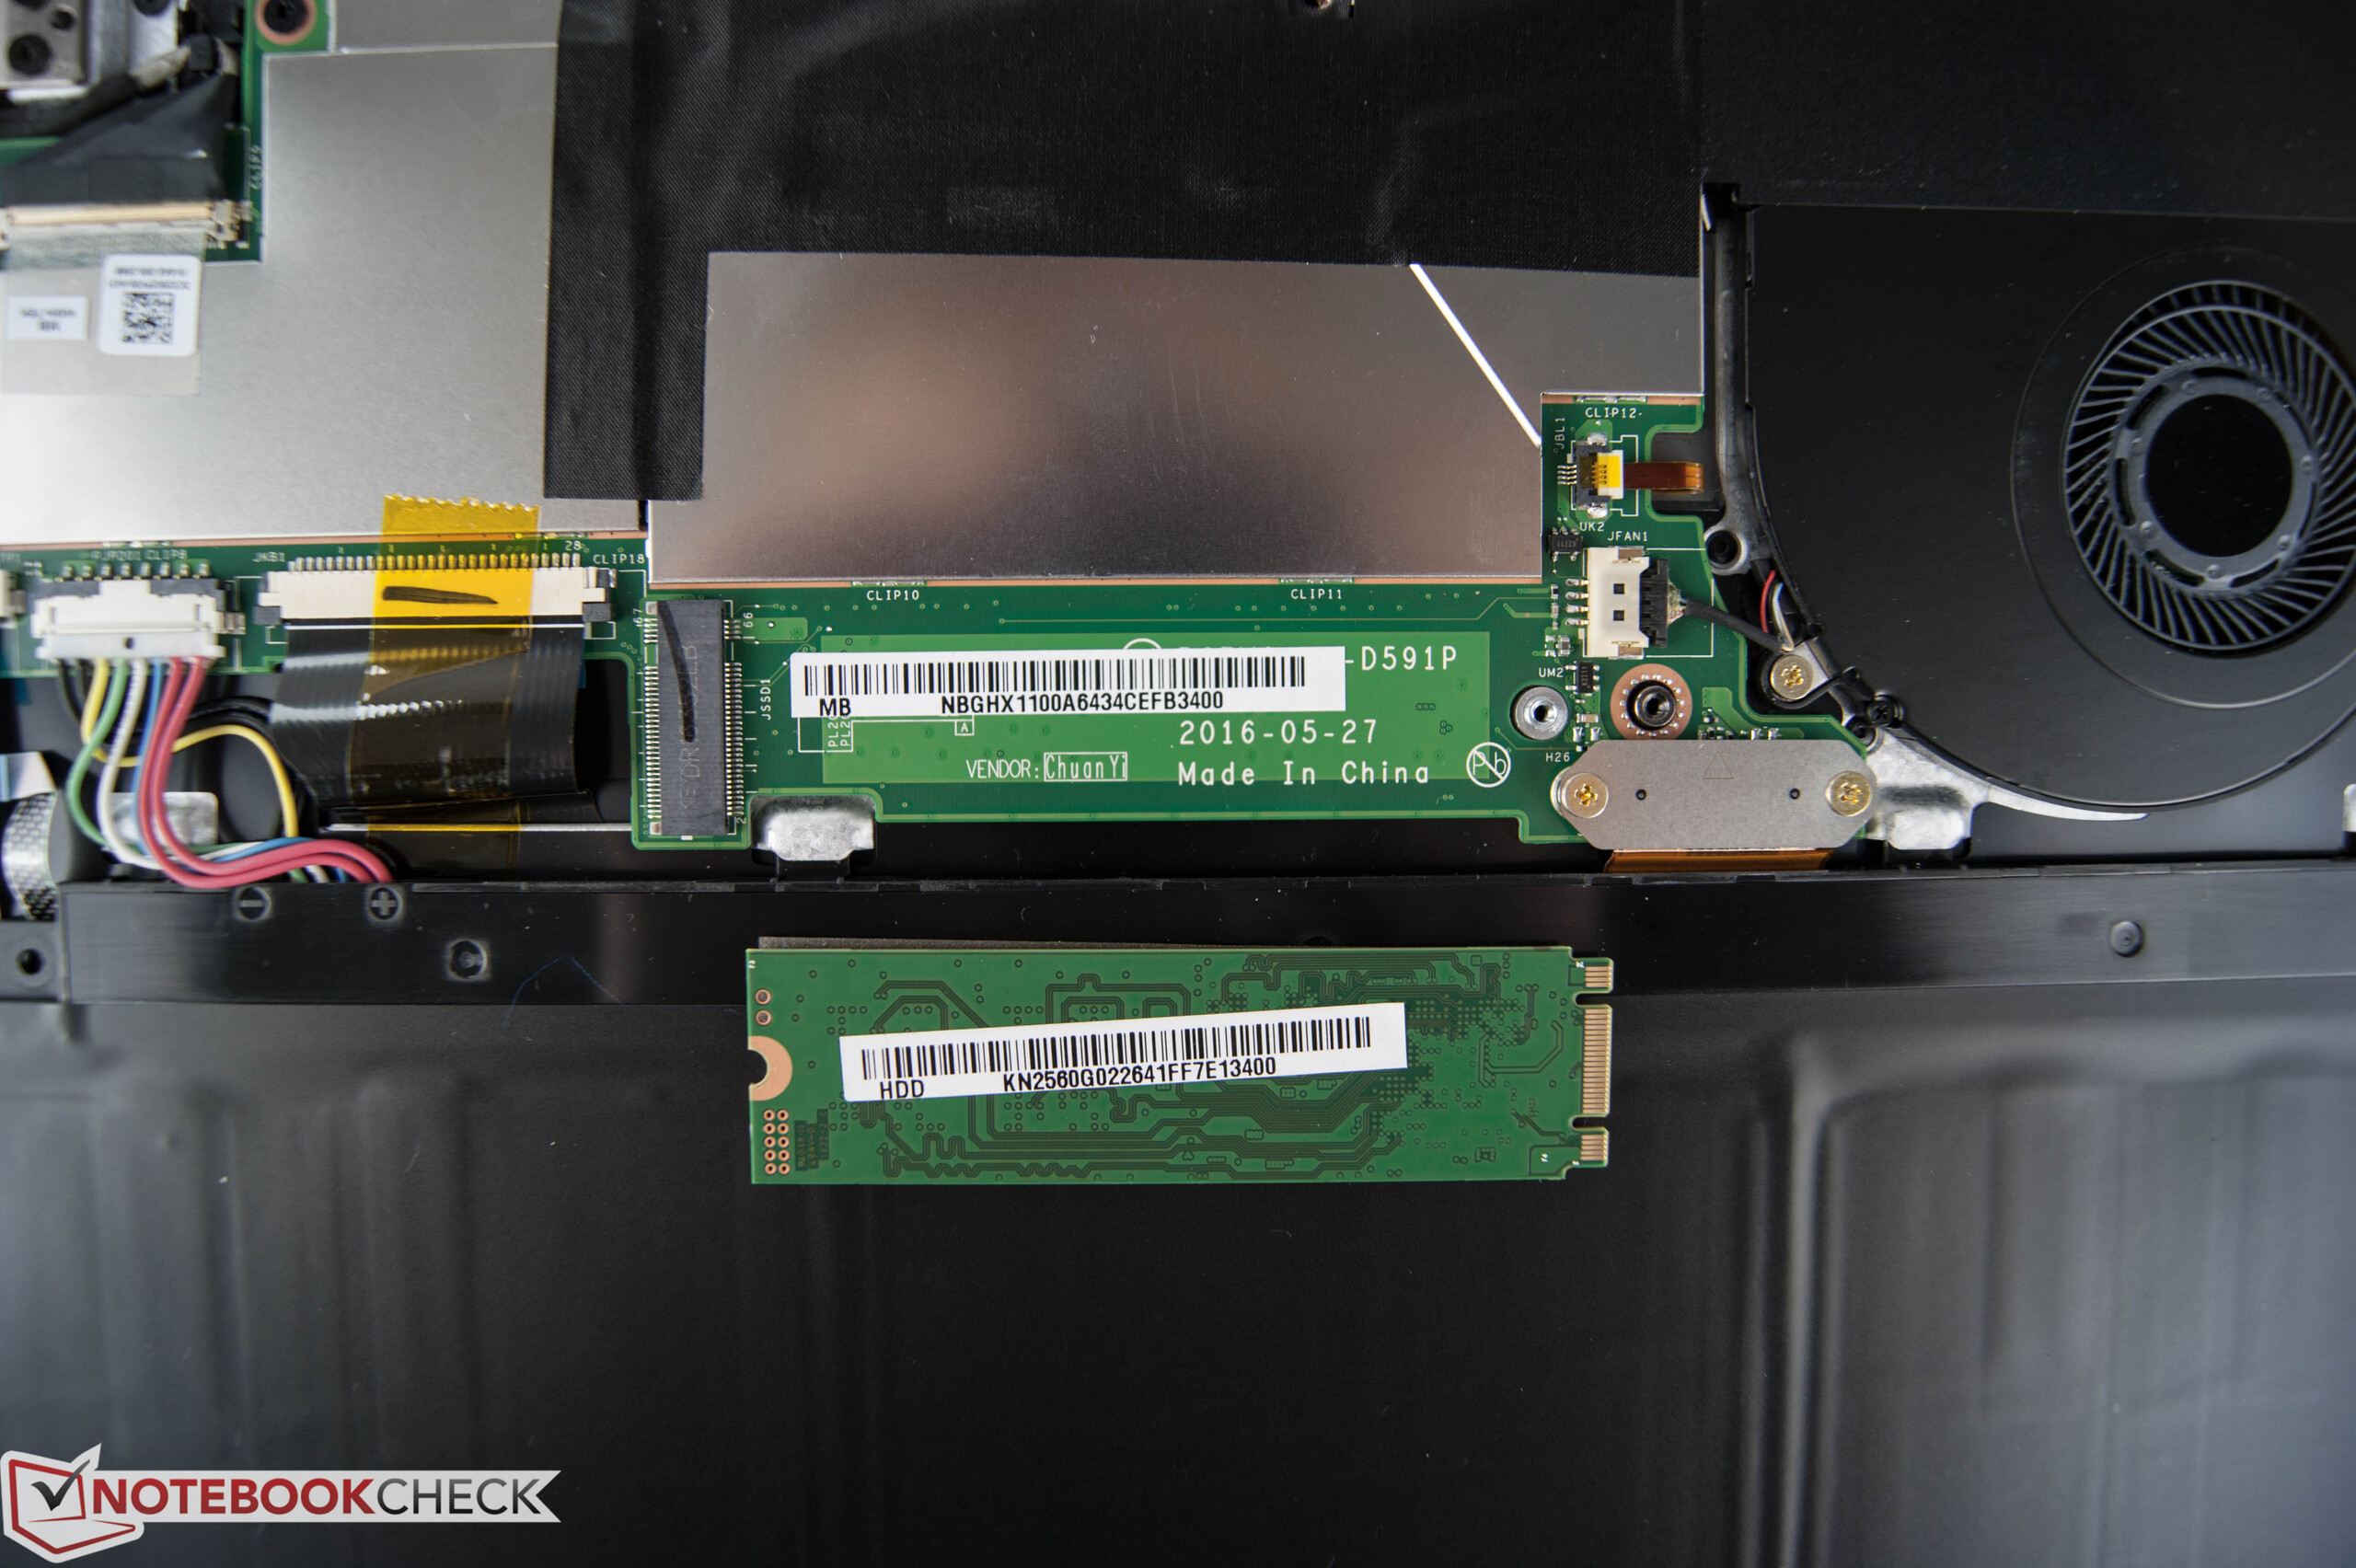
| Acer Swift 5 SF514-51-59AV SK Hynix HFS256G39TND-N210A | Lenovo IdeaPad 510S-13IKB 80V00026GE Samsung MZYTY256HDHP | Medion Akoya S3409-MD60234 Phison S10C-512G | Dell XPS 13 9360 FHD i5 Toshiba NVMe THNSN5256GPUK | Asus Zenbook 3 UX390UA-GS041T SK Hynix Canvas SC300 512GB M.2 (HFS512G39MND) | |
|---|---|---|---|---|---|
| CrystalDiskMark 3.0 | 15% | 25% | 87% | 15% | |
| Read Seq (MB/s) | 517 | 494.5 -4% | 522 1% | 1233 138% | 508 -2% |
| Write Seq (MB/s) | 258.1 | 494.1 91% | 384.4 49% | 733 184% | 454.4 76% |
| Read 512 (MB/s) | 355 | 383.9 8% | 412 16% | 1036 192% | 335.5 -5% |
| Write 512 (MB/s) | 258.5 | 155.5 -40% | 395.5 53% | 439.9 70% | 413.9 60% |
| Read 4k (MB/s) | 29.65 | 36.08 22% | 34.07 15% | 29.31 -1% | 28.13 -5% |
| Write 4k (MB/s) | 77.3 | 96.4 25% | 100.9 31% | 116.9 51% | 69.8 -10% |
| Read 4k QD32 (MB/s) | 277.1 | 403.3 46% | 316.3 14% | 479.2 73% | 245.7 -11% |
| Write 4k QD32 (MB/s) | 242.5 | 176.4 -27% | 286.4 18% | 218.3 -10% | 277.6 14% |

| 3DMark - 1280x720 Cloud Gate Standard Graphics | |
| Acer Swift 5 SF514-51-59AV | |
| Dell XPS 13 9360 FHD i5 | |
| Asus Zenbook 3 UX390UA-GS041T | |
| Medion Akoya S3409-MD60234 | |
| Lenovo IdeaPad 510S-13IKB 80V00026GE | |
| HP 15-ay116ng | |
| Lenovo Yoga 710-14IKB 80V4002HGE | |
| 3DMark 11 Performance | 1684 pontos | |
| 3DMark Cloud Gate Standard Score | 6378 pontos | |
Ajuda | ||
| BioShock Infinite | |
| 1366x768 Medium Preset | |
| Acer Swift 5 SF514-51-59AV | |
| Medion Akoya S3409-MD60234 | |
| Asus Zenbook 3 UX390UA-GS041T | |
| Lenovo IdeaPad 510S-13IKB 80V00026GE | |
| 1366x768 High Preset | |
| Acer Swift 5 SF514-51-59AV | |
| Medion Akoya S3409-MD60234 | |
| Lenovo IdeaPad 510S-13IKB 80V00026GE | |
| Asus Zenbook 3 UX390UA-GS041T | |
| baixo | média | alto | ultra | |
|---|---|---|---|---|
| BioShock Infinite (2013) | 51 | 30.9 | 25.6 | 8.2 |
| The Witcher 3 (2015) | 12.1 | 8.4 | 4.2 | |
| Rise of the Tomb Raider (2016) | 20.23 | 11.42 | 6.42 | 4.8 |
Barulho
| Ocioso |
| 30.5 / 30.5 / 30.5 dB |
| Carga |
| 32.25 / 32.6 dB |
 | ||
30 dB silencioso 40 dB(A) audível 50 dB(A) ruidosamente alto |
||
min: | ||
(+) A temperatura máxima no lado superior é 39.4 °C / 103 F, em comparação com a média de 35.9 °C / 97 F , variando de 21.4 a 59 °C para a classe Subnotebook.
(±) A parte inferior aquece até um máximo de 40 °C / 104 F, em comparação com a média de 39.2 °C / 103 F
(+) Em uso inativo, a temperatura média para o lado superior é 24 °C / 75 F, em comparação com a média do dispositivo de 30.8 °C / ### class_avg_f### F.
(+) Os apoios para as mãos e o touchpad são mais frios que a temperatura da pele, com um máximo de 27.3 °C / 81.1 F e, portanto, são frios ao toque.
(±) A temperatura média da área do apoio para as mãos de dispositivos semelhantes foi 28.2 °C / 82.8 F (+0.9 °C / 1.7 F).
Acer Swift 5 SF514-51-59AV análise de áudio
(-) | alto-falantes não muito altos (###valor### dB)
Graves 100 - 315Hz
(±) | graves reduzidos - em média 14.7% menor que a mediana
(±) | a linearidade dos graves é média (13.5% delta para a frequência anterior)
Médios 400 - 2.000 Hz
(±) | médios mais altos - em média 5.3% maior que a mediana
(±) | a linearidade dos médios é média (7.3% delta para frequência anterior)
Altos 2 - 16 kHz
(+) | agudos equilibrados - apenas 3.9% longe da mediana
(±) | a linearidade dos máximos é média (8.1% delta para frequência anterior)
Geral 100 - 16.000 Hz
(±) | a linearidade do som geral é média (22% diferença em relação à mediana)
Comparado com a mesma classe
» 75% de todos os dispositivos testados nesta classe foram melhores, 6% semelhantes, 19% piores
» O melhor teve um delta de 5%, a média foi 18%, o pior foi 53%
Comparado com todos os dispositivos testados
» 64% de todos os dispositivos testados foram melhores, 6% semelhantes, 30% piores
» O melhor teve um delta de 4%, a média foi 23%, o pior foi 134%
Apple MacBook 12 (Early 2016) 1.1 GHz análise de áudio
(+) | os alto-falantes podem tocar relativamente alto (###valor### dB)
Graves 100 - 315Hz
(±) | graves reduzidos - em média 11.3% menor que a mediana
(±) | a linearidade dos graves é média (14.2% delta para a frequência anterior)
Médios 400 - 2.000 Hz
(+) | médios equilibrados - apenas 2.4% longe da mediana
(+) | médios são lineares (5.5% delta para frequência anterior)
Altos 2 - 16 kHz
(+) | agudos equilibrados - apenas 2% longe da mediana
(+) | os máximos são lineares (4.5% delta da frequência anterior)
Geral 100 - 16.000 Hz
(+) | o som geral é linear (10.2% diferença em relação à mediana)
Comparado com a mesma classe
» 7% de todos os dispositivos testados nesta classe foram melhores, 2% semelhantes, 90% piores
» O melhor teve um delta de 5%, a média foi 18%, o pior foi 53%
Comparado com todos os dispositivos testados
» 5% de todos os dispositivos testados foram melhores, 1% semelhantes, 94% piores
» O melhor teve um delta de 4%, a média foi 23%, o pior foi 134%
| desligado | |
| Ocioso | |
| Carga |
|
Key:
min: | |
| Acer Swift 5 SF514-51-59AV i5-7200U, HD Graphics 620, SK Hynix HFS256G39TND-N210A, IPS, 1920x1080, 14" | Lenovo IdeaPad 510S-13IKB 80V00026GE i7-7500U, HD Graphics 620, Samsung MZYTY256HDHP, IPS, 1920x1080, 13.3" | Medion Akoya S3409-MD60234 i7-7500U, HD Graphics 620, Phison S10C-512G, IPS, 3200x1800, 13.3" | Dell XPS 13 9360 FHD i5 i5-7200U, HD Graphics 620, Toshiba NVMe THNSN5256GPUK, IPS, 1920x1080, 13.3" | Asus Zenbook 3 UX390UA-GS041T i5-7200U, HD Graphics 620, SK Hynix Canvas SC300 512GB M.2 (HFS512G39MND), IPS, 1920x1080, 12.5" | |
|---|---|---|---|---|---|
| Power Consumption | 16% | -11% | 24% | 10% | |
| Idle Minimum * (Watt) | 3.6 | 3.3 8% | 4.2 -17% | 4.1 -14% | 3.3 8% |
| Idle Average * (Watt) | 7 | 5.8 17% | 9 -29% | 4.2 40% | 6.2 11% |
| Idle Maximum * (Watt) | 9.3 | 7.4 20% | 10.6 -14% | 5.1 45% | 10.4 -12% |
| Load Average * (Watt) | 37 | 29.2 21% | 34 8% | 22.1 40% | 28 24% |
| Load Maximum * (Watt) | 32.6 | 28.6 12% | 33 -1% | 29.4 10% | 25.7 21% |
* ... menor é melhor
| Acer Swift 5 SF514-51-59AV i5-7200U, HD Graphics 620, 53.9 Wh | Lenovo IdeaPad 510S-13IKB 80V00026GE i7-7500U, HD Graphics 620, 35 Wh | Medion Akoya S3409-MD60234 i7-7500U, HD Graphics 620, 45 Wh | Dell XPS 13 9360 FHD i5 i5-7200U, HD Graphics 620, 60 Wh | Asus Zenbook 3 UX390UA-GS041T i5-7200U, HD Graphics 620, 40 Wh | |
|---|---|---|---|---|---|
| Duração da bateria | -24% | -35% | 35% | -18% | |
| Reader / Idle (h) | 16.9 | 10.8 -36% | 12 -29% | 21.6 28% | 14.1 -17% |
| H.264 (h) | 9.3 | 5.5 -41% | 4.1 -56% | 6.4 -31% | |
| WiFi v1.3 (h) | 9.2 | 5.7 -38% | 4.6 -50% | 11.3 23% | 6.6 -28% |
| Load (h) | 1.7 | 2 18% | 1.6 -6% | 2.6 53% | 1.8 6% |
Pro
Contra
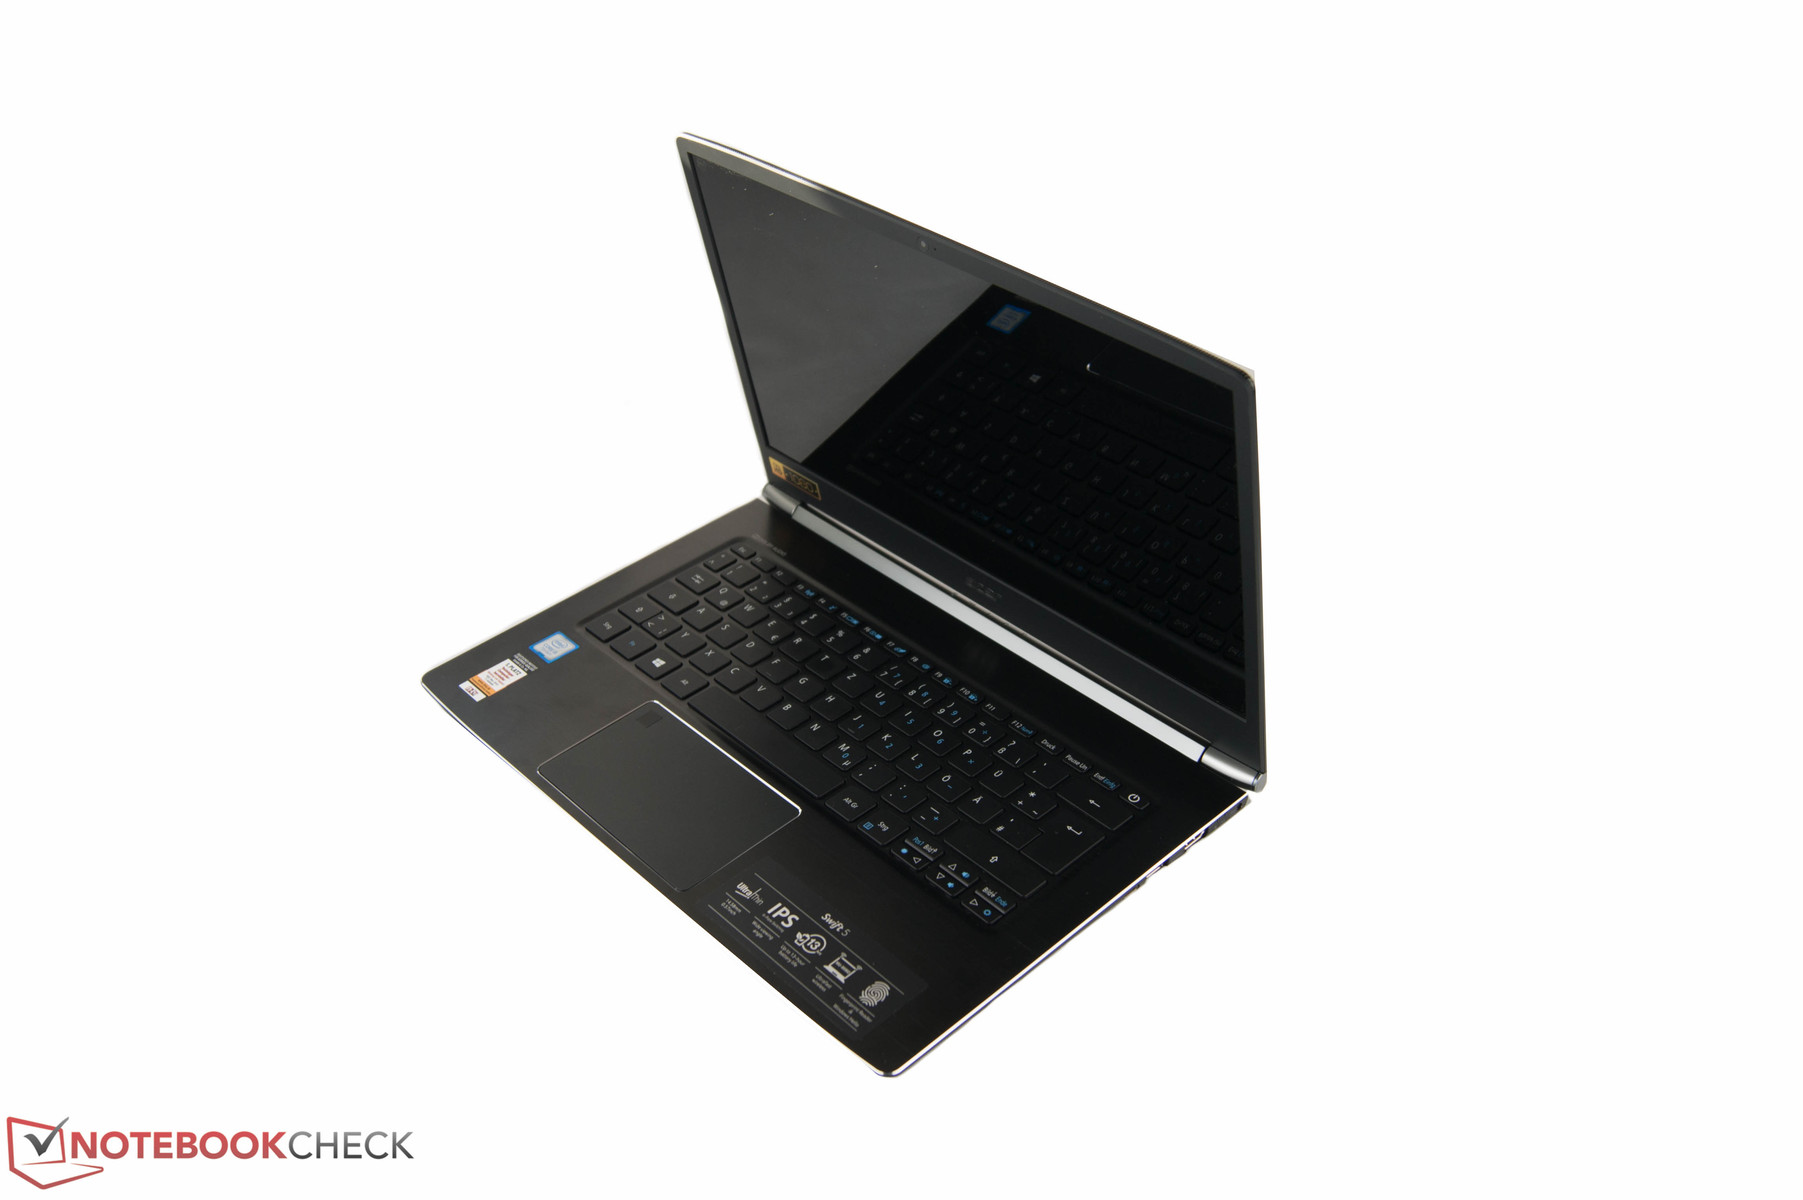
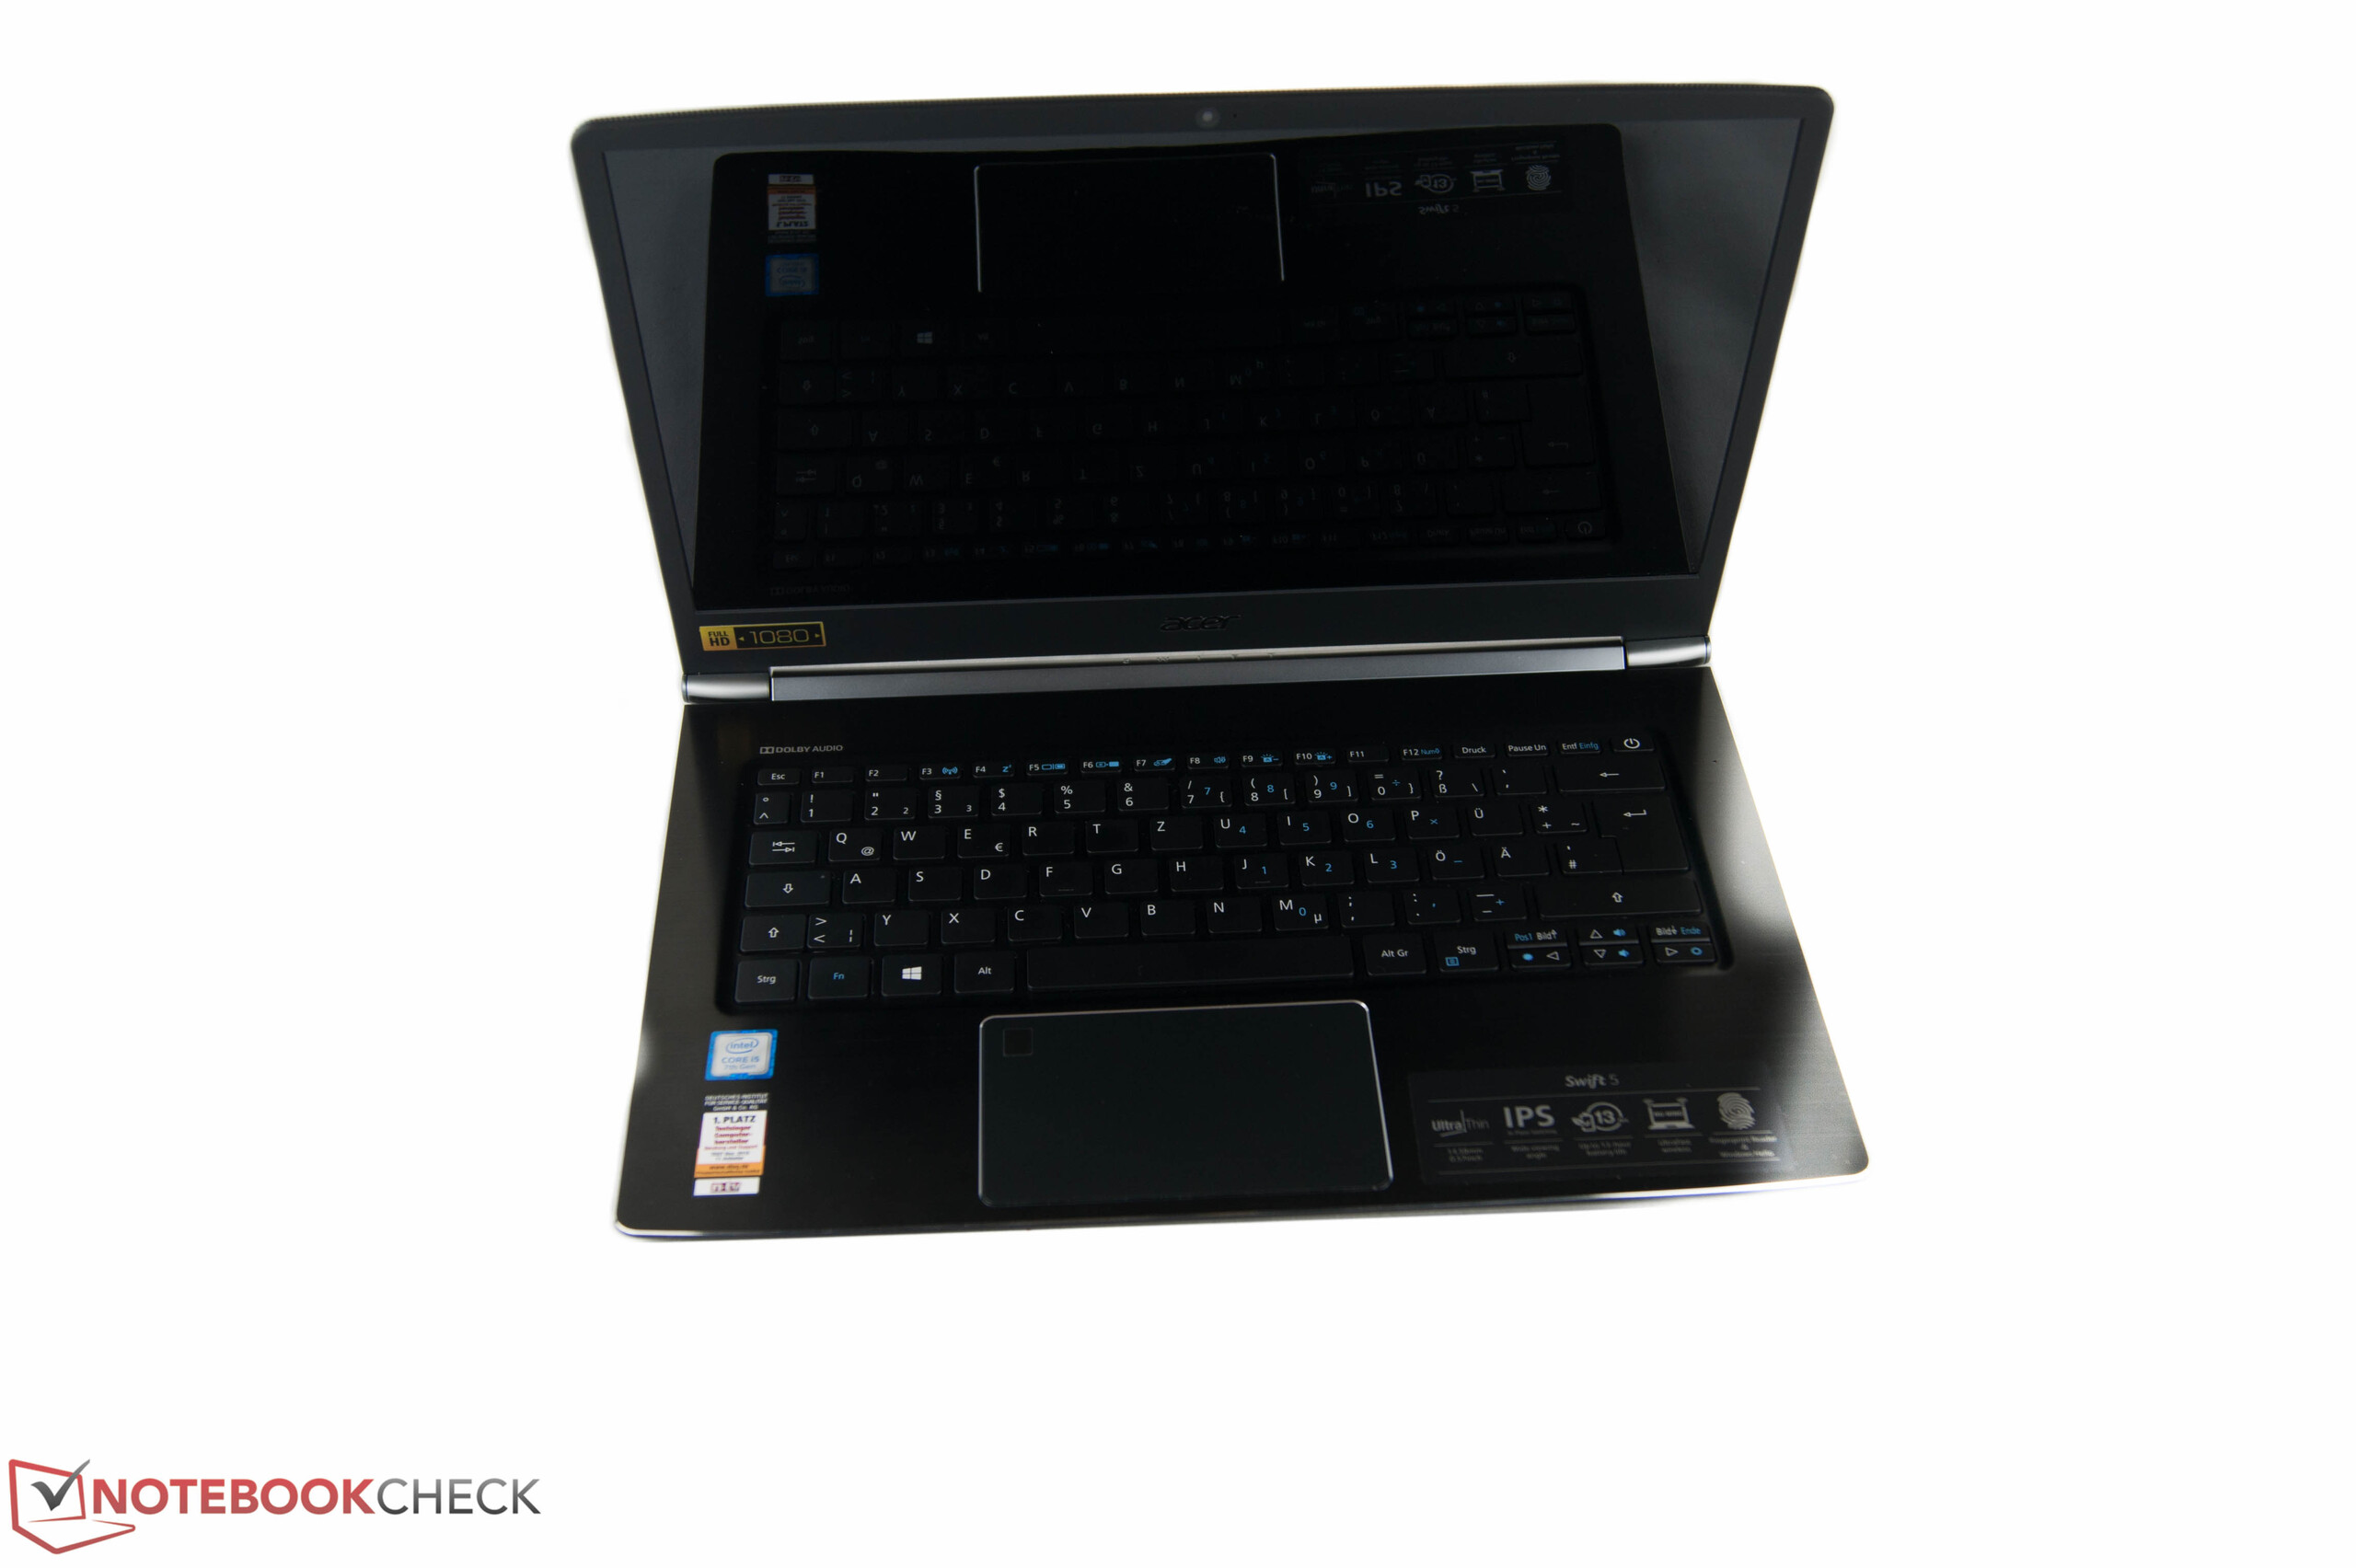
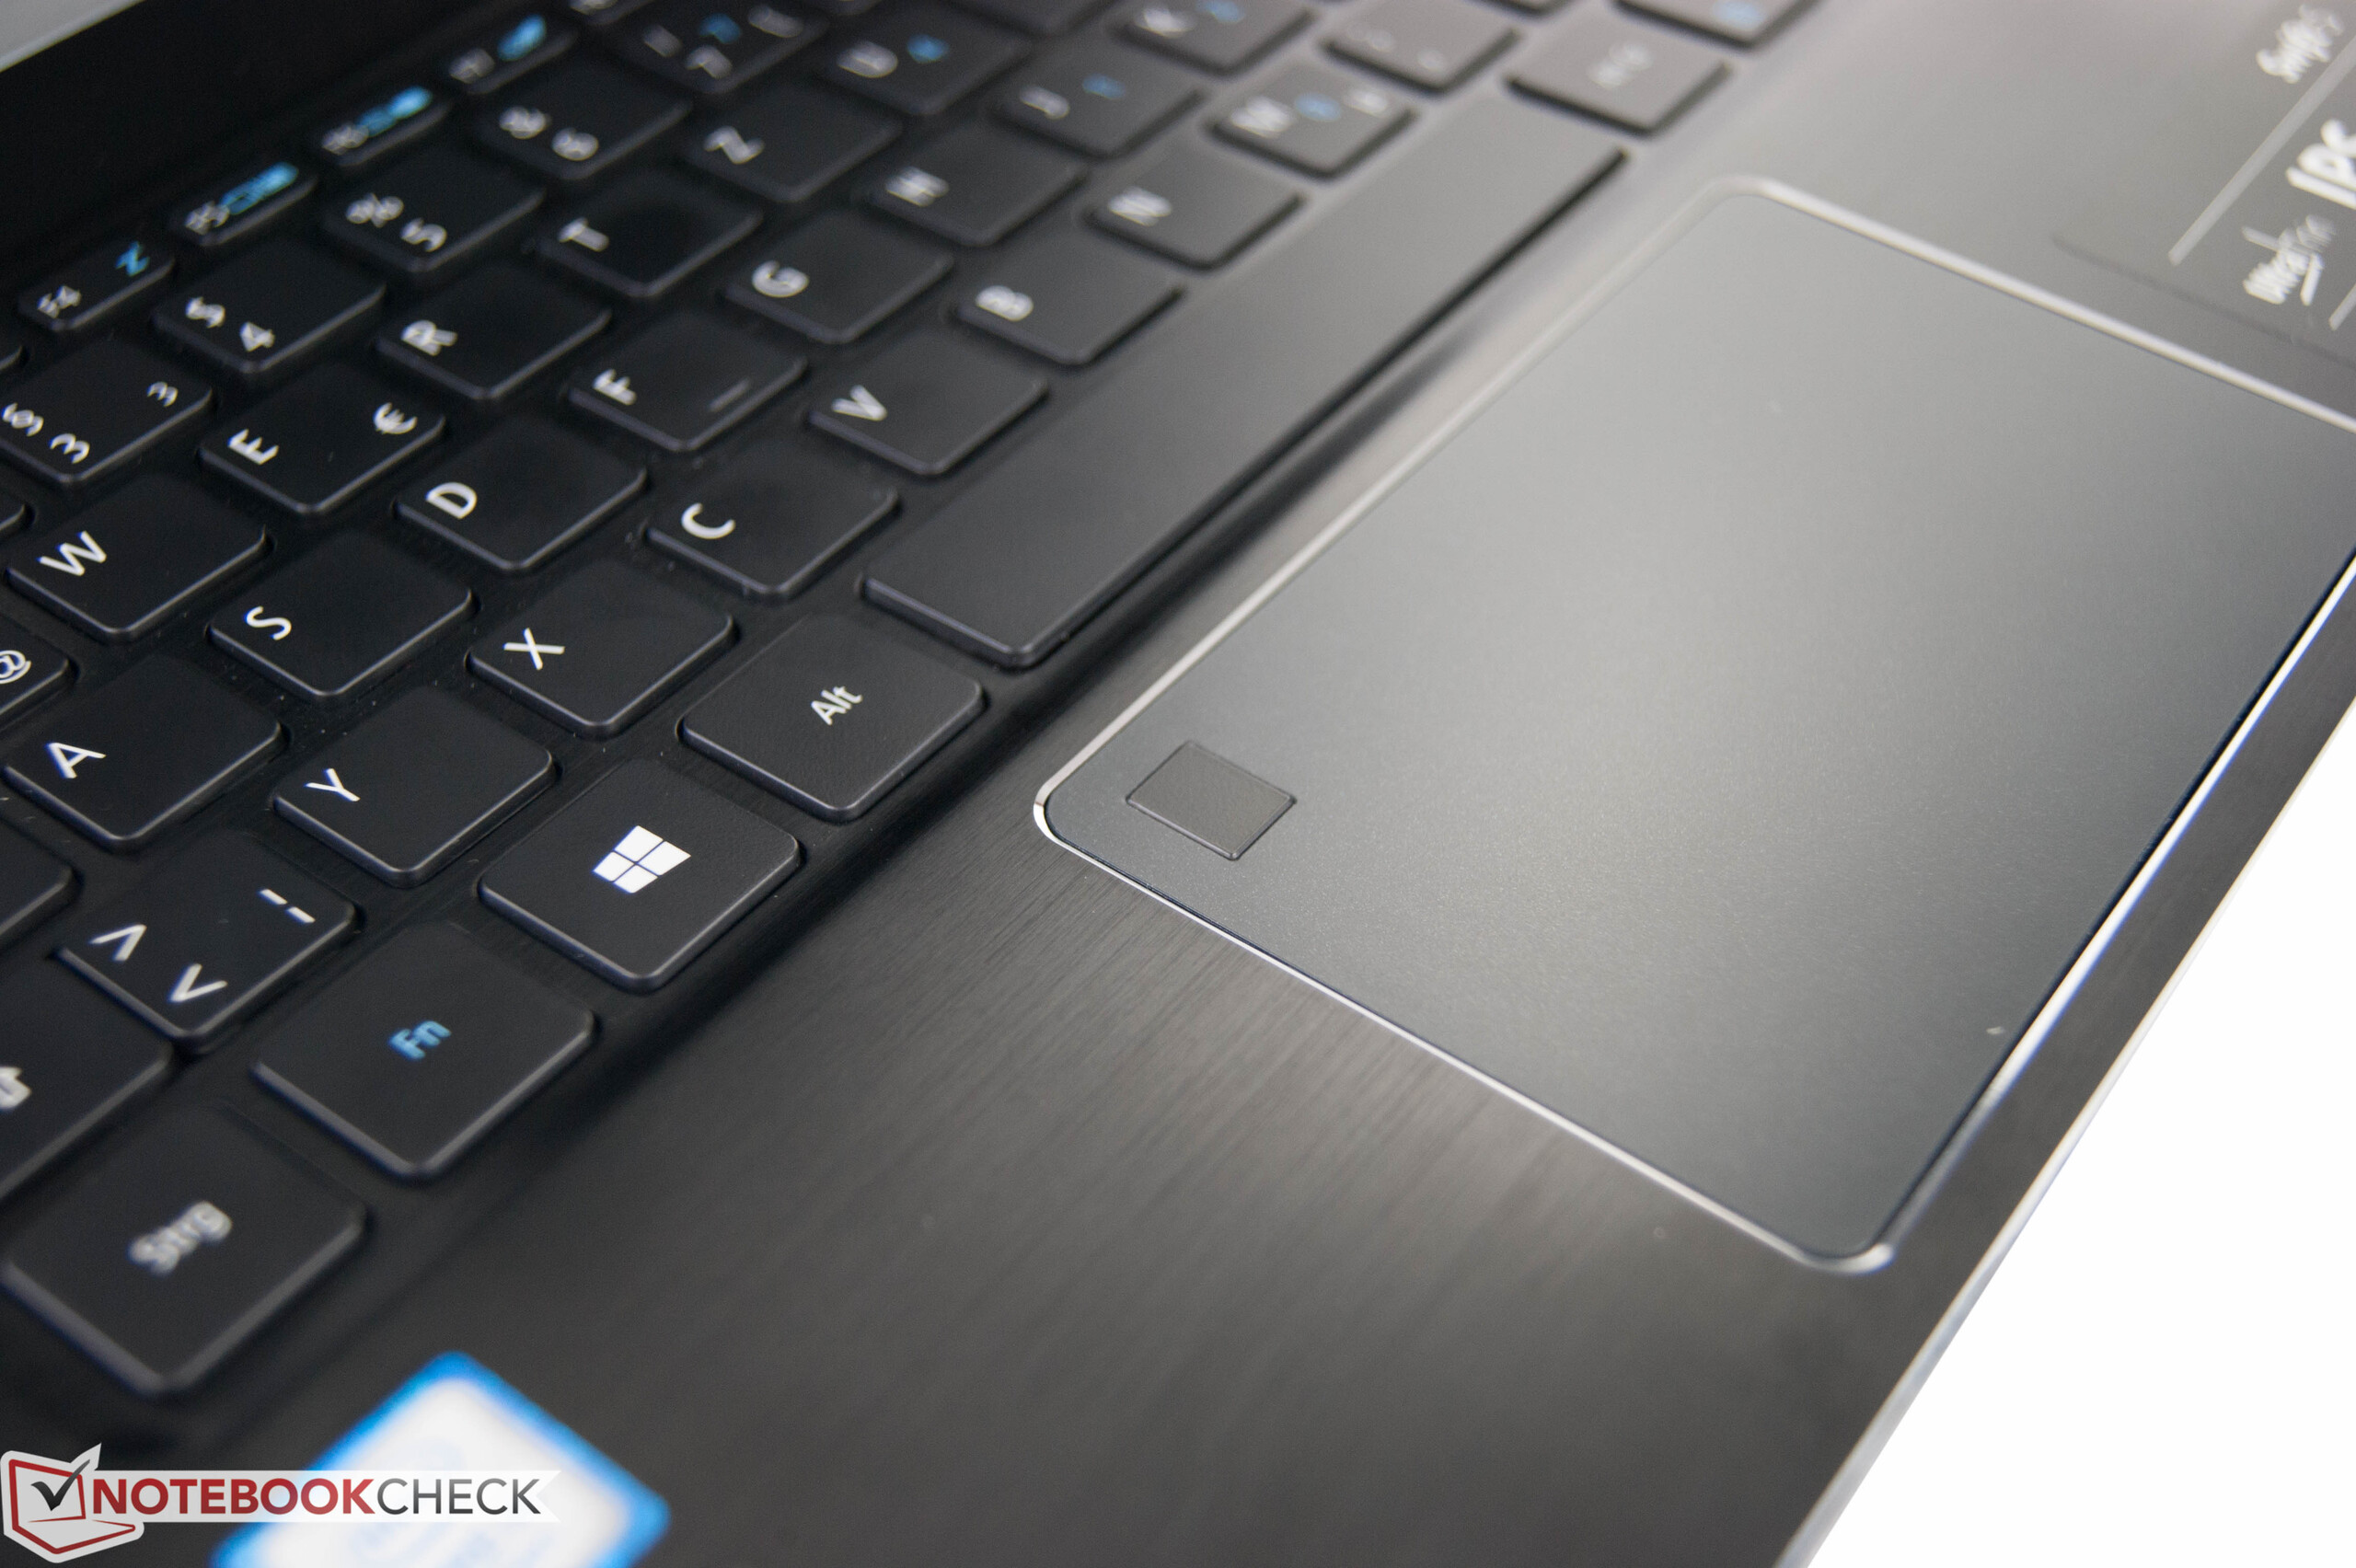
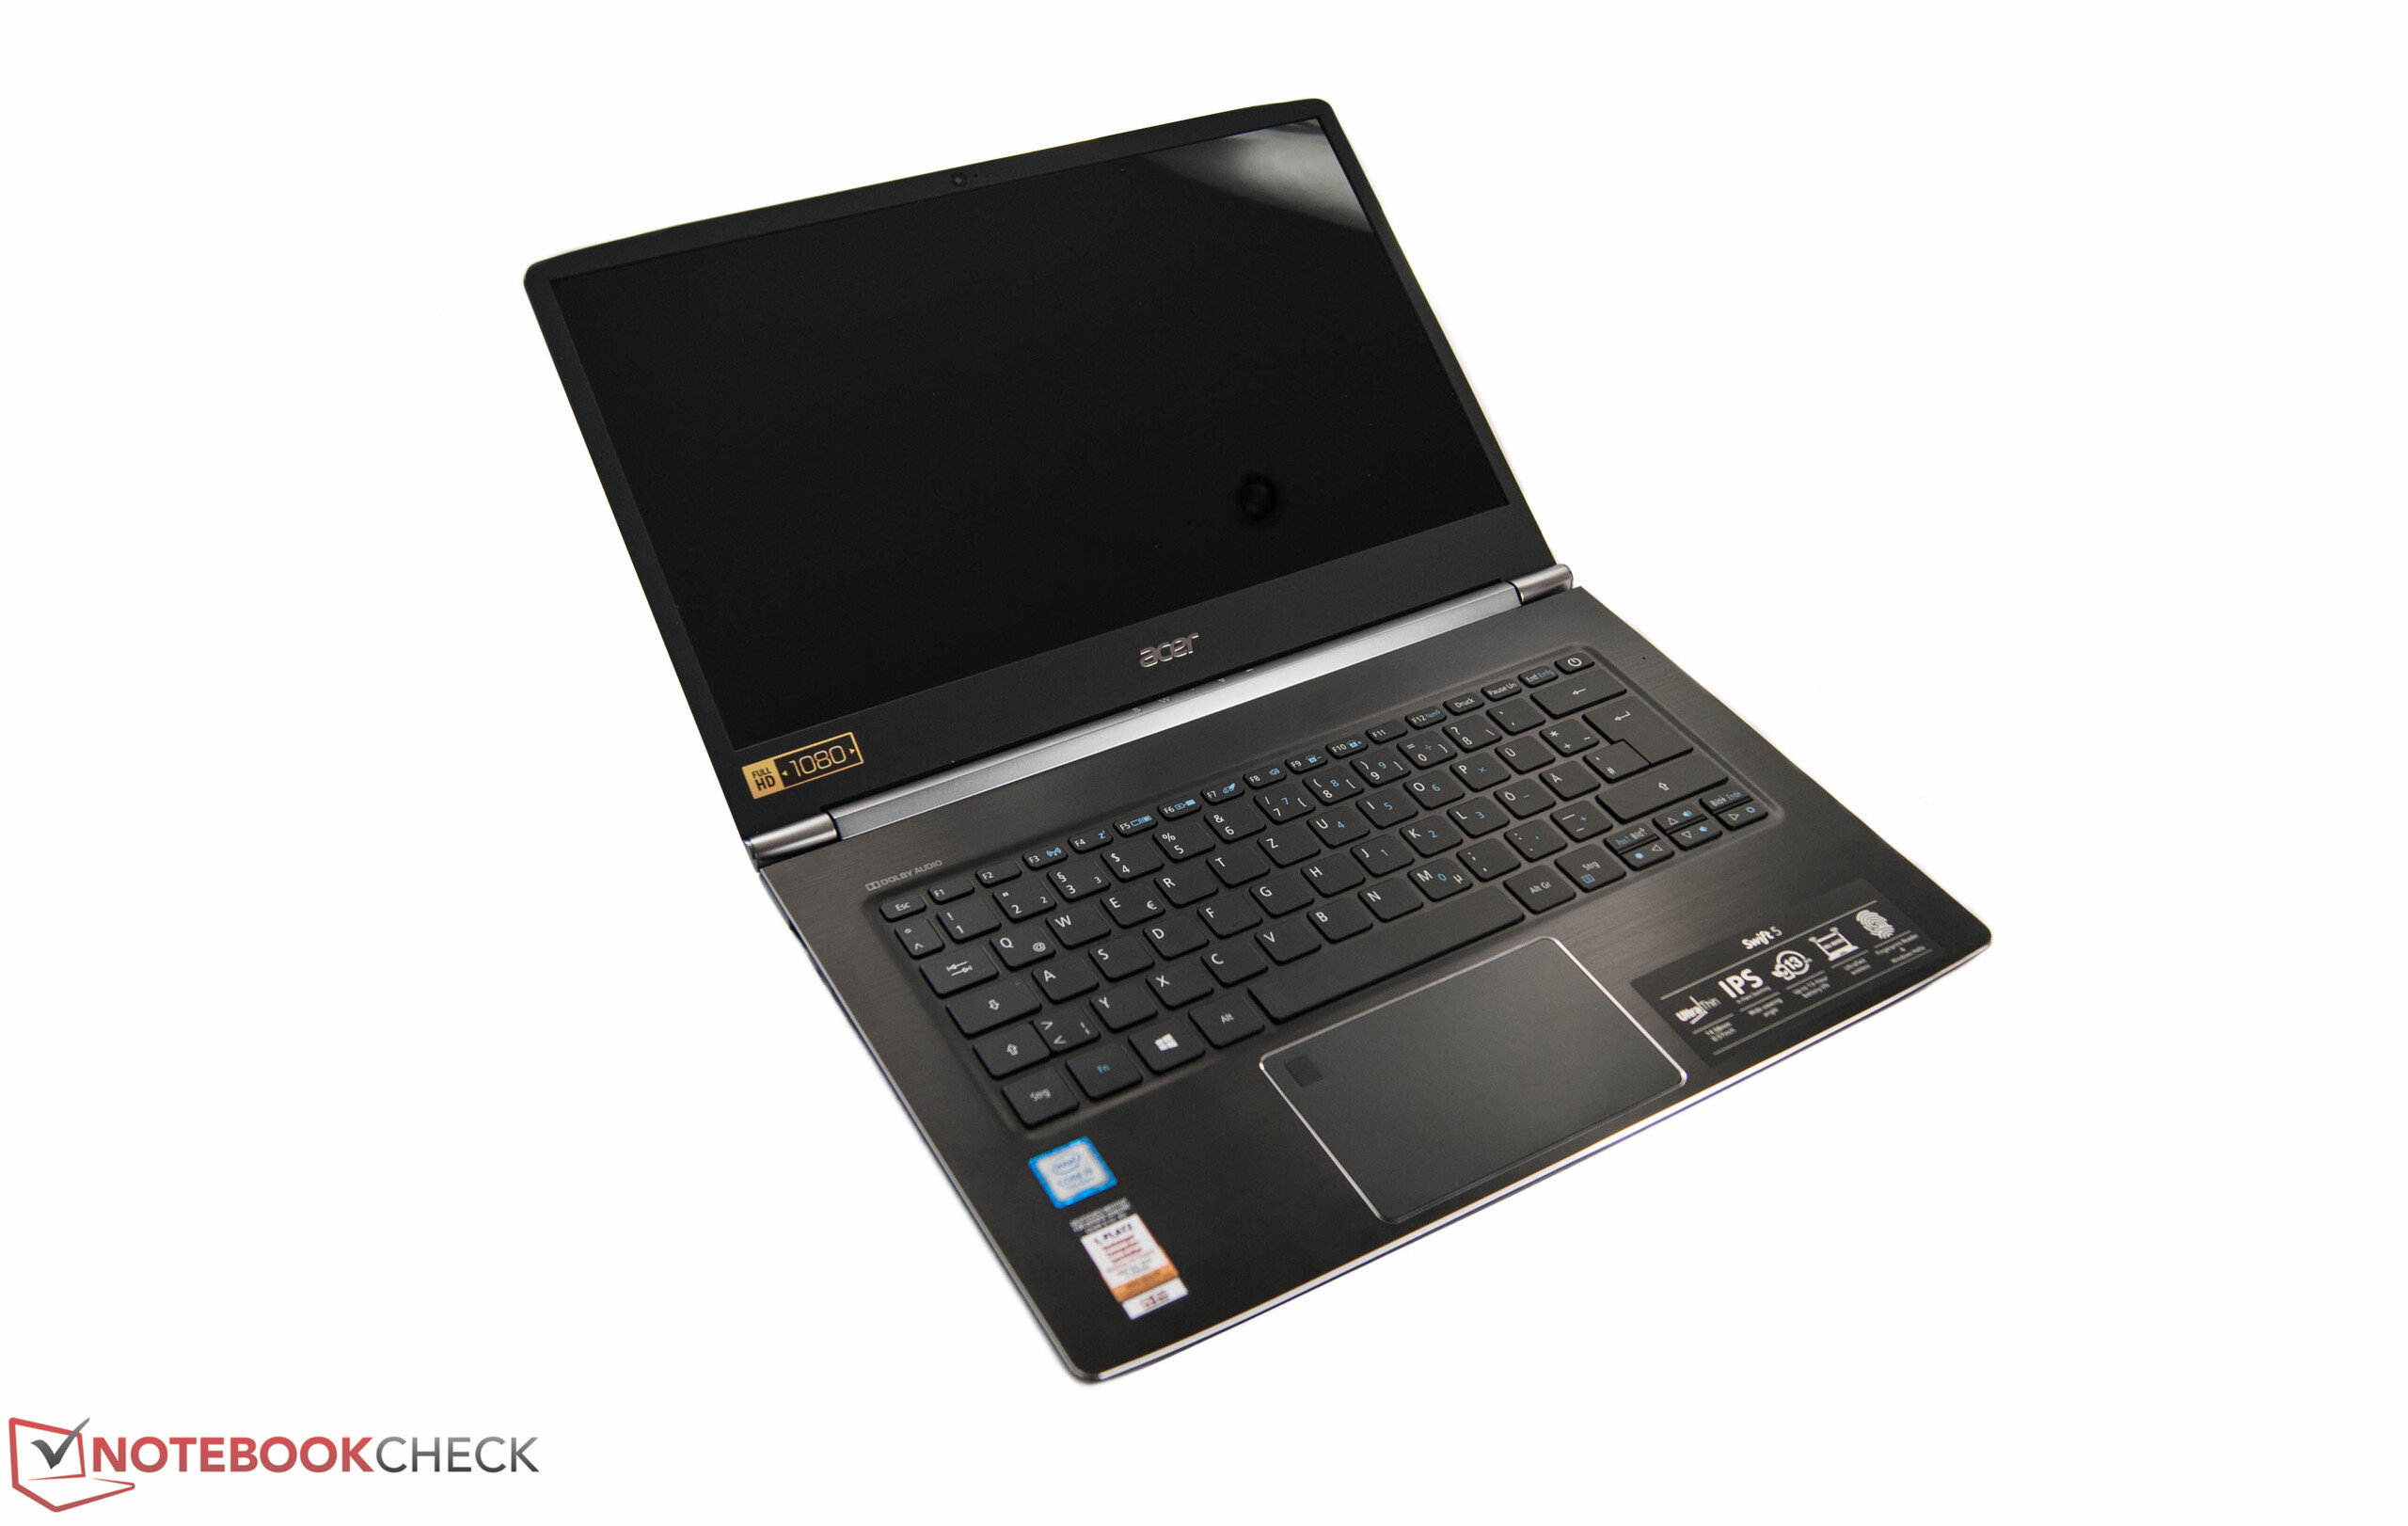
Successful mixture: Acer combines elegant design with sufficient performance, but does not forget the important emissions. We liked the elegant chassis design with the extremely thin bezels in particular. But that's not all: Acer uses solid metal elements and convinces with good build quality, only the keyboard unit can be pushed in. The key travel is also rather short, but the keys can convince with a firm pressure point and low noise development during typing. The glossy IPS display features the Full HD resolution and manages decent results for both the luminance and the contrast. The hardware equipment of the Swift 5 is very balanced, and the processor can almost utilize its maximum performance under load, which cannot be said for the comparison devices. The temperature development is also okay when you consider the performance. The last important aspect for a subnotebook is the battery runtime. The Swift 5 does not last as long as the Dell XPS 13, but you can still manage a full business day without a socket.
The new Acer Swift 5 combines almost all the important aspects for a subnotebook and is available for a fair entry-level price of 900 Euros (~$947).
You should definitely have a look at the Dell XPS 13 9360 if you are on the road most of the time. It convinces with a matte display and very long battery runtimes. Even lighter and slimmer: the rival from Asus for 1,500 Euros (~$1610).
Acer Swift 5 SF514-51-59AV
- 12/22/2016 v6 (old)
Nino Ricchizzi
Price comparison
