Breve Análise do Portátil Acer Swift 5 SF514 (i5-8250U, UHD 620)
| SD Card Reader | |
| maximum SDCardreader Maximum Transfer Rate | |
| Média da turma Subnotebook (24.9 - 195, n=8, últimos 2 anos) | |
| average SDCardreader Average Transfer Rate | |
| Média da turma Subnotebook (23.7 - 188, n=9, últimos 2 anos) | |
| |||||||||||||||||||||||||
iluminação: 86 %
iluminação com acumulador: 254 cd/m²
Contraste: 1016:1 (Preto: 0.25 cd/m²)
ΔE ColorChecker Calman: 3.85 | ∀{0.5-29.43 Ø4.72}
calibrated: 3.66
ΔE Greyscale Calman: 4.1 | ∀{0.09-98 Ø4.97}
97% sRGB (Argyll 1.6.3 3D)
63% AdobeRGB 1998 (Argyll 1.6.3 3D)
71% AdobeRGB 1998 (Argyll 3D)
97.1% sRGB (Argyll 3D)
69.7% Display P3 (Argyll 3D)
Gamma: 2.43
CCT: 7369 K
| Acer Swift 5 SF514-52T-59HY AU Optronics AUO203D, , 1920x1080, 14" | Acer Swift 5 SF514-51-59AV AU Optronics B140HAN3.2, , 1920x1080, 14" | Acer Swift 3 (i5-7200U, HD 620) Chi Mei CMN14C9, , 1920x1080, 14" | Toshiba Tecra X40-D Toshiba TOS508F, , 1920x1080, 14" | Asus Zenbook 3 Deluxe UX490UA AU Optronics AUO383D / B140HAN03.8, , 1920x1080, 14" | Lenovo ThinkPad X1 Carbon 2017-20HR0021GE B140HAN03_1, , 1920x1080, 14" | |
|---|---|---|---|---|---|---|
| Display | -8% | -39% | -40% | -14% | -11% | |
| Display P3 Coverage (%) | 69.7 | 62.8 -10% | 40.96 -41% | 40.55 -42% | 58.7 -16% | 61.6 -12% |
| sRGB Coverage (%) | 97.1 | 91.3 -6% | 61.4 -37% | 61 -37% | 86.9 -11% | 87.6 -10% |
| AdobeRGB 1998 Coverage (%) | 71 | 64.3 -9% | 42.34 -40% | 41.89 -41% | 59.9 -16% | 62.6 -12% |
| Response Times | -30% | -19% | -10% | 7% | -31% | |
| Response Time Grey 50% / Grey 80% * (ms) | 37 ? | 51 ? -38% | 43 ? -16% | 38 ? -3% | 24 ? 35% | 48 ? -30% |
| Response Time Black / White * (ms) | 23 ? | 28 ? -22% | 28 ? -22% | 26.8 ? -17% | 28 ? -22% | 30.4 ? -32% |
| PWM Frequency (Hz) | 200 ? | 20410 ? | ||||
| Screen | -10% | -20% | -33% | 6% | 11% | |
| Brightness middle (cd/m²) | 254 | 393 55% | 281 11% | 283.9 12% | 337 33% | 278 9% |
| Brightness (cd/m²) | 231 | 338 46% | 259 12% | 261 13% | 295 28% | 271 17% |
| Brightness Distribution (%) | 86 | 79 -8% | 81 -6% | 85 -1% | 81 -6% | 91 6% |
| Black Level * (cd/m²) | 0.25 | 0.29 -16% | 0.45 -80% | 0.25 -0% | 0.21 16% | 0.16 36% |
| Contrast (:1) | 1016 | 1355 33% | 624 -39% | 1136 12% | 1605 58% | 1738 71% |
| Colorchecker dE 2000 * | 3.85 | 6.17 -60% | 4.19 -9% | 6.4 -66% | 4.89 -27% | 4.5 -17% |
| Colorchecker dE 2000 max. * | 7.05 | 11.21 -59% | 10.64 -51% | 18.7 -165% | 8.43 -20% | 8.4 -19% |
| Colorchecker dE 2000 calibrated * | 3.66 | |||||
| Greyscale dE 2000 * | 4.1 | 6.8 -66% | 2.55 38% | 6.3 -54% | 4.28 -4% | 3.2 22% |
| Gamma | 2.43 91% | 2.27 97% | 2.24 98% | 2.39 92% | 2.25 98% | 2.02 109% |
| CCT | 7369 88% | 6873 95% | 6555 99% | 6511 100% | 7352 88% | 7042 92% |
| Color Space (Percent of AdobeRGB 1998) (%) | 63 | 51 -19% | 39 -38% | 38 -40% | 56 -11% | 57 -10% |
| Color Space (Percent of sRGB) (%) | 97 | 91 -6% | 61 -37% | 60 -38% | 87 -10% | 87.5 -10% |
| Média Total (Programa/Configurações) | -16% /
-12% | -26% /
-24% | -28% /
-31% | -0% /
2% | -10% /
1% |
* ... menor é melhor
Exibir tempos de resposta
| ↔ Tempo de resposta preto para branco | ||
|---|---|---|
| 23 ms ... ascensão ↗ e queda ↘ combinadas | ↗ 13 ms ascensão | 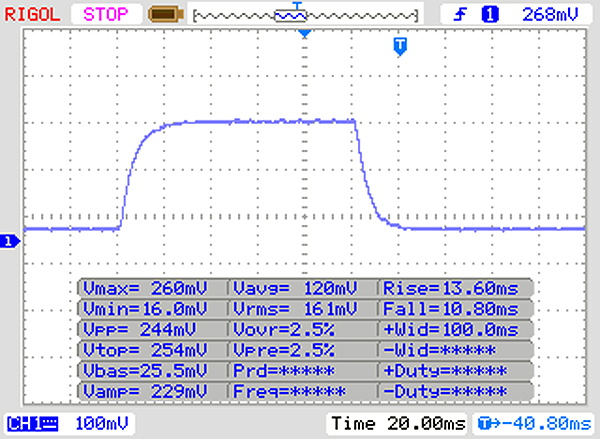 |
| ↘ 10 ms queda | ||
| A tela mostra boas taxas de resposta em nossos testes, mas pode ser muito lenta para jogadores competitivos. Em comparação, todos os dispositivos testados variam de 0.1 (mínimo) a 240 (máximo) ms. » 52 % de todos os dispositivos são melhores. Isso significa que o tempo de resposta medido é pior que a média de todos os dispositivos testados (19.8 ms). | ||
| ↔ Tempo de resposta 50% cinza a 80% cinza | ||
| 37 ms ... ascensão ↗ e queda ↘ combinadas | ↗ 17 ms ascensão | 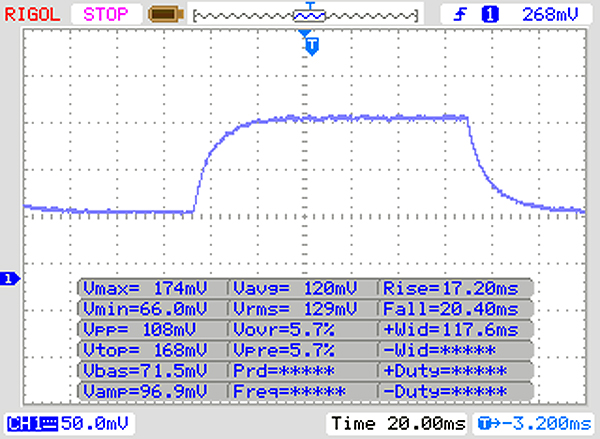 |
| ↘ 20 ms queda | ||
| A tela mostra taxas de resposta lentas em nossos testes e será insatisfatória para os jogadores. Em comparação, todos os dispositivos testados variam de 0.165 (mínimo) a 636 (máximo) ms. » 53 % de todos os dispositivos são melhores. Isso significa que o tempo de resposta medido é pior que a média de todos os dispositivos testados (31 ms). | ||
Cintilação da tela / PWM (modulação por largura de pulso)
| Tela tremeluzindo / PWM não detectado | 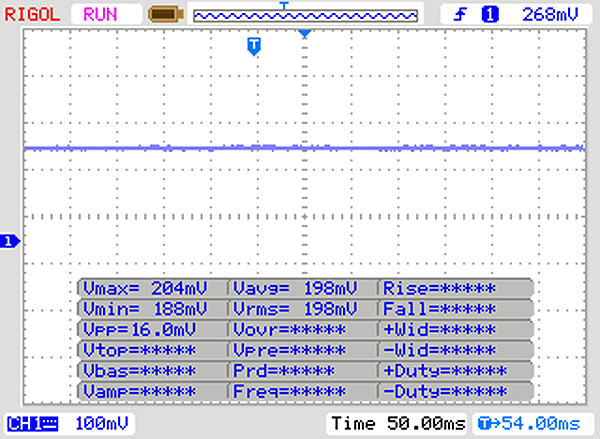 | ||
[pwm_comparison] Em comparação: 52 % de todos os dispositivos testados não usam PWM para escurecer a tela. Se PWM foi detectado, uma média de 7769 (mínimo: 5 - máximo: 343500) Hz foi medida. | |||

| PCMark 8 Home Score Accelerated v2 | 3264 pontos | |
| PCMark 8 Work Score Accelerated v2 | 4700 pontos | |
| PCMark 10 Score | 2619 pontos | |
Ajuda | ||
| Acer Swift 5 SF514-52T-59HY Intel SSD 600p SSDPEKKW256G7 | Acer Swift 5 SF514-51-59AV SK Hynix HFS256G39TND-N210A | Acer Swift 3 (i5-7200U, HD 620) Intel SSD 600p SSDPEKKW256G7 | Asus Zenbook 3 Deluxe UX490UA Micron 1100 MTFDDAV256TBN | Lenovo ThinkPad X1 Carbon 2017-20HR0021GE Toshiba THNSF5256GPUK | Média Intel SSD 600p SSDPEKKW256G7 | |
|---|---|---|---|---|---|---|
| CrystalDiskMark 3.0 | -25% | 12% | -23% | 23% | 15% | |
| Read Seq (MB/s) | 1113 | 517 -54% | 1137 2% | 435.3 -61% | 1277 15% | 1122 ? 1% |
| Write Seq (MB/s) | 597 | 258.1 -57% | 606 2% | 413.3 -31% | 648 9% | 524 ? -12% |
| Read 512 (MB/s) | 642 | 355 -45% | 800 25% | 325.9 -49% | 972 51% | 767 ? 19% |
| Write 512 (MB/s) | 472.8 | 258.5 -45% | 564 19% | 357 -24% | 311 -34% | 541 ? 14% |
| Read 4k (MB/s) | 29.58 | 29.65 0% | 31.6 7% | 26.28 -11% | 34.63 17% | 29.9 ? 1% |
| Write 4k (MB/s) | 89.2 | 77.3 -13% | 108.3 21% | 85.6 -4% | 128.5 44% | 114.5 ? 28% |
| Read 4k QD32 (MB/s) | 289.5 | 277.1 -4% | 290.1 0% | 246.7 -15% | 477.3 65% | 279 ? -4% |
| Write 4k QD32 (MB/s) | 203.3 | 242.5 19% | 251 23% | 224.4 10% | 241.2 19% | 356 ? 75% |

| 3DMark 11 Performance | 1580 pontos | |
| 3DMark Cloud Gate Standard Score | 6668 pontos | |
| 3DMark Fire Strike Score | 903 pontos | |
Ajuda | ||
| The Witcher 3 | |
| 1024x768 Low Graphics & Postprocessing | |
| Média da turma Subnotebook (38.8 - 176, n=13, últimos 2 anos) | |
| Média Intel UHD Graphics 620 (8.8 - 50.9, n=64) | |
| Asus Zenbook 3 Deluxe UX490UA | |
| Acer Swift 5 SF514-51-59AV | |
| Lenovo ThinkPad X1 Carbon 2017-20HR0021GE | |
| Acer Swift 5 SF514-52T-59HY | |
| 1366x768 Medium Graphics & Postprocessing | |
| Média da turma Subnotebook (71 - 115, n=8, últimos 2 anos) | |
| Média Intel UHD Graphics 620 (8 - 27.9, n=29) | |
| Acer Swift 5 SF514-51-59AV | |
| Acer Swift 5 SF514-52T-59HY | |
| Rocket League | |
| 1280x720 Performance | |
| Média Intel UHD Graphics 620 (20.1 - 95, n=26) | |
| Acer Swift 5 SF514-52T-59HY | |
| 1920x1080 Performance | |
| Média Intel UHD Graphics 620 (17.1 - 78.4, n=13) | |
| Acer Swift 5 SF514-52T-59HY | |
| 1920x1080 Quality AA:Medium FX | |
| Média Intel UHD Graphics 620 (13.1 - 43, n=24) | |
| Acer Swift 5 SF514-52T-59HY | |
| 1920x1080 High Quality AA:High FX | |
| Média Intel UHD Graphics 620 (13.2 - 24.7, n=21) | |
| Acer Swift 5 SF514-52T-59HY | |
| Rise of the Tomb Raider | |
| 1024x768 Lowest Preset | |
| Média Intel UHD Graphics 620 (10.4 - 110.7, n=82) | |
| Asus Zenbook 3 Deluxe UX490UA | |
| Acer Swift 5 SF514-51-59AV | |
| Acer Swift 5 SF514-52T-59HY | |
| Lenovo ThinkPad X1 Carbon 2017-20HR0021GE | |
| 1366x768 Medium Preset AF:2x | |
| Média Intel UHD Graphics 620 (6.5 - 49.3, n=62) | |
| Acer Swift 5 SF514-51-59AV | |
| Acer Swift 5 SF514-52T-59HY | |
| Lenovo ThinkPad X1 Carbon 2017-20HR0021GE | |
| baixo | média | alto | ultra | |
|---|---|---|---|---|
| The Witcher 3 (2015) | 9.59 | 8 | ||
| Rise of the Tomb Raider (2016) | 17.18 | 9.32 | ||
| Rocket League (2017) | 57.6 | 23.74 | 14.52 |
Barulho
| Ocioso |
| 30.3 / 30.3 / 31.2 dB |
| Carga |
| 33.1 / 34.4 dB |
 | ||
30 dB silencioso 40 dB(A) audível 50 dB(A) ruidosamente alto |
||
min: | ||
| Acer Swift 5 SF514-52T-59HY UHD Graphics 620, i5-8250U, Intel SSD 600p SSDPEKKW256G7 | Acer Swift 5 SF514-51-59AV HD Graphics 620, i5-7200U, SK Hynix HFS256G39TND-N210A | Acer Swift 3 (i5-7200U, HD 620) HD Graphics 620, i5-7200U, Intel SSD 600p SSDPEKKW256G7 | Toshiba Tecra X40-D HD Graphics 620, i7-7600U, Samsung PM961 MZVLW256HEHP | Asus Zenbook 3 Deluxe UX490UA HD Graphics 620, i5-7200U, Micron 1100 MTFDDAV256TBN | Lenovo ThinkPad X1 Carbon 2017-20HR0021GE HD Graphics 620, i5-7200U, Toshiba THNSF5256GPUK | |
|---|---|---|---|---|---|---|
| Noise | 1% | 1% | 3% | -1% | -1% | |
| desligado / ambiente * (dB) | 30.3 | 30.5 -1% | 30.6 -1% | 28 8% | 30.2 -0% | 29.6 2% |
| Idle Minimum * (dB) | 30.3 | 30.5 -1% | 30.6 -1% | 28 8% | 30.2 -0% | 29.6 2% |
| Idle Average * (dB) | 30.3 | 30.5 -1% | 30.6 -1% | 28 8% | 30.2 -0% | 29.6 2% |
| Idle Maximum * (dB) | 31.2 | 30.5 2% | 31.1 -0% | 28.2 10% | 31.2 -0% | 32.2 -3% |
| Load Average * (dB) | 33.1 | 32.25 3% | 34 -3% | 33.2 -0% | 35.7 -8% | 34.2 -3% |
| Load Maximum * (dB) | 34.4 | 32.6 5% | 31.45 9% | 39.9 -16% | 34.2 1% | 36.1 -5% |
* ... menor é melhor
(±) A temperatura máxima no lado superior é 42.9 °C / 109 F, em comparação com a média de 35.9 °C / 97 F , variando de 21.4 a 59 °C para a classe Subnotebook.
(±) A parte inferior aquece até um máximo de 44.9 °C / 113 F, em comparação com a média de 39.2 °C / 103 F
(+) Em uso inativo, a temperatura média para o lado superior é 27 °C / 81 F, em comparação com a média do dispositivo de 30.8 °C / ### class_avg_f### F.
(+) Os apoios para as mãos e o touchpad são mais frios que a temperatura da pele, com um máximo de 28.7 °C / 83.7 F e, portanto, são frios ao toque.
(±) A temperatura média da área do apoio para as mãos de dispositivos semelhantes foi 28.2 °C / 82.8 F (-0.5 °C / -0.9 F).
| Acer Swift 5 SF514-52T-59HY UHD Graphics 620, i5-8250U, Intel SSD 600p SSDPEKKW256G7 | Acer Swift 5 SF514-51-59AV HD Graphics 620, i5-7200U, SK Hynix HFS256G39TND-N210A | Acer Swift 3 (i5-7200U, HD 620) HD Graphics 620, i5-7200U, Intel SSD 600p SSDPEKKW256G7 | Toshiba Tecra X40-D HD Graphics 620, i7-7600U, Samsung PM961 MZVLW256HEHP | Asus Zenbook 3 Deluxe UX490UA HD Graphics 620, i5-7200U, Micron 1100 MTFDDAV256TBN | Lenovo ThinkPad X1 Carbon 2017-20HR0021GE HD Graphics 620, i5-7200U, Toshiba THNSF5256GPUK | |
|---|---|---|---|---|---|---|
| Heat | 9% | 12% | 1% | 15% | -4% | |
| Maximum Upper Side * (°C) | 42.9 | 39.4 8% | 39.6 8% | 43 -0% | 33.3 22% | 48.5 -13% |
| Maximum Bottom * (°C) | 44.9 | 40 11% | 40.4 10% | 42 6% | 33.2 26% | 46.1 -3% |
| Idle Upper Side * (°C) | 28.4 | 25.8 9% | 23.7 17% | 29.2 -3% | 27 5% | 28.5 -0% |
| Idle Bottom * (°C) | 28.5 | 26.5 7% | 24.7 13% | 27.8 2% | 27.2 5% | 27.8 2% |
* ... menor é melhor
Acer Swift 5 SF514-52T-59HY análise de áudio
(-) | alto-falantes não muito altos (###valor### dB)
Graves 100 - 315Hz
(±) | graves reduzidos - em média 7.7% menor que a mediana
(+) | o baixo é linear (6.4% delta para a frequência anterior)
Médios 400 - 2.000 Hz
(±) | médios mais altos - em média 5.5% maior que a mediana
(+) | médios são lineares (6.8% delta para frequência anterior)
Altos 2 - 16 kHz
(+) | agudos equilibrados - apenas 2.7% longe da mediana
(+) | os máximos são lineares (6.5% delta da frequência anterior)
Geral 100 - 16.000 Hz
(±) | a linearidade do som geral é média (18.9% diferença em relação à mediana)
Comparado com a mesma classe
» 57% de todos os dispositivos testados nesta classe foram melhores, 6% semelhantes, 36% piores
» O melhor teve um delta de 5%, a média foi 18%, o pior foi 53%
Comparado com todos os dispositivos testados
» 44% de todos os dispositivos testados foram melhores, 8% semelhantes, 48% piores
» O melhor teve um delta de 4%, a média foi 24%, o pior foi 134%
Apple MacBook 12 (Early 2016) 1.1 GHz análise de áudio
(+) | os alto-falantes podem tocar relativamente alto (###valor### dB)
Graves 100 - 315Hz
(±) | graves reduzidos - em média 11.3% menor que a mediana
(±) | a linearidade dos graves é média (14.2% delta para a frequência anterior)
Médios 400 - 2.000 Hz
(+) | médios equilibrados - apenas 2.4% longe da mediana
(+) | médios são lineares (5.5% delta para frequência anterior)
Altos 2 - 16 kHz
(+) | agudos equilibrados - apenas 2% longe da mediana
(+) | os máximos são lineares (4.5% delta da frequência anterior)
Geral 100 - 16.000 Hz
(+) | o som geral é linear (10.2% diferença em relação à mediana)
Comparado com a mesma classe
» 7% de todos os dispositivos testados nesta classe foram melhores, 2% semelhantes, 91% piores
» O melhor teve um delta de 5%, a média foi 18%, o pior foi 53%
Comparado com todos os dispositivos testados
» 5% de todos os dispositivos testados foram melhores, 1% semelhantes, 94% piores
» O melhor teve um delta de 4%, a média foi 24%, o pior foi 134%
| desligado | |
| Ocioso | |
| Carga |
|
Key:
min: | |
| Acer Swift 5 SF514-52T-59HY i5-8250U, UHD Graphics 620, Intel SSD 600p SSDPEKKW256G7, IPS, 1920x1080, 14" | Acer Swift 5 SF514-51-59AV i5-7200U, HD Graphics 620, SK Hynix HFS256G39TND-N210A, IPS, 1920x1080, 14" | Acer Swift 3 (i5-7200U, HD 620) i5-7200U, HD Graphics 620, Intel SSD 600p SSDPEKKW256G7, IPS, 1920x1080, 14" | Toshiba Tecra X40-D i7-7600U, HD Graphics 620, Samsung PM961 MZVLW256HEHP, IPS, 1920x1080, 14" | Asus Zenbook 3 Deluxe UX490UA i5-7200U, HD Graphics 620, Micron 1100 MTFDDAV256TBN, IPS, 1920x1080, 14" | Lenovo ThinkPad X1 Carbon 2017-20HR0021GE i5-7200U, HD Graphics 620, Toshiba THNSF5256GPUK, IPS, 1920x1080, 14" | Média Intel UHD Graphics 620 | Média da turma Subnotebook | |
|---|---|---|---|---|---|---|---|---|
| Power Consumption | -48% | -35% | -38% | -24% | -53% | -59% | -77% | |
| Idle Minimum * (Watt) | 2.8 | 3.6 -29% | 3.7 -32% | 5.2 -86% | 3.3 -18% | 3.8 -36% | 3.81 ? -36% | 3.86 ? -38% |
| Idle Average * (Watt) | 4.8 | 7 -46% | 6.1 -27% | 6.9 -44% | 6.1 -27% | 7.1 -48% | 6.94 ? -45% | 6.61 ? -38% |
| Idle Maximum * (Watt) | 6.3 | 9.3 -48% | 8.8 -40% | 7 -11% | 10.1 -60% | 8.3 -32% | 8.75 ? -39% | 8 ? -27% |
| Load Average * (Watt) | 21 | 37 -76% | 30.6 -46% | 24.6 -17% | 24.6 -17% | 34.2 -63% | 35 ? -67% | 42.2 ? -101% |
| Load Maximum * (Watt) | 23 | 32.6 -42% | 29.6 -29% | 30.1 -31% | 22 4% | 43.3 -88% | 47.5 ? -107% | 64.5 ? -180% |
* ... menor é melhor
| Acer Swift 5 SF514-52T-59HY i5-8250U, UHD Graphics 620, 36 Wh | Acer Swift 5 SF514-51-59AV i5-7200U, HD Graphics 620, 53.9 Wh | Acer Swift 3 (i5-7200U, HD 620) i5-7200U, HD Graphics 620, 48 Wh | Toshiba Tecra X40-D i7-7600U, HD Graphics 620, 48 Wh | Asus Zenbook 3 Deluxe UX490UA i5-7200U, HD Graphics 620, 46 Wh | Lenovo ThinkPad X1 Carbon 2017-20HR0021GE i5-7200U, HD Graphics 620, 57 Wh | Média da turma Subnotebook | |
|---|---|---|---|---|---|---|---|
| Duração da bateria | 18% | 110% | -3% | 31% | 16% | 81% | |
| Reader / Idle (h) | 16 | 16.9 6% | 14.6 -9% | 17.2 8% | 13.7 -14% | 28.6 ? 79% | |
| H.264 (h) | 7.8 | 9.3 19% | 9.6 23% | 15.4 ? 97% | |||
| WiFi v1.3 (h) | 5.2 | 9.2 77% | 10.9 110% | 6 15% | 9.4 81% | 9.1 75% | 14 ? 169% |
| Load (h) | 2.5 | 1.7 -32% | 2.1 -16% | 2.6 4% | 2 -20% | 1.969 ? -21% | |
| WiFi (h) | 10.9 |
Pro
Contra
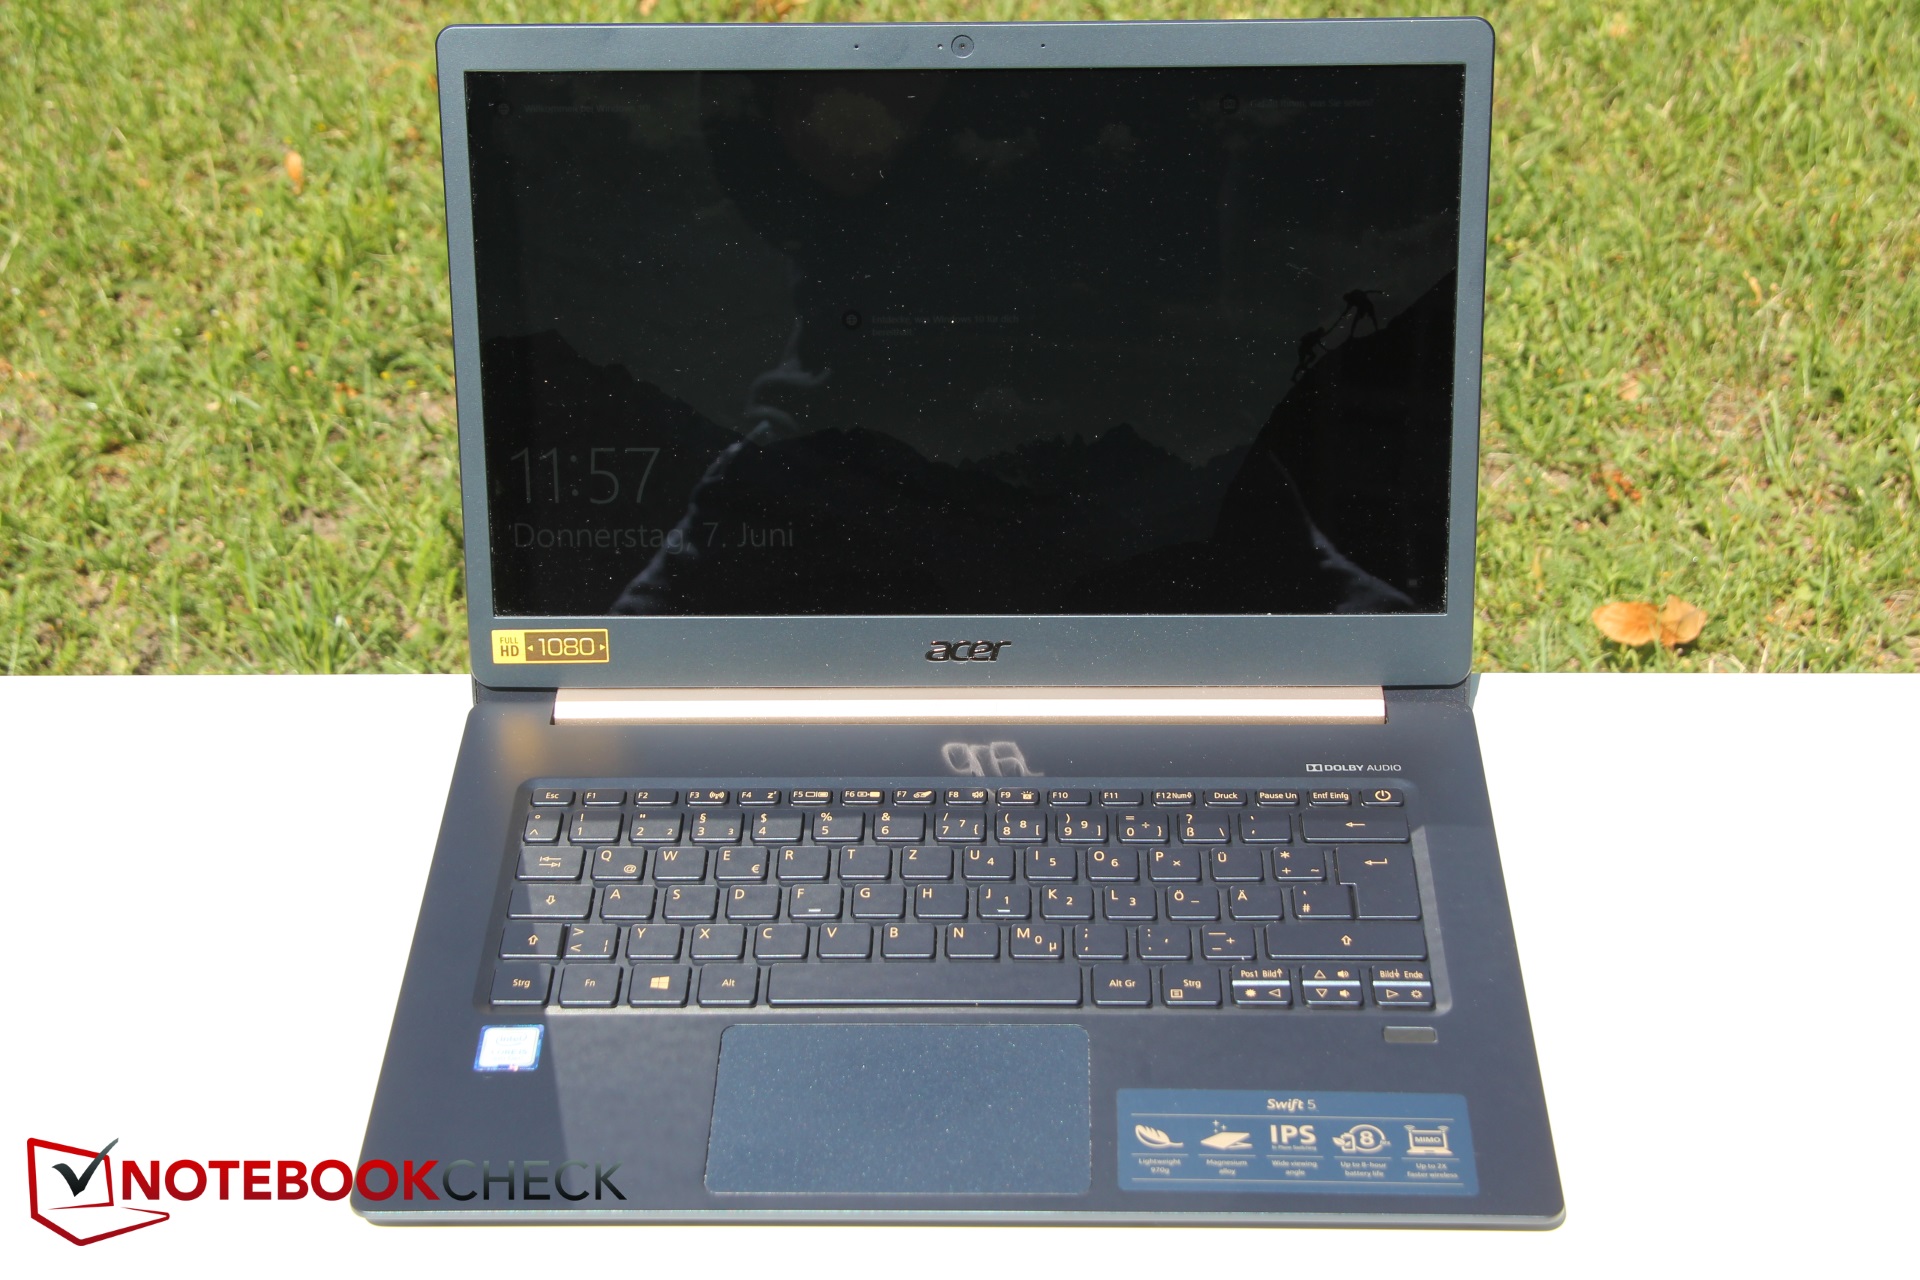
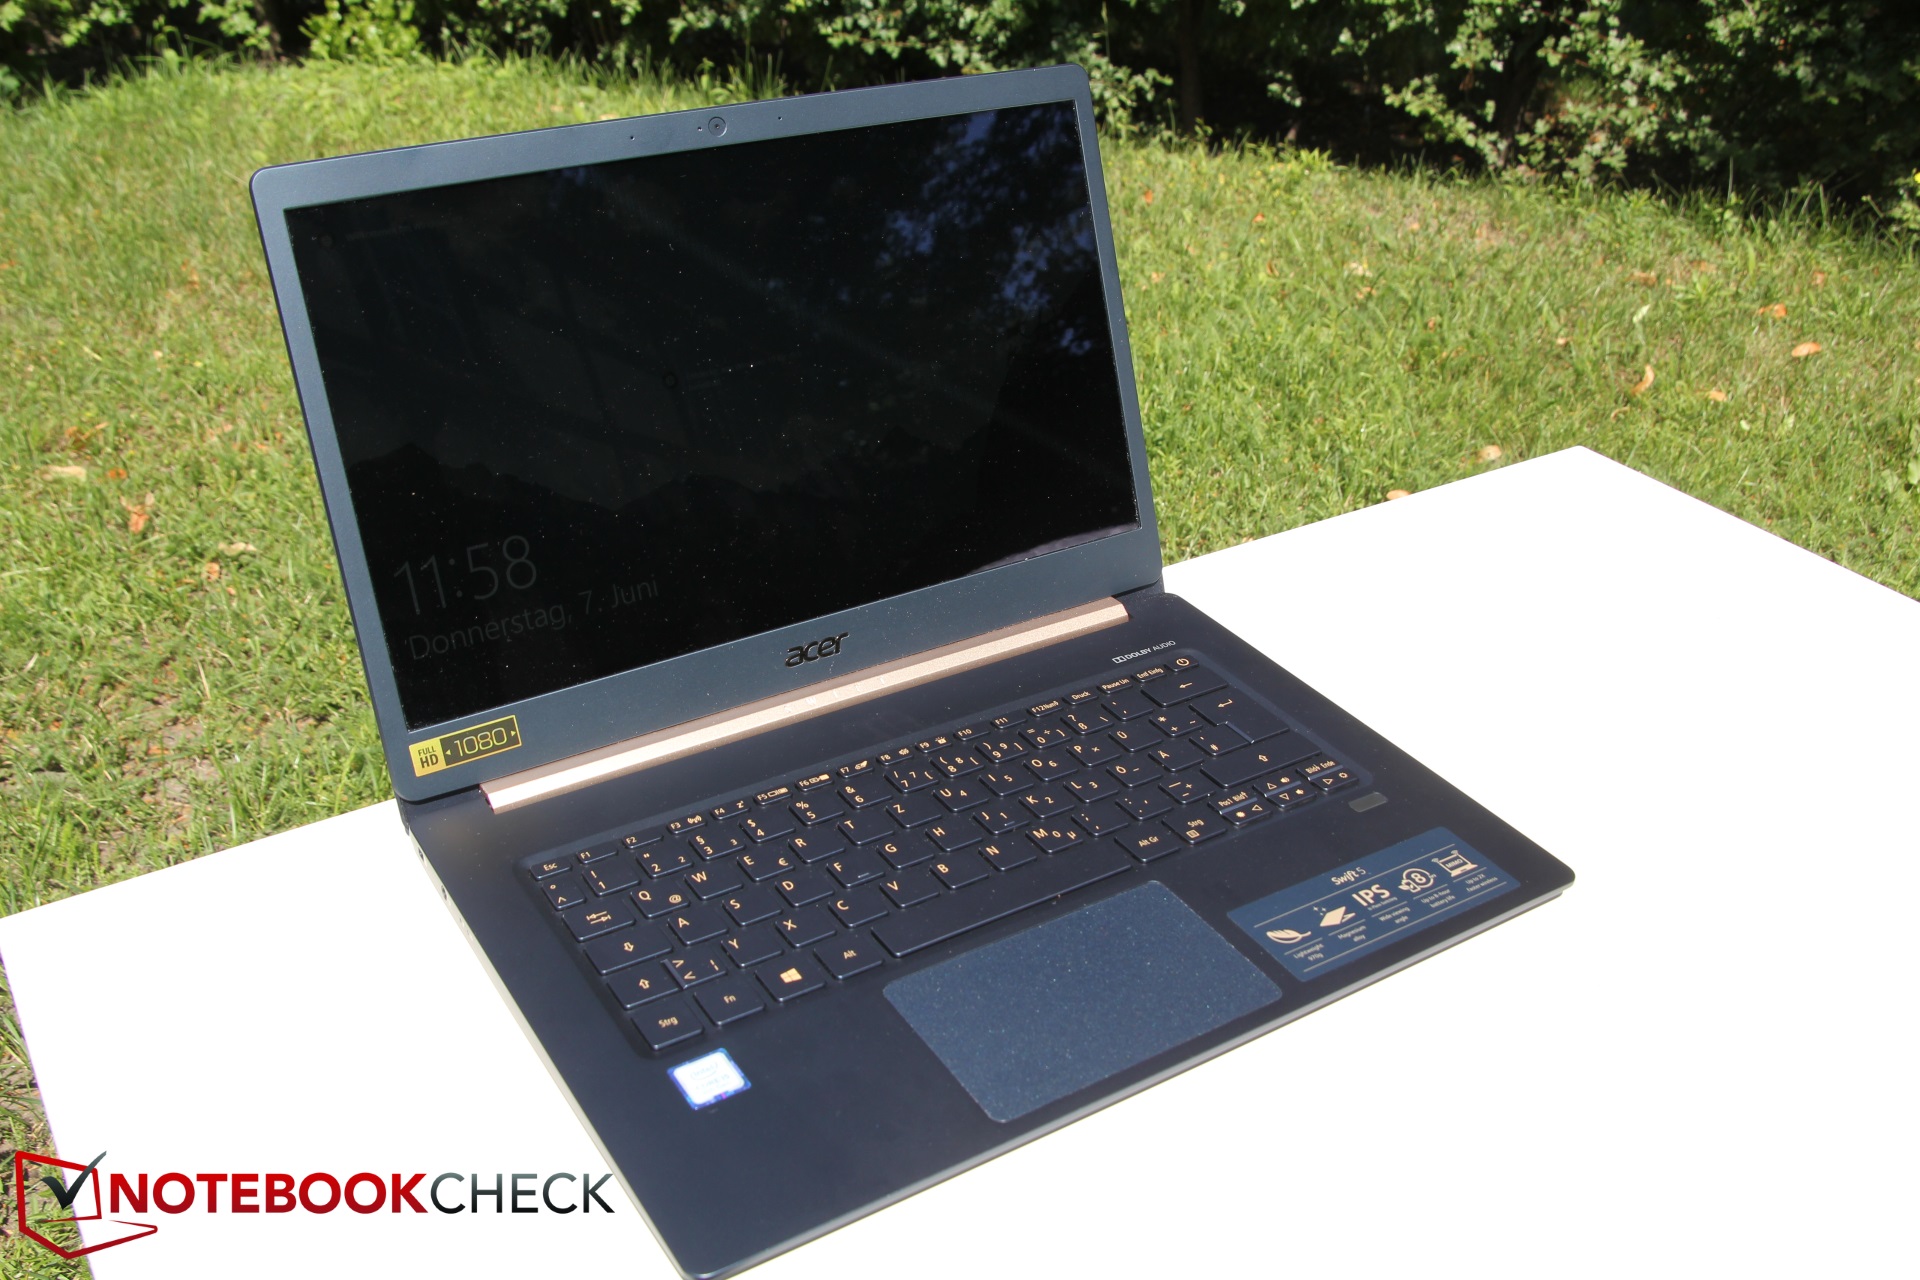
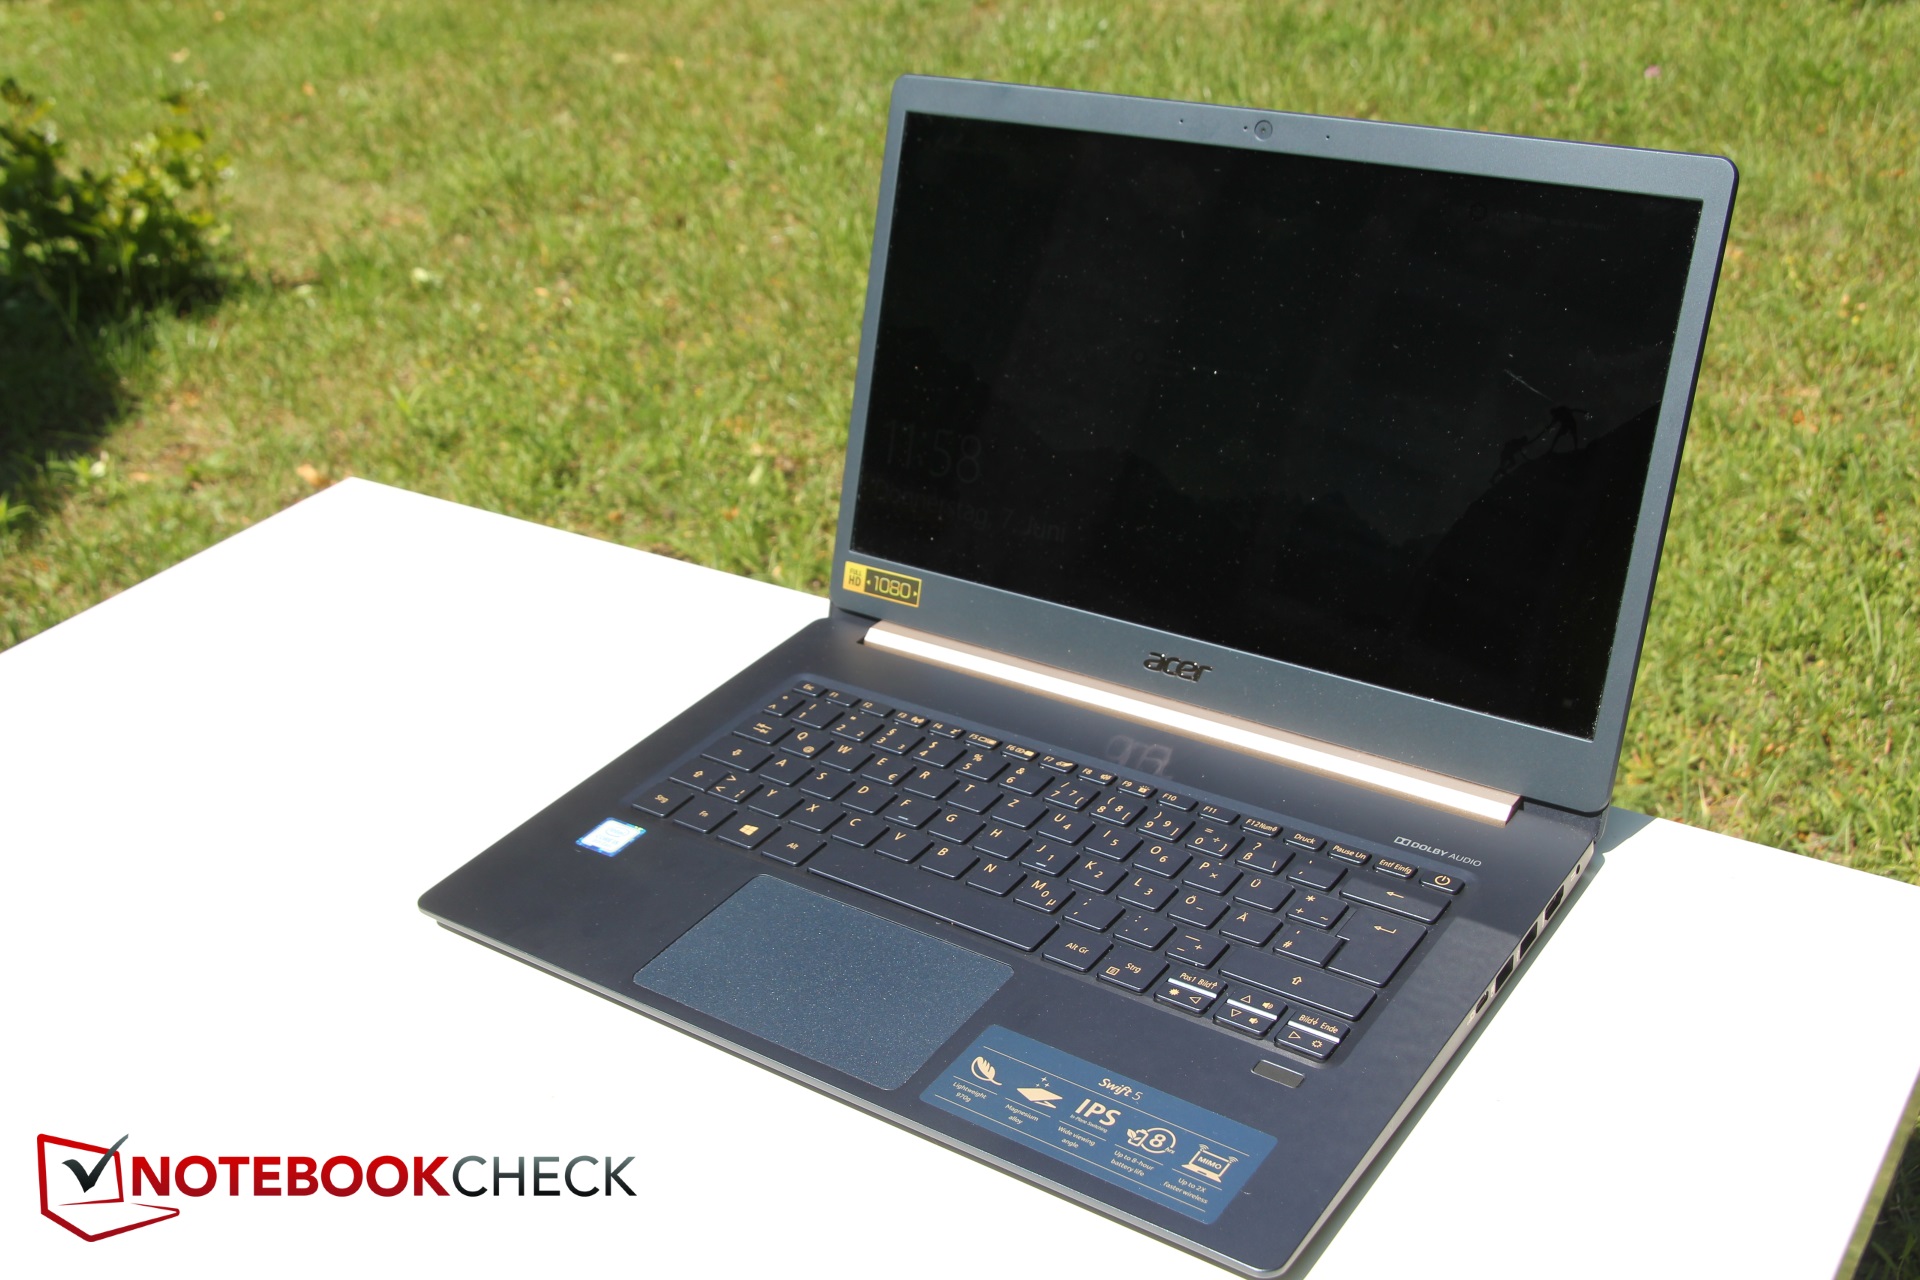
Avaliar e classificar o Acer Swift 5 tem sido um verdadeiro desafio, para dizer o mínimo. Seu peso muito baixo de menos de 1 kg é certamente uma grande vantagem. No entanto, devido à portabilidade da tela escura e altamente reflexiva, sofreu consideravelmente.
Os aspectos positivos incluem a tela mais do que aceitável (exceto pelo brilho mencionado anteriormente), a tela táctil, o SSD rápido e seu baixo consumo de energia.
O outro lado da moeda acabou por ser bastante perturbador, no entanto. Mais notavelmente, o afogamento maciço do dispositivo exibiu um desempenho reduzido consideravelmente (mas também ofereceu uma explicação para o baixo consumo de energia). O Swift 5 lidou muito bem com curtos períodos de alto desempenho, mas praticamente se rendeu à carga pesada de longa duração - um compromisso exigido pelo design altamente portátil e leve. Inclusive o próprio predecessor da Swift 5 resultou ser mais veloz. Outro sacrifício em nome do baixo peso foi a capacidade da bateria e, consequentemente, a duração da bateria. E por último, mas não menos importante, a qualidade de construção estava longe de ser perfeita.
O Acer Swift 5 faz grandes compromissos em nome do baixo peso. Ele é voltado para um grupo muito especial de usuários que preferem um subportátil especialmente leve a um portátil de alto desempenho.
Apesar de seu público-alvo muito específico, consideramos que os problemas extremos de afogamento precisam ser melhorados urgentemente. Nossa lista de desejos para um possível sucessor também inclui uma tela mais clara de qualidade comparável.
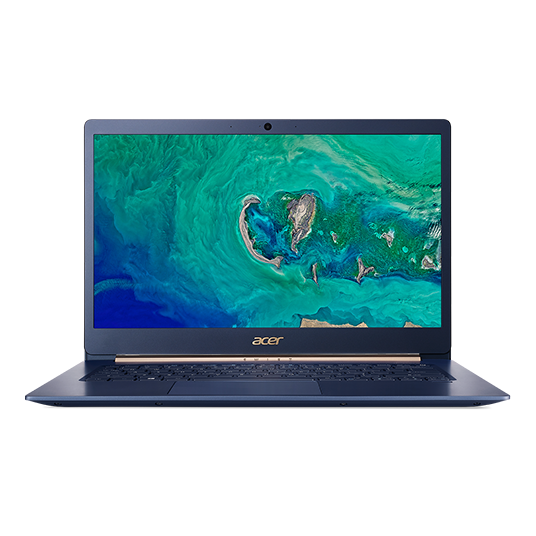
Acer Swift 5 SF514-52T-59HY
- 06/18/2018 v6 (old)
Christian Hintze
Price comparison
