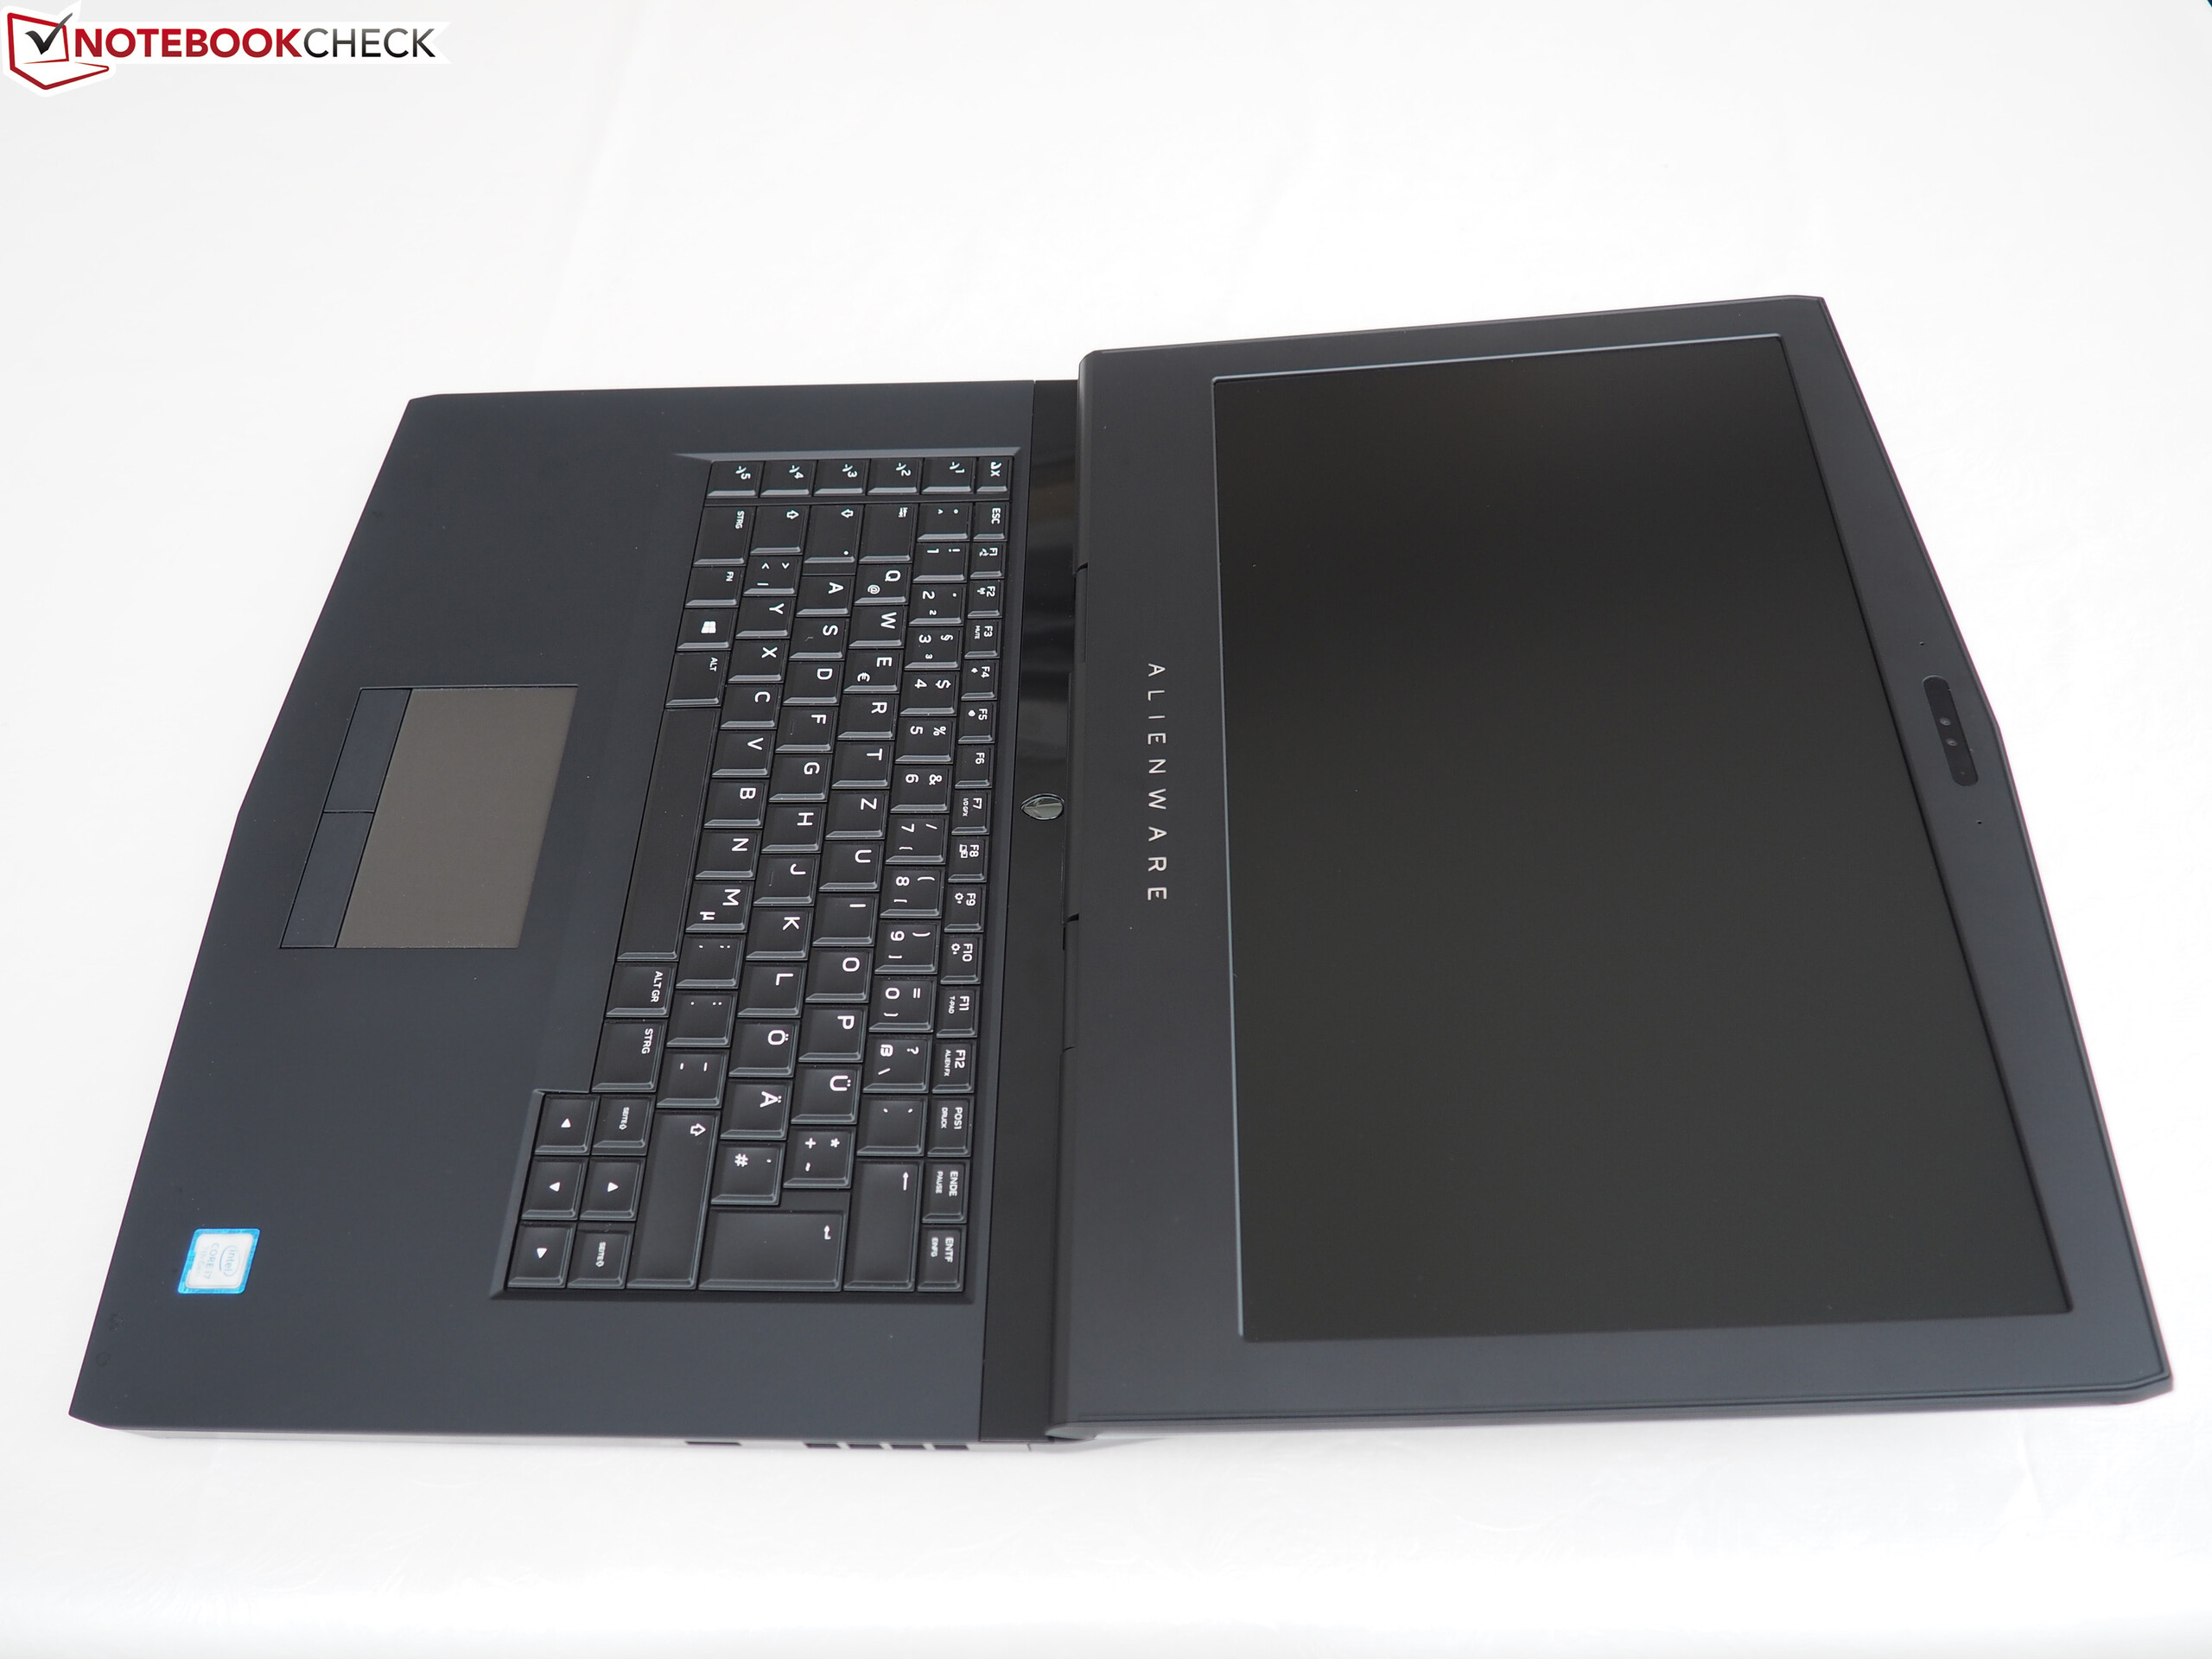
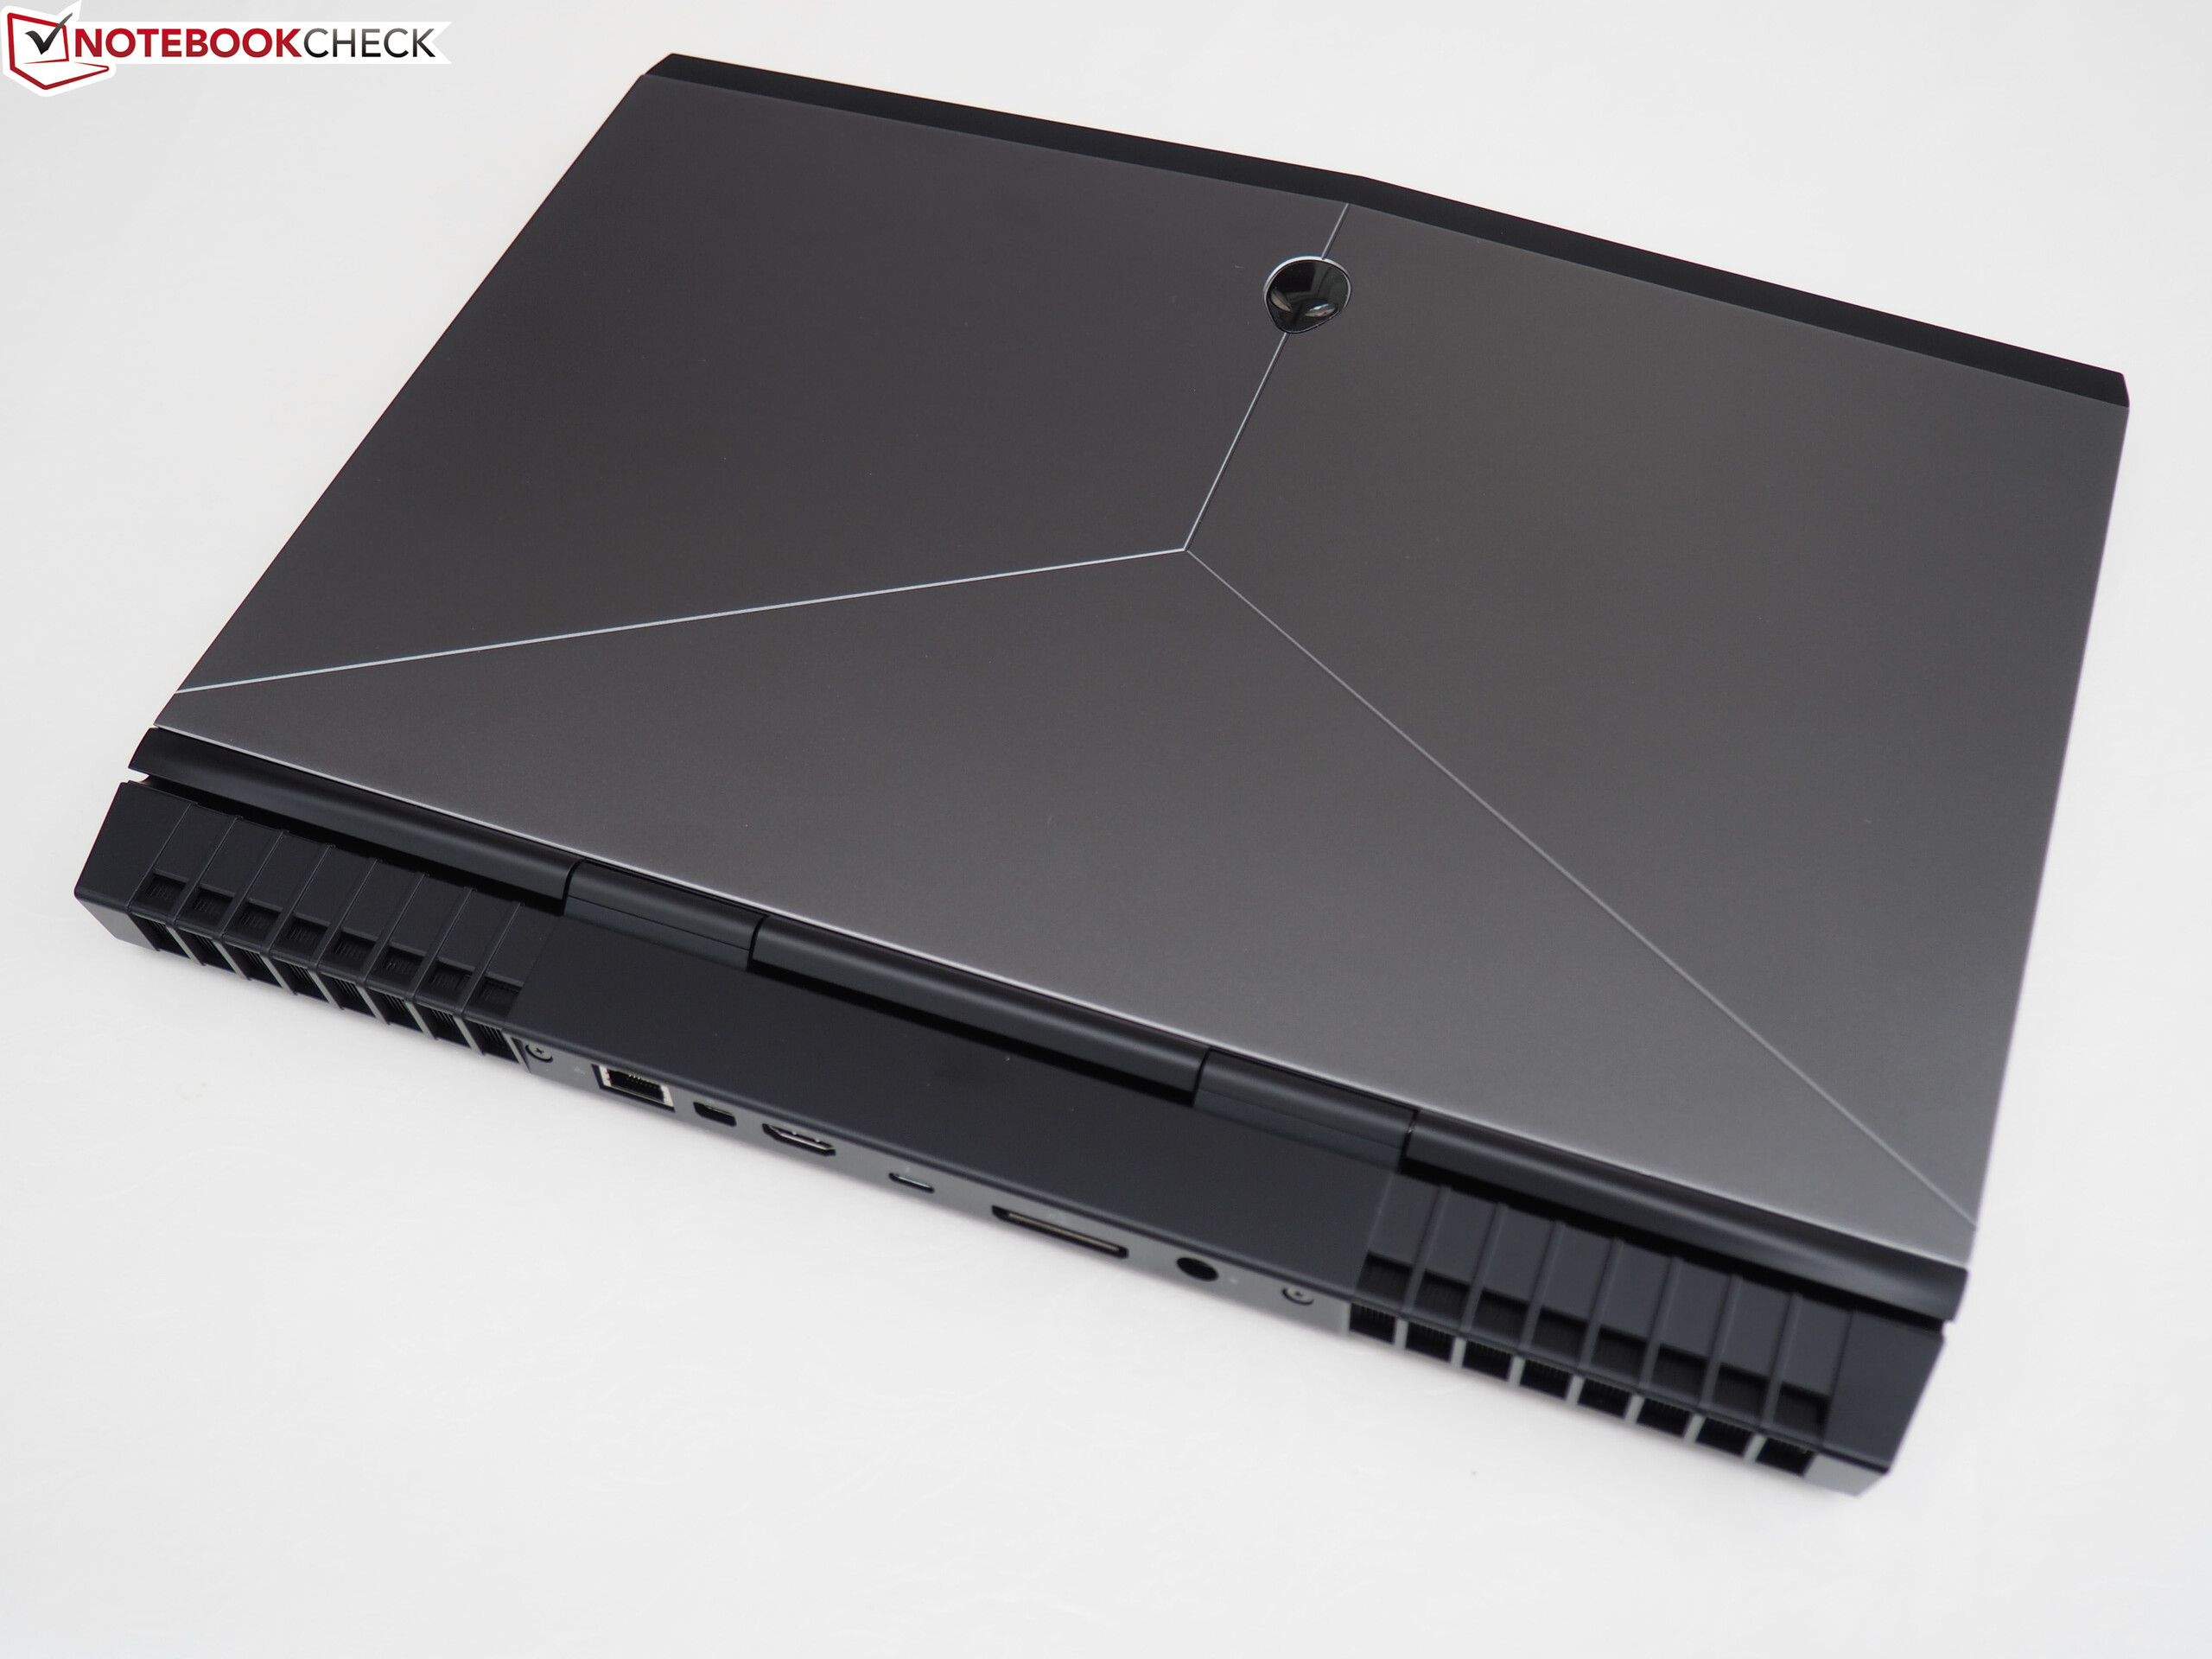
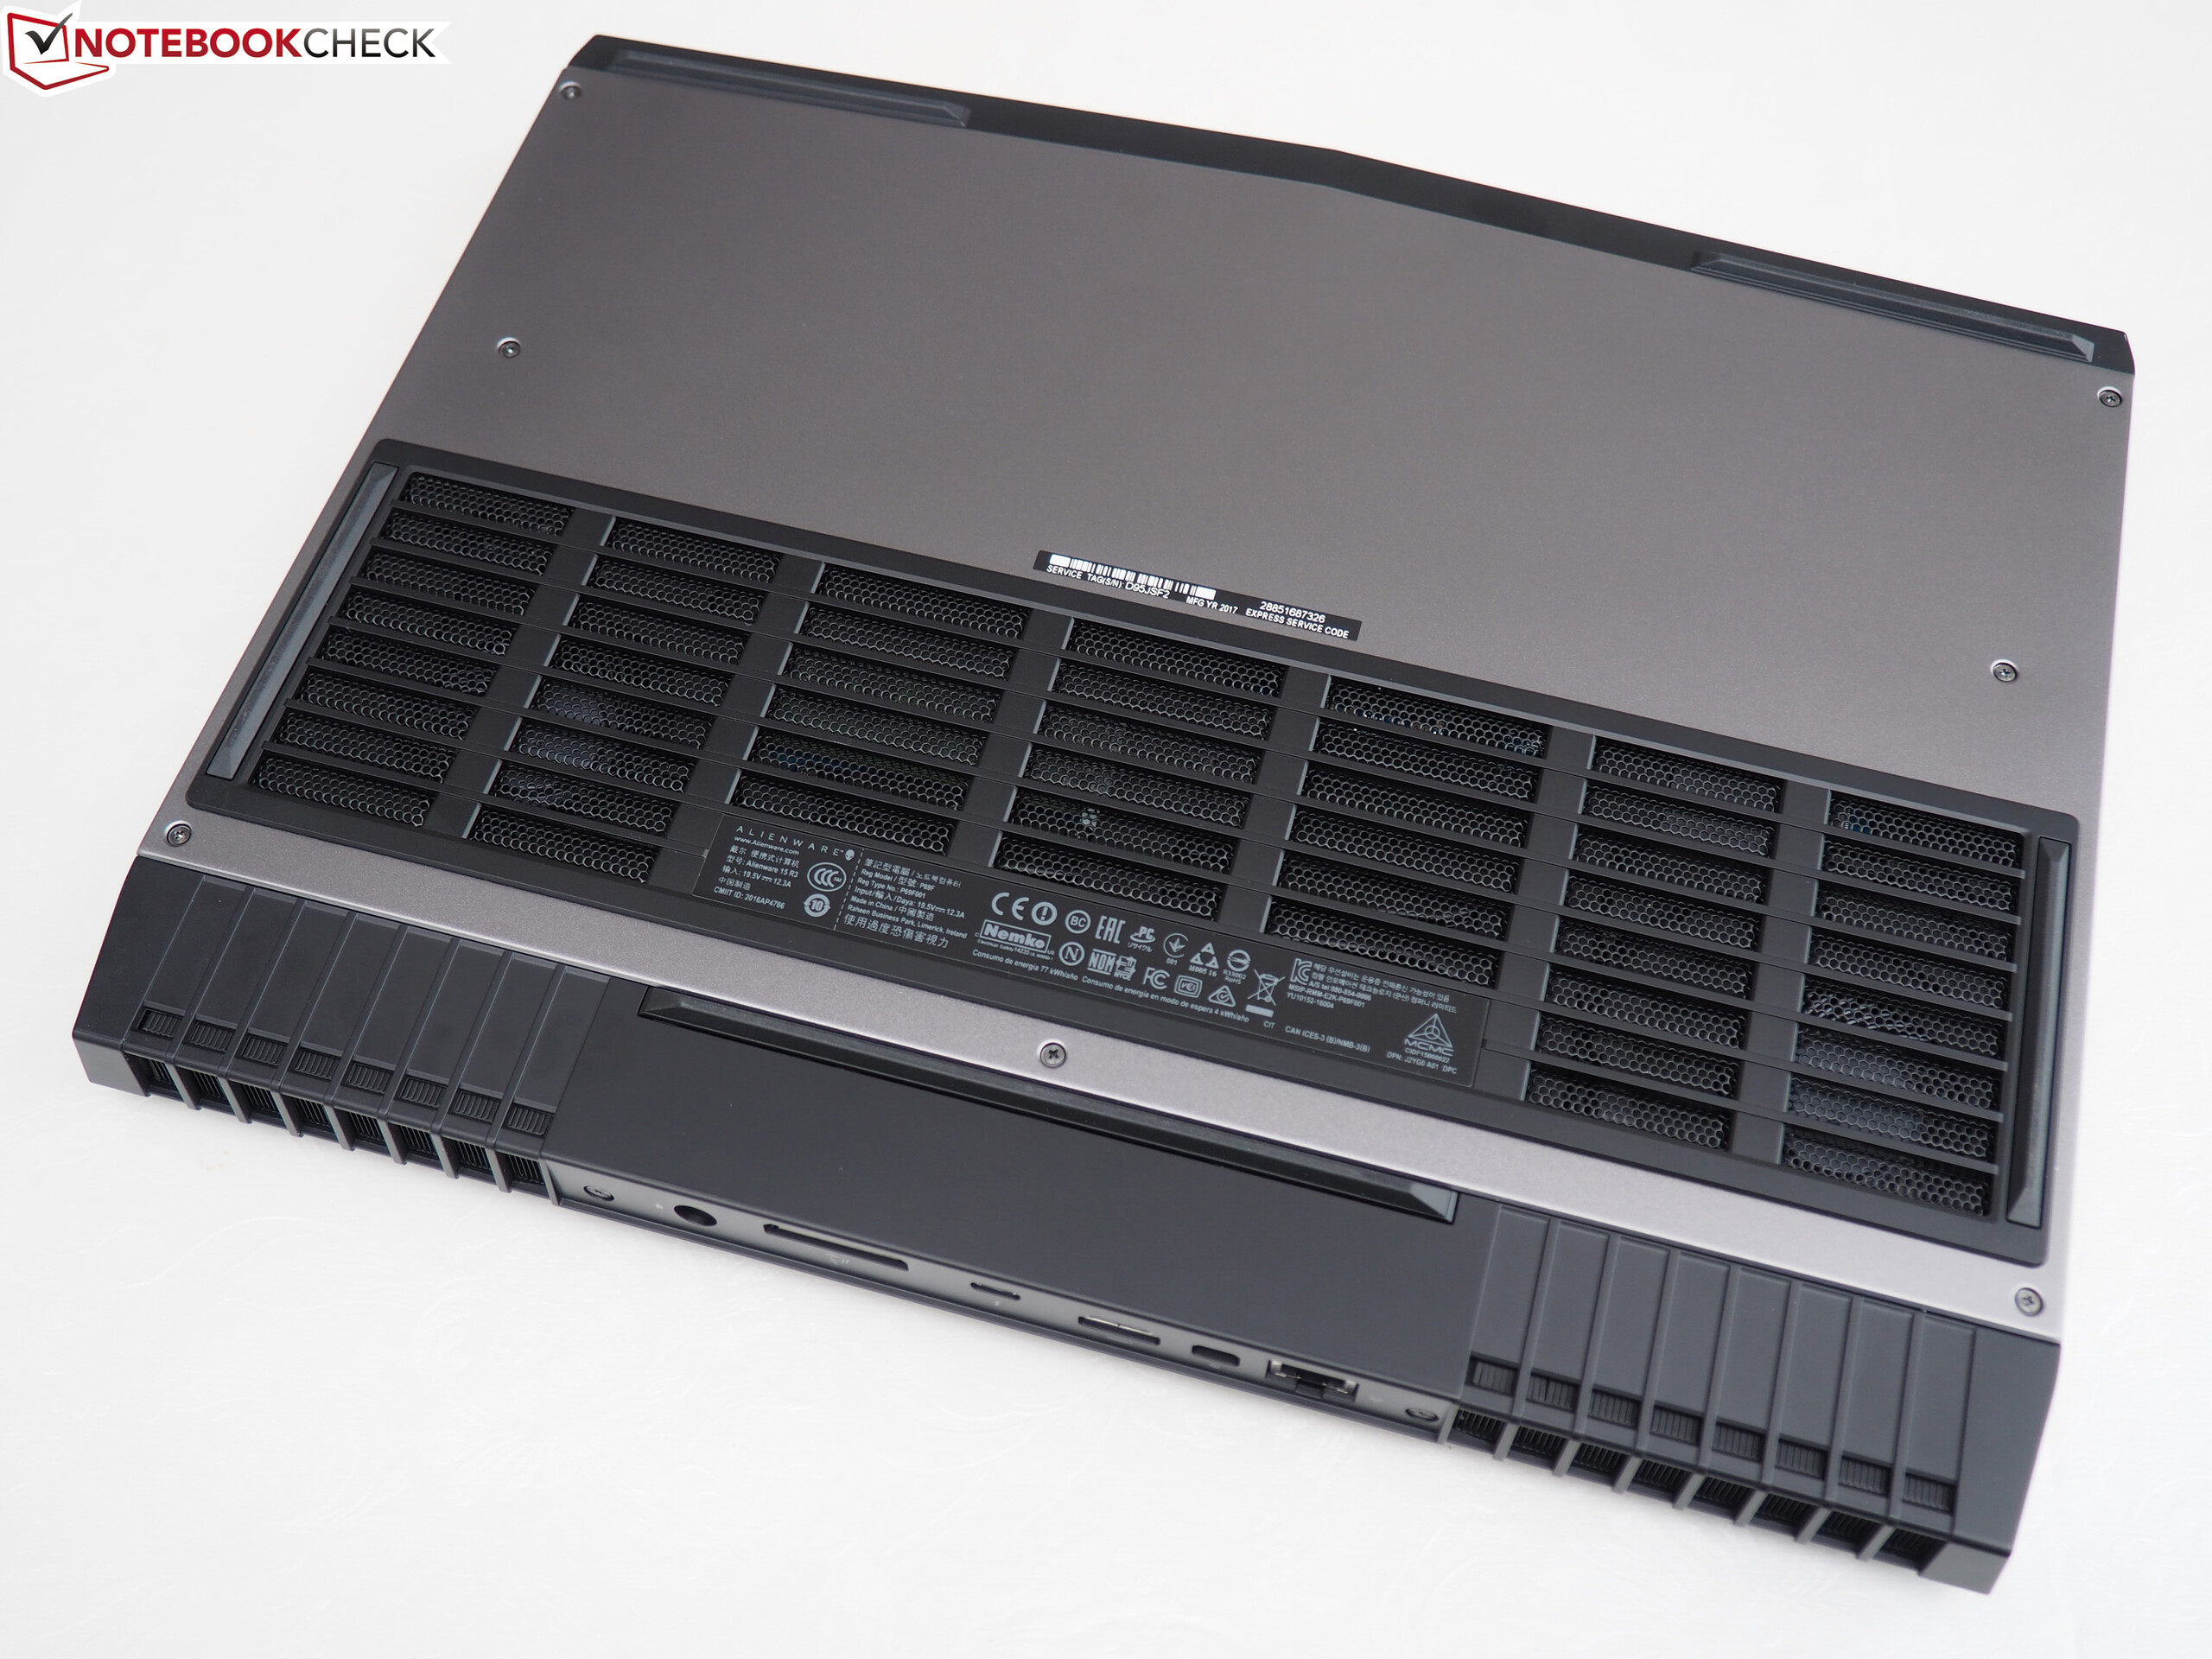
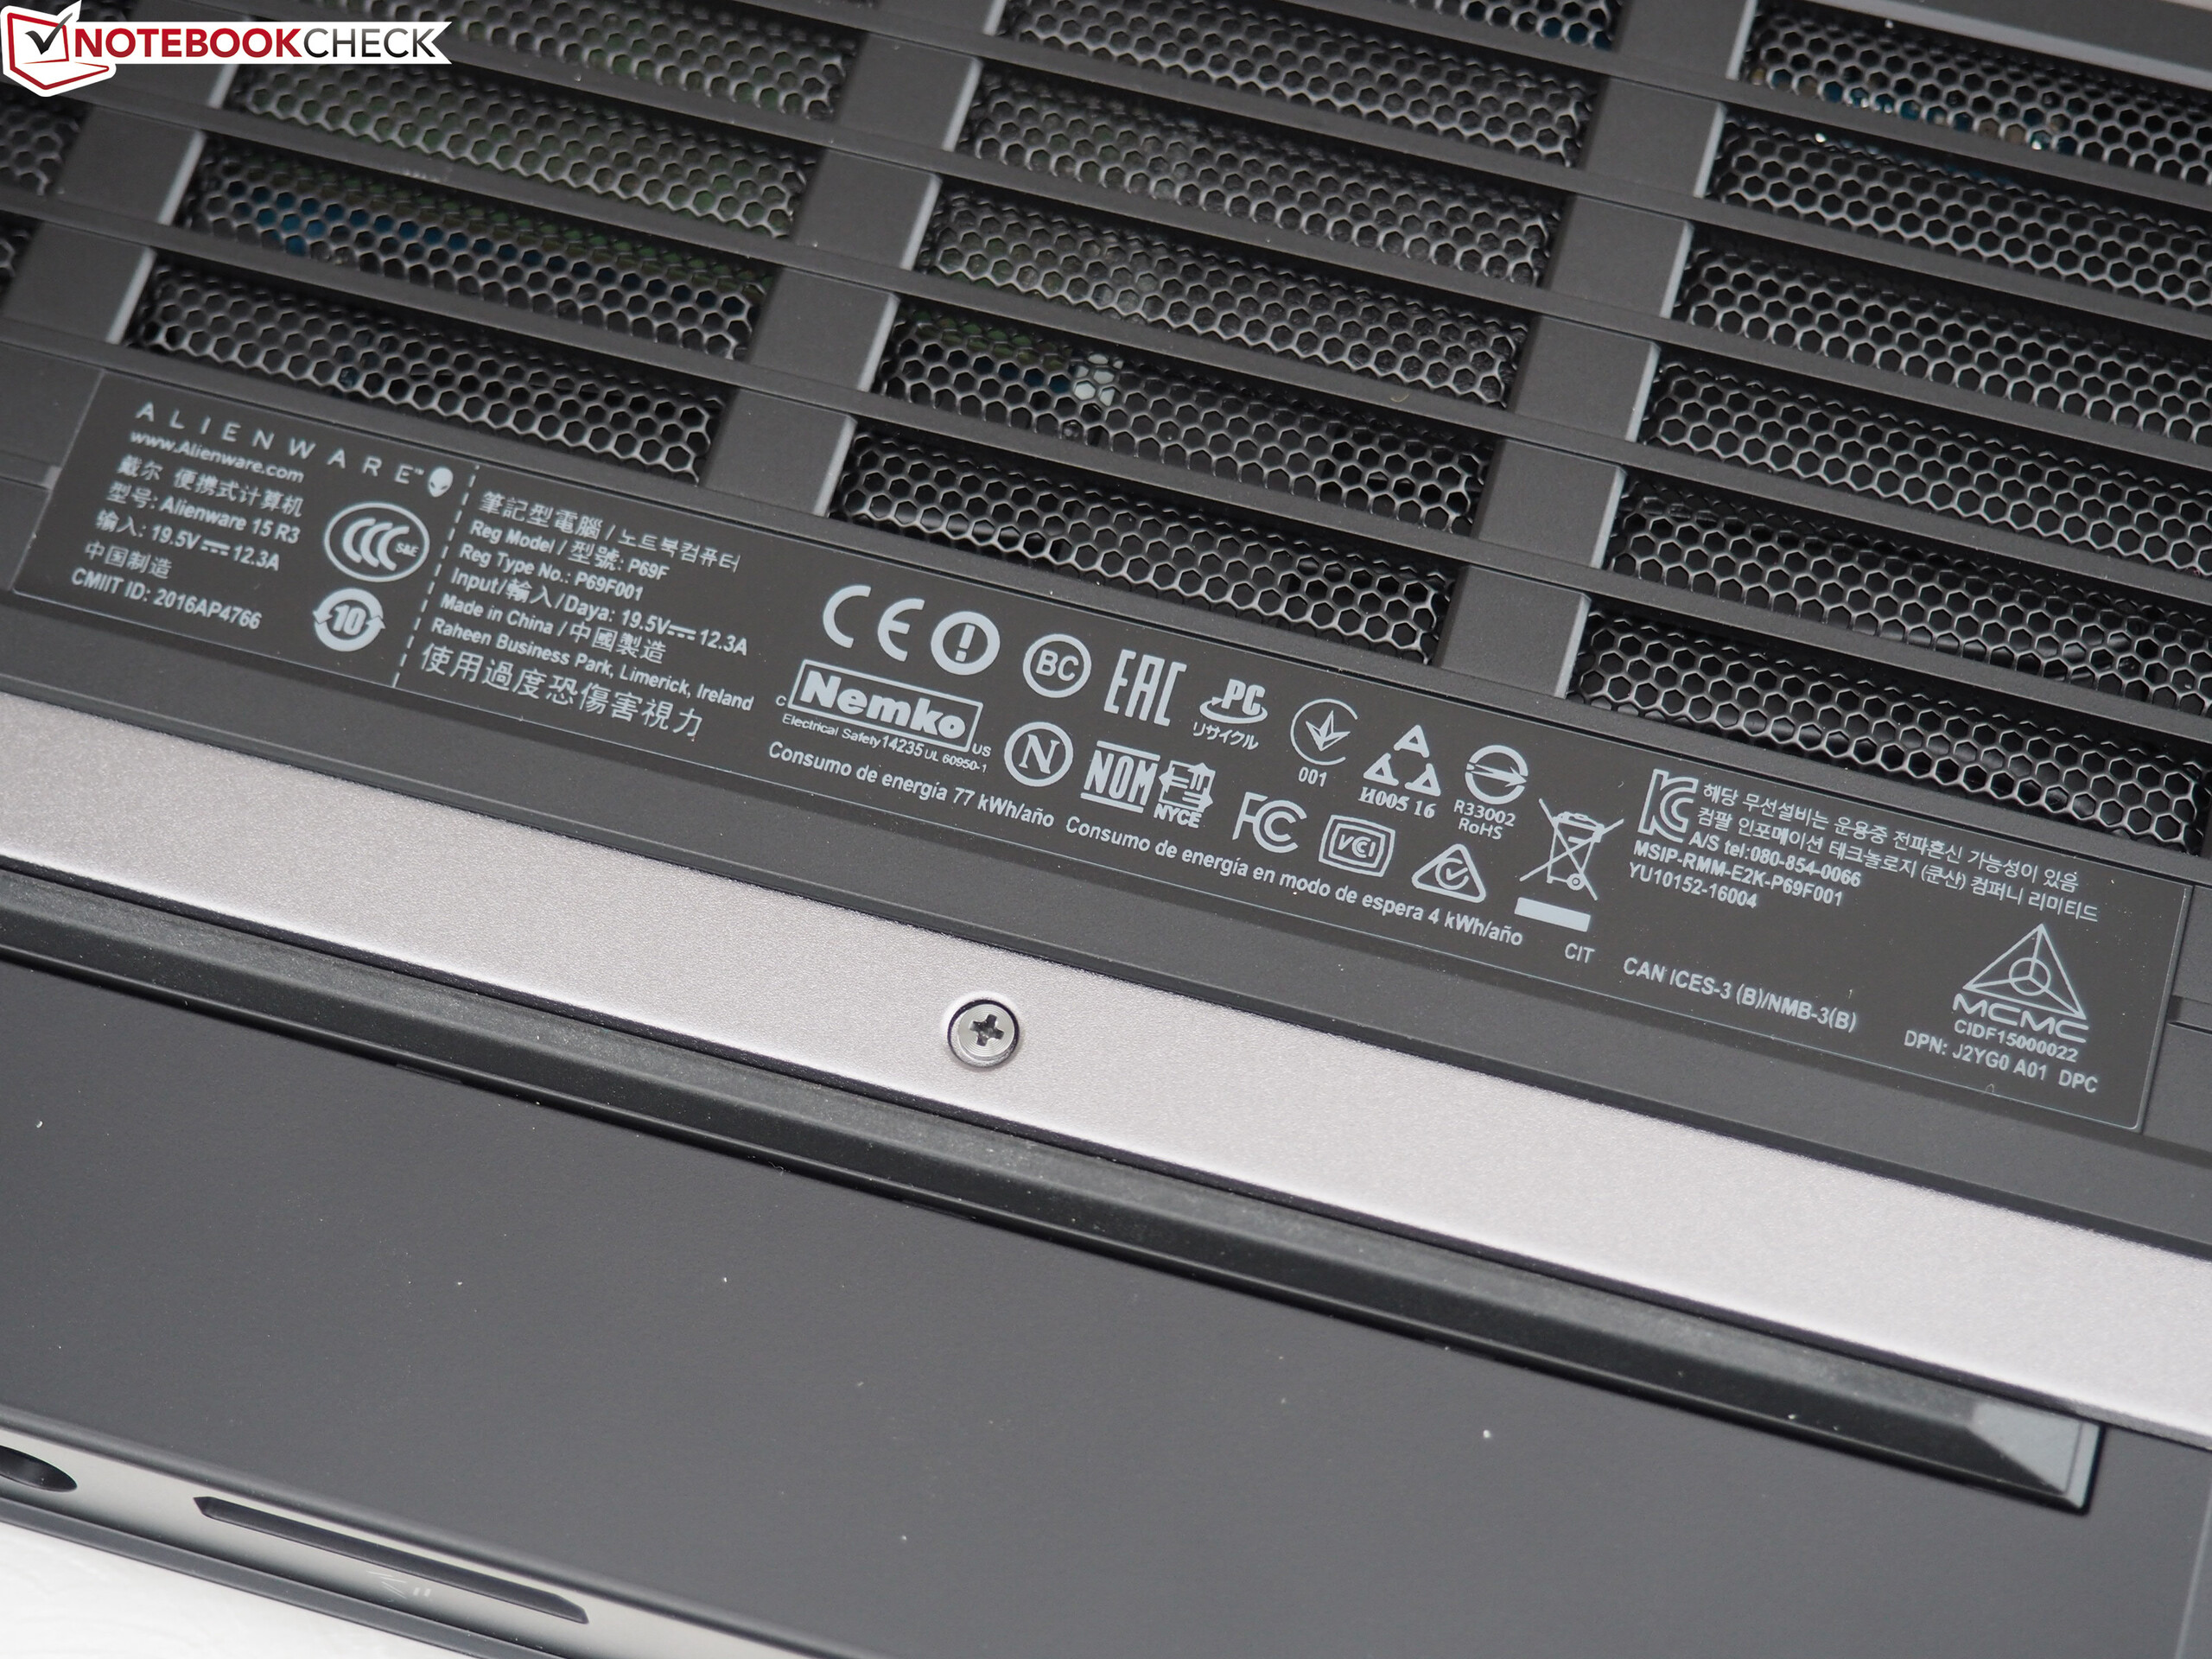
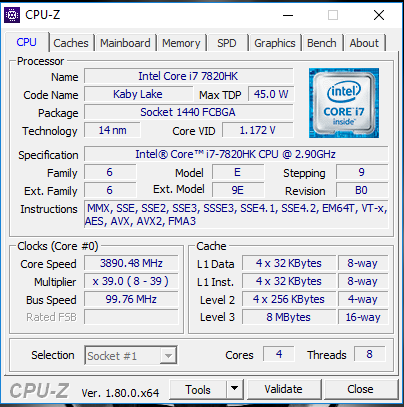
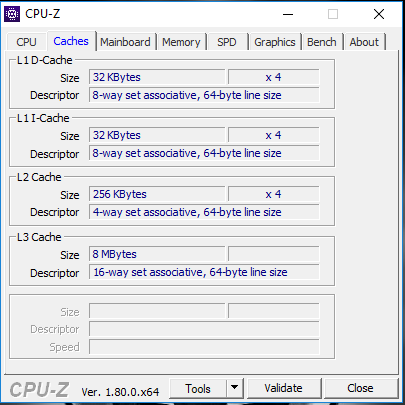
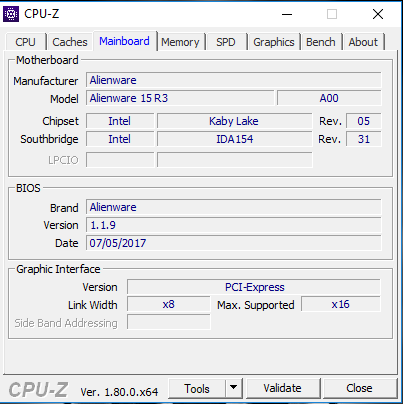
Breve Análise do Portátil Alienware 15 R3 (i7-7820HK, GTX 1080 Max-Q, Full-HD)

| Networking | |
| iperf3 transmit AX12 | |
| Alienware 15 R3 Max-Q | |
| Alienware 15 R3 | |
| Acer Predator Triton 700 | |
| Aorus X5 v7 | |
| Eurocom Q5 | |
| iperf3 receive AX12 | |
| Alienware 15 R3 Max-Q | |
| Acer Predator Triton 700 | |
| Alienware 15 R3 | |
| Eurocom Q5 | |
| Aorus X5 v7 | |
| |||||||||||||||||||||||||
iluminação: 89 %
iluminação com acumulador: 306 cd/m²
Contraste: 1093:1 (Preto: 0.28 cd/m²)
ΔE ColorChecker Calman: 5.45 | ∀{0.5-29.43 Ø4.71}
ΔE Greyscale Calman: 4.9 | ∀{0.09-98 Ø4.96}
83% sRGB (Argyll 1.6.3 3D)
54% AdobeRGB 1998 (Argyll 1.6.3 3D)
60.6% AdobeRGB 1998 (Argyll 3D)
82.9% sRGB (Argyll 3D)
64.3% Display P3 (Argyll 3D)
Gamma: 2.49
CCT: 7062 K
| Alienware 15 R3 Max-Q LG Philips LP156WF6 (LGD049B), 1920x1080, 15.6" | Alienware 15 R3 HPJGK_B156HTN (AUO51ED), 1920x1080, 15.6" | Acer Predator Triton 700 AUO B156HAN04.2 (AUO42ED), 1920x1080, 15.6" | Aorus X5 v7 AU Optronics B156ZAN02.3 (AUO23EB), 3840x2160, 15.6" | Eurocom Q5 ID: LGD04D4, Name: LG Philips LP156UD1-SPB1, 3840x2160, 15.6" | |
|---|---|---|---|---|---|
| Display | 7% | 3% | 7% | 5% | |
| Display P3 Coverage (%) | 64.3 | 66 3% | 62.5 -3% | 65.3 2% | 63 -2% |
| sRGB Coverage (%) | 82.9 | 90.5 9% | 88.7 7% | 91.9 11% | 92.7 12% |
| AdobeRGB 1998 Coverage (%) | 60.6 | 66.2 9% | 63.5 5% | 66.3 9% | 64.4 6% |
| Response Times | 47% | -9% | -2% | 8% | |
| Response Time Grey 50% / Grey 80% * (ms) | 40 ? | 25 ? 37% | 44.8 ? -12% | 44 ? -10% | 32.4 ? 19% |
| Response Time Black / White * (ms) | 28 ? | 12 ? 57% | 29.6 ? -6% | 26.4 ? 6% | 28.8 ? -3% |
| PWM Frequency (Hz) | 21100 ? | ||||
| Screen | -26% | -1% | 4% | -16% | |
| Brightness middle (cd/m²) | 306 | 386 26% | 291 -5% | 307 0% | 287.5 -6% |
| Brightness (cd/m²) | 297 | 382 29% | 277 -7% | 297 0% | 279 -6% |
| Brightness Distribution (%) | 89 | 93 4% | 84 -6% | 92 3% | 87 -2% |
| Black Level * (cd/m²) | 0.28 | 0.39 -39% | 0.22 21% | 0.3 -7% | 0.65 -132% |
| Contrast (:1) | 1093 | 990 -9% | 1323 21% | 1023 -6% | 442 -60% |
| Colorchecker dE 2000 * | 5.45 | 10.2 -87% | 5.52 -1% | 4.72 13% | 4.5 17% |
| Colorchecker dE 2000 max. * | 9.45 | 15.81 -67% | 10.72 -13% | 8.07 15% | 8.9 6% |
| Greyscale dE 2000 * | 4.9 | 11.28 -130% | 6.59 -34% | 4.79 2% | 4.6 6% |
| Gamma | 2.49 88% | 2.23 99% | 2.44 90% | 2.42 91% | 2.39 92% |
| CCT | 7062 92% | 11383 57% | 7816 83% | 7690 85% | 7393 88% |
| Color Space (Percent of AdobeRGB 1998) (%) | 54 | 59 9% | 58 7% | 60 11% | 59 9% |
| Color Space (Percent of sRGB) (%) | 83 | 90 8% | 89 7% | 92 11% | 92.3 11% |
| Média Total (Programa/Configurações) | 9% /
-9% | -2% /
-1% | 3% /
4% | -1% /
-8% |
* ... menor é melhor
Cintilação da tela / PWM (modulação por largura de pulso)
| Tela tremeluzindo/PWM detectado | 21100 Hz | ≤ 95 % configuração de brilho | 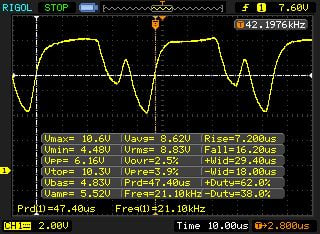 |
A luz de fundo da tela pisca em 21100 Hz (pior caso, por exemplo, utilizando PWM) Cintilação detectada em uma configuração de brilho de 95 % e abaixo. Não deve haver cintilação ou PWM acima desta configuração de brilho. A frequência de 21100 Hz é bastante alta, então a maioria dos usuários sensíveis ao PWM não deve notar nenhuma oscilação. [pwm_comparison] Em comparação: 52 % de todos os dispositivos testados não usam PWM para escurecer a tela. Se PWM foi detectado, uma média de 7757 (mínimo: 5 - máximo: 343500) Hz foi medida. | |||
Exibir tempos de resposta
| ↔ Tempo de resposta preto para branco | ||
|---|---|---|
| 28 ms ... ascensão ↗ e queda ↘ combinadas | ↗ 16 ms ascensão | 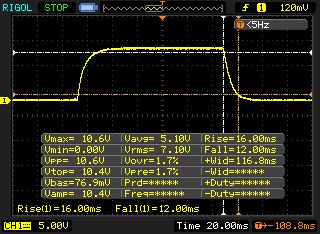 |
| ↘ 12 ms queda | ||
| A tela mostra taxas de resposta relativamente lentas em nossos testes e pode ser muito lenta para os jogadores. Em comparação, todos os dispositivos testados variam de 0.1 (mínimo) a 240 (máximo) ms. » 71 % de todos os dispositivos são melhores. Isso significa que o tempo de resposta medido é pior que a média de todos os dispositivos testados (19.8 ms). | ||
| ↔ Tempo de resposta 50% cinza a 80% cinza | ||
| 40 ms ... ascensão ↗ e queda ↘ combinadas | ↗ 19.6 ms ascensão | 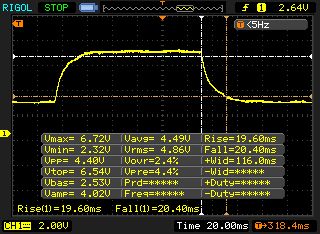 |
| ↘ 20.4 ms queda | ||
| A tela mostra taxas de resposta lentas em nossos testes e será insatisfatória para os jogadores. Em comparação, todos os dispositivos testados variam de 0.165 (mínimo) a 636 (máximo) ms. » 61 % de todos os dispositivos são melhores. Isso significa que o tempo de resposta medido é pior que a média de todos os dispositivos testados (31 ms). | ||

| Cinebench R15 | |
| CPU Single 64Bit | |
| Aorus X5 v7 | |
| Alienware 15 R3 Max-Q | |
| Alienware 15 R3 | |
| Acer Predator Triton 700 | |
| Eurocom Q5 | |
| CPU Multi 64Bit | |
| Aorus X5 v7 | |
| Alienware 15 R3 Max-Q | |
| Eurocom Q5 | |
| Alienware 15 R3 | |
| Acer Predator Triton 700 | |
| Cinebench R10 | |
| Rendering Single 32Bit | |
| Alienware 15 R3 Max-Q | |
| Eurocom Q5 | |
| Rendering Multiple CPUs 32Bit | |
| Alienware 15 R3 Max-Q | |
| Eurocom Q5 | |
| Geekbench 3 | |
| 32 Bit Multi-Core Score | |
| Alienware 15 R3 Max-Q | |
| 32 Bit Single-Core Score | |
| Alienware 15 R3 Max-Q | |
| Geekbench 4.0 | |
| 64 Bit Multi-Core Score | |
| Alienware 15 R3 Max-Q | |
| 64 Bit Single-Core Score | |
| Alienware 15 R3 Max-Q | |
| Geekbench 4.4 | |
| 64 Bit Multi-Core Score | |
| Alienware 15 R3 Max-Q | |
| 64 Bit Single-Core Score | |
| Alienware 15 R3 Max-Q | |
| JetStream 1.1 - 1.1 Total | |
| Alienware 15 R3 Max-Q | |
| Eurocom Q5 | |
| PCMark 7 Score | 6972 pontos | |
| PCMark 8 Home Score Accelerated v2 | 5121 pontos | |
| PCMark 8 Creative Score Accelerated v2 | 7892 pontos | |
| PCMark 8 Work Score Accelerated v2 | 5305 pontos | |
| PCMark 10 Score | 5295 pontos | |
Ajuda | ||
| PCMark 8 | |
| Home Score Accelerated v2 | |
| Acer Predator Triton 700 | |
| Alienware 15 R3 Max-Q | |
| Alienware 15 R3 | |
| Aorus X5 v7 | |
| Eurocom Q5 | |
| Work Score Accelerated v2 | |
| Alienware 15 R3 Max-Q | |
| Alienware 15 R3 | |
| Acer Predator Triton 700 | |
| Eurocom Q5 | |

| Alienware 15 R3 Max-Q LiteOn CX2-8B256 | Aorus X5 v7 Toshiba NVMe THNSN5256GPU7 | Alienware 15 R3 | |
|---|---|---|---|
| CrystalDiskMark 3.0 | 19% | -20% | |
| Read Seq (MB/s) | 1840 | 1479 -20% | 1123 -39% |
| Write Seq (MB/s) | 802 | 1076 34% | 429.2 -46% |
| Read 512 (MB/s) | 944 | 1086 15% | 833 -12% |
| Write 512 (MB/s) | 671 | 1101 64% | 428.1 -36% |
| Read 4k (MB/s) | 43.03 | 44 2% | 37.8 -12% |
| Write 4k (MB/s) | 141 | 137.8 -2% | 122.9 -13% |
| Read 4k QD32 (MB/s) | 595 | 697 17% | 542 -9% |
| Write 4k QD32 (MB/s) | 403.6 | 556 38% | 429.8 6% |
| 3DMark 06 Standard Score | 31555 pontos | |
| 3DMark 11 Performance | 17829 pontos | |
| 3DMark Ice Storm Standard Score | 134673 pontos | |
| 3DMark Cloud Gate Standard Score | 28375 pontos | |
| 3DMark Fire Strike Score | 14631 pontos | |
| 3DMark Fire Strike Extreme Score | 7998 pontos | |
| 3DMark Time Spy Score | 5793 pontos | |
Ajuda | ||
| 3DMark 11 - 1280x720 Performance GPU | |
| Guru Mars K | |
| MSI GT75VR 7RF-012 Titan Pro | |
| Alienware 15 R3 Max-Q | |
| Acer Predator Triton 700 | |
| Alienware 15 R3 | |
| Aorus X5 v7 | |
| Eurocom Q5 | |
| 3DMark - 1920x1080 Fire Strike Graphics | |
| Guru Mars K | |
| MSI GT75VR 7RF-012 Titan Pro | |
| Alienware 15 R3 Max-Q | |
| Acer Predator Triton 700 | |
| Alienware 15 R3 | |
| Aorus X5 v7 | |
| Eurocom Q5 | |
| The Witcher 3 - 1920x1080 Ultra Graphics & Postprocessing (HBAO+) | |
| MSI GT75VR 7RF-012 Titan Pro | |
| Guru Mars K | |
| Razer Blade Pro 2017 | |
| Alienware 15 R3 Max-Q | |
| Acer Predator Triton 700 | |
| Aorus X5 v7 | |
| Eurocom Q5 | |
| Prey - 1920x1080 Very High Preset AA:2TX SM AF:16x | |
| Alienware 15 R3 Max-Q | |
| Guru Mars K | |
| Eurocom Q5 | |
| MSI GT75VR 7RF-012 Titan Pro | |
| Acer Predator Triton 700 | |
| Razer Blade Pro 2017 | |
| BioShock Infinite - 1920x1080 Ultra Preset, DX11 (DDOF) | |
| Alienware 15 R3 Max-Q | |
| Eurocom Q5 | |
| Ghost Recon Wildlands - 1920x1080 Ultra Preset AA:T AF:16x | |
| Guru Mars K | |
| MSI GT75VR 7RF-012 Titan Pro | |
| Razer Blade Pro 2017 | |
| Alienware 15 R3 Max-Q | |
| Acer Predator Triton 700 | |
| baixo | média | alto | ultra | |
|---|---|---|---|---|
| Tomb Raider (2013) | 486.5 | 461.9 | 419.2 | 230.4 |
| BioShock Infinite (2013) | 272.3 | 243.6 | 232 | 151.7 |
| The Witcher 3 (2015) | 278.6 | 201.6 | 122.4 | 64.2 |
| For Honor (2017) | 229.6 | 161.2 | 152.9 | 121.3 |
| Ghost Recon Wildlands (2017) | 131.7 | 101.4 | 94.9 | 54.6 |
| Prey (2017) | 141.7 | 142 | 139.8 | 140.8 |
| Middle-earth: Shadow of War (2017) | 146 | 132 | 111 | 88 |
| The Evil Within 2 (2017) | 90.1 | 66.6 | 64 | 62.6 |
Barulho
| Ocioso |
| 32 / 33 / 35 dB |
| HDD |
| 33 dB |
| Carga |
| 46 / 50 dB |
 | ||
30 dB silencioso 40 dB(A) audível 50 dB(A) ruidosamente alto |
||
min: | ||
| Alienware 15 R3 Max-Q i7-7820HK, GeForce GTX 1080 Max-Q | Acer Predator Triton 700 i7-7700HQ, GeForce GTX 1080 Max-Q | Aorus X5 v7 i7-7820HK, GeForce GTX 1070 Mobile | Eurocom Q5 i7-7700HQ, GeForce GTX 1070 Max-Q | Alienware 15 R3 i7-7700HQ, GeForce GTX 1070 Mobile | Guru Mars K i7-7700, GeForce GTX 1080 Mobile | MSI GT75VR 7RF-012 Titan Pro i7-7820HK, GeForce GTX 1080 Mobile | |
|---|---|---|---|---|---|---|---|
| Noise | -0% | -6% | 2% | -4% | -7% | -8% | |
| desligado / ambiente * (dB) | 29 | 31 -7% | 30 -3% | 29 -0% | 30 -3% | 29 -0% | 30 -3% |
| Idle Minimum * (dB) | 32 | 33 -3% | 35 -9% | 31.5 2% | 31 3% | 36 -13% | 33 -3% |
| Idle Average * (dB) | 33 | 34 -3% | 36 -9% | 33.8 -2% | 32 3% | 37 -12% | 34 -3% |
| Idle Maximum * (dB) | 35 | 40 -14% | 40 -14% | 33.8 3% | 42 -20% | 40 -14% | 38 -9% |
| Load Average * (dB) | 46 | 41 11% | 43 7% | 41.7 9% | 49 -7% | 45 2% | 44 4% |
| Witcher 3 ultra * (dB) | 48 | 43 10% | 49 -2% | 41.7 13% | 50 -4% | 56 -17% | |
| Load Maximum * (dB) | 50 | 48 4% | 55 -10% | 54.2 -8% | 50 -0% | 55 -10% | 62 -24% |
* ... menor é melhor
(-) A temperatura máxima no lado superior é 47 °C / 117 F, em comparação com a média de 40.4 °C / 105 F , variando de 21.2 a 68.8 °C para a classe Gaming.
(-) A parte inferior aquece até um máximo de 55 °C / 131 F, em comparação com a média de 43.2 °C / 110 F
(+) Em uso inativo, a temperatura média para o lado superior é 31.7 °C / 89 F, em comparação com a média do dispositivo de 33.9 °C / ### class_avg_f### F.
(-) Jogando The Witcher 3, a temperatura média para o lado superior é 38.2 °C / 101 F, em comparação com a média do dispositivo de 33.9 °C / ## #class_avg_f### F.
(+) Os apoios para as mãos e o touchpad são mais frios que a temperatura da pele, com um máximo de 27 °C / 80.6 F e, portanto, são frios ao toque.
(±) A temperatura média da área do apoio para as mãos de dispositivos semelhantes foi 28.8 °C / 83.8 F (+1.8 °C / 3.2 F).
| Alienware 15 R3 Max-Q i7-7820HK, GeForce GTX 1080 Max-Q | Acer Predator Triton 700 i7-7700HQ, GeForce GTX 1080 Max-Q | Aorus X5 v7 i7-7820HK, GeForce GTX 1070 Mobile | Eurocom Q5 i7-7700HQ, GeForce GTX 1070 Max-Q | Alienware 15 R3 i7-7700HQ, GeForce GTX 1070 Mobile | Guru Mars K i7-7700, GeForce GTX 1080 Mobile | MSI GT75VR 7RF-012 Titan Pro i7-7820HK, GeForce GTX 1080 Mobile | |
|---|---|---|---|---|---|---|---|
| Heat | -5% | 1% | 4% | 2% | 12% | 3% | |
| Maximum Upper Side * (°C) | 47 | 61 -30% | 64 -36% | 56.2 -20% | 46 2% | 46 2% | 46 2% |
| Maximum Bottom * (°C) | 55 | 69 -25% | 56 -2% | 61.2 -11% | 51.8 6% | 46 16% | 57 -4% |
| Idle Upper Side * (°C) | 36 | 29 19% | 29 19% | 27.8 23% | 36.5 -1% | 32 11% | 34 6% |
| Idle Bottom * (°C) | 38 | 32 16% | 30 21% | 29.6 22% | 38.2 -1% | 31 18% | 35 8% |
* ... menor é melhor
Alienware 15 R3 Max-Q análise de áudio
(+) | os alto-falantes podem tocar relativamente alto (###valor### dB)
Graves 100 - 315Hz
(-) | quase nenhum baixo - em média 17.1% menor que a mediana
(±) | a linearidade dos graves é média (11% delta para a frequência anterior)
Médios 400 - 2.000 Hz
(±) | médios mais altos - em média 6.6% maior que a mediana
(+) | médios são lineares (4.7% delta para frequência anterior)
Altos 2 - 16 kHz
(+) | agudos equilibrados - apenas 3% longe da mediana
(+) | os máximos são lineares (4.3% delta da frequência anterior)
Geral 100 - 16.000 Hz
(±) | a linearidade do som geral é média (15.2% diferença em relação à mediana)
Comparado com a mesma classe
» 33% de todos os dispositivos testados nesta classe foram melhores, 6% semelhantes, 61% piores
» O melhor teve um delta de 6%, a média foi 18%, o pior foi 132%
Comparado com todos os dispositivos testados
» 22% de todos os dispositivos testados foram melhores, 4% semelhantes, 74% piores
» O melhor teve um delta de 4%, a média foi 23%, o pior foi 134%
Aorus X5 v7 análise de áudio
(±) | o volume do alto-falante é médio, mas bom (###valor### dB)
Graves 100 - 315Hz
(-) | quase nenhum baixo - em média 19% menor que a mediana
(±) | a linearidade dos graves é média (10.6% delta para a frequência anterior)
Médios 400 - 2.000 Hz
(+) | médios equilibrados - apenas 4.2% longe da mediana
(+) | médios são lineares (5.8% delta para frequência anterior)
Altos 2 - 16 kHz
(+) | agudos equilibrados - apenas 2.1% longe da mediana
(+) | os máximos são lineares (5.4% delta da frequência anterior)
Geral 100 - 16.000 Hz
(±) | a linearidade do som geral é média (18.7% diferença em relação à mediana)
Comparado com a mesma classe
» 62% de todos os dispositivos testados nesta classe foram melhores, 8% semelhantes, 30% piores
» O melhor teve um delta de 6%, a média foi 18%, o pior foi 132%
Comparado com todos os dispositivos testados
» 43% de todos os dispositivos testados foram melhores, 8% semelhantes, 49% piores
» O melhor teve um delta de 4%, a média foi 23%, o pior foi 134%
| desligado | |
| Ocioso | |
| Carga |
|
Key:
min: | |
| Alienware 15 R3 Max-Q i7-7820HK, GeForce GTX 1080 Max-Q | Acer Predator Triton 700 i7-7700HQ, GeForce GTX 1080 Max-Q | Aorus X5 v7 i7-7820HK, GeForce GTX 1070 Mobile | Eurocom Q5 i7-7700HQ, GeForce GTX 1070 Max-Q | Alienware 15 R3 i7-7700HQ, GeForce GTX 1070 Mobile | Guru Mars K i7-7700, GeForce GTX 1080 Mobile | MSI GT75VR 7RF-012 Titan Pro i7-7820HK, GeForce GTX 1080 Mobile | |
|---|---|---|---|---|---|---|---|
| Power Consumption | -15% | -13% | 35% | 10% | -43% | -50% | |
| Idle Minimum * (Watt) | 22 | 28 -27% | 26 -18% | 9 59% | 19 14% | 31 -41% | 34 -55% |
| Idle Average * (Watt) | 26 | 33 -27% | 31 -19% | 13.5 48% | 23 12% | 37 -42% | 41 -58% |
| Idle Maximum * (Watt) | 33 | 41 -24% | 36 -9% | 13.7 58% | 29 12% | 44 -33% | 50 -52% |
| Load Average * (Watt) | 86 | 94 -9% | 93 -8% | 87.8 -2% | 85 1% | 116 -35% | 106 -23% |
| Witcher 3 ultra * (Watt) | 159 | 160 -1% | 176 -11% | 129 19% | 259 -63% | 257 -62% | |
| Load Maximum * (Watt) | 215 | 222 -3% | 240 -12% | 158.6 26% | 192 11% | 312 -45% | 320 -49% |
* ... menor é melhor
| Alienware 15 R3 Max-Q i7-7820HK, GeForce GTX 1080 Max-Q, 99 Wh | Alienware 15 R3 i7-7700HQ, GeForce GTX 1070 Mobile, 99 Wh | Acer Predator Triton 700 i7-7700HQ, GeForce GTX 1080 Max-Q, 54 Wh | Aorus X5 v7 i7-7820HK, GeForce GTX 1070 Mobile, 94 Wh | Eurocom Q5 i7-7700HQ, GeForce GTX 1070 Max-Q, 55 Wh | |
|---|---|---|---|---|---|
| Duração da bateria | -13% | -56% | -44% | -23% | |
| Reader / Idle (h) | 7.1 | 6.4 -10% | 2.5 -65% | 3.5 -51% | 7.8 10% |
| H.264 (h) | 5 | 4.4 -12% | 1.8 -64% | 2.7 -46% | |
| WiFi v1.3 (h) | 5.4 | 4.4 -19% | 2.4 -56% | 2.5 -54% | 4.3 -20% |
| Load (h) | 1.9 | 1.7 -11% | 1.2 -37% | 1.4 -26% | 0.8 -58% |
Pro
Contra
O Alienware 15 R3 roda todos os jogos de computador atuais fluentemente em sua tela FHD mate.
Sem compromissos: Todos os jogos funcionam sem problemas com as configurações de qualidade máxima.
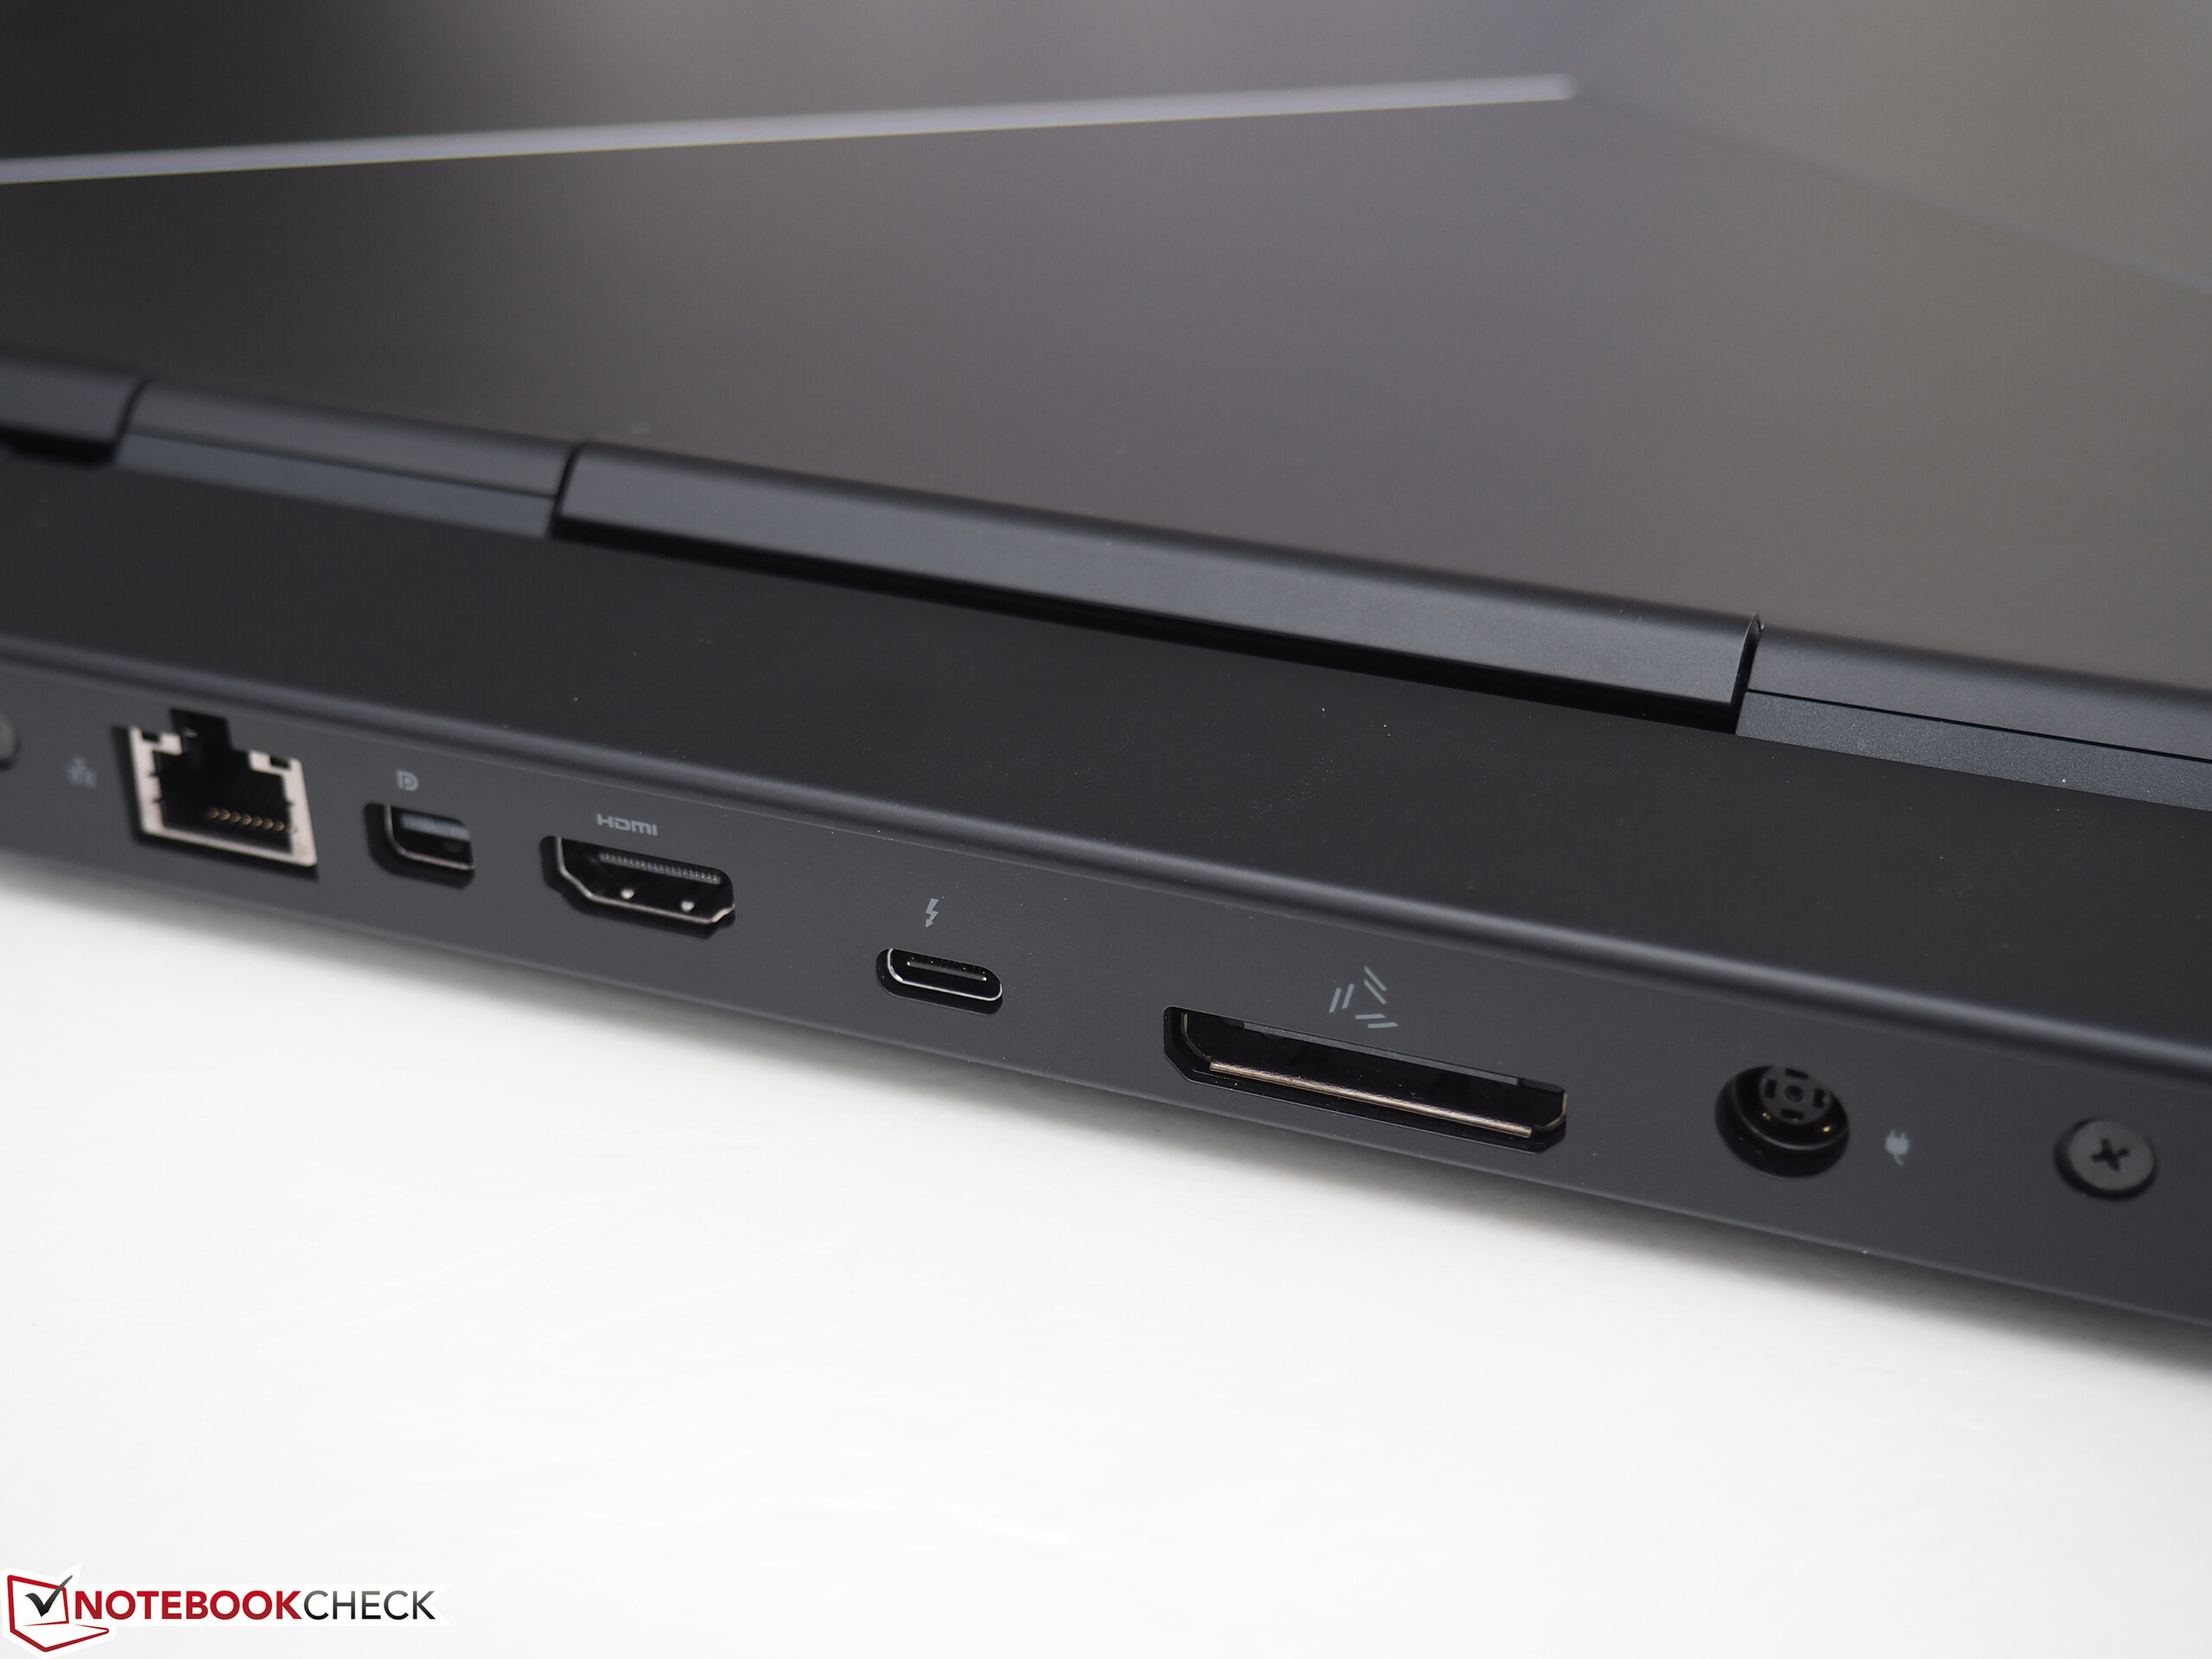
Caso a GPU fique muito fraca algum dia, você pode conectar uma GPU externa através da porta Thunderbolt 3 ou Amplificador de Gráficos.
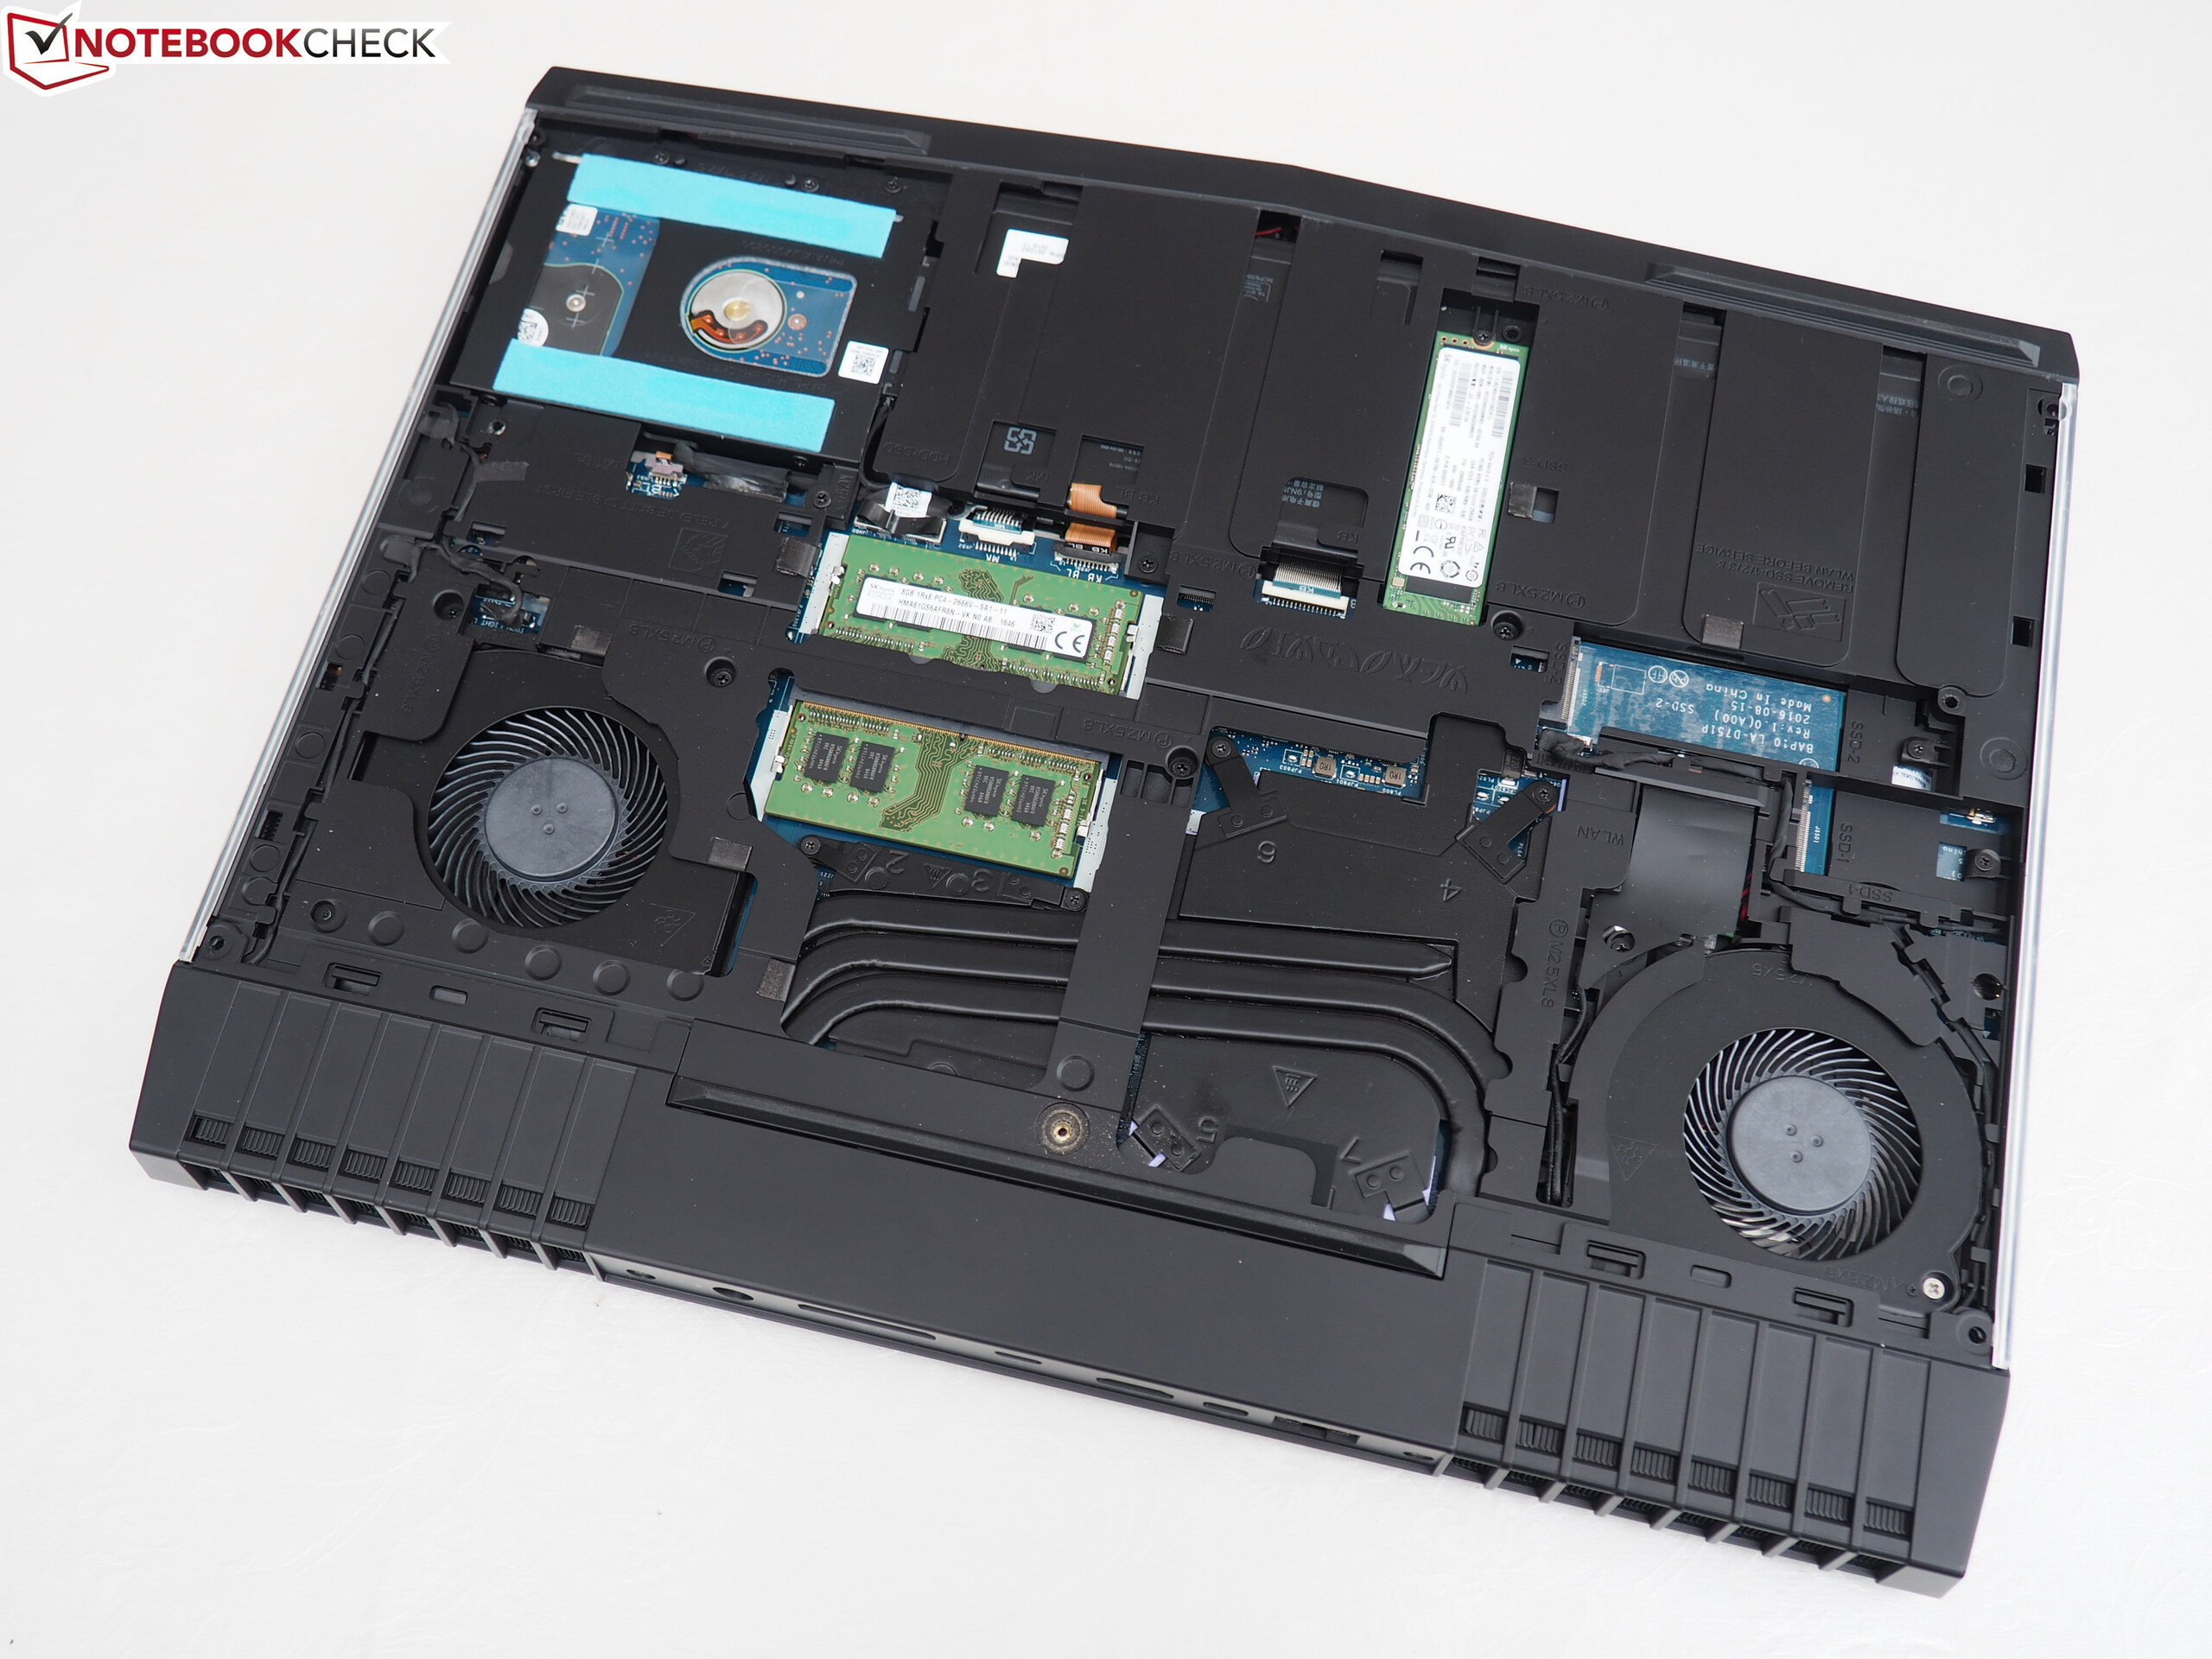
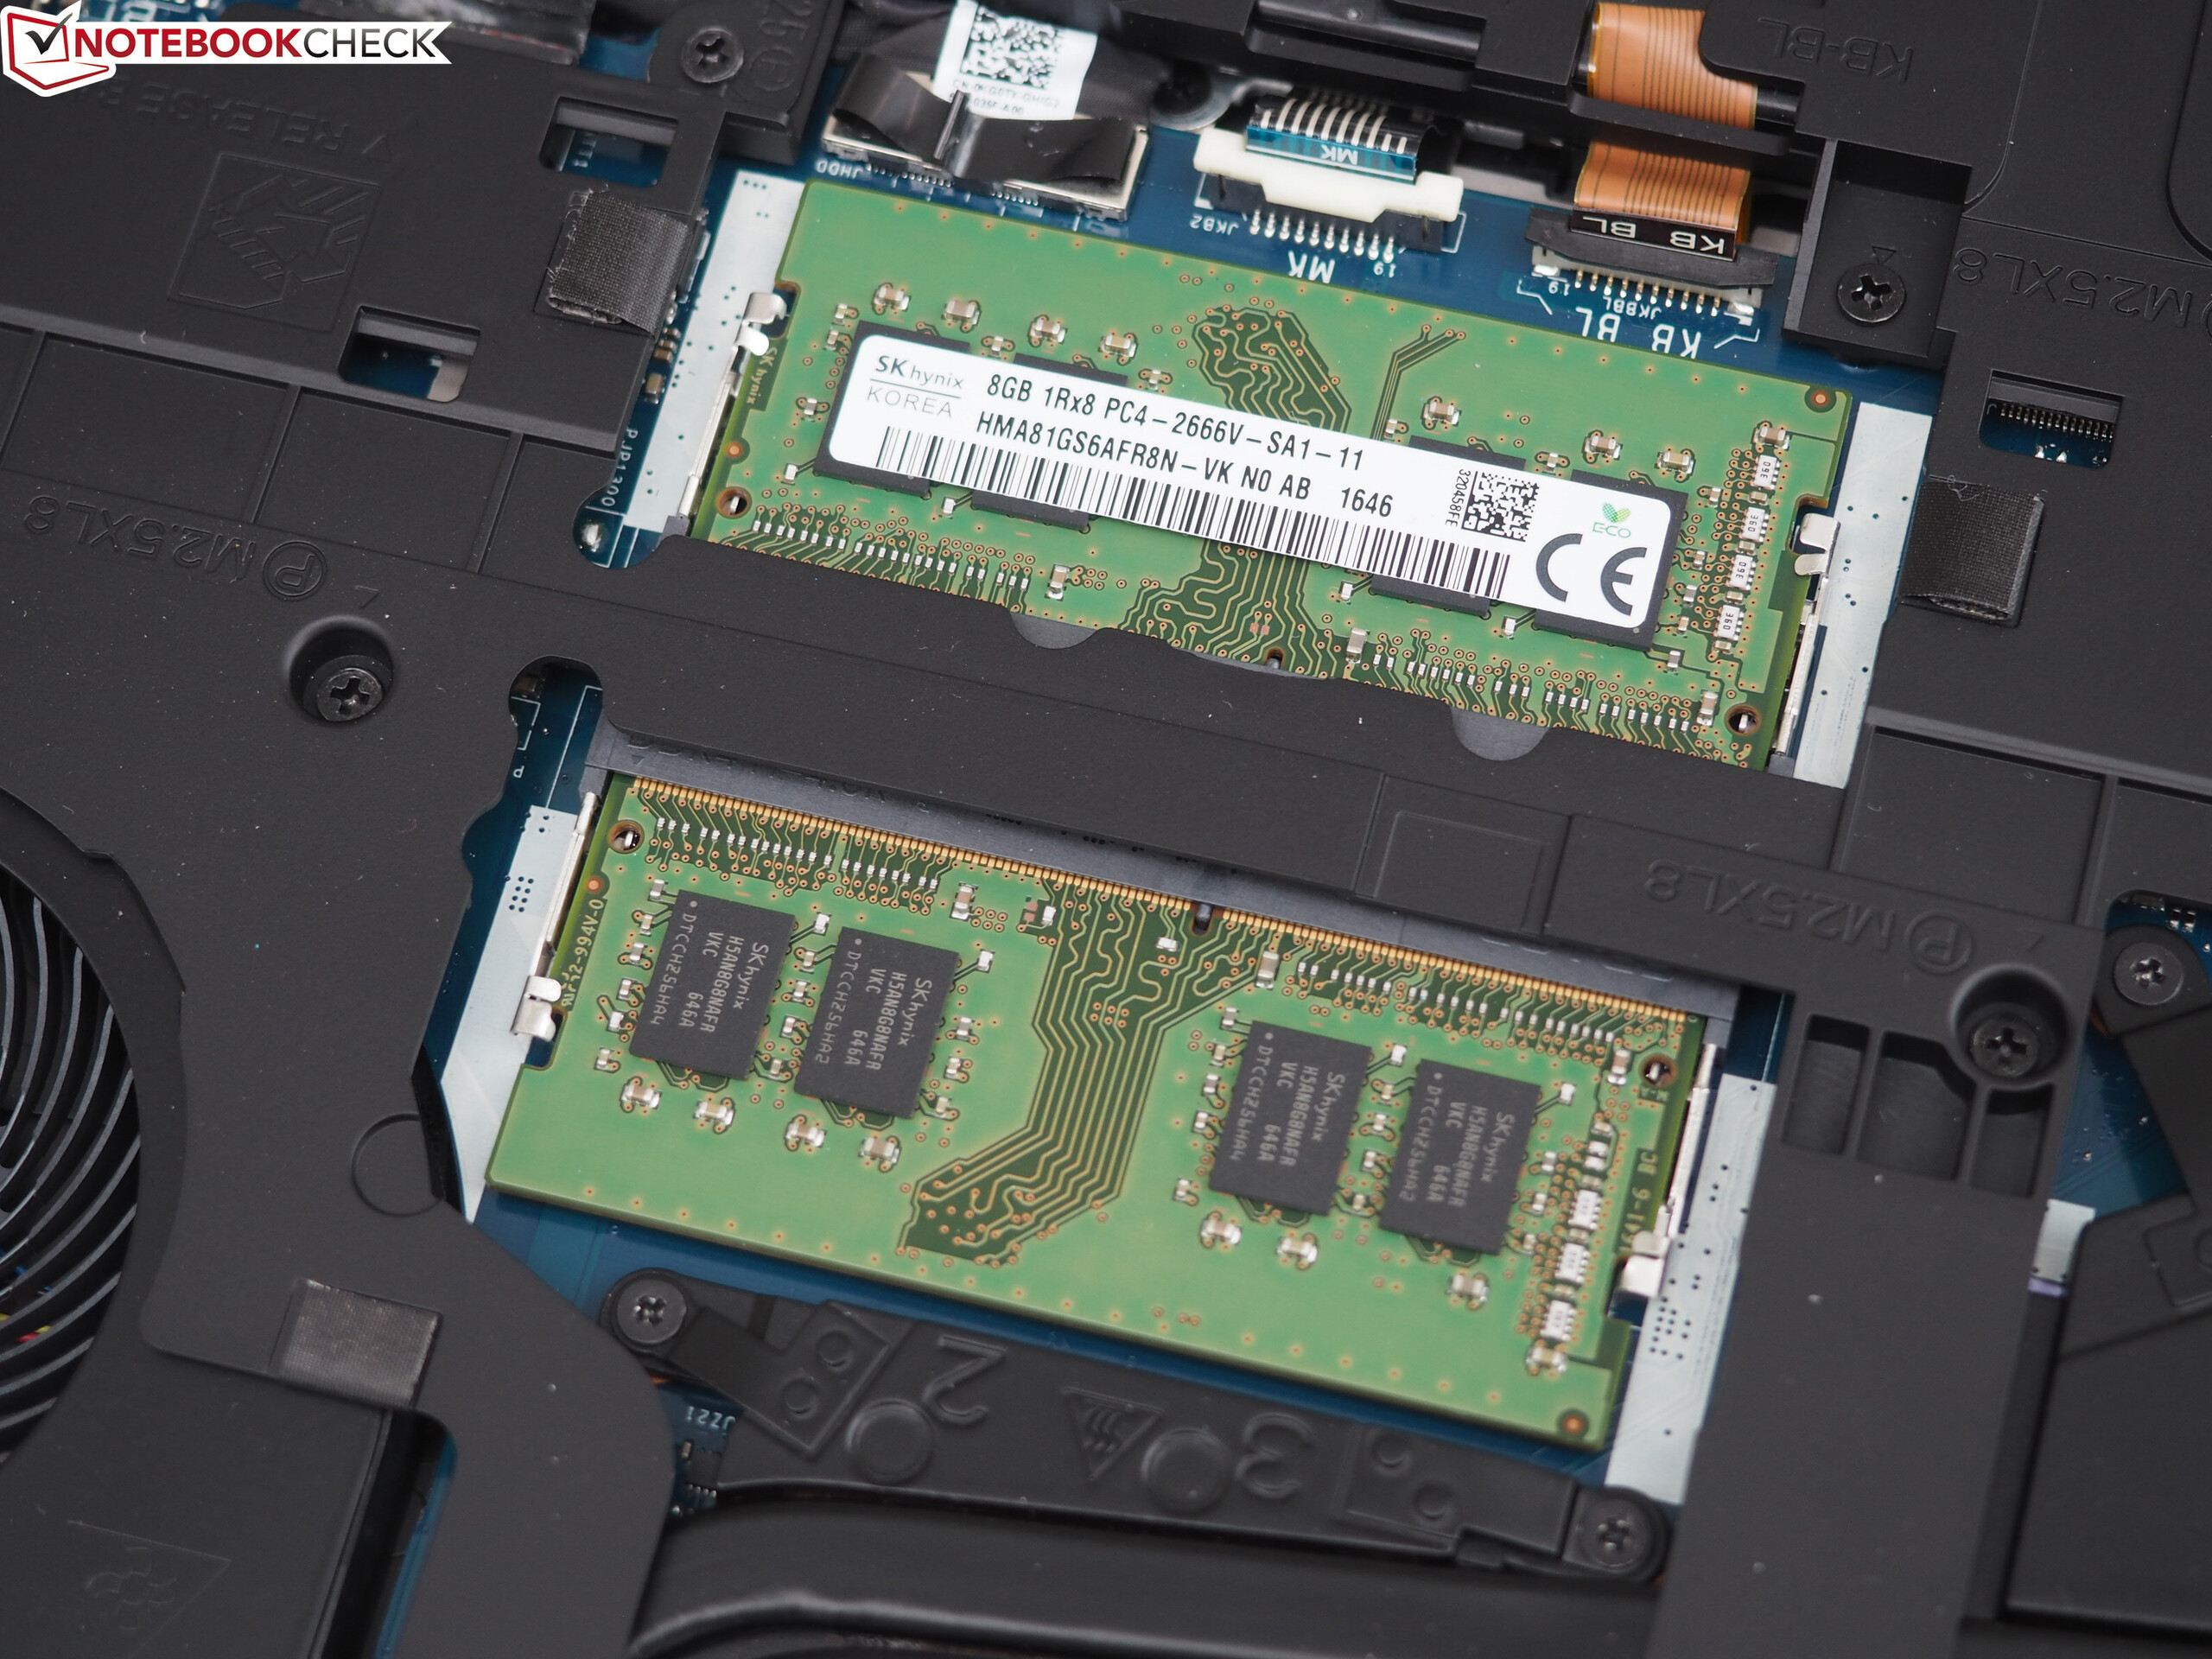
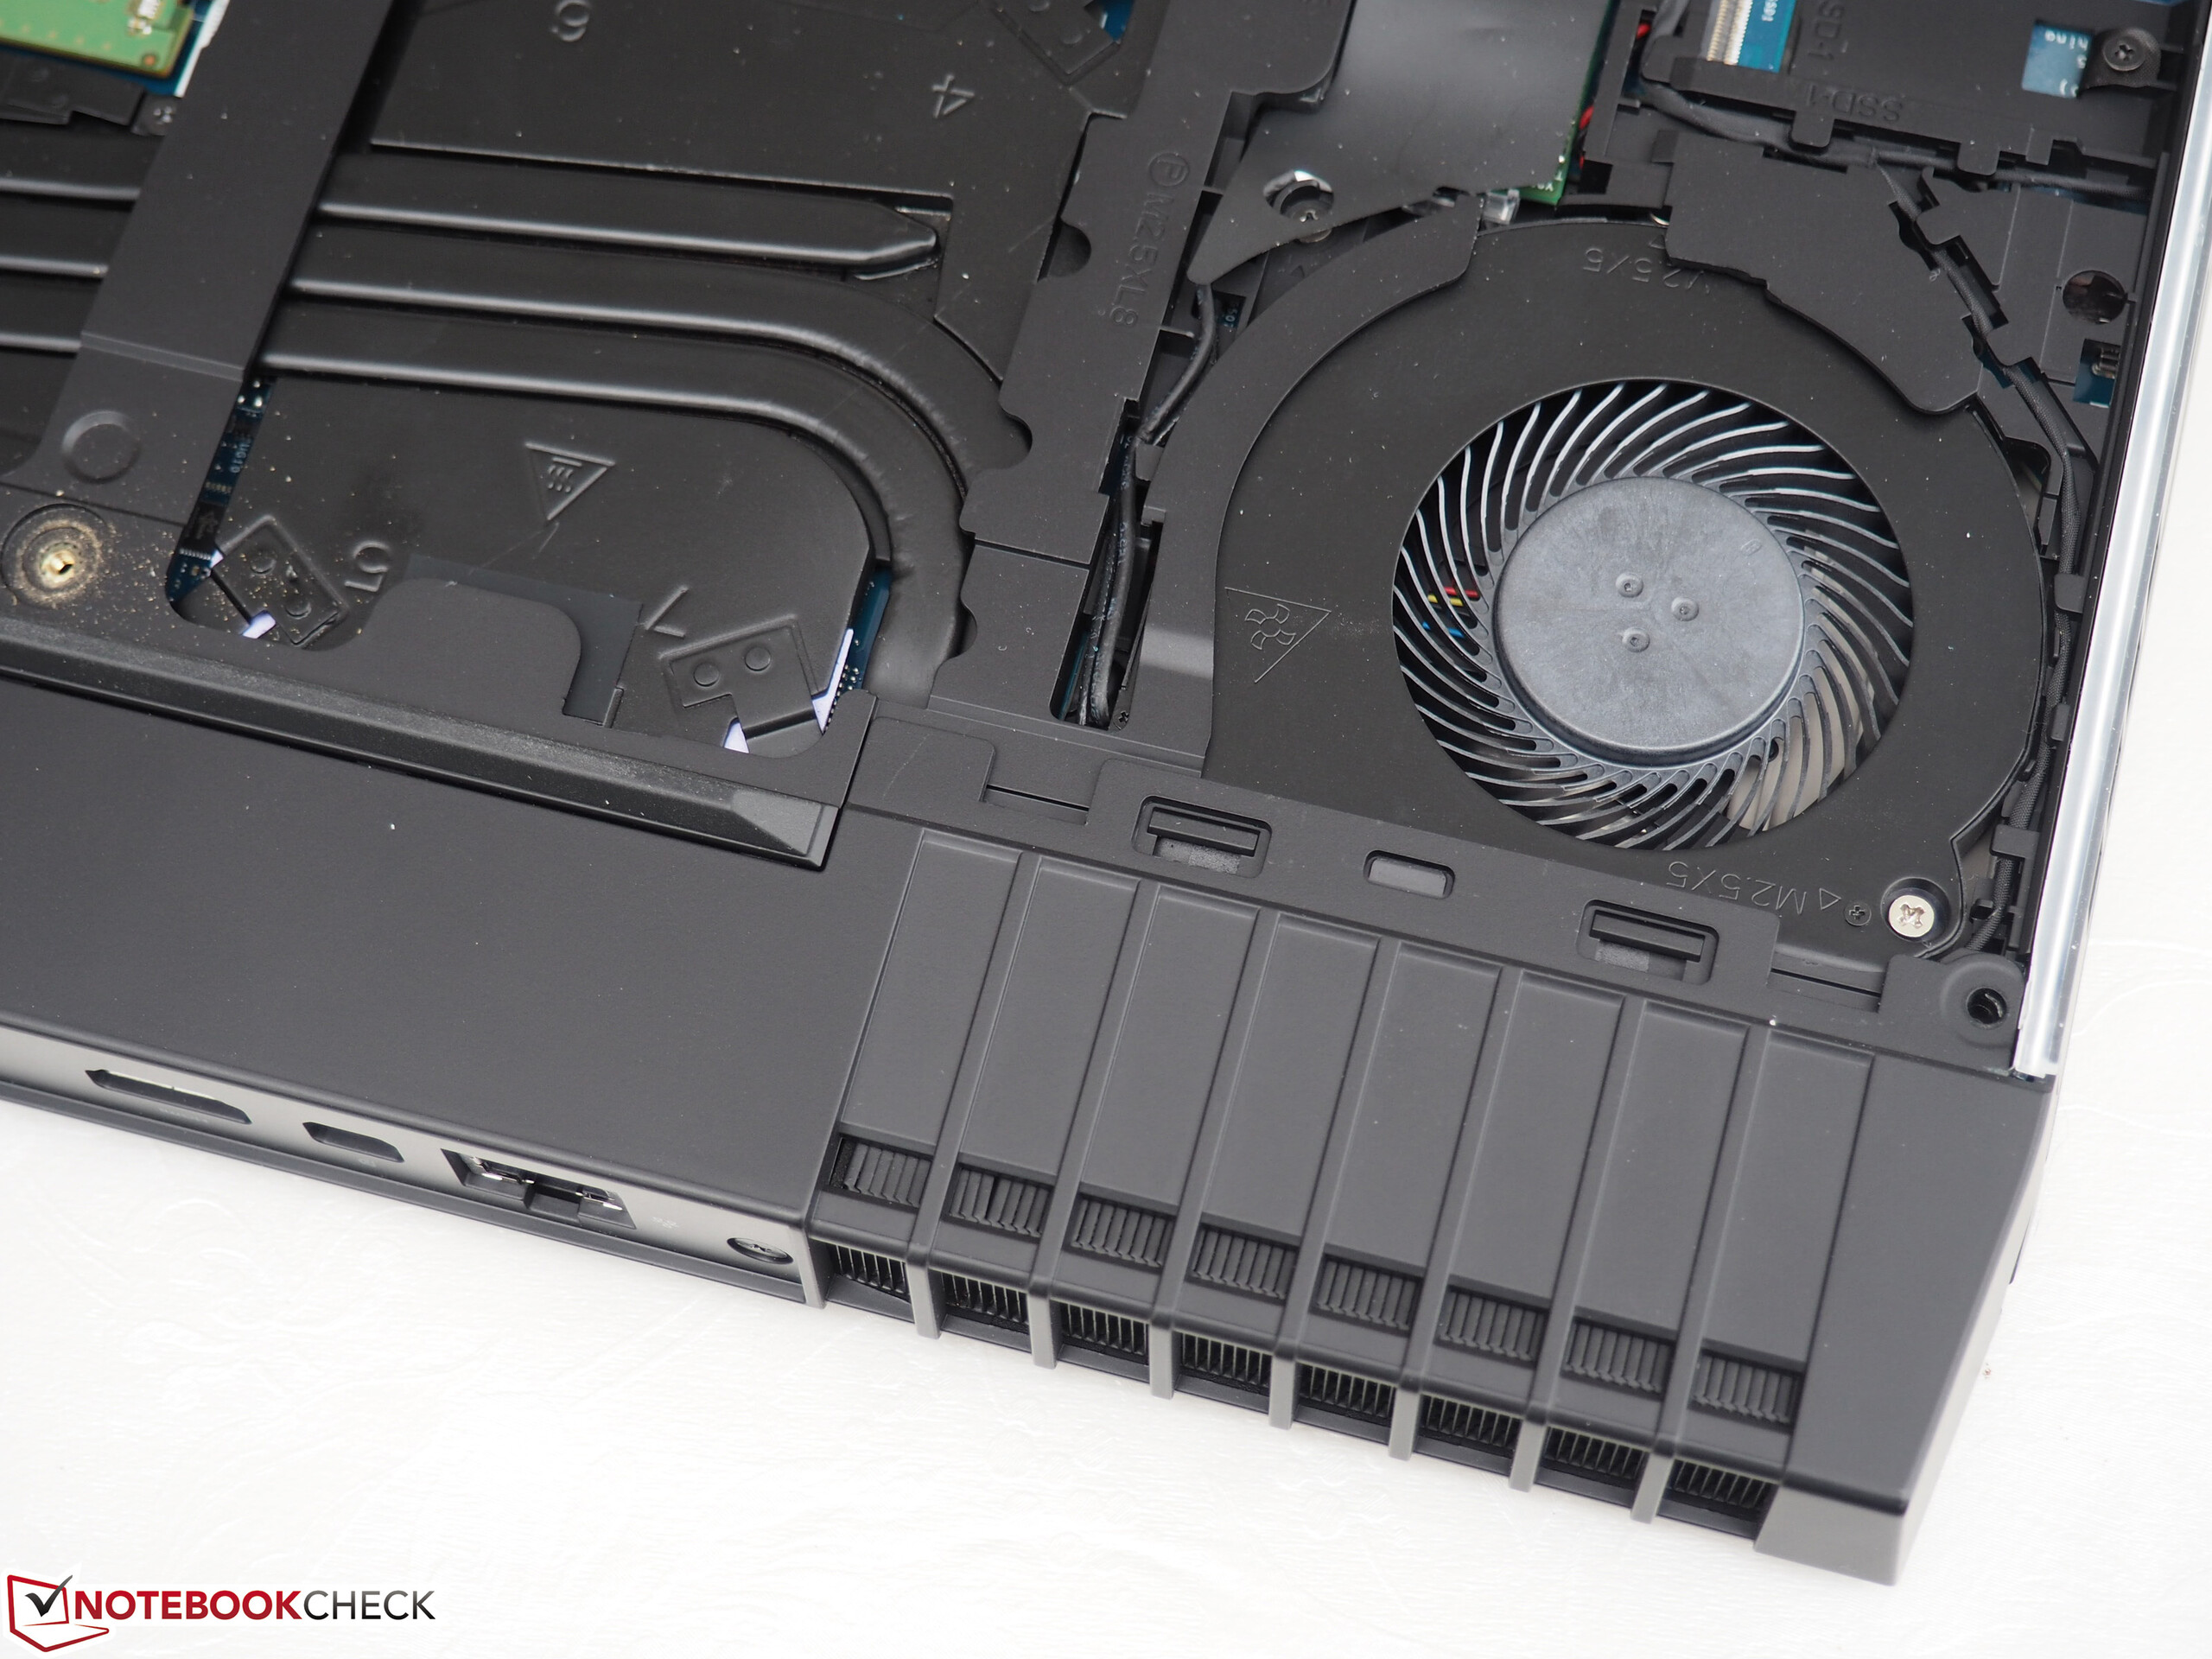
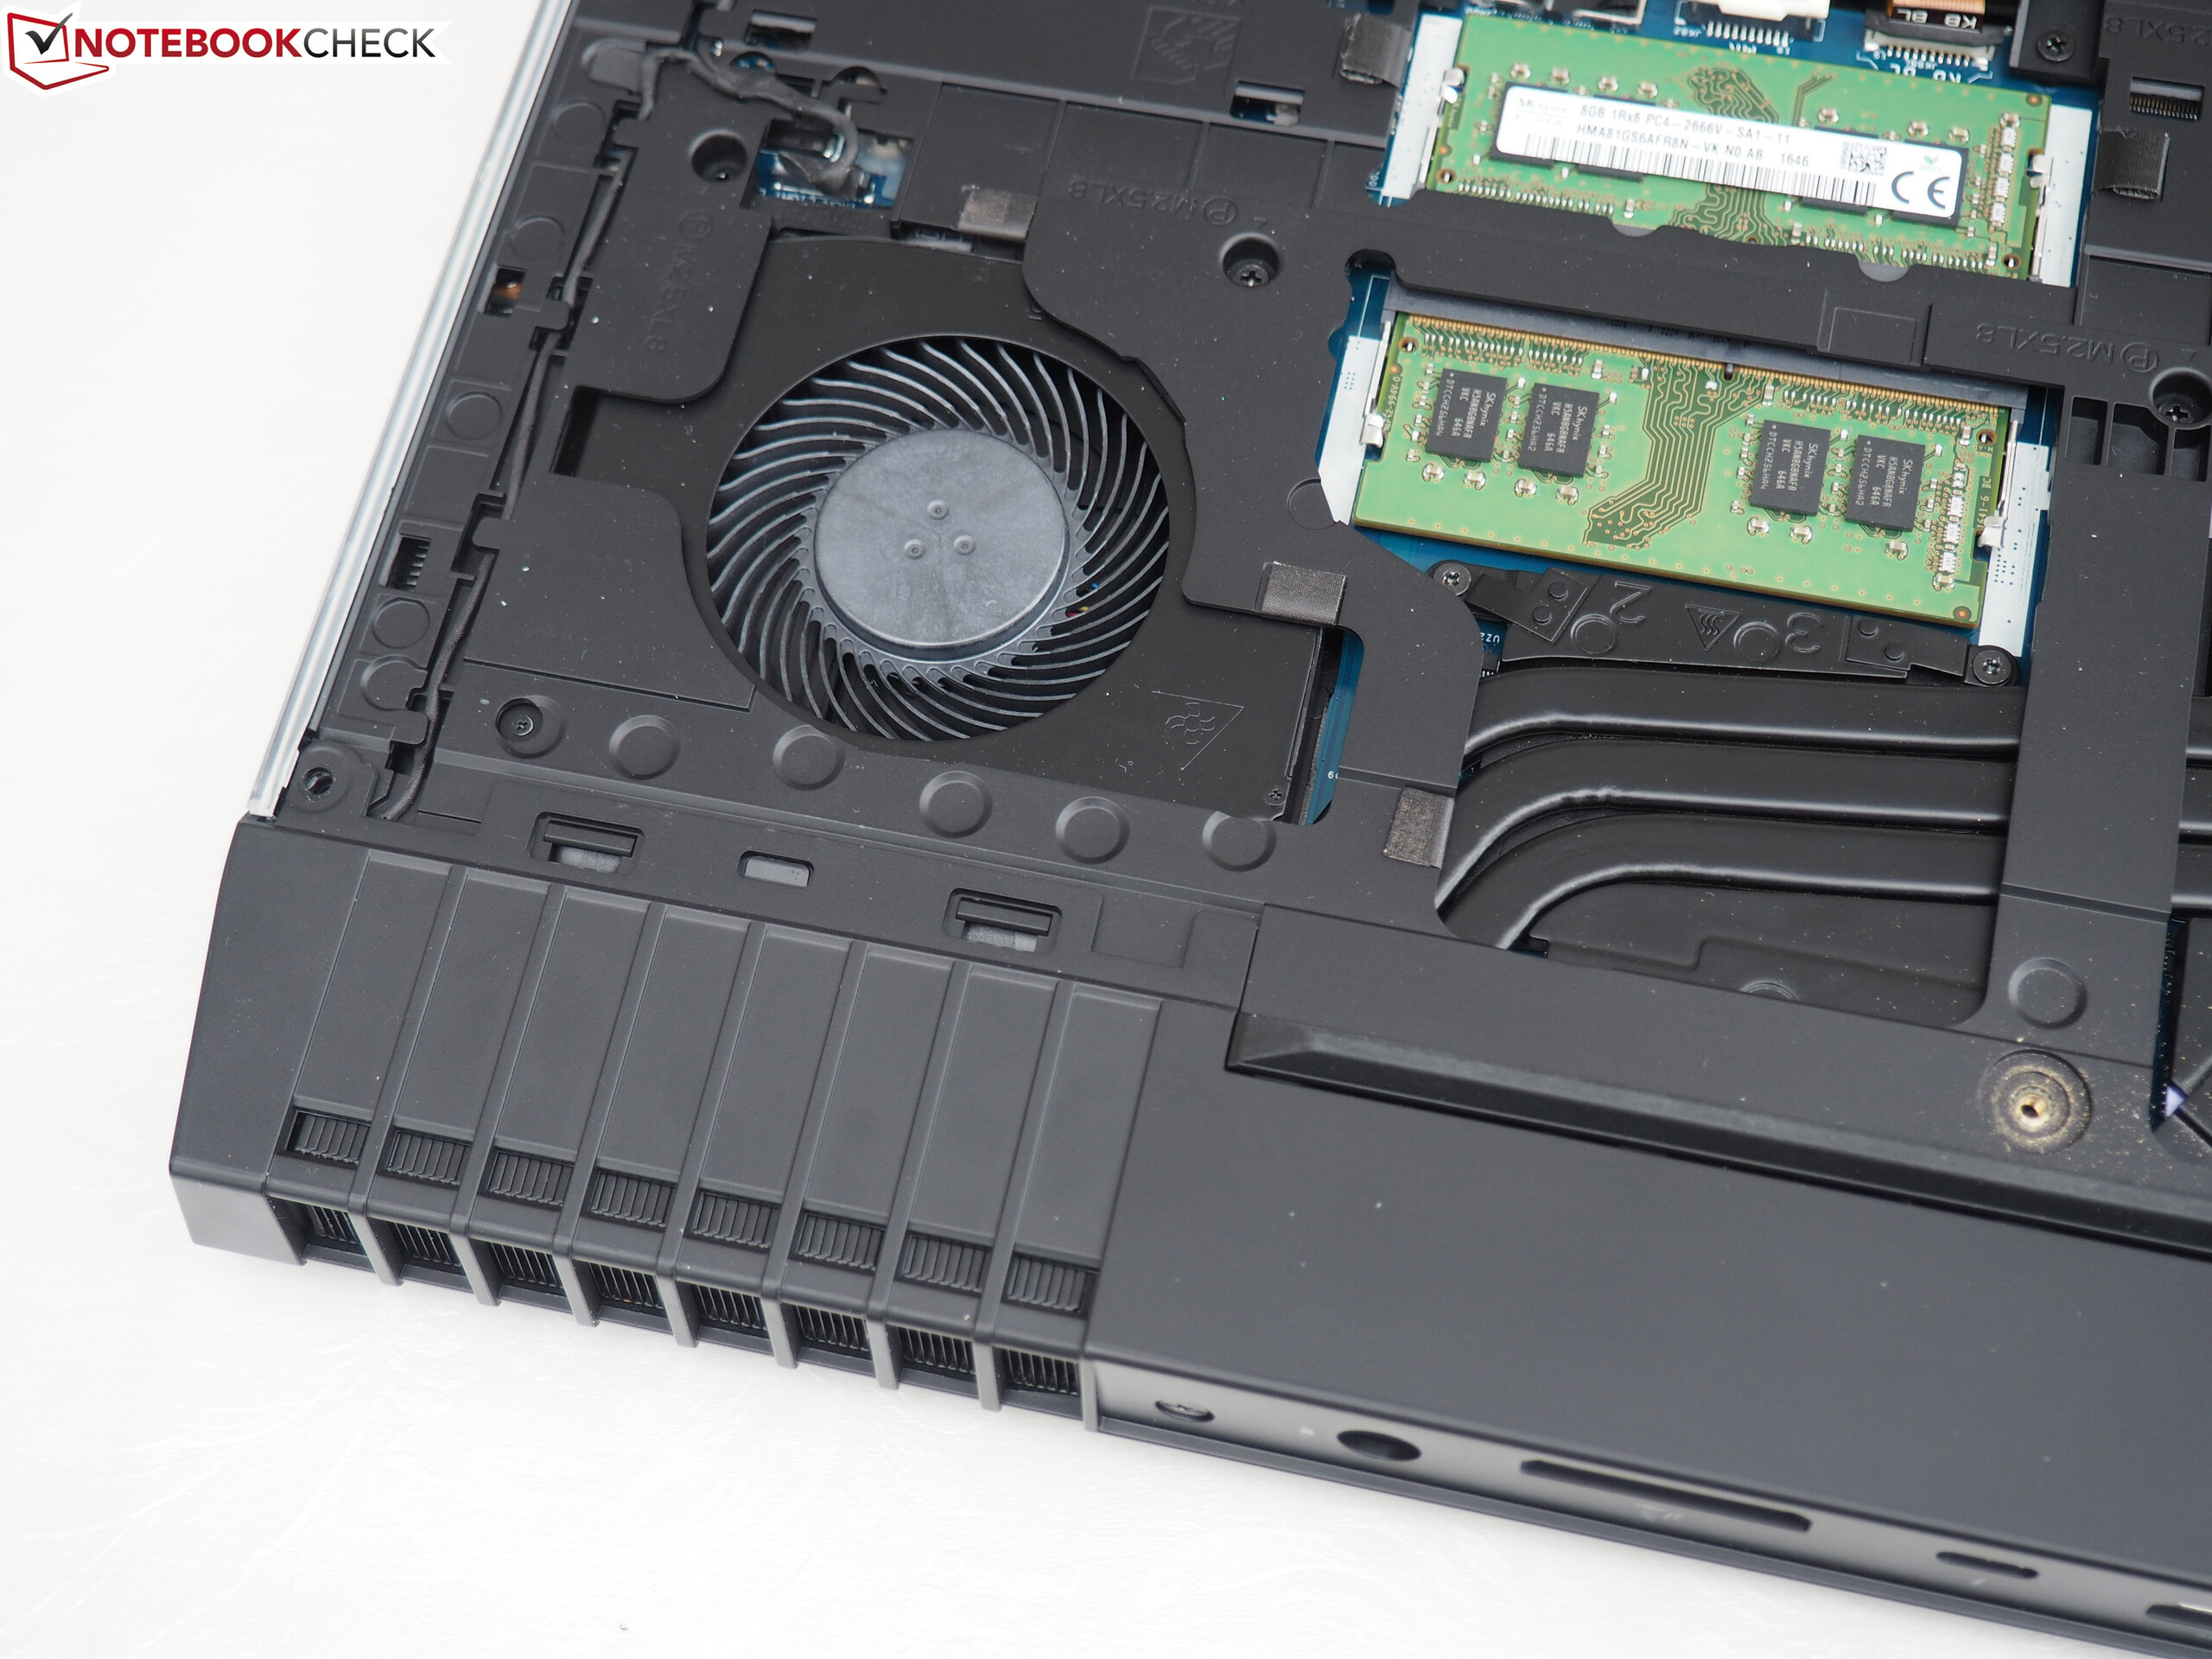
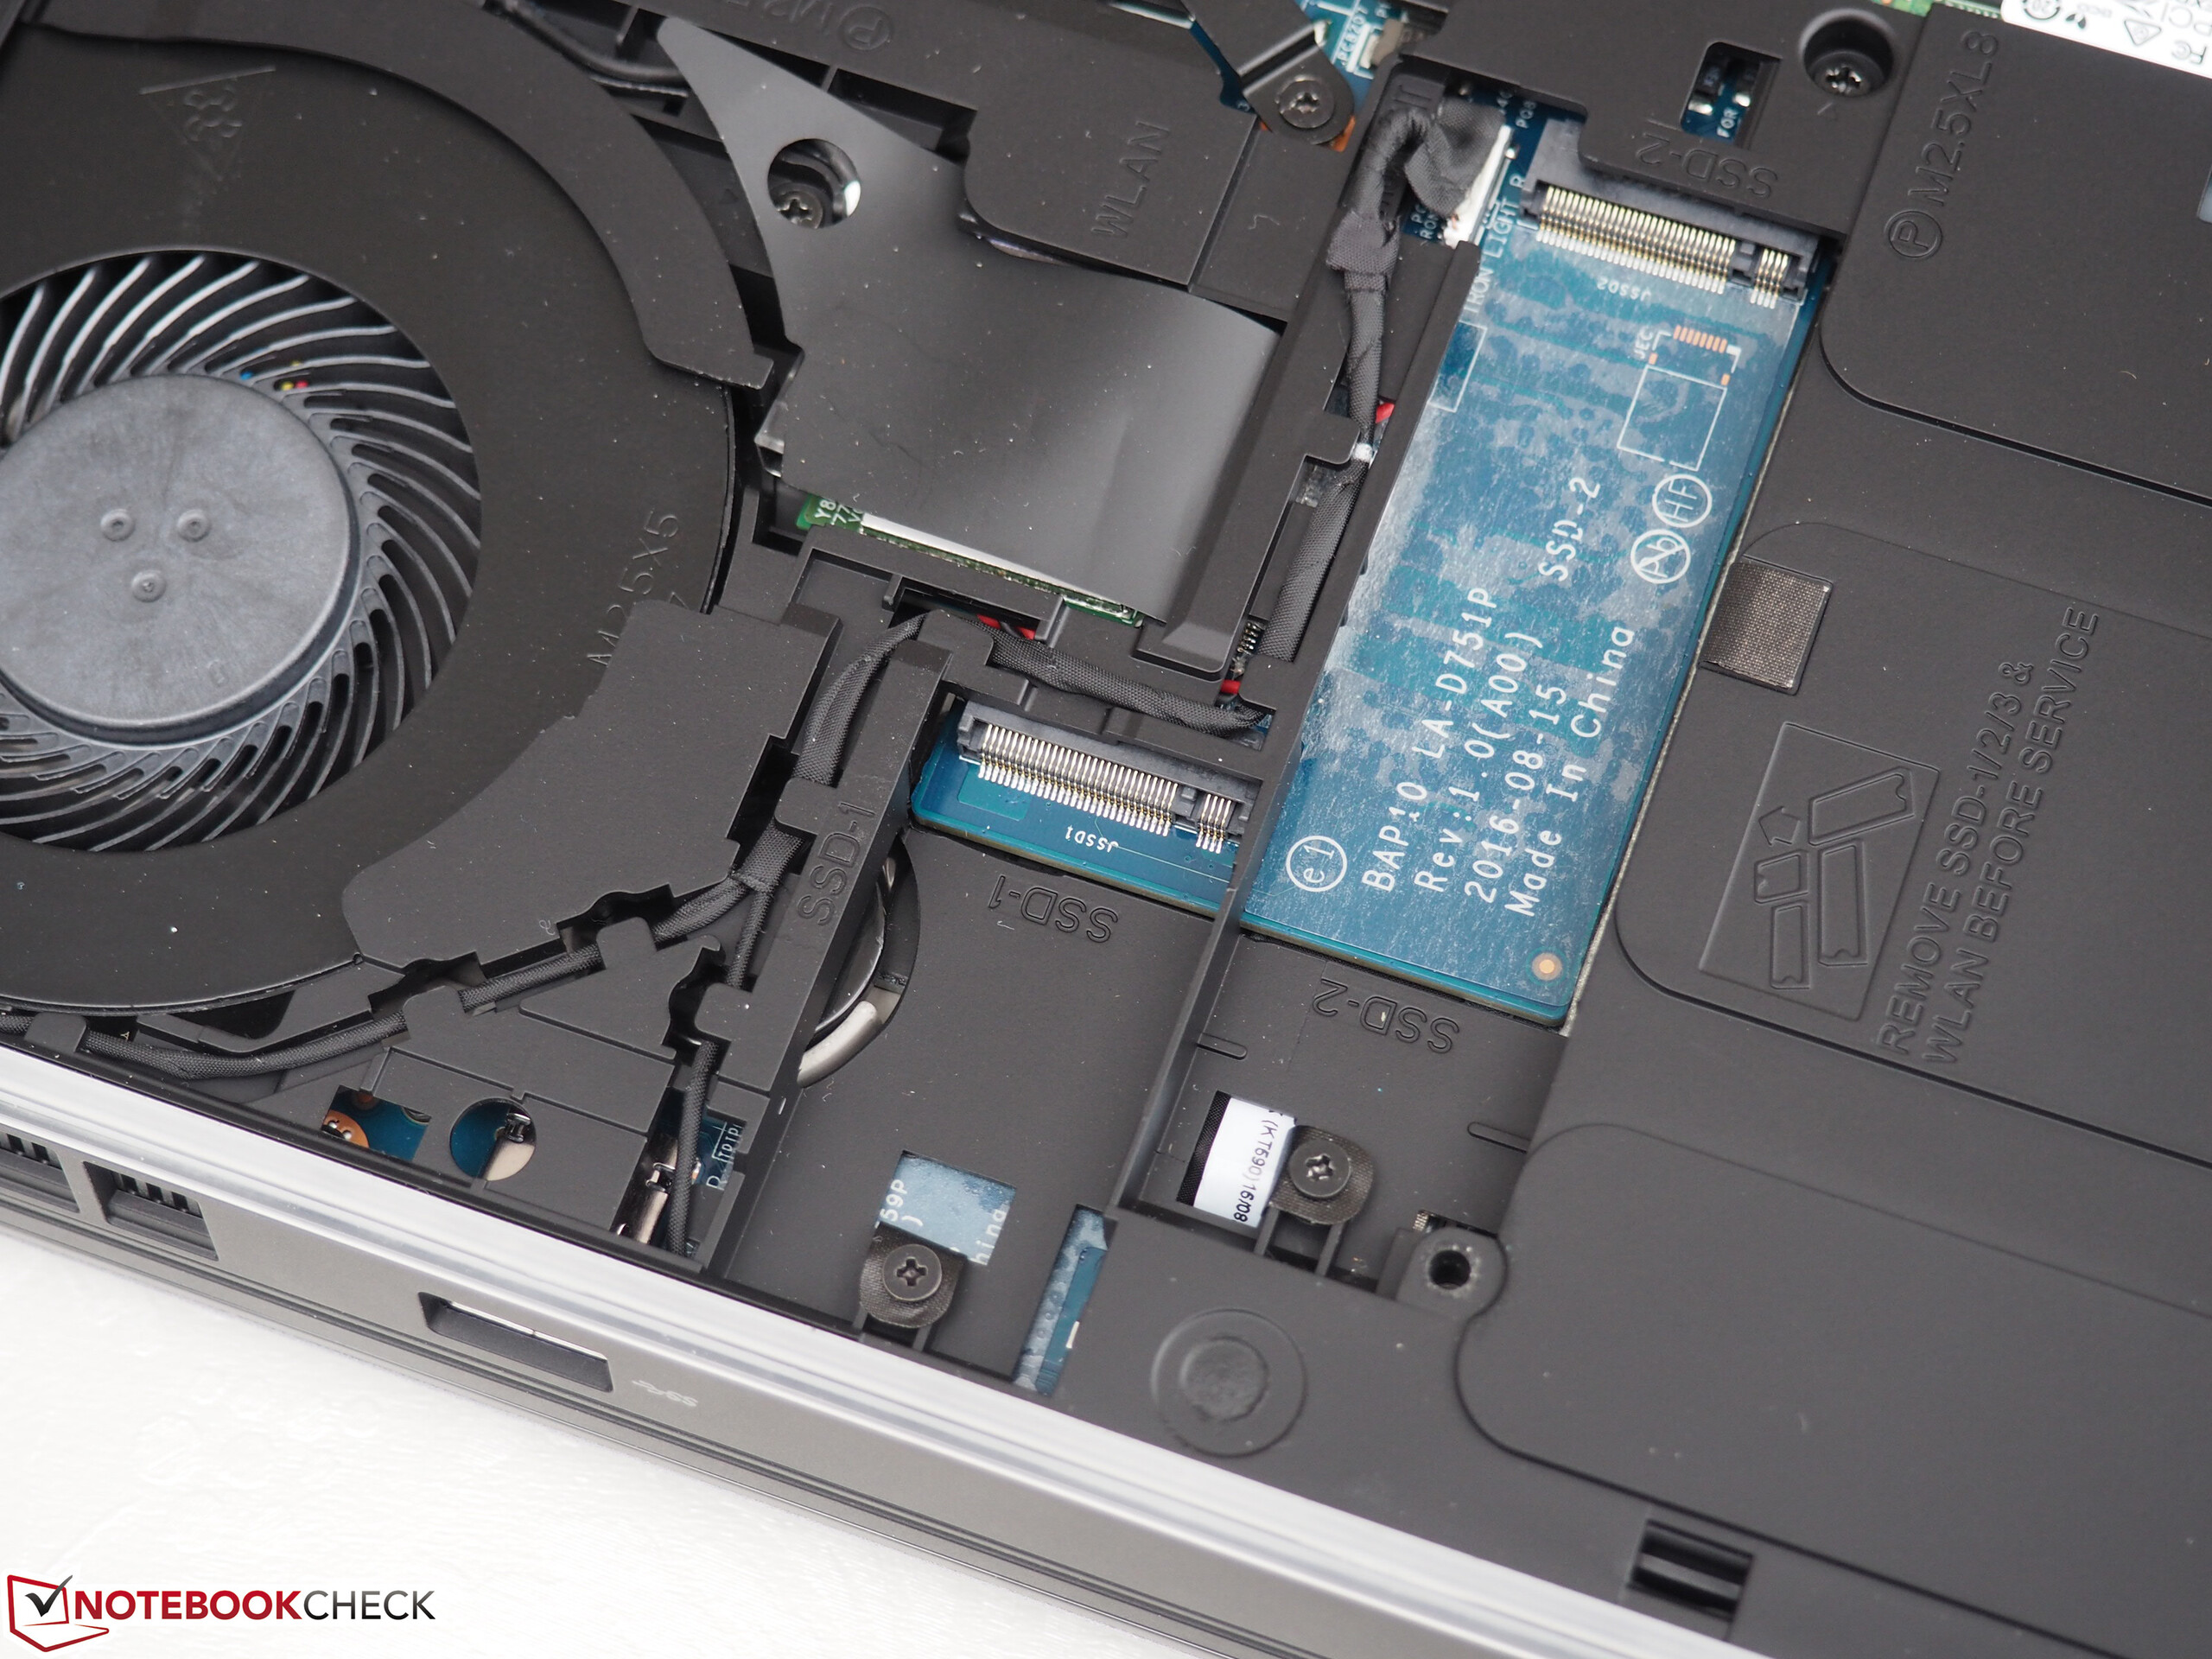
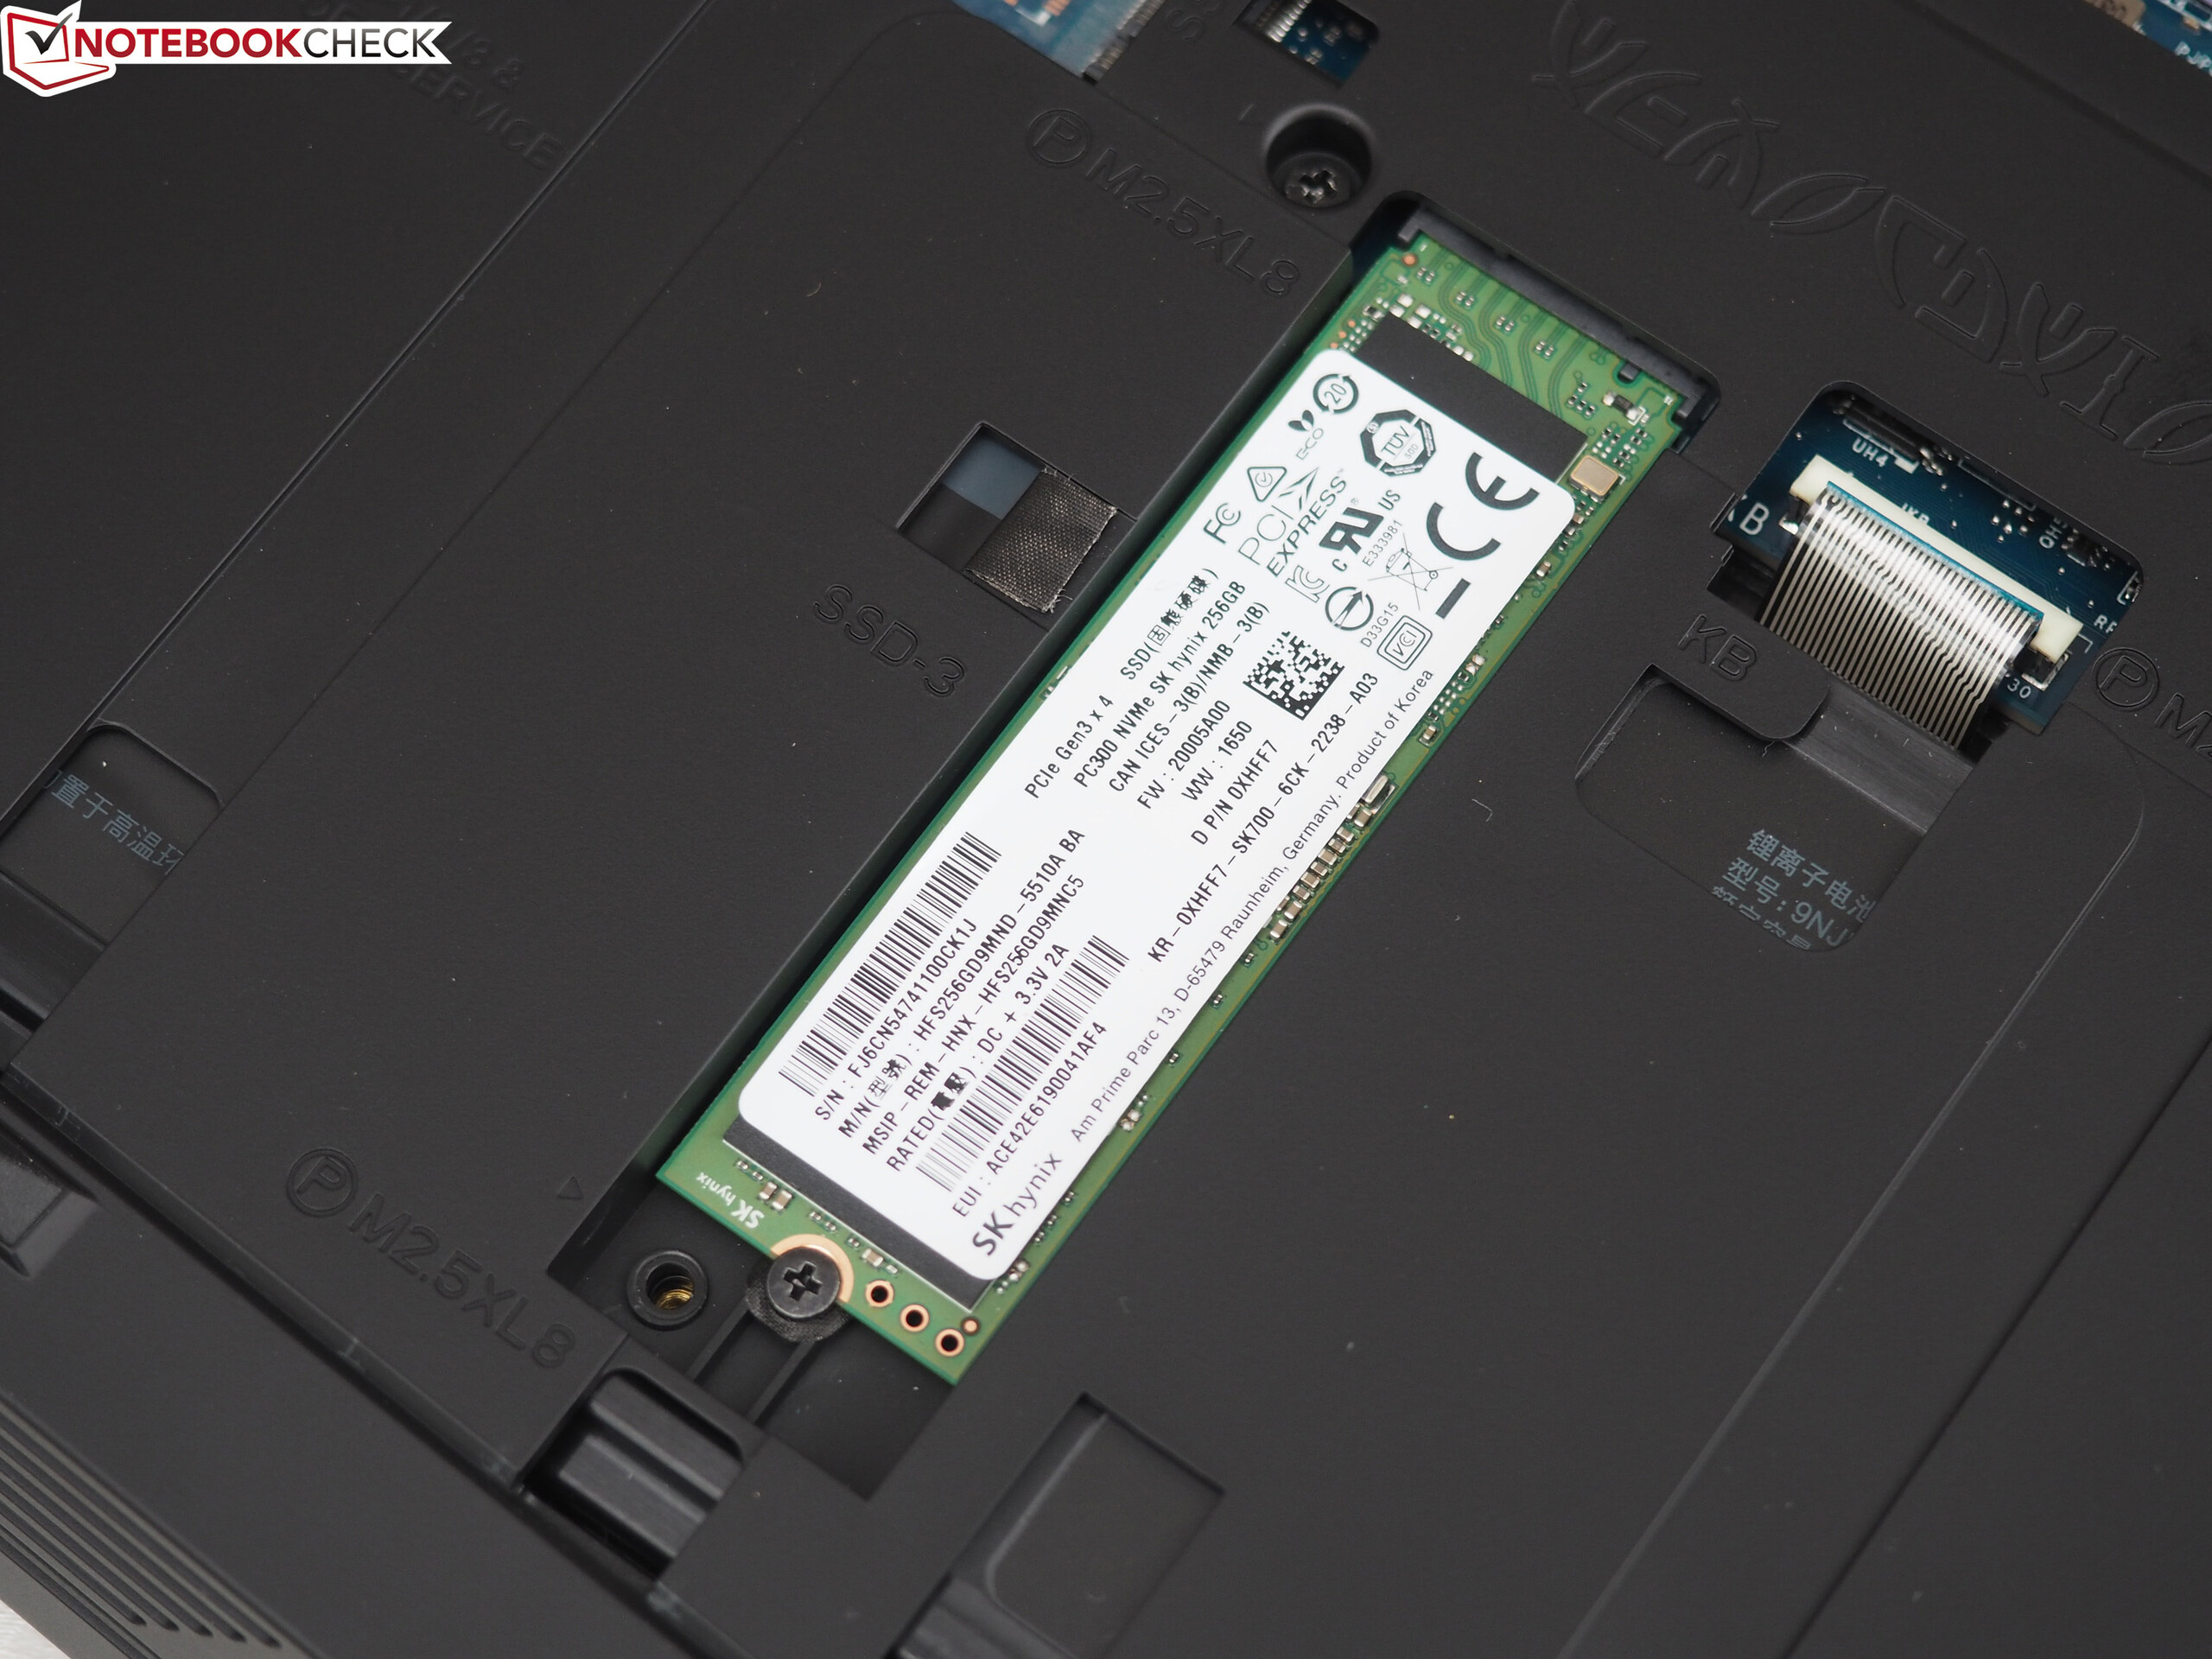
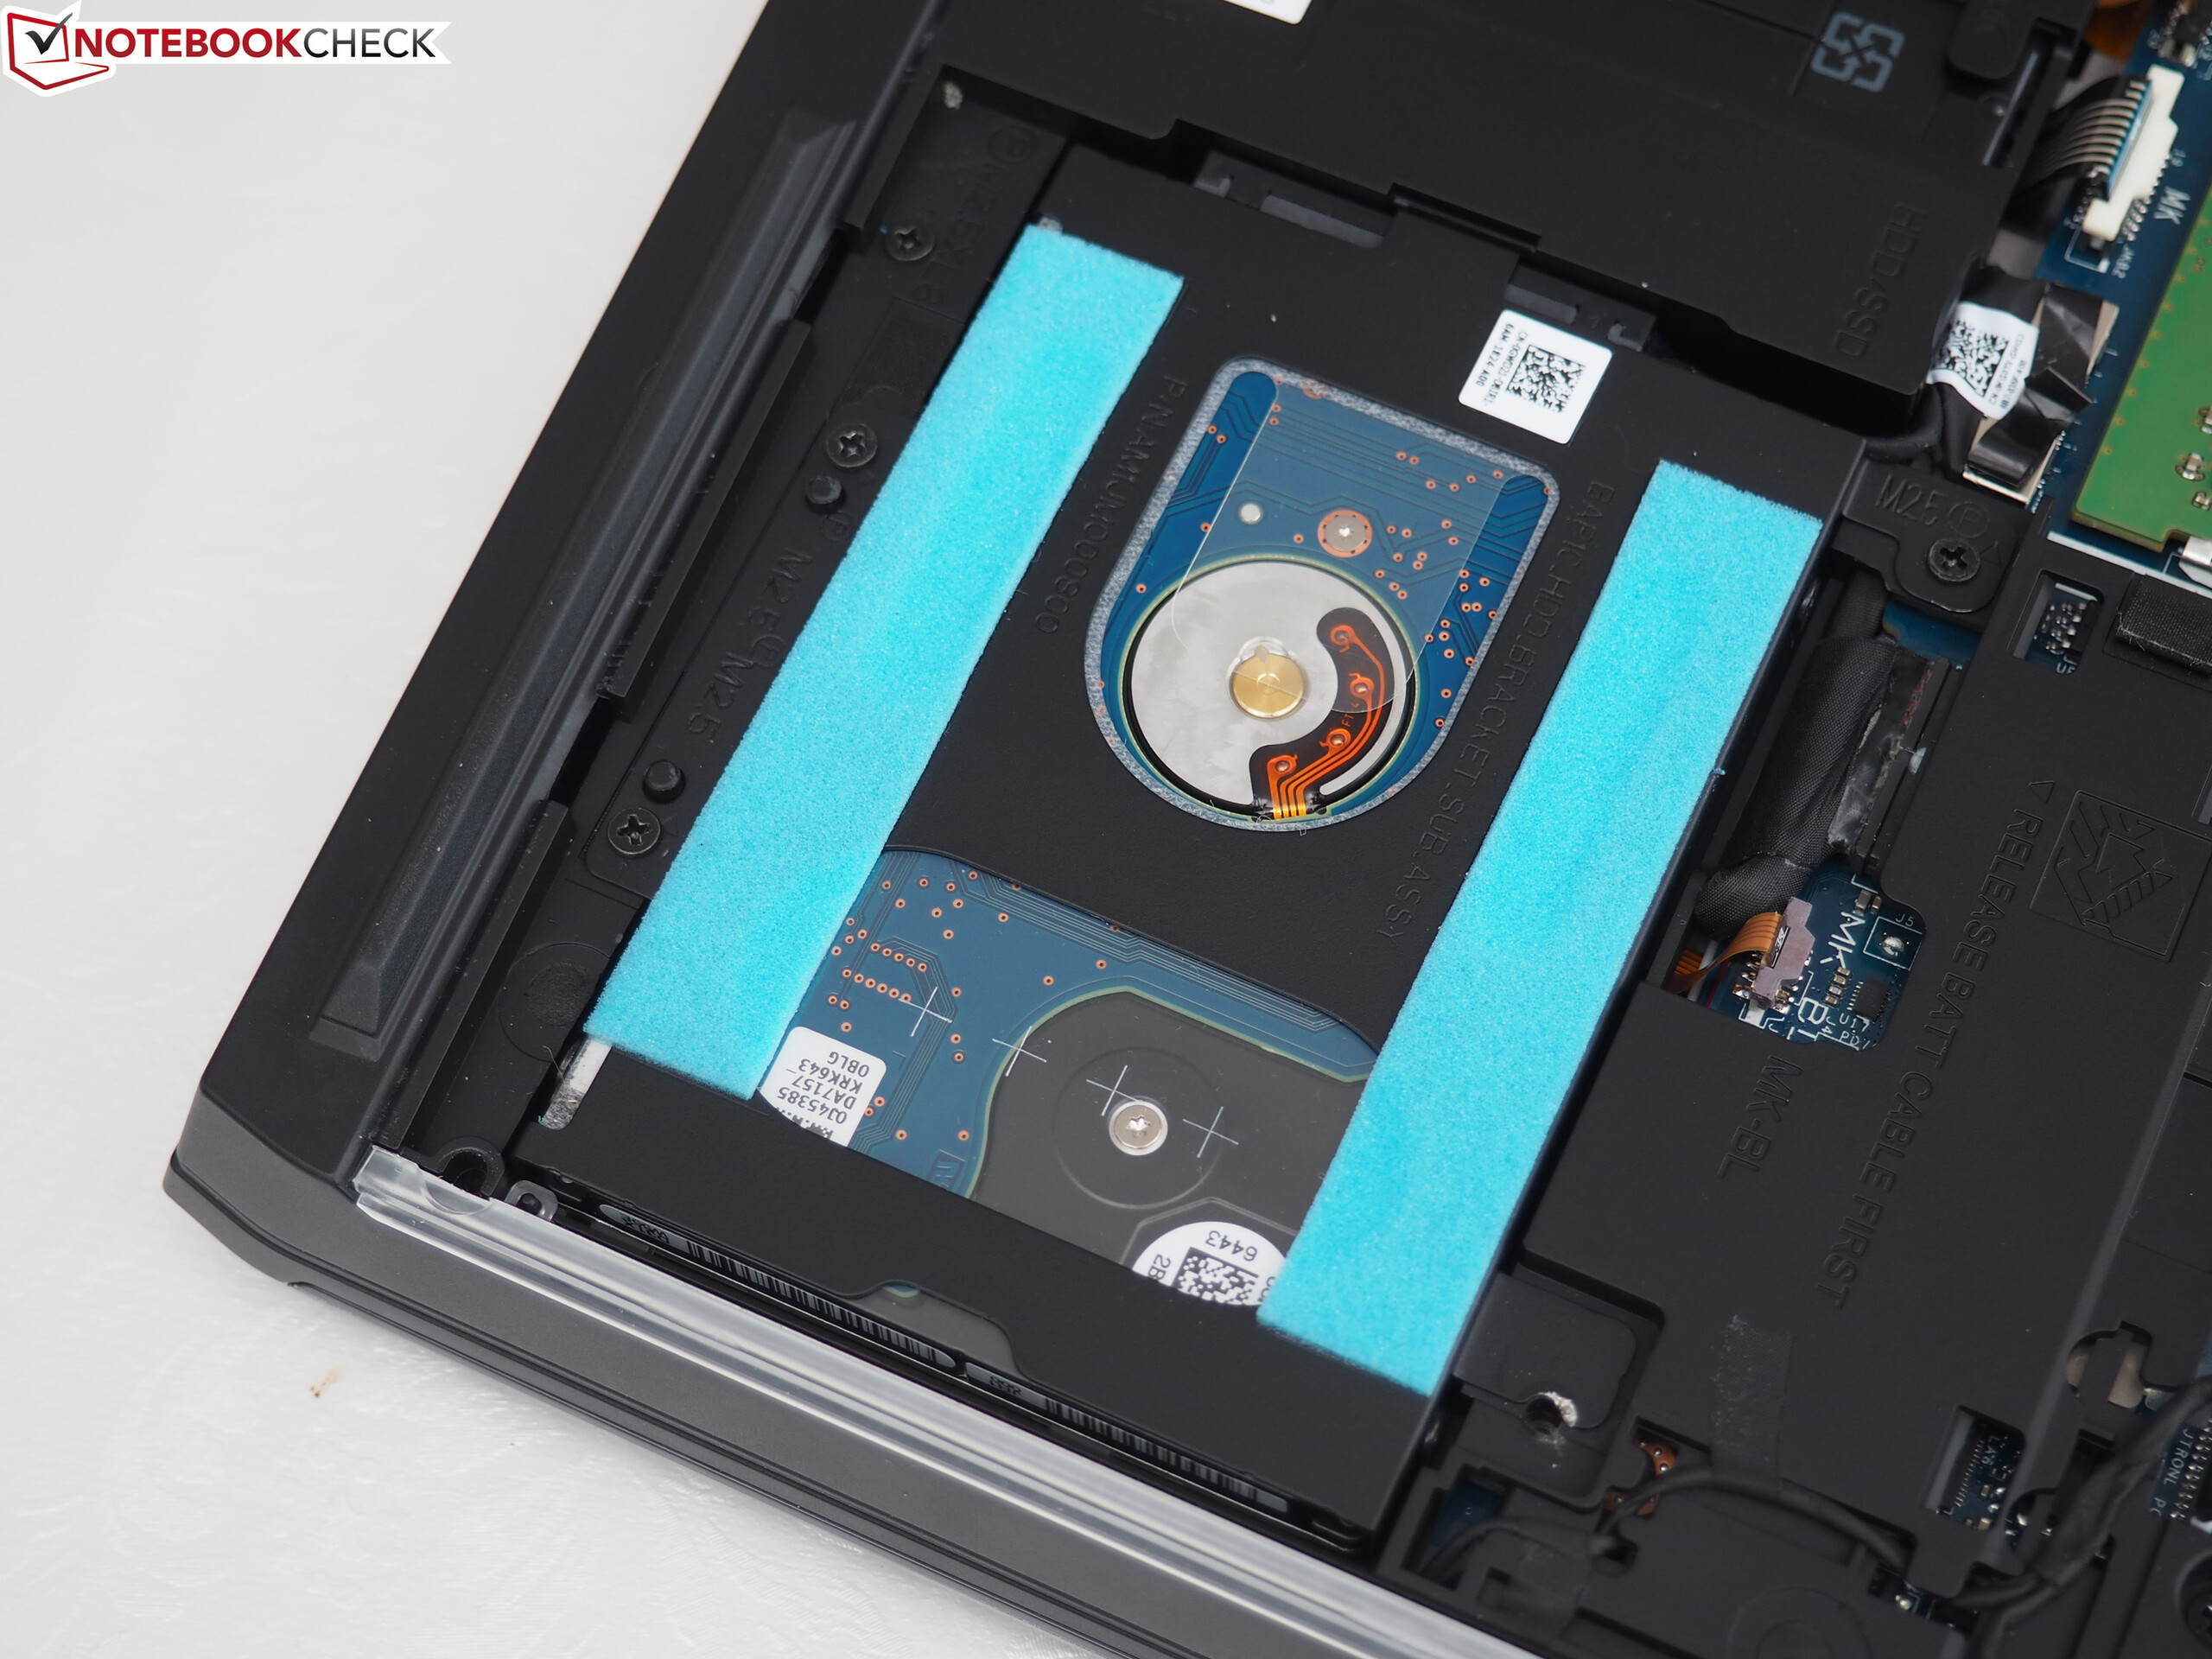
O SSD NVMe é rápido como o vento e oferece um sistema fluente e rápido. O aparelho também está equipado com um disco rígido de 1-TB. Ambos os dispositivos de armazenamento podem ser substituídos. As durações da bateria são muito decentes para um aparelho com este nível de desempenho.
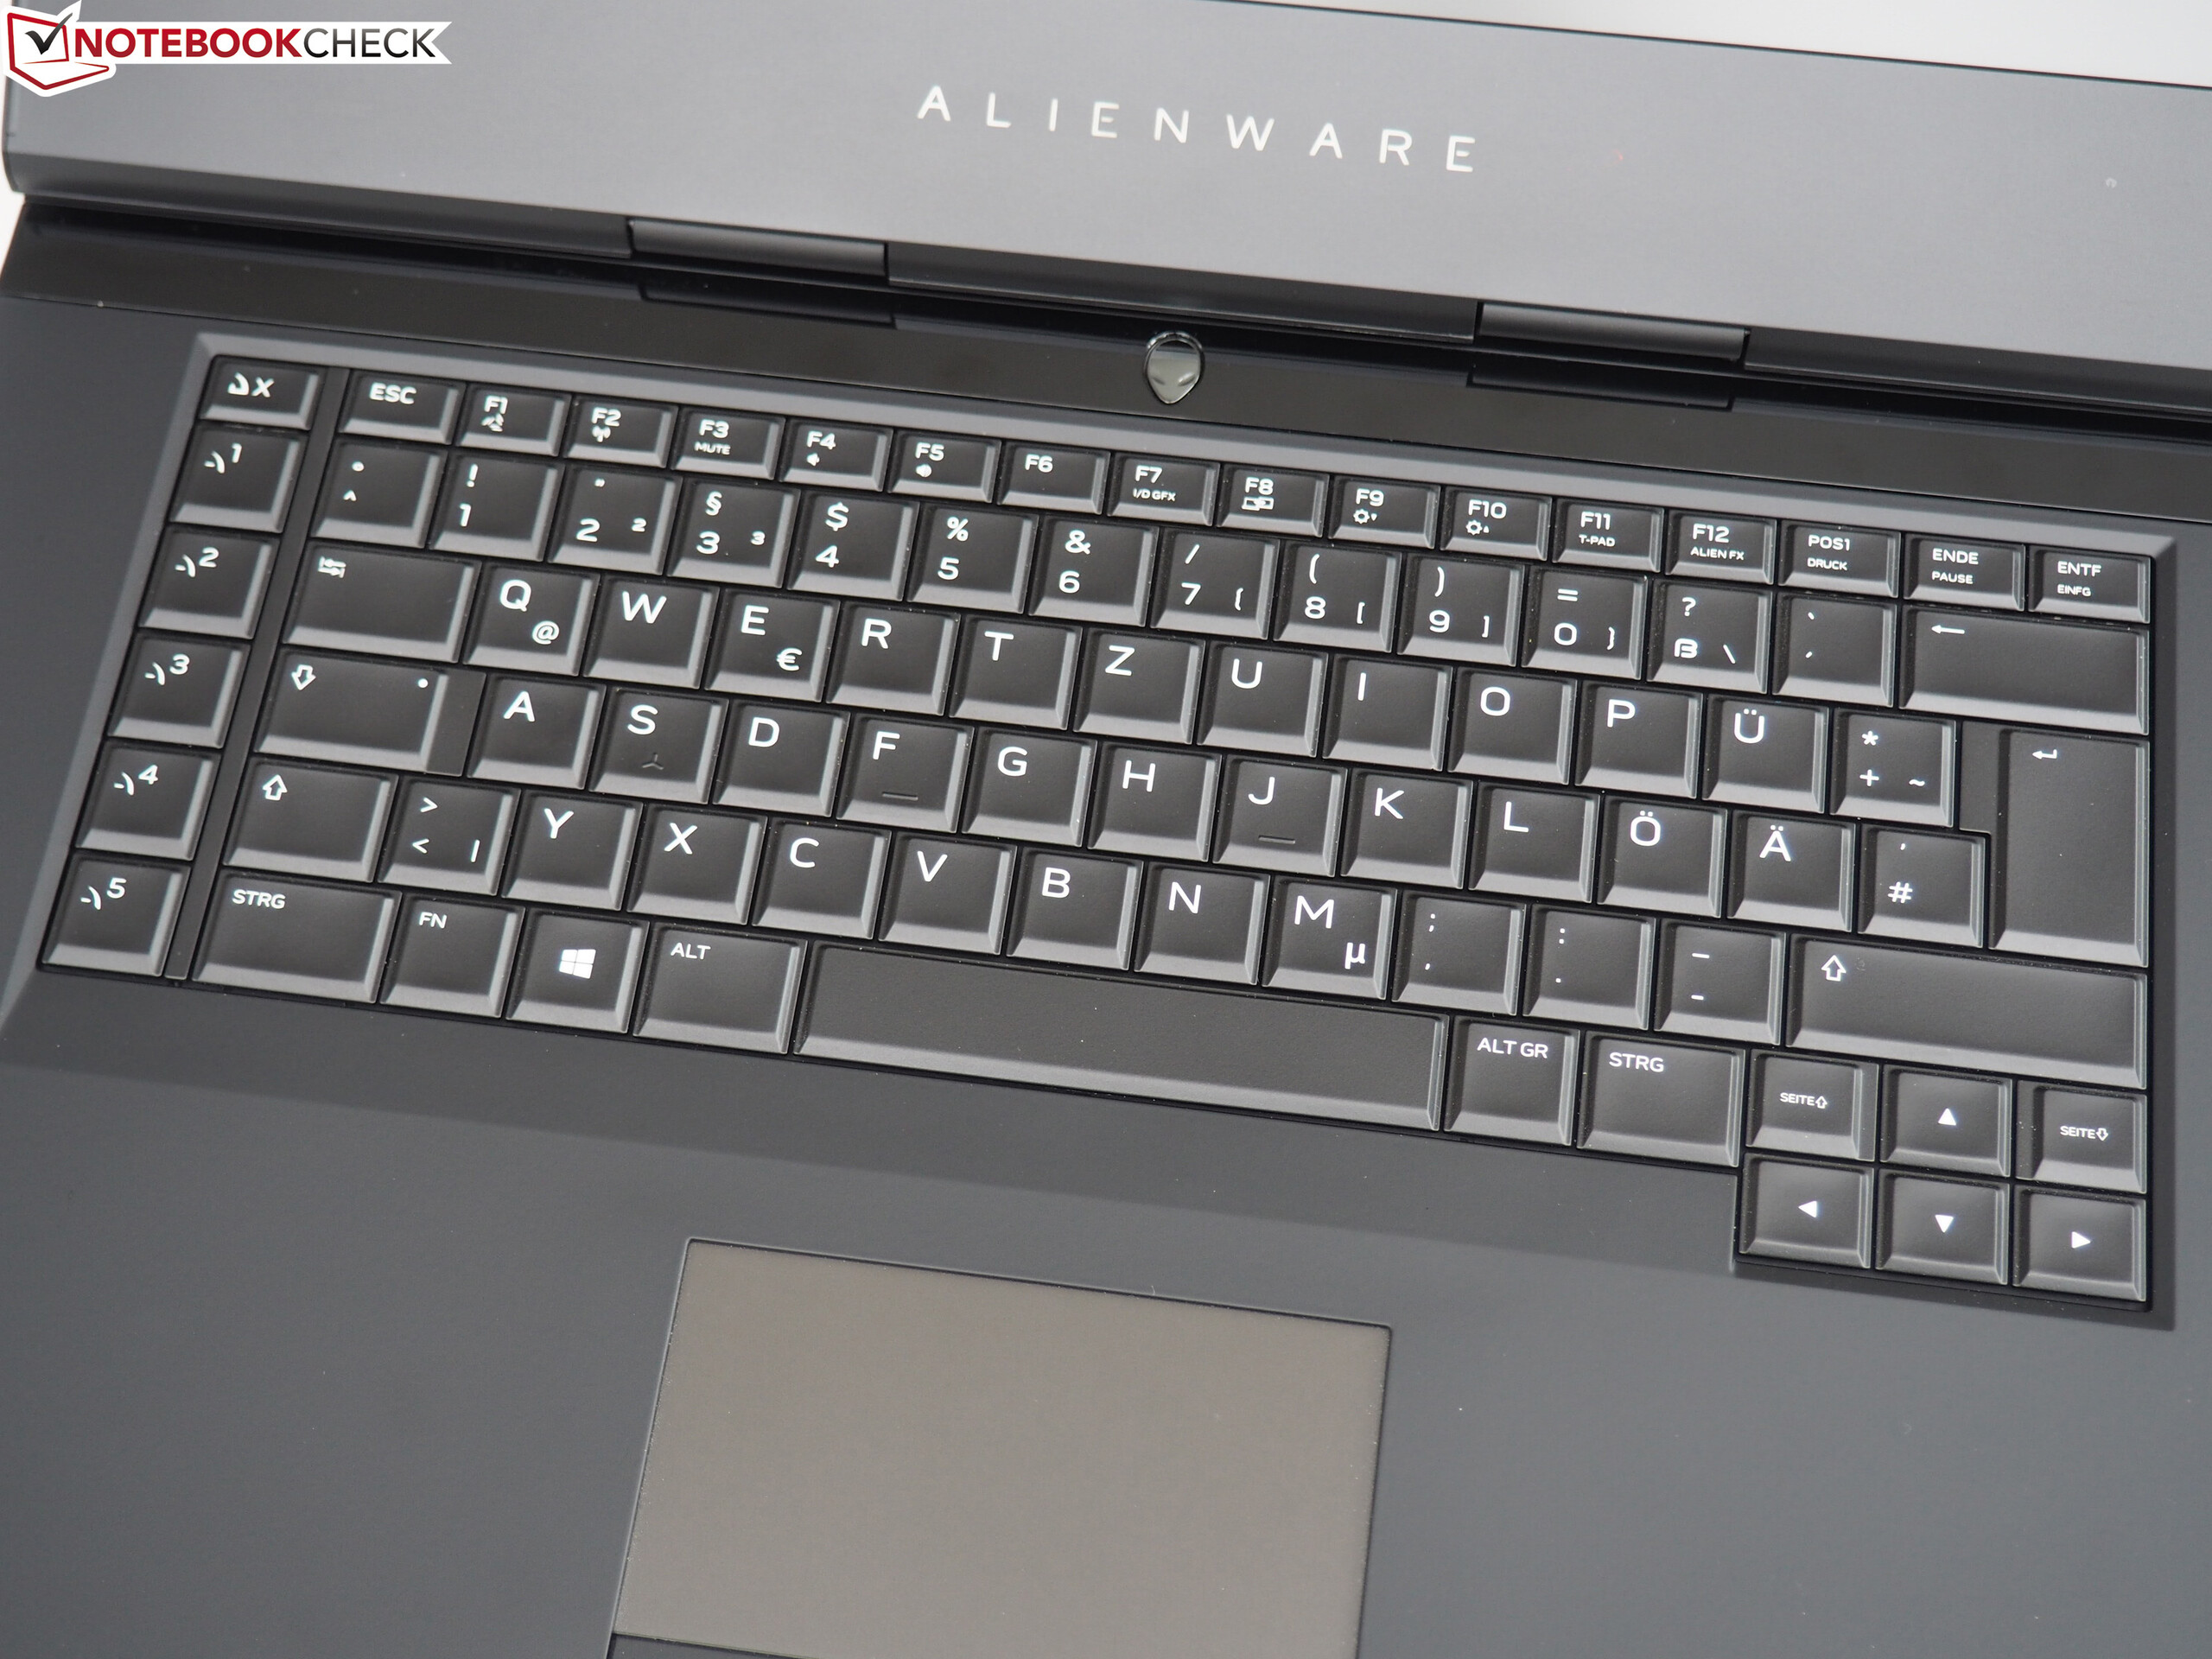
A Tela também oferece mudanças significativas em comparação com o modelo 15 R3 já testado. Enquanto o modelo irmão está equipado com um painel TN de 120 Hz, nossa unidade de teste atual oferece um painel IPS de 60 Hz. A tela mate de 15,6 polegadas tem ângulos de visão estáveis, uma boa relação de contraste e brilho suficiente. Somente o tempo de resposta é maior que o do painel TN.
O modelo Alienware 15 R3 que já testamos teve um grande problema com as temperaturas e o ruído do sistema, que estava relacionado com a CPU, que se aquece de forma irregular. Isso não ocorreu em nossa unidade de teste atual e os núcleos esquentaram uniformemente.
Alienware 15 R3 Max-Q
- 10/27/2017 v6 (old)
Sascha Mölck