Breve Análise do Portátil MSI GT75VR 7RF Titan Pro (i7-7820HK, GTX 1080)
| SD Card Reader | |
| average JPG Copy Test (av. of 3 runs) | |
| Asus G701VIK-BA049T (Toshiba Exceria Pro SDXC 64 GB UHS-II) | |
| MSI GT73VR 7RF-296 (Toshiba Exceria Pro SDXC 64 GB UHS-II) | |
| Schenker XMG U727 2017 (Toshiba Exceria Pro SDXC 64 GB UHS-II) | |
| MSI GT75VR 7RF-012 Titan Pro (Toshiba Exceria Pro SDXC 64 GB UHS-II) | |
| Acer Predator 17 X GX-792-76DL (Toshiba Exceria Pro SDXC 64 GB UHS-II) | |
| maximum AS SSD Seq Read Test (1GB) | |
| Asus G701VIK-BA049T (Toshiba Exceria Pro SDXC 64 GB UHS-II) | |
| MSI GT73VR 7RF-296 (Toshiba Exceria Pro SDXC 64 GB UHS-II) | |
| Schenker XMG U727 2017 (Toshiba Exceria Pro SDXC 64 GB UHS-II) | |
| Acer Predator 17 X GX-792-76DL (Toshiba Exceria Pro SDXC 64 GB UHS-II) | |
| MSI GT75VR 7RF-012 Titan Pro (Toshiba Exceria Pro SDXC 64 GB UHS-II) | |
| |||||||||||||||||||||||||
iluminação: 87 %
iluminação com acumulador: 274 cd/m²
Contraste: 1054:1 (Preto: 0.26 cd/m²)
ΔE ColorChecker Calman: 1.36 | ∀{0.5-29.43 Ø4.71}
ΔE Greyscale Calman: 0.64 | ∀{0.09-98 Ø4.96}
100% sRGB (Argyll 1.6.3 3D)
77% AdobeRGB 1998 (Argyll 1.6.3 3D)
86.8% AdobeRGB 1998 (Argyll 3D)
99.6% sRGB (Argyll 3D)
90.3% Display P3 (Argyll 3D)
Gamma: 2.19
CCT: 6551 K
| MSI GT75VR 7RF-012 Titan Pro CMN N173HHE-G32 (CMN1747), 1920x1080, 17.3" | MSI GT73VR 7RF-296 N173HHE-G32 (CMN1747), 1920x1080, 17.3" | Acer Predator 17 X GX-792-76DL LP173WF4-SPF5 (LGD056D), 1920x1080, 17.3" | Alienware 17 R4 2560x1440, 17.3" | Asus G701VIK-BA049T B173HAN01.1 (AUO119D), 1920x1080, 17.3" | Schenker XMG U727 2017 AU Optronics B173ZAN01.0 (AUO109B), 3840x2160, 17.3" | |
|---|---|---|---|---|---|---|
| Display | -1% | -24% | -26% | -21% | 4% | |
| Display P3 Coverage (%) | 90.3 | 90.6 0% | 66 -27% | 61.2 -32% | 68.8 -24% | 86.6 -4% |
| sRGB Coverage (%) | 99.6 | 99.9 0% | 83.7 -16% | 82.9 -17% | 87.7 -12% | 99.9 0% |
| AdobeRGB 1998 Coverage (%) | 86.8 | 84.7 -2% | 61.2 -29% | 60.5 -30% | 64.1 -26% | 99.5 15% |
| Response Times | -64% | -300% | -124% | -211% | -296% | |
| Response Time Grey 50% / Grey 80% * (ms) | 11.6 ? | 26 ? -124% | 45 ? -288% | 30 ? -159% | 38 ? -228% | 44 ? -279% |
| Response Time Black / White * (ms) | 6.8 ? | 7 ? -3% | 28 ? -312% | 12.8 ? -88% | 20 ? -194% | 28 ? -312% |
| PWM Frequency (Hz) | 25000 ? | |||||
| Screen | -235% | -83% | -122% | -82% | -40% | |
| Brightness middle (cd/m²) | 274 | 307 12% | 380 39% | 402.3 47% | 306 12% | 362 32% |
| Brightness (cd/m²) | 262 | 284 8% | 362 38% | 372 42% | 299 14% | 344 31% |
| Brightness Distribution (%) | 87 | 85 -2% | 91 5% | 86 -1% | 91 5% | 85 -2% |
| Black Level * (cd/m²) | 0.26 | 0.25 4% | 0.37 -42% | 0.62 -138% | 0.27 -4% | 0.35 -35% |
| Contrast (:1) | 1054 | 1228 17% | 1027 -3% | 649 -38% | 1133 7% | 1034 -2% |
| Colorchecker dE 2000 * | 1.36 | 9.65 -610% | 4.12 -203% | 5.6 -312% | 3.98 -193% | 2.46 -81% |
| Colorchecker dE 2000 max. * | 4.1 | 16.36 -299% | 8.19 -100% | 9.8 -139% | 7.29 -78% | 4.26 -4% |
| Greyscale dE 2000 * | 0.64 | 10.07 -1473% | 3.95 -517% | 4.7 -634% | 4.15 -548% | 2.9 -353% |
| Gamma | 2.19 100% | 2.12 104% | 2.47 89% | 2.14 103% | 2.45 90% | 2.31 95% |
| CCT | 6551 99% | 12145 54% | 6539 99% | 7519 86% | 7386 88% | 6120 106% |
| Color Space (Percent of AdobeRGB 1998) (%) | 77 | 75 -3% | 55 -29% | 53.7 -30% | 58 -25% | 88 14% |
| Color Space (Percent of sRGB) (%) | 100 | 100 0% | 84 -16% | 82.2 -18% | 89 -11% | 100 0% |
| Média Total (Programa/Configurações) | -100% /
-165% | -136% /
-100% | -91% /
-103% | -105% /
-87% | -111% /
-65% |
* ... menor é melhor
Exibir tempos de resposta
| ↔ Tempo de resposta preto para branco | ||
|---|---|---|
| 6.8 ms ... ascensão ↗ e queda ↘ combinadas | ↗ 4.8 ms ascensão | 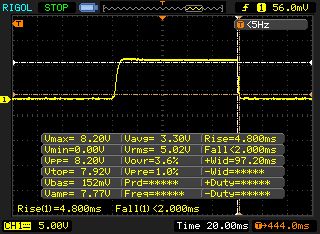 |
| ↘ 2 ms queda | ||
| A tela mostra taxas de resposta muito rápidas em nossos testes e deve ser muito adequada para jogos em ritmo acelerado. Em comparação, todos os dispositivos testados variam de 0.1 (mínimo) a 240 (máximo) ms. » 21 % de todos os dispositivos são melhores. Isso significa que o tempo de resposta medido é melhor que a média de todos os dispositivos testados (19.8 ms). | ||
| ↔ Tempo de resposta 50% cinza a 80% cinza | ||
| 11.6 ms ... ascensão ↗ e queda ↘ combinadas | ↗ 6.4 ms ascensão | 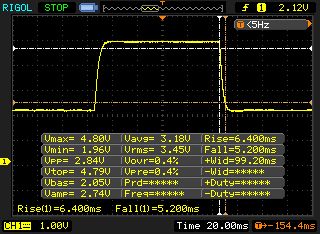 |
| ↘ 5.2 ms queda | ||
| A tela mostra boas taxas de resposta em nossos testes, mas pode ser muito lenta para jogadores competitivos. Em comparação, todos os dispositivos testados variam de 0.165 (mínimo) a 636 (máximo) ms. » 25 % de todos os dispositivos são melhores. Isso significa que o tempo de resposta medido é melhor que a média de todos os dispositivos testados (31 ms). | ||
Cintilação da tela / PWM (modulação por largura de pulso)
| Tela tremeluzindo/PWM detectado | 25000 Hz | ≤ 15 % configuração de brilho | 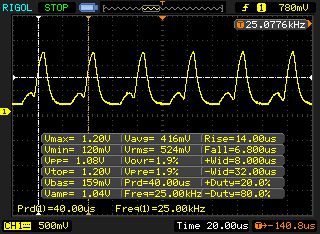 |
A luz de fundo da tela pisca em 25000 Hz (pior caso, por exemplo, utilizando PWM) Cintilação detectada em uma configuração de brilho de 15 % e abaixo. Não deve haver cintilação ou PWM acima desta configuração de brilho. A frequência de 25000 Hz é bastante alta, então a maioria dos usuários sensíveis ao PWM não deve notar nenhuma oscilação. [pwm_comparison] Em comparação: 52 % de todos os dispositivos testados não usam PWM para escurecer a tela. Se PWM foi detectado, uma média de 7754 (mínimo: 5 - máximo: 343500) Hz foi medida. | |||
| PCMark 8 | |
| Home Score Accelerated v2 | |
| Acer Predator 17 X GX-792-76DL | |
| Asus G701VIK-BA049T | |
| MSI GT75VR 7RF-012 Titan Pro | |
| Alienware 17 R4 | |
| Schenker XMG U727 2017 | |
| Work Score Accelerated v2 | |
| Acer Predator 17 X GX-792-76DL | |
| Asus G701VIK-BA049T | |
| MSI GT75VR 7RF-012 Titan Pro | |
| Alienware 17 R4 | |
| Schenker XMG U727 2017 | |
| PCMark 10 - Score | |
| MSI GT75VR 7RF-012 Titan Pro | |
| PCMark 8 Home Score Accelerated v2 | 5237 pontos | |
| PCMark 8 Work Score Accelerated v2 | 5444 pontos | |
| PCMark 10 Score | 5211 pontos | |
Ajuda | ||
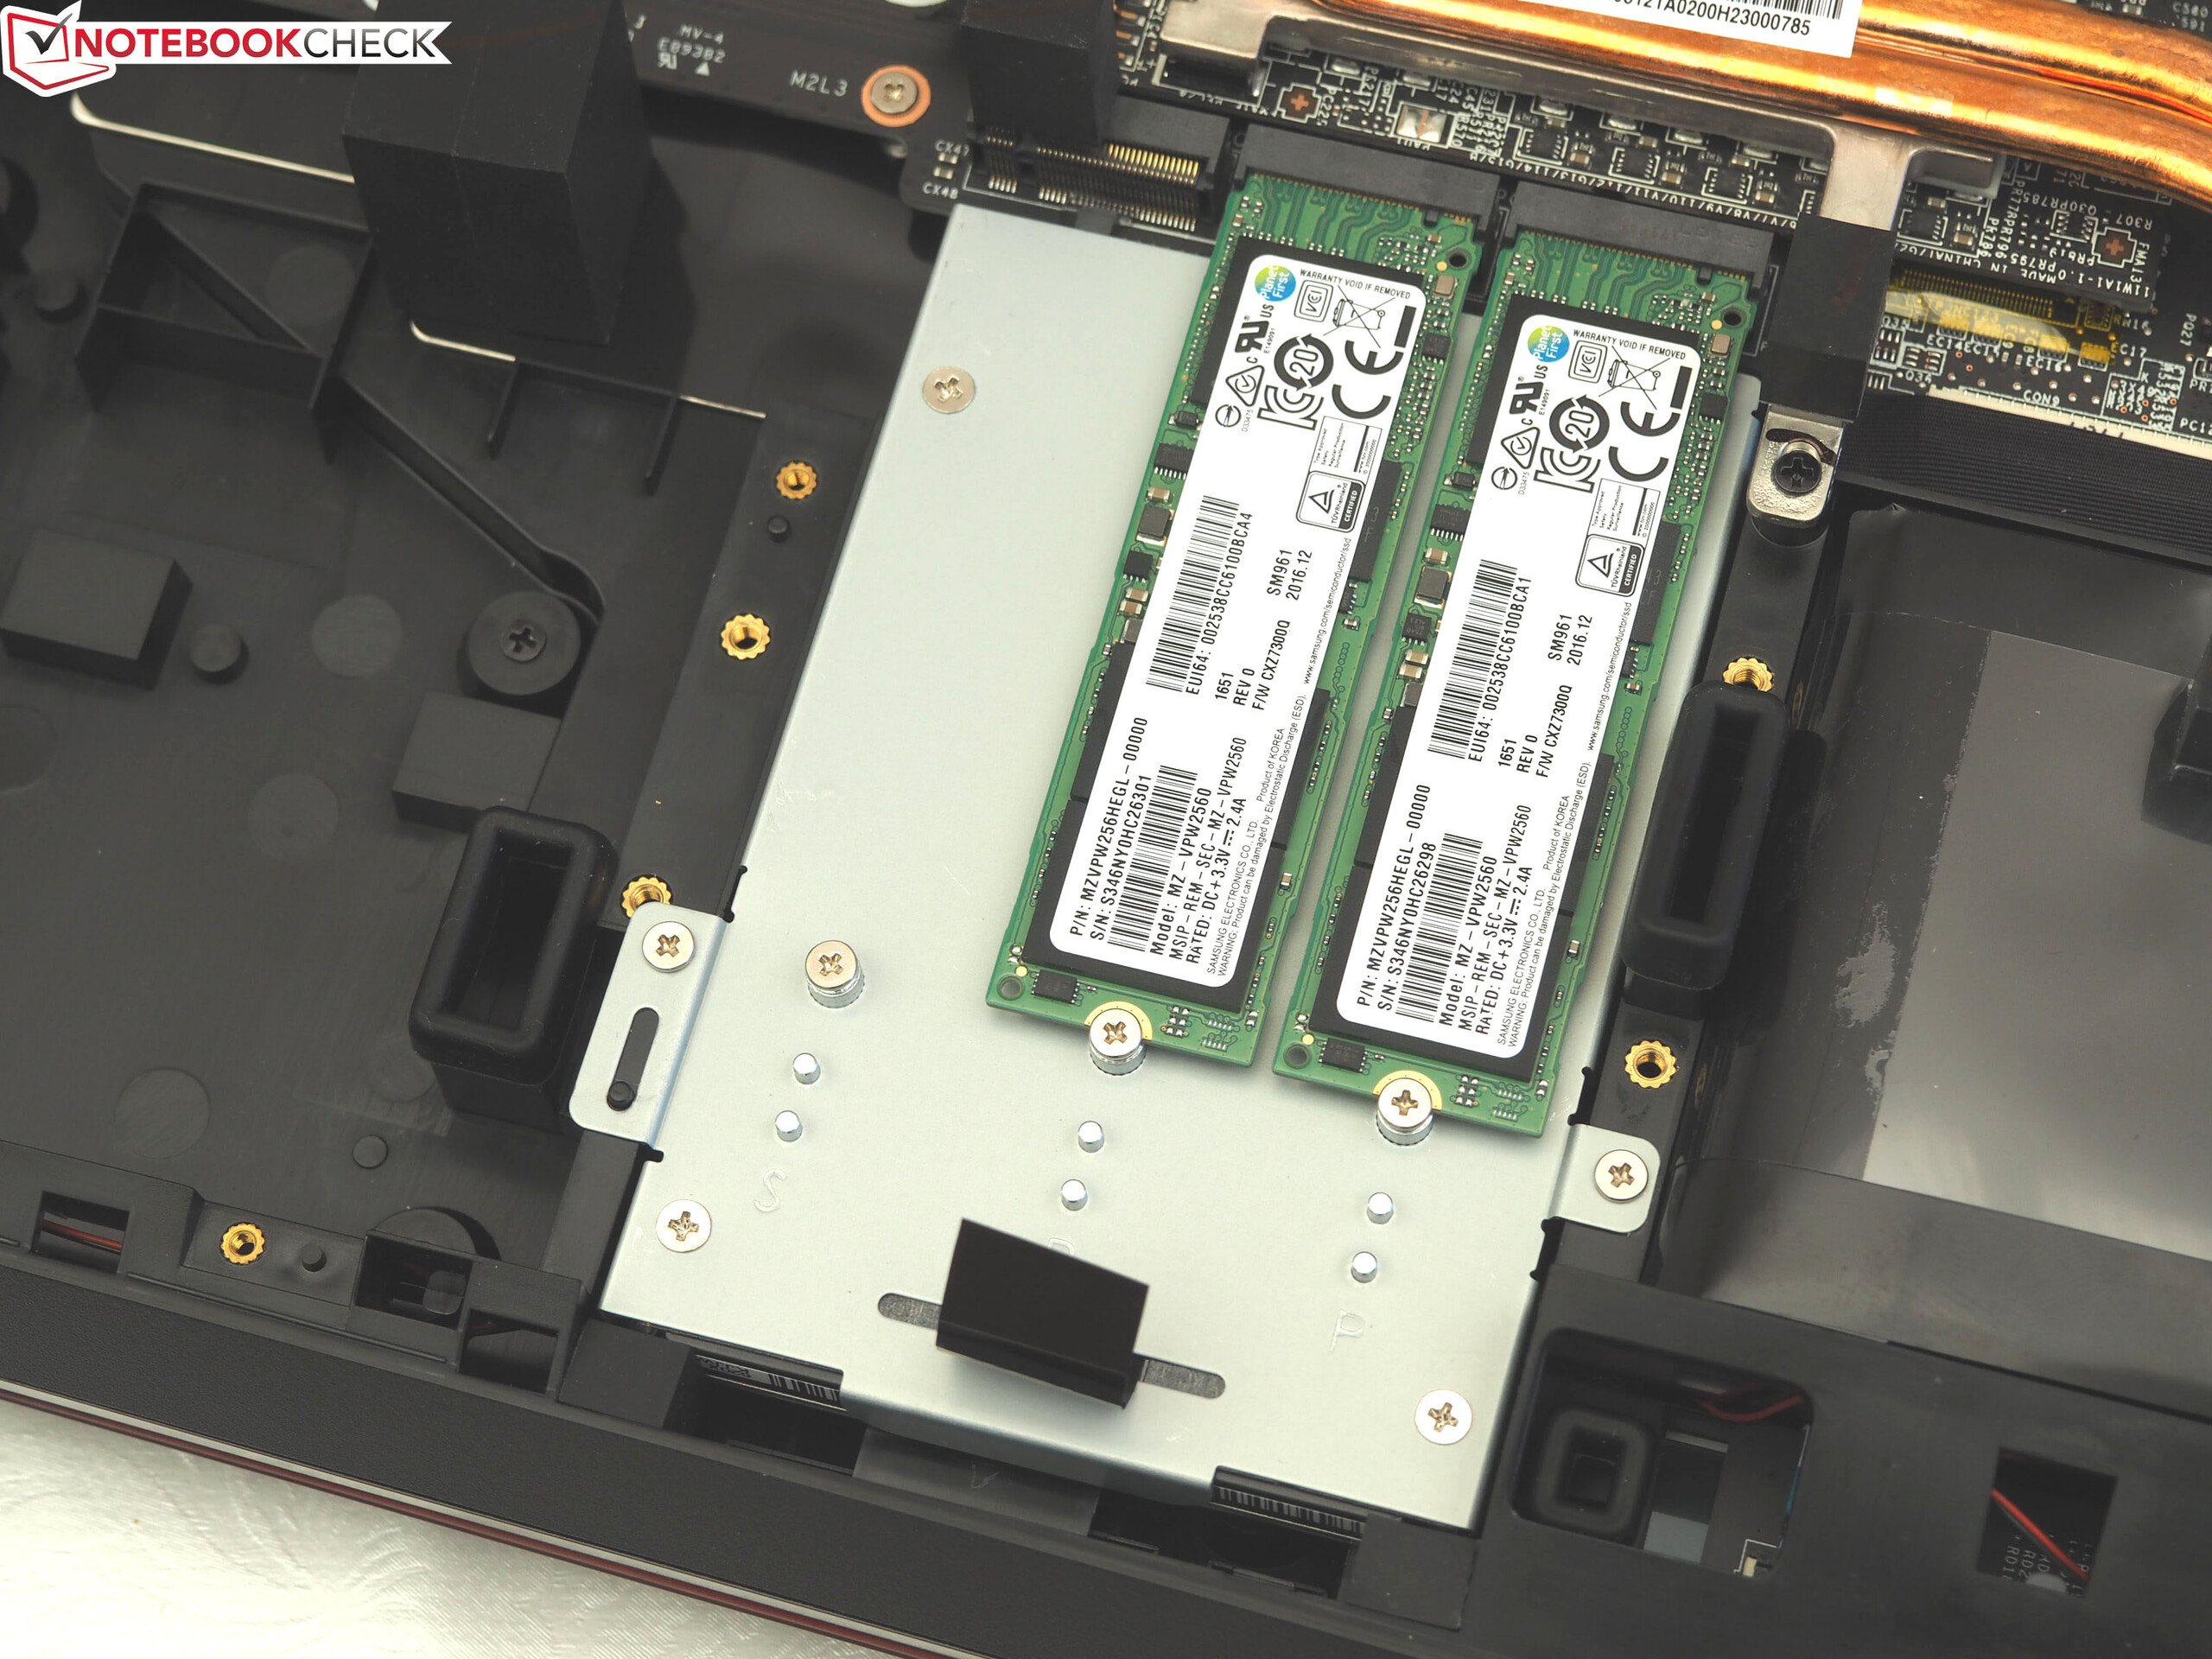
| MSI GT75VR 7RF-012 Titan Pro 2x Samsung SM961 MZVPW256HEGL NVMe (RAID 0) | MSI GT73VR 7RF-296 2x Samsung SM951 MZVPV256HDGL (RAID 0) | Acer Predator 17 X GX-792-76DL Toshiba NVMe THNSN5512GPU7 | Alienware 17 R4 SK Hynix PC300 NVMe 512 GB | Asus G701VIK-BA049T 2x Samsung SM961 MZVPW256HEGL NVMe (RAID 0) | Schenker XMG U727 2017 Samsung SM961 MZVPW256 m.2 PCI-e | |
|---|---|---|---|---|---|---|
| AS SSD | -4% | -23% | -38% | 9% | 6% | |
| Seq Read (MB/s) | 3137 | 2988 -5% | 2261 -28% | 1752 -44% | 3247 4% | 2746 -12% |
| Seq Write (MB/s) | 2352 | 2332 -1% | 1338 -43% | 735 -69% | 2520 7% | 1445 -39% |
| 4K Read (MB/s) | 50.1 | 46.75 -7% | 39.52 -21% | 35.61 -29% | 51 2% | 56.8 13% |
| 4K Write (MB/s) | 128.8 | 123.8 -4% | 133.8 4% | 113.4 -12% | 120.9 -6% | 175.9 37% |
| Score Read (Points) | 1412 | 1511 7% | 1118 -21% | 831 -41% | 1760 25% | 1858 32% |
| Score Write (Points) | 1289 | 1054 -18% | 930 -28% | 858 -33% | 1458 13% | 1187 -8% |
| Score Total (Points) | 3392 | 3310 -2% | 2581 -24% | 2072 -39% | 4088 21% | 3938 16% |

| 3DMark - 1920x1080 Fire Strike Graphics | |
| Asus G701VIK-BA049T | |
| Acer Predator 17 X GX-792-76DL | |
| Alienware 17 R4 | |
| Schenker XMG U727 2017 | |
| MSI GT75VR 7RF-012 Titan Pro | |
| MSI GT73VR 7RF-296 | |
| 3DMark 11 - 1280x720 Performance GPU | |
| Asus G701VIK-BA049T | |
| Schenker XMG U727 2017 | |
| MSI GT75VR 7RF-012 Titan Pro | |
| MSI GT73VR 7RF-296 | |
| Acer Predator 17 X GX-792-76DL | |
| Alienware 17 R4 | |
| Unigine Heaven 4.0 - Extreme Preset DX11 | |
| Asus G701VIK-BA049T | |
| Schenker XMG U727 2017 | |
| MSI GT75VR 7RF-012 Titan Pro | |
| MSI GT73VR 7RF-296 | |
| 3DMark 11 Performance | 19621 pontos | |
| 3DMark Ice Storm Standard Score | 155671 pontos | |
| 3DMark Cloud Gate Standard Score | 29451 pontos | |
| 3DMark Fire Strike Score | 15851 pontos | |
| 3DMark Time Spy Score | 6563 pontos | |
Ajuda | ||
| baixo | média | alto | ultra | 4K | |
|---|---|---|---|---|---|
| The Witcher 3 (2015) | 144 | 75.9 | 52.2 | ||
| Ghost Recon Wildlands (2017) | 99.7 | 61.4 | 41.4 | ||
| Prey (2017) | 139 | 136 | 68.3 | ||
| Rocket League (2017) | 240 | 110 | |||
| Dirt 4 (2017) | 178 | 105 | |||
| Playerunknown's Battlegrounds (PUBG) (2017) | 115 | 90.1 | 32.8 |
Barulho
| Ocioso |
| 33 / 34 / 38 dB |
| Carga |
| 44 / 62 dB |
 | ||
30 dB silencioso 40 dB(A) audível 50 dB(A) ruidosamente alto |
||
min: | ||
| MSI GT75VR 7RF-012 Titan Pro i7-7820HK, GeForce GTX 1080 Mobile | MSI GT73VR 7RF-296 i7-7820HK, GeForce GTX 1080 Mobile | Acer Predator 17 X GX-792-76DL i7-7820HK, GeForce GTX 1080 Mobile | Alienware 17 R4 i7-7820HK, GeForce GTX 1080 Mobile | Asus G701VIK-BA049T i7-7820HK, GeForce GTX 1080 Mobile | Schenker XMG U727 2017 i7-7700K, GeForce GTX 1080 Mobile | |
|---|---|---|---|---|---|---|
| Noise | 3% | 5% | 2% | 4% | 5% | |
| desligado / ambiente * (dB) | 30 | 30 -0% | 30 -0% | 28.2 6% | 30 -0% | 30 -0% |
| Idle Minimum * (dB) | 33 | 34 -3% | 33 -0% | 35.6 -8% | 30 9% | 31 6% |
| Idle Average * (dB) | 34 | 35 -3% | 35 -3% | 35.6 -5% | 31 9% | 34 -0% |
| Idle Maximum * (dB) | 38 | 37 3% | 37 3% | 35.7 6% | 36 5% | 37 3% |
| Load Average * (dB) | 44 | 39 11% | 40 9% | 50.2 -14% | 47 -7% | 44 -0% |
| Witcher 3 ultra * (dB) | 56 | 50.2 10% | 51 9% | |||
| Load Maximum * (dB) | 62 | 56 10% | 50 19% | 50.2 19% | 56 10% | 52 16% |
* ... menor é melhor
(-) A temperatura máxima no lado superior é 46 °C / 115 F, em comparação com a média de 40.4 °C / 105 F , variando de 21.2 a 68.8 °C para a classe Gaming.
(-) A parte inferior aquece até um máximo de 57 °C / 135 F, em comparação com a média de 43.2 °C / 110 F
(+) Em uso inativo, a temperatura média para o lado superior é 31.7 °C / 89 F, em comparação com a média do dispositivo de 33.9 °C / ### class_avg_f### F.
(±) Jogando The Witcher 3, a temperatura média para o lado superior é 37.8 °C / 100 F, em comparação com a média do dispositivo de 33.9 °C / ## #class_avg_f### F.
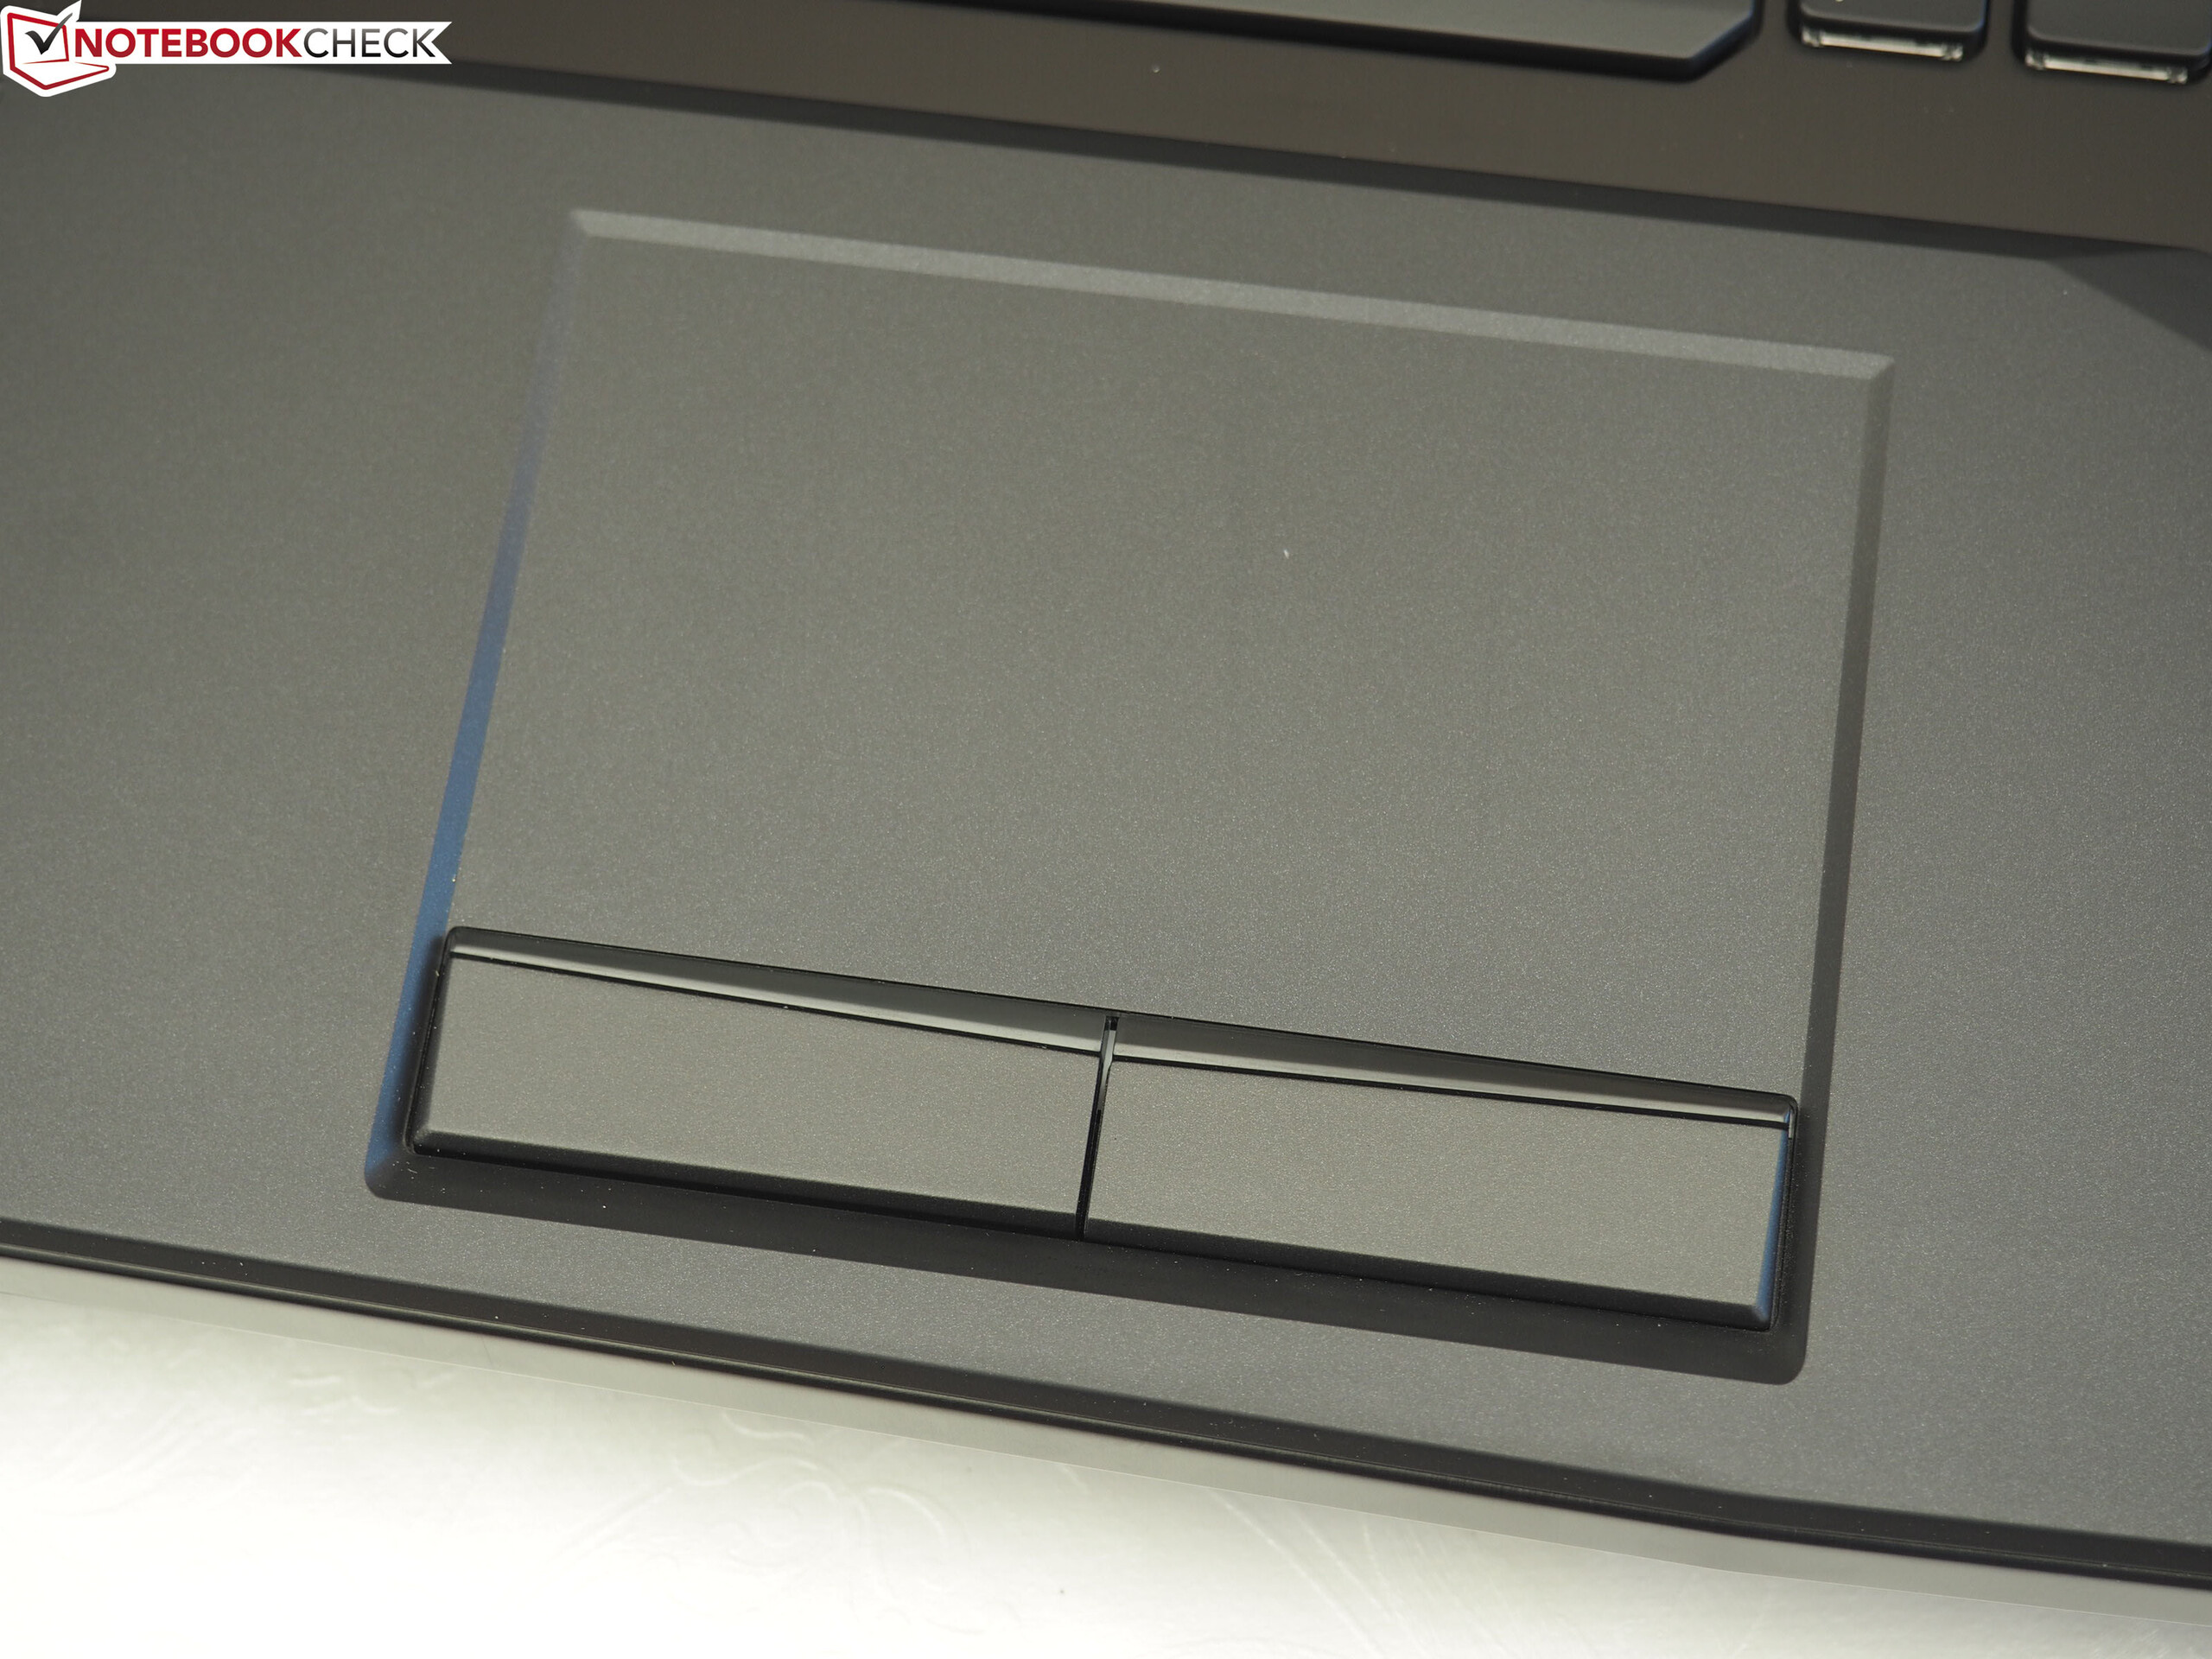
(+) Os apoios para as mãos e o touchpad estão atingindo a temperatura máxima da pele (32 °C / 89.6 F) e, portanto, não estão quentes.
(-) A temperatura média da área do apoio para as mãos de dispositivos semelhantes foi 28.8 °C / 83.8 F (-3.2 °C / -5.8 F).
| MSI GT75VR 7RF-012 Titan Pro i7-7820HK, GeForce GTX 1080 Mobile | MSI GT73VR 7RF-296 i7-7820HK, GeForce GTX 1080 Mobile | Acer Predator 17 X GX-792-76DL i7-7820HK, GeForce GTX 1080 Mobile | Alienware 17 R4 i7-7820HK, GeForce GTX 1080 Mobile | Asus G701VIK-BA049T i7-7820HK, GeForce GTX 1080 Mobile | Schenker XMG U727 2017 i7-7700K, GeForce GTX 1080 Mobile | |
|---|---|---|---|---|---|---|
| Heat | 18% | 10% | 6% | 10% | 1% | |
| Maximum Upper Side * (°C) | 46 | 39.8 13% | 44.2 4% | 49.6 -8% | 50.9 -11% | 47.5 -3% |
| Maximum Bottom * (°C) | 57 | 47.8 16% | 43 25% | 56 2% | 44.6 22% | 56 2% |
| Idle Upper Side * (°C) | 34 | 27.1 20% | 32.4 5% | 29.6 13% | 29.9 12% | 34.5 -1% |
| Idle Bottom * (°C) | 35 | 27.4 22% | 32.8 6% | 29.2 17% | 28.8 18% | 33.6 4% |
* ... menor é melhor
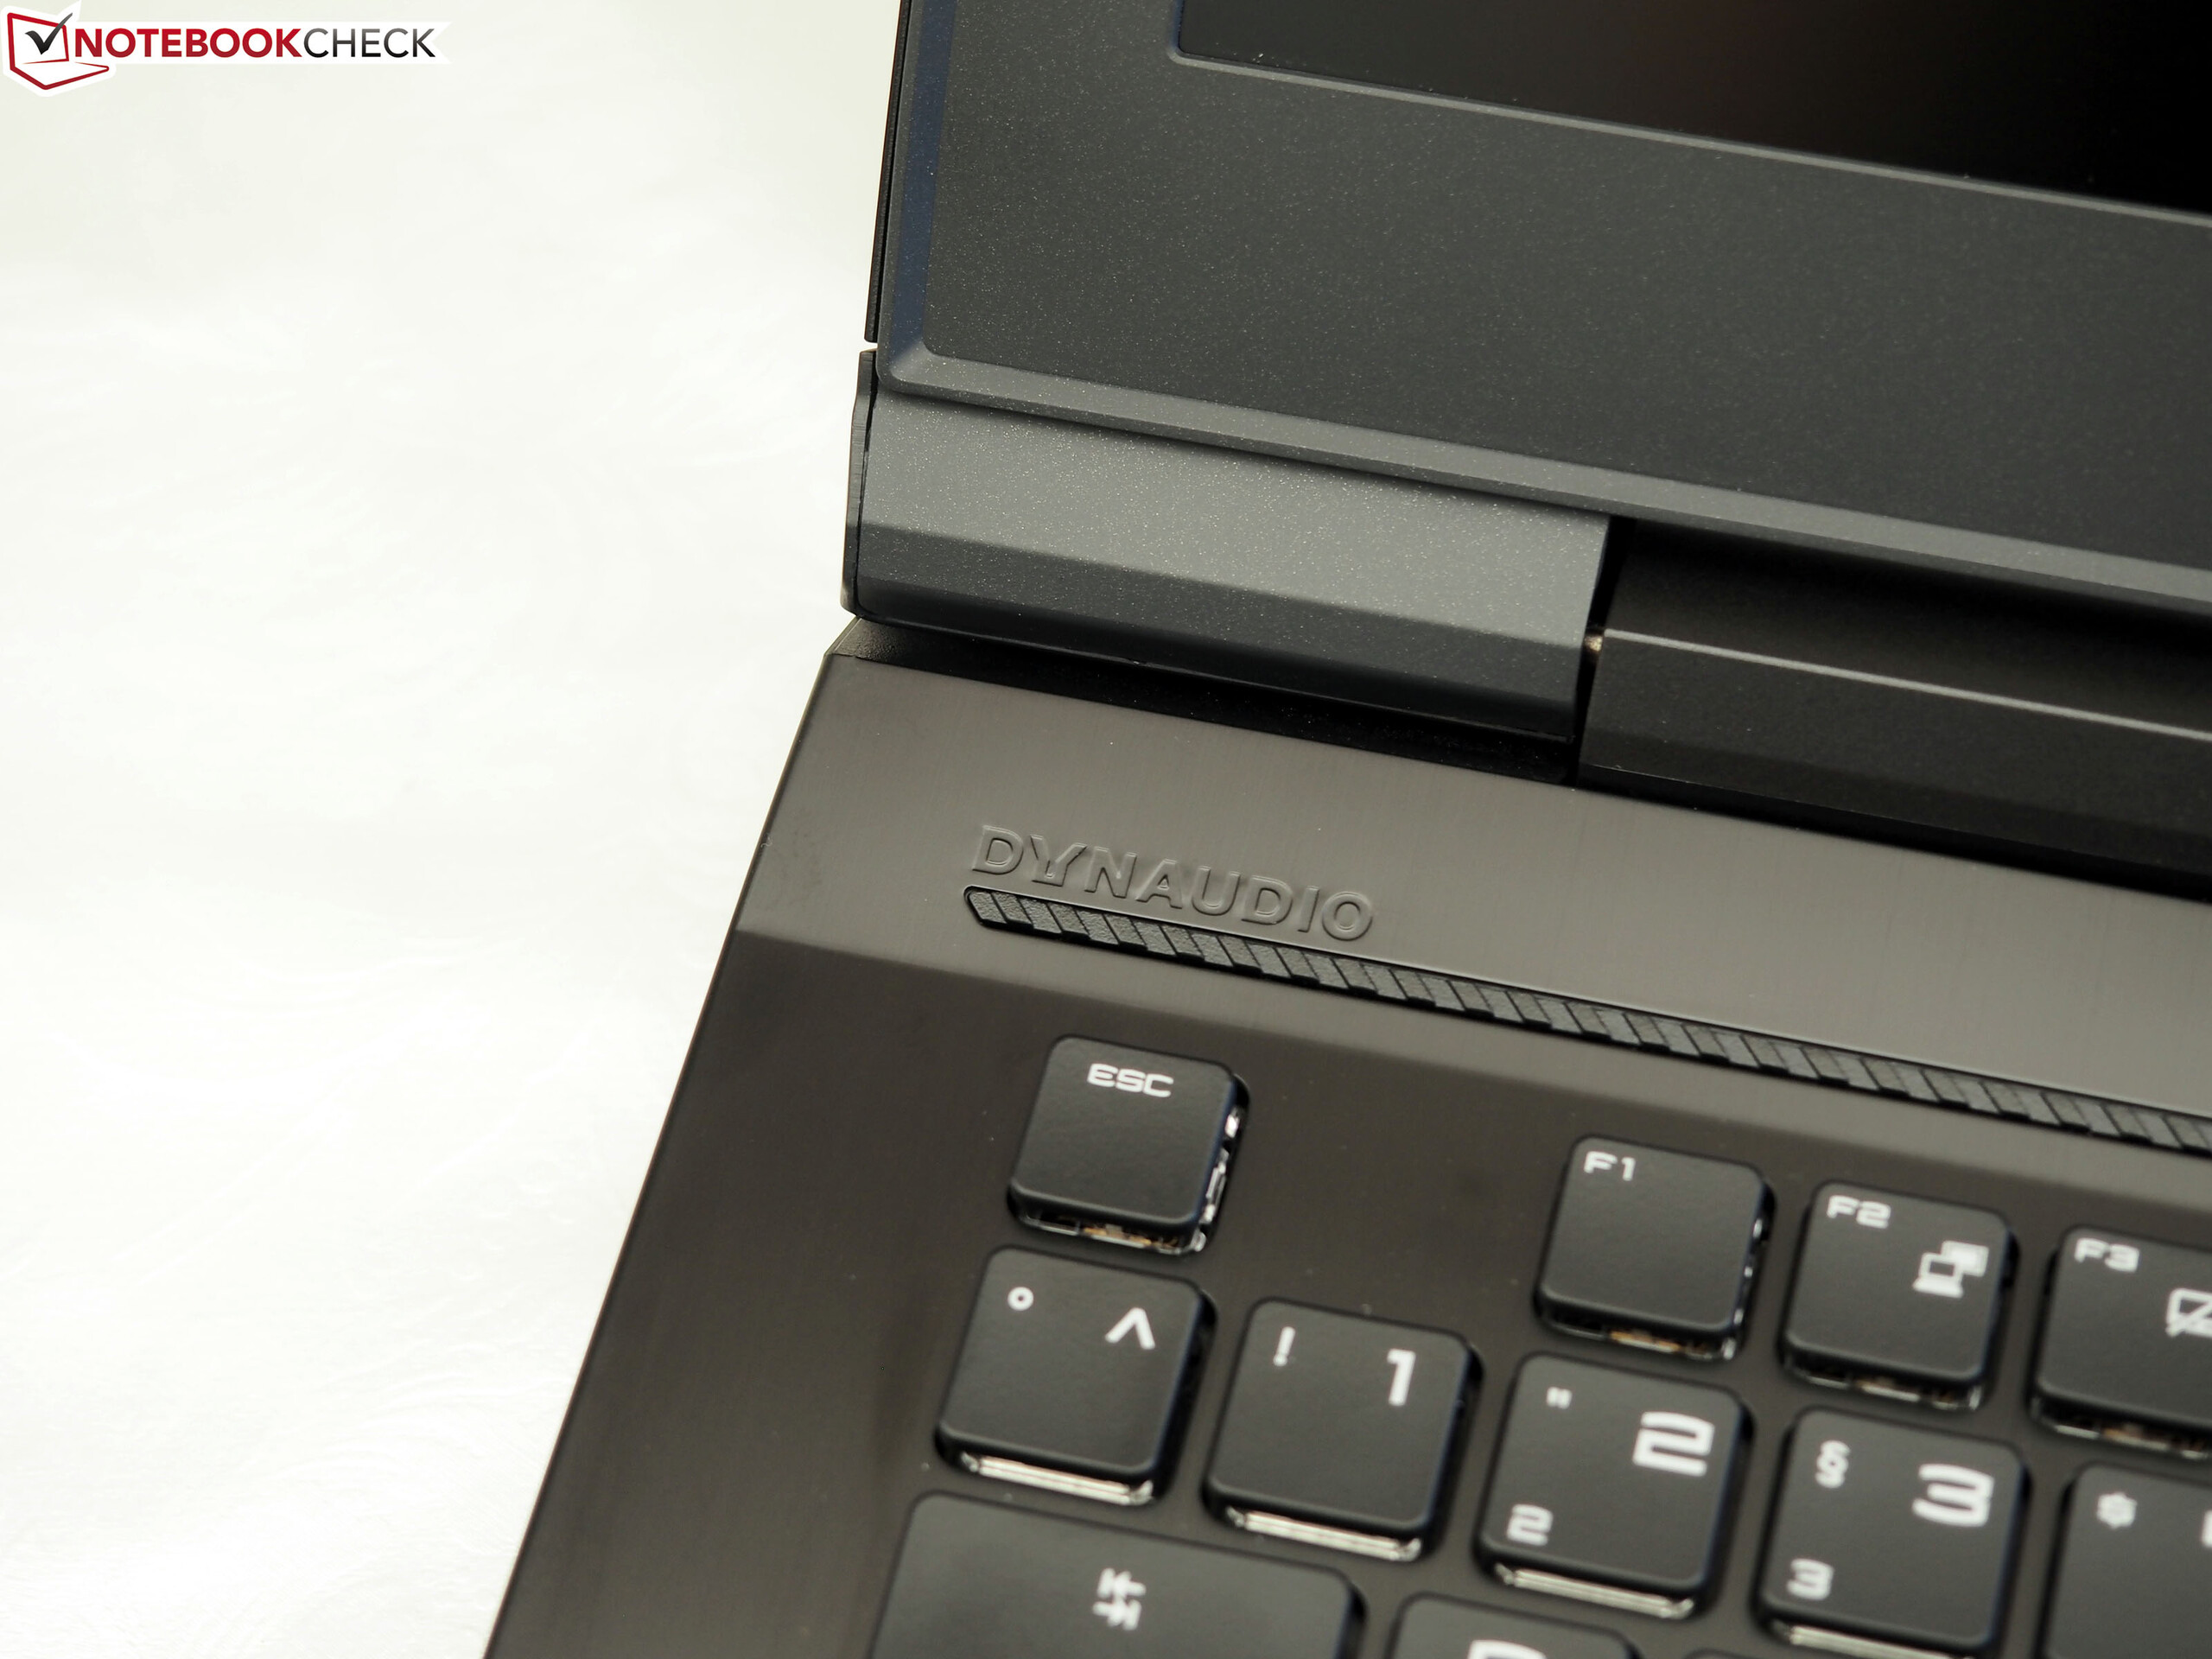
MSI GT75VR 7RF-012 Titan Pro análise de áudio
(+) | os alto-falantes podem tocar relativamente alto (###valor### dB)
Graves 100 - 315Hz
(±) | graves reduzidos - em média 8.7% menor que a mediana
(+) | o baixo é linear (4.9% delta para a frequência anterior)
Médios 400 - 2.000 Hz
(+) | médios equilibrados - apenas 3.6% longe da mediana
(+) | médios são lineares (4% delta para frequência anterior)
Altos 2 - 16 kHz
(±) | máximos mais altos - em média 6% maior que a mediana
(+) | os máximos são lineares (3.4% delta da frequência anterior)
Geral 100 - 16.000 Hz
(+) | o som geral é linear (13.4% diferença em relação à mediana)
Comparado com a mesma classe
» 19% de todos os dispositivos testados nesta classe foram melhores, 7% semelhantes, 74% piores
» O melhor teve um delta de 6%, a média foi 18%, o pior foi 132%
Comparado com todos os dispositivos testados
» 14% de todos os dispositivos testados foram melhores, 4% semelhantes, 82% piores
» O melhor teve um delta de 4%, a média foi 23%, o pior foi 134%
MSI GT73VR 7RF-296 análise de áudio
(+) | os alto-falantes podem tocar relativamente alto (###valor### dB)
Graves 100 - 315Hz
(±) | graves reduzidos - em média 11.7% menor que a mediana
(±) | a linearidade dos graves é média (9% delta para a frequência anterior)
Médios 400 - 2.000 Hz
(+) | médios equilibrados - apenas 3% longe da mediana
(+) | médios são lineares (3.6% delta para frequência anterior)
Altos 2 - 16 kHz
(+) | agudos equilibrados - apenas 4% longe da mediana
(+) | os máximos são lineares (3.5% delta da frequência anterior)
Geral 100 - 16.000 Hz
(+) | o som geral é linear (13.6% diferença em relação à mediana)
Comparado com a mesma classe
» 20% de todos os dispositivos testados nesta classe foram melhores, 7% semelhantes, 73% piores
» O melhor teve um delta de 6%, a média foi 18%, o pior foi 132%
Comparado com todos os dispositivos testados
» 15% de todos os dispositivos testados foram melhores, 4% semelhantes, 82% piores
» O melhor teve um delta de 4%, a média foi 23%, o pior foi 134%
| desligado | |
| Ocioso | |
| Carga |
|
Key:
min: | |
| MSI GT75VR 7RF-012 Titan Pro i7-7820HK, GeForce GTX 1080 Mobile | MSI GT73VR 7RF-296 i7-7820HK, GeForce GTX 1080 Mobile | Acer Predator 17 X GX-792-76DL i7-7820HK, GeForce GTX 1080 Mobile | Alienware 17 R4 i7-7820HK, GeForce GTX 1080 Mobile | Asus G701VIK-BA049T i7-7820HK, GeForce GTX 1080 Mobile | Schenker XMG U727 2017 i7-7700K, GeForce GTX 1080 Mobile | |
|---|---|---|---|---|---|---|
| Power Consumption | 13% | 17% | 9% | 17% | -8% | |
| Idle Minimum * (Watt) | 34 | 29 15% | 27 21% | 37.5 -10% | 24 29% | 32 6% |
| Idle Average * (Watt) | 41 | 35 15% | 32 22% | 37.6 8% | 31 24% | 43 -5% |
| Idle Maximum * (Watt) | 50 | 40 20% | 41 18% | 37.6 25% | 38 24% | 51 -2% |
| Load Average * (Watt) | 106 | 94 11% | 102 4% | 122.4 -15% | 98 8% | 138 -30% |
| Witcher 3 ultra * (Watt) | 257 | 180.3 30% | 279 -9% | |||
| Load Maximum * (Watt) | 320 | 315 2% | 248 22% | 277.4 13% | 320 -0% | 350 -9% |
* ... menor é melhor
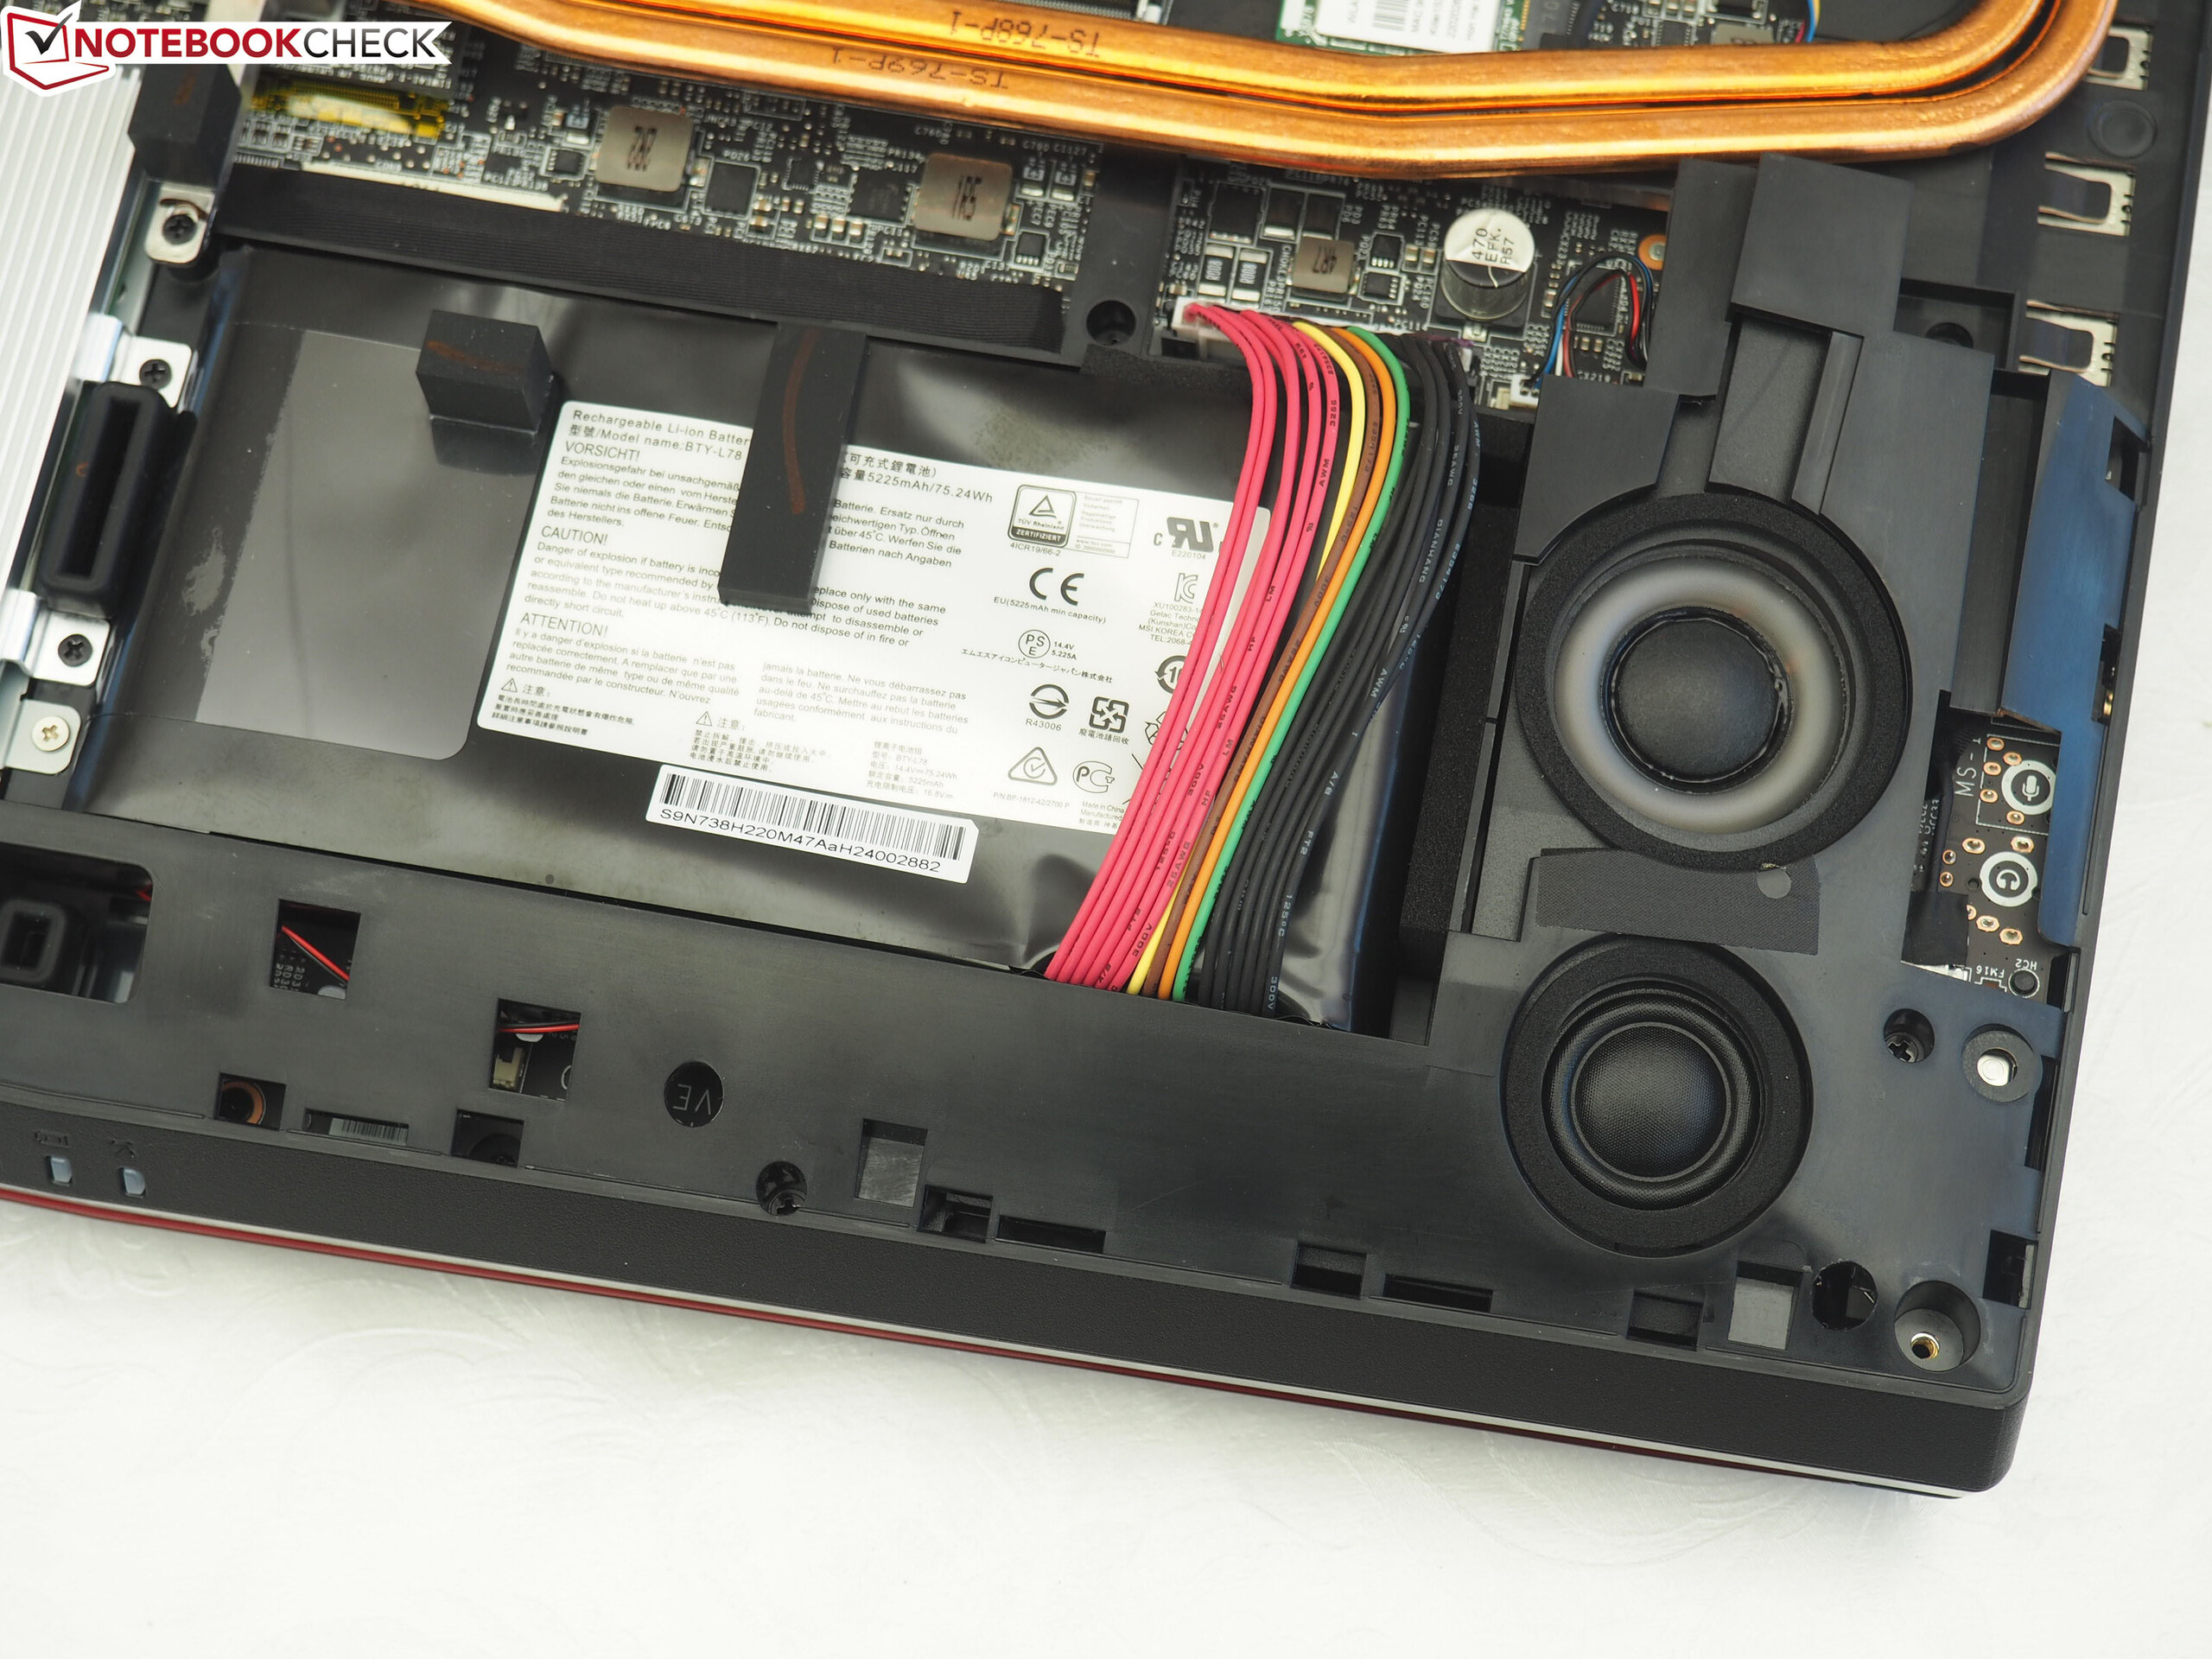
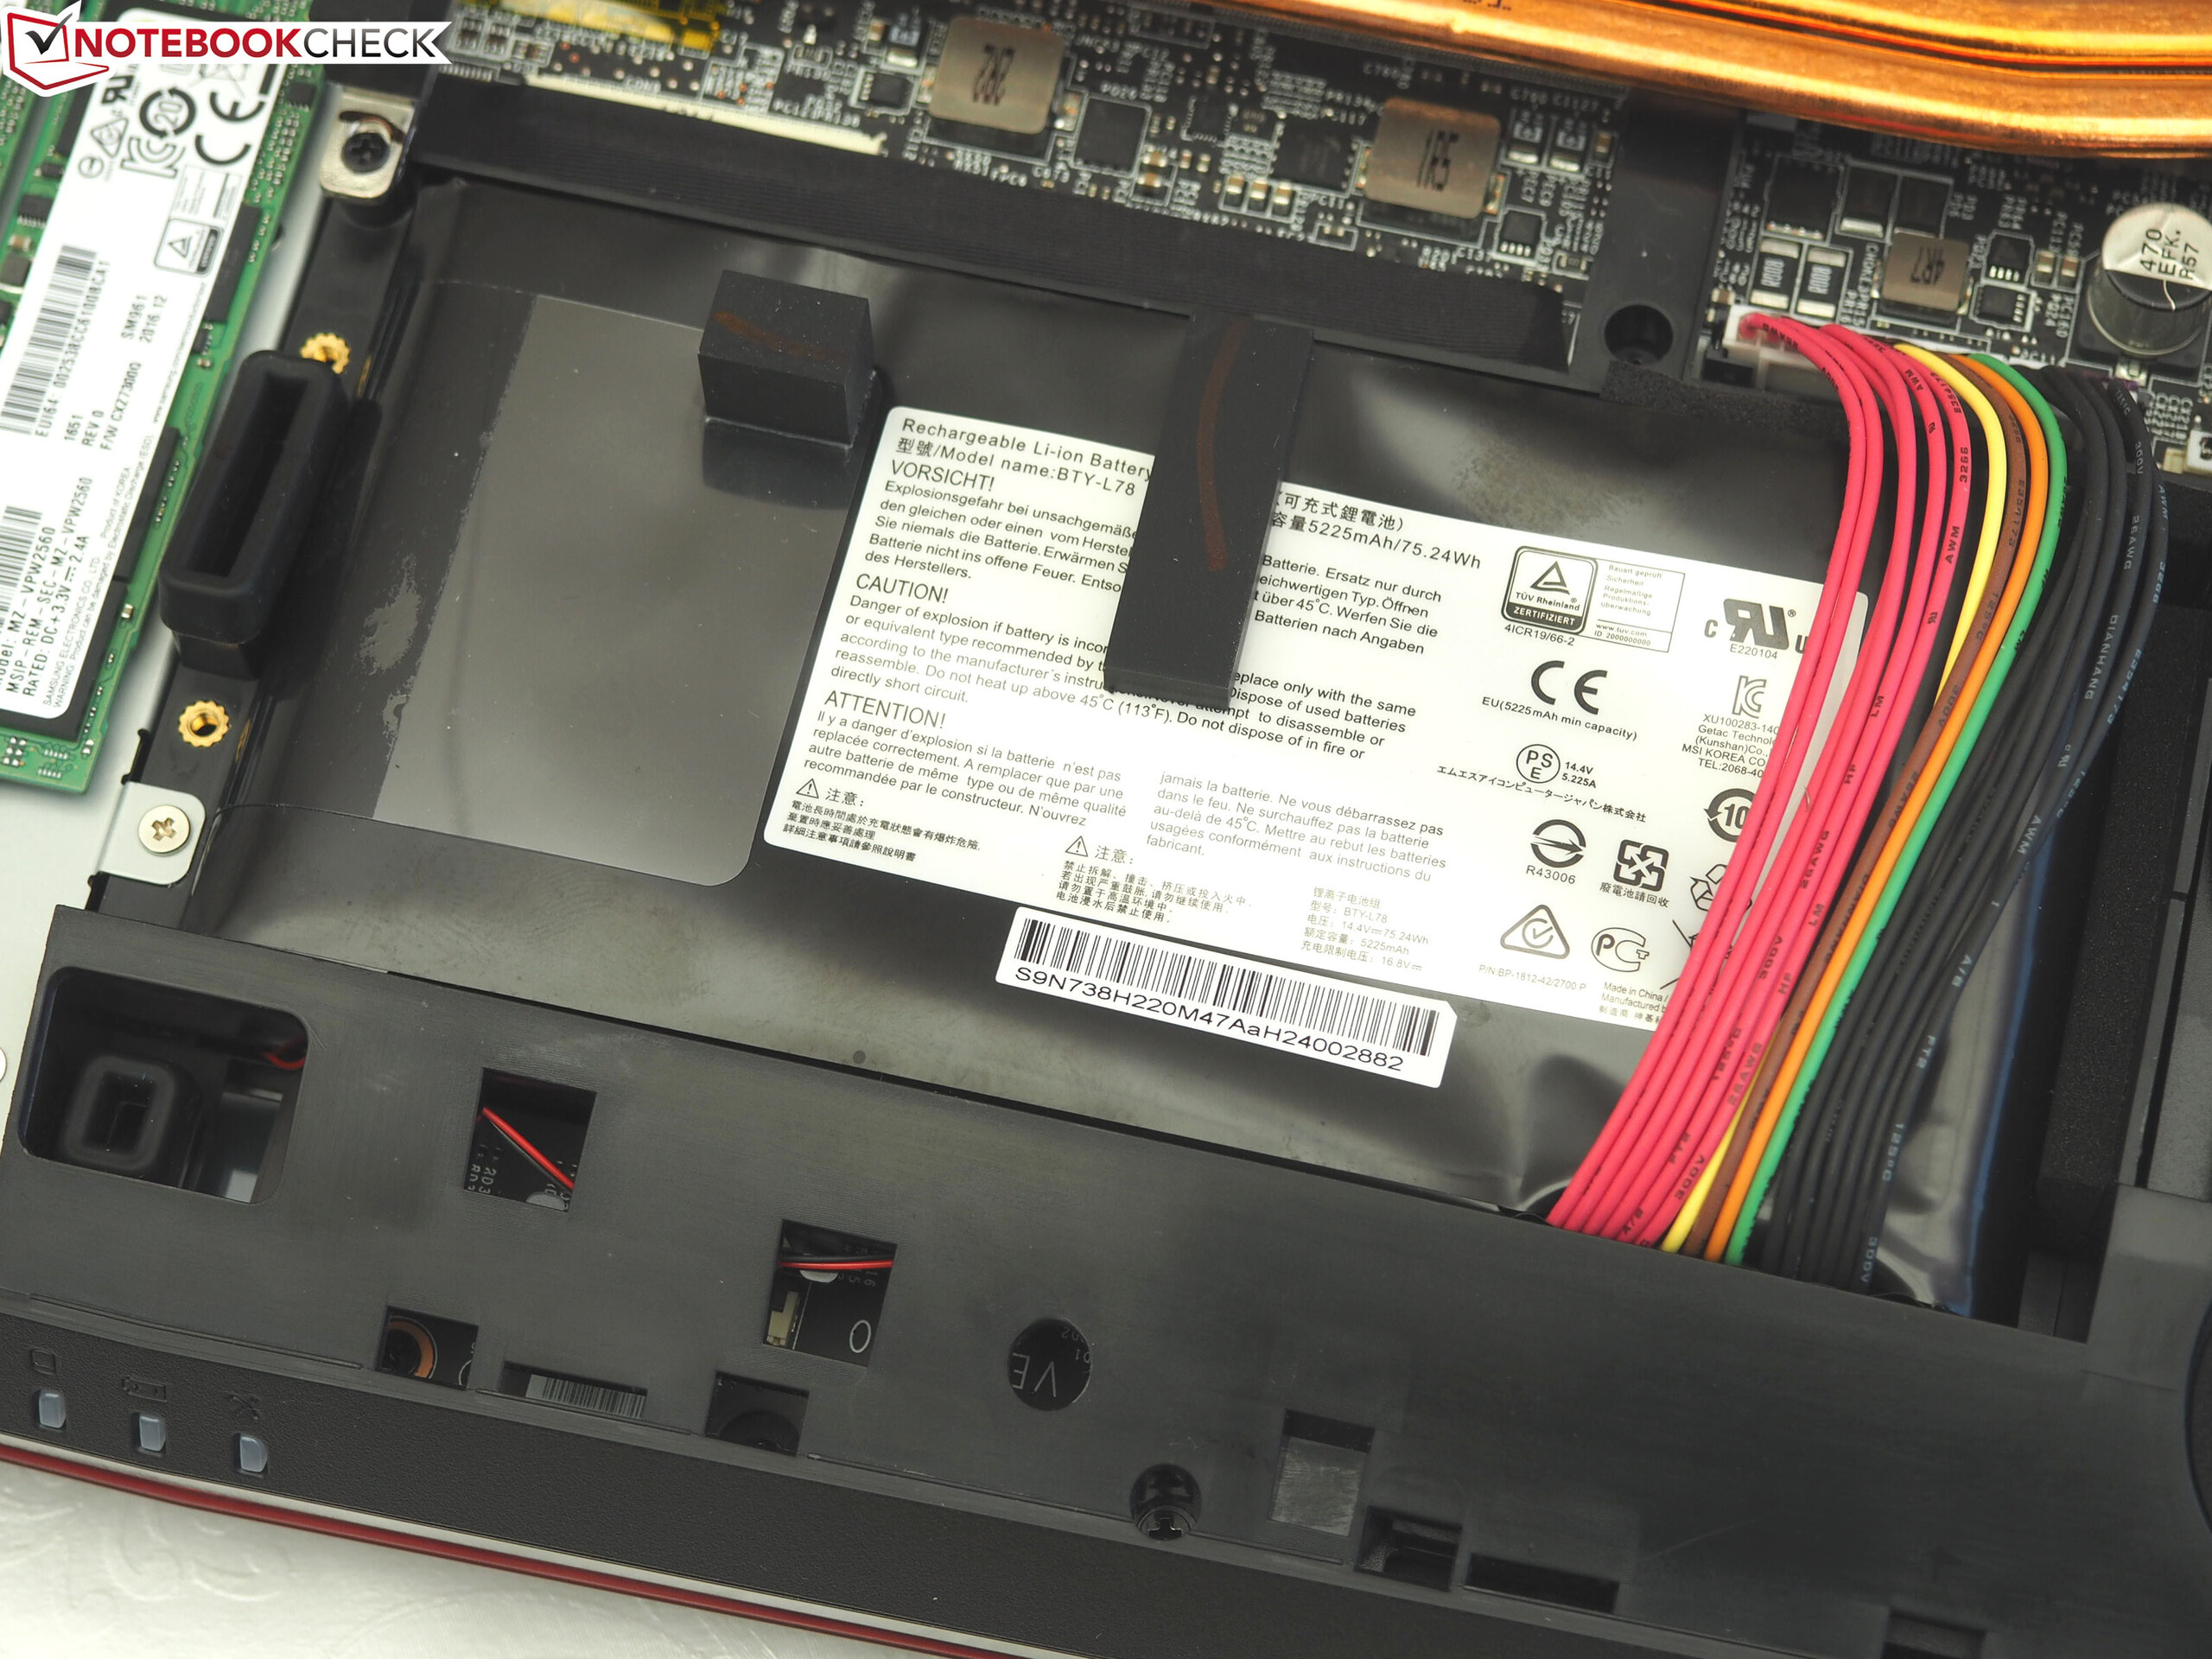
| MSI GT75VR 7RF-012 Titan Pro i7-7820HK, GeForce GTX 1080 Mobile, 75 Wh | MSI GT73VR 7RF-296 i7-7820HK, GeForce GTX 1080 Mobile, 75.2 Wh | Acer Predator 17 X GX-792-76DL i7-7820HK, GeForce GTX 1080 Mobile, 88.8 Wh | Alienware 17 R4 i7-7820HK, GeForce GTX 1080 Mobile, 99 Wh | Asus G701VIK-BA049T i7-7820HK, GeForce GTX 1080 Mobile, 93 Wh | Schenker XMG U727 2017 i7-7700K, GeForce GTX 1080 Mobile, 89 Wh | |
|---|---|---|---|---|---|---|
| Duração da bateria | 5% | 55% | 29% | 61% | 28% | |
| Reader / Idle (h) | 3 | 5.2 73% | 4.6 53% | 5.7 90% | 3.7 23% | |
| H.264 (h) | 2.5 | 2.4 -4% | 3.4 36% | |||
| WiFi v1.3 (h) | 2.4 | 2.7 13% | 4.2 75% | 3 25% | 4 67% | 2.8 17% |
| Load (h) | 1.1 | 1.5 36% | 1.2 9% | 1.4 27% | 1.6 45% |
Pro
Contra
Tudo dito, o GT75VR deixa uma impressão mista. Primeiro o bom: Comparado com o GT73VR que achamos bom a muito bom em grande parte, a MSI fez melhorias em várias seções. Assim, não apenas o som, mas também o teclado entram em uma classificação alta.
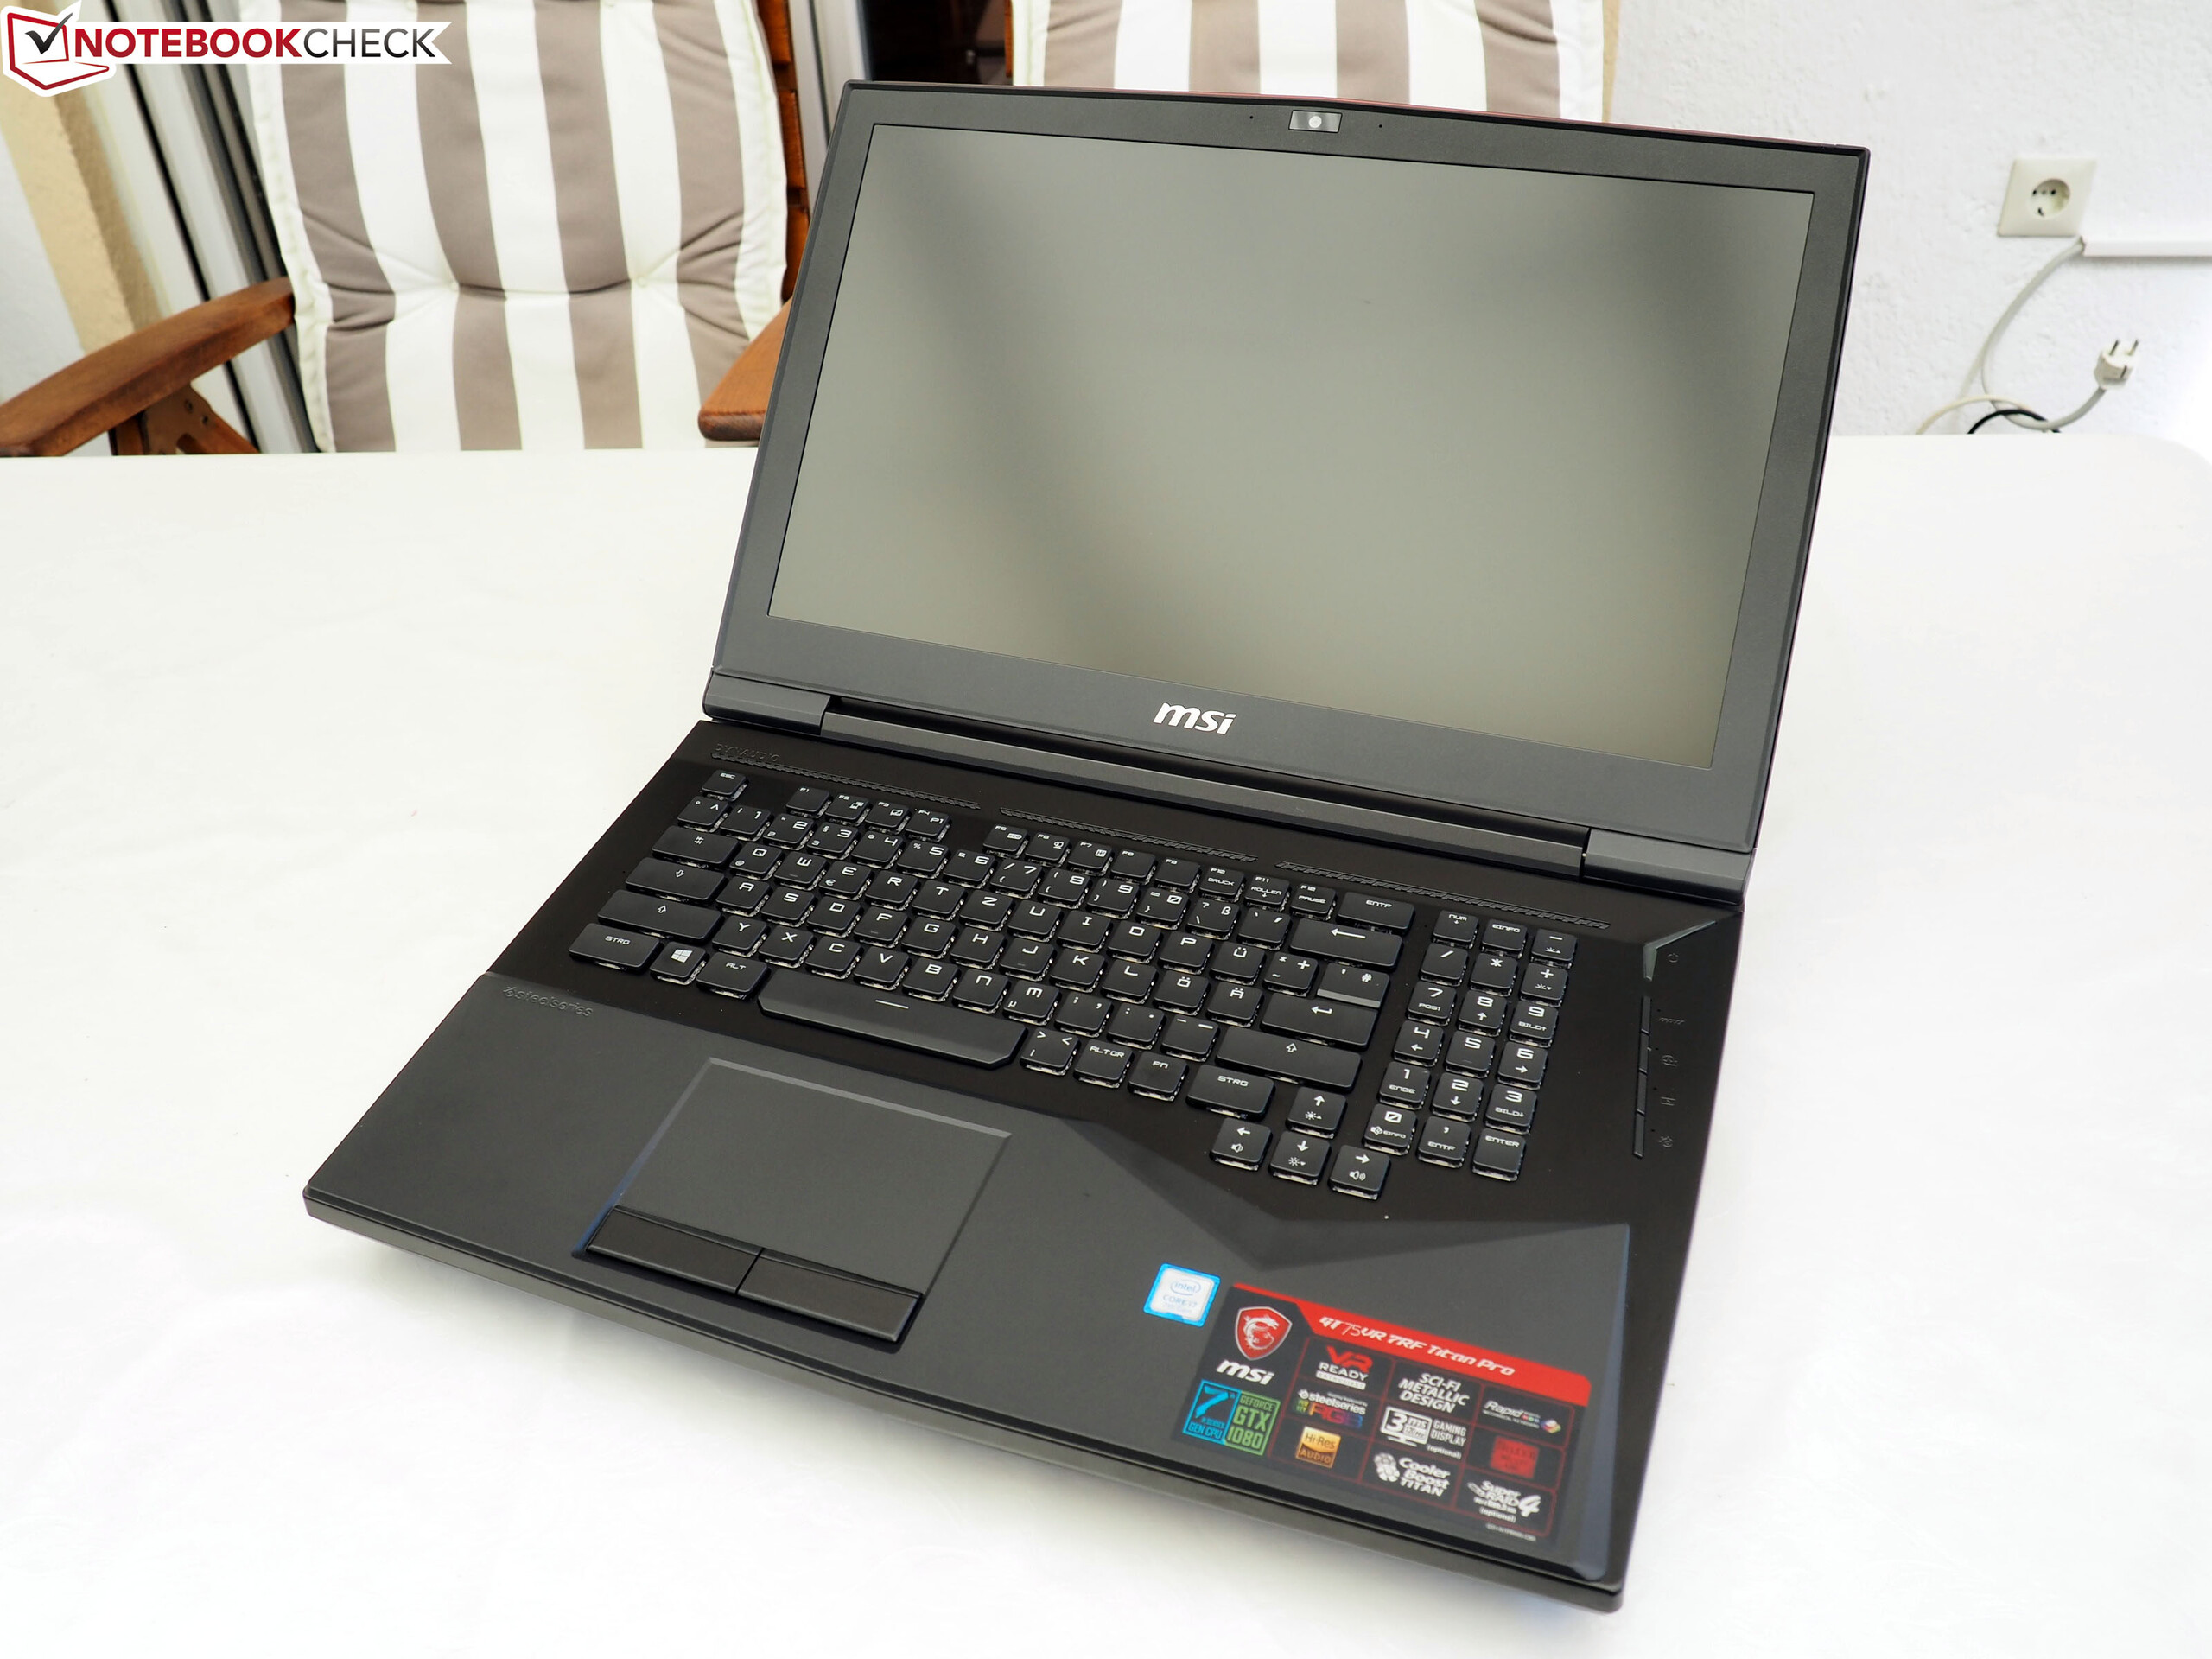
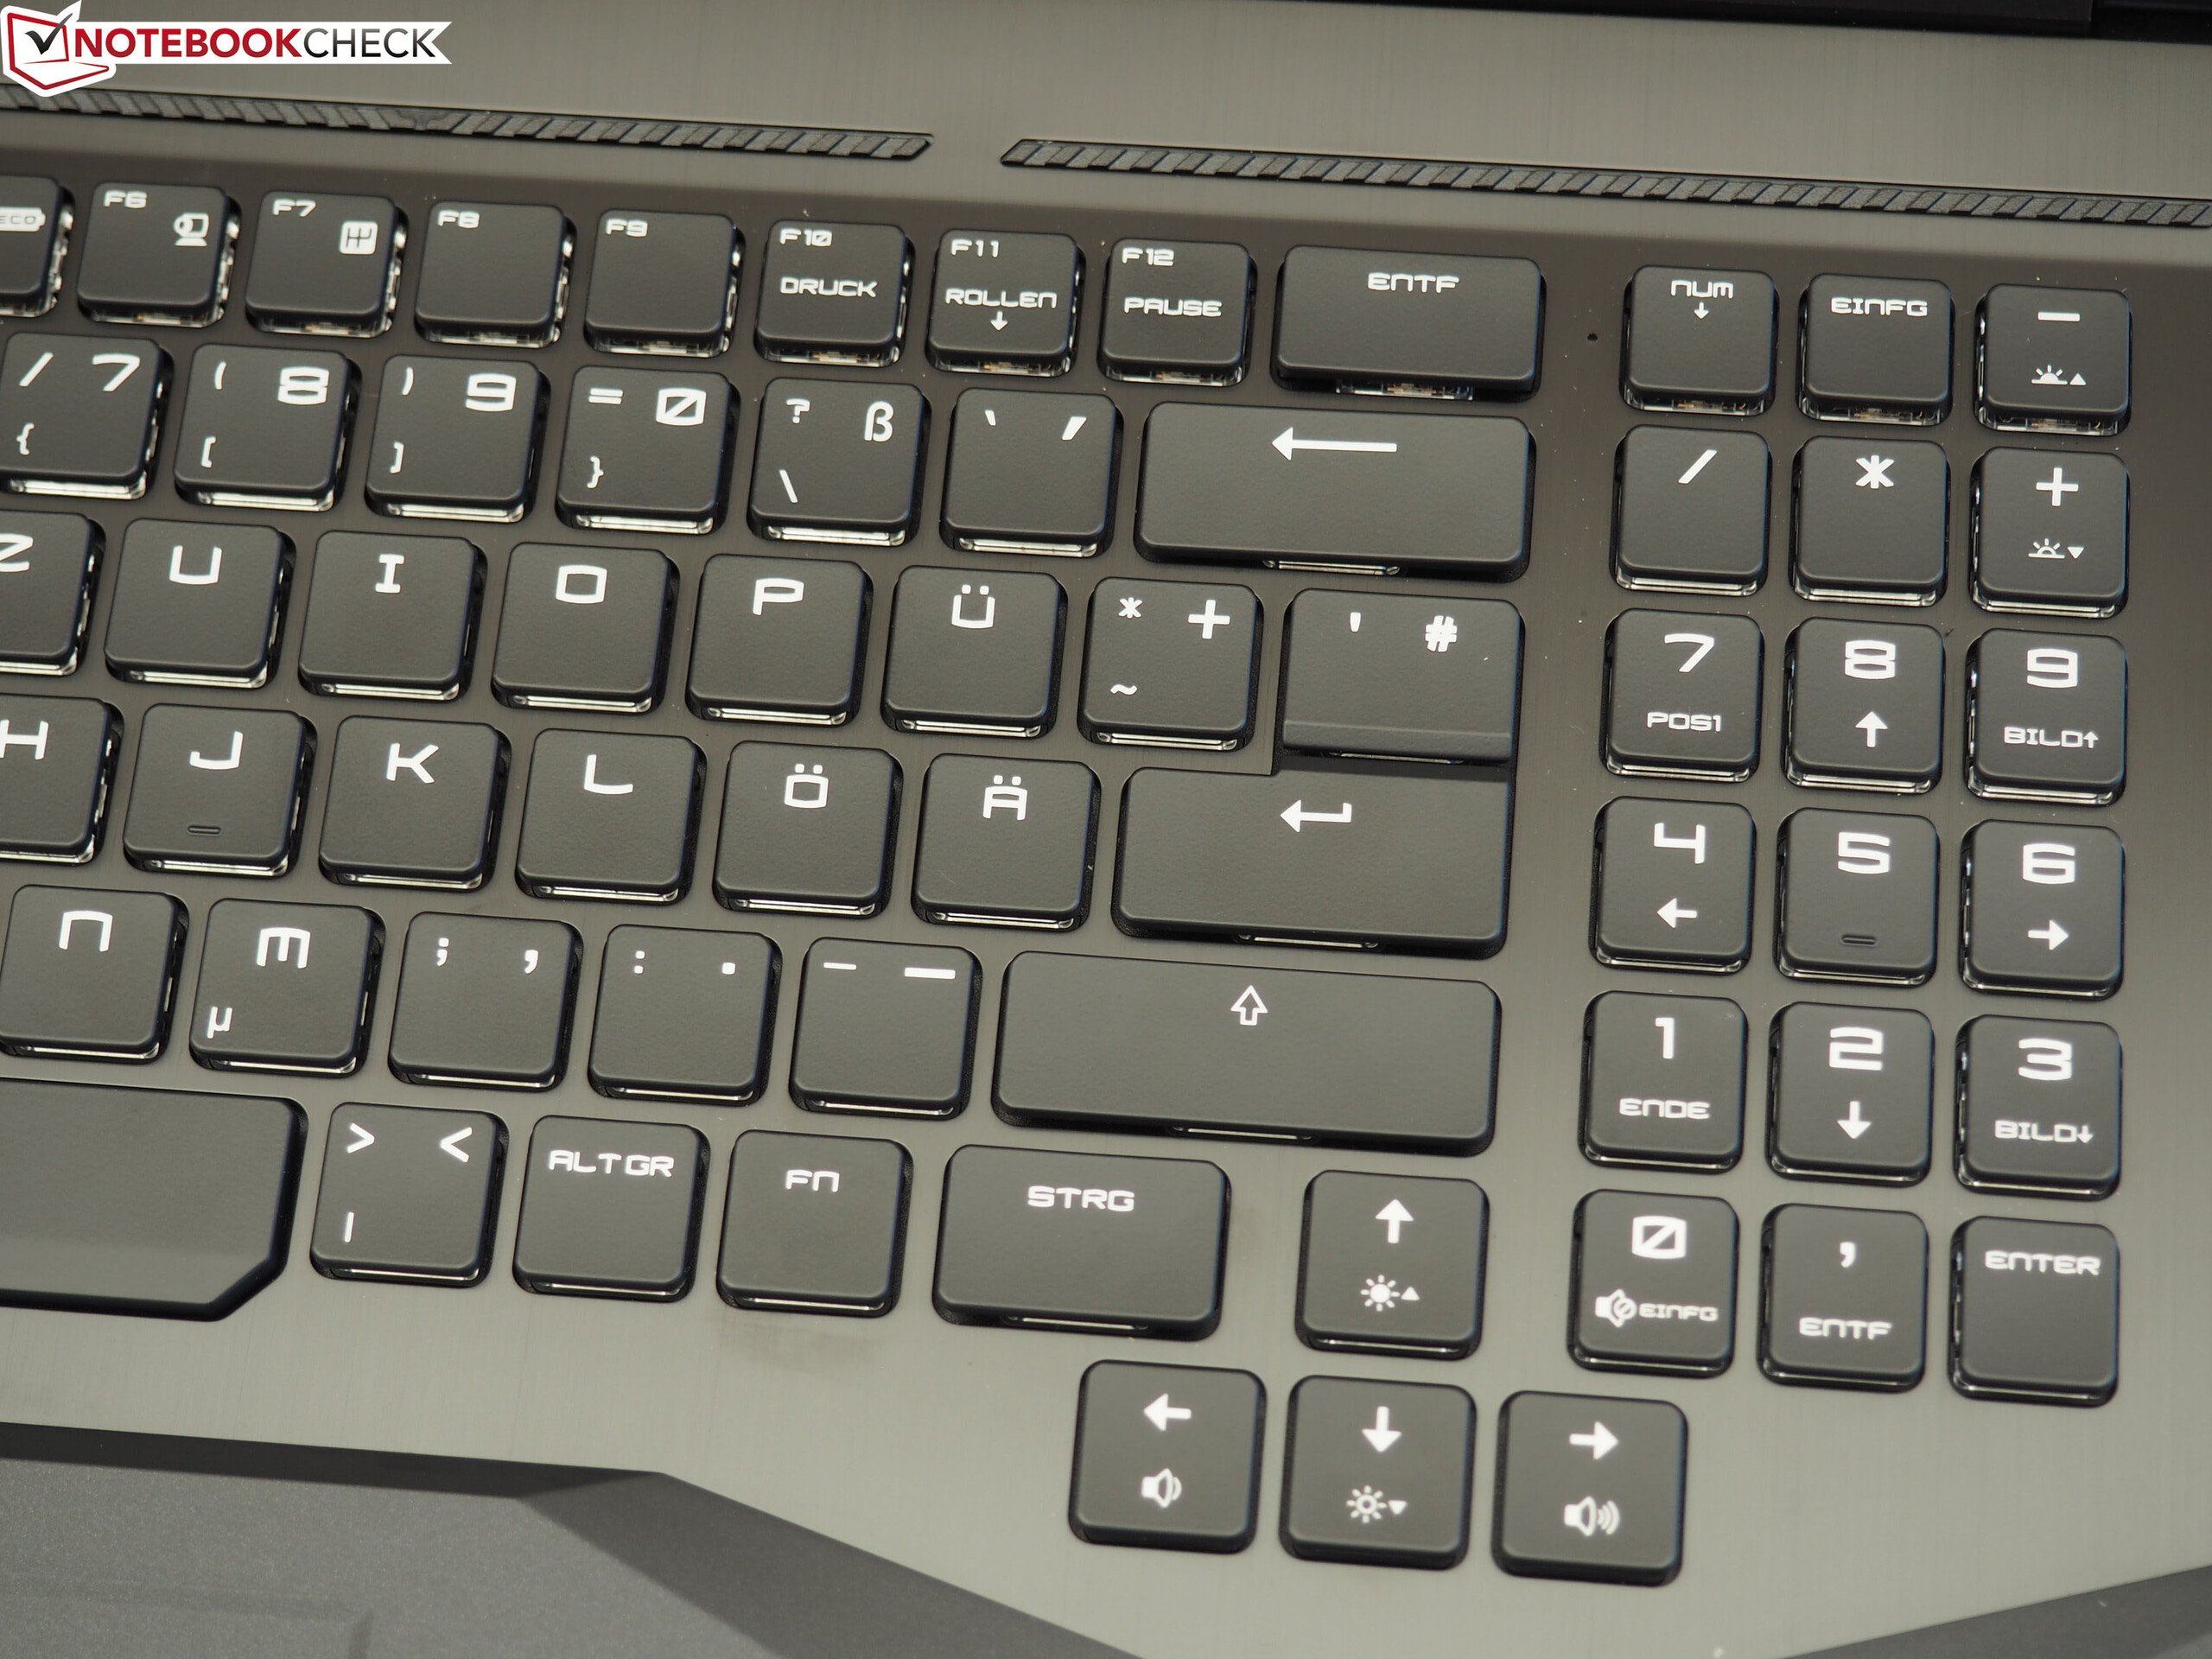
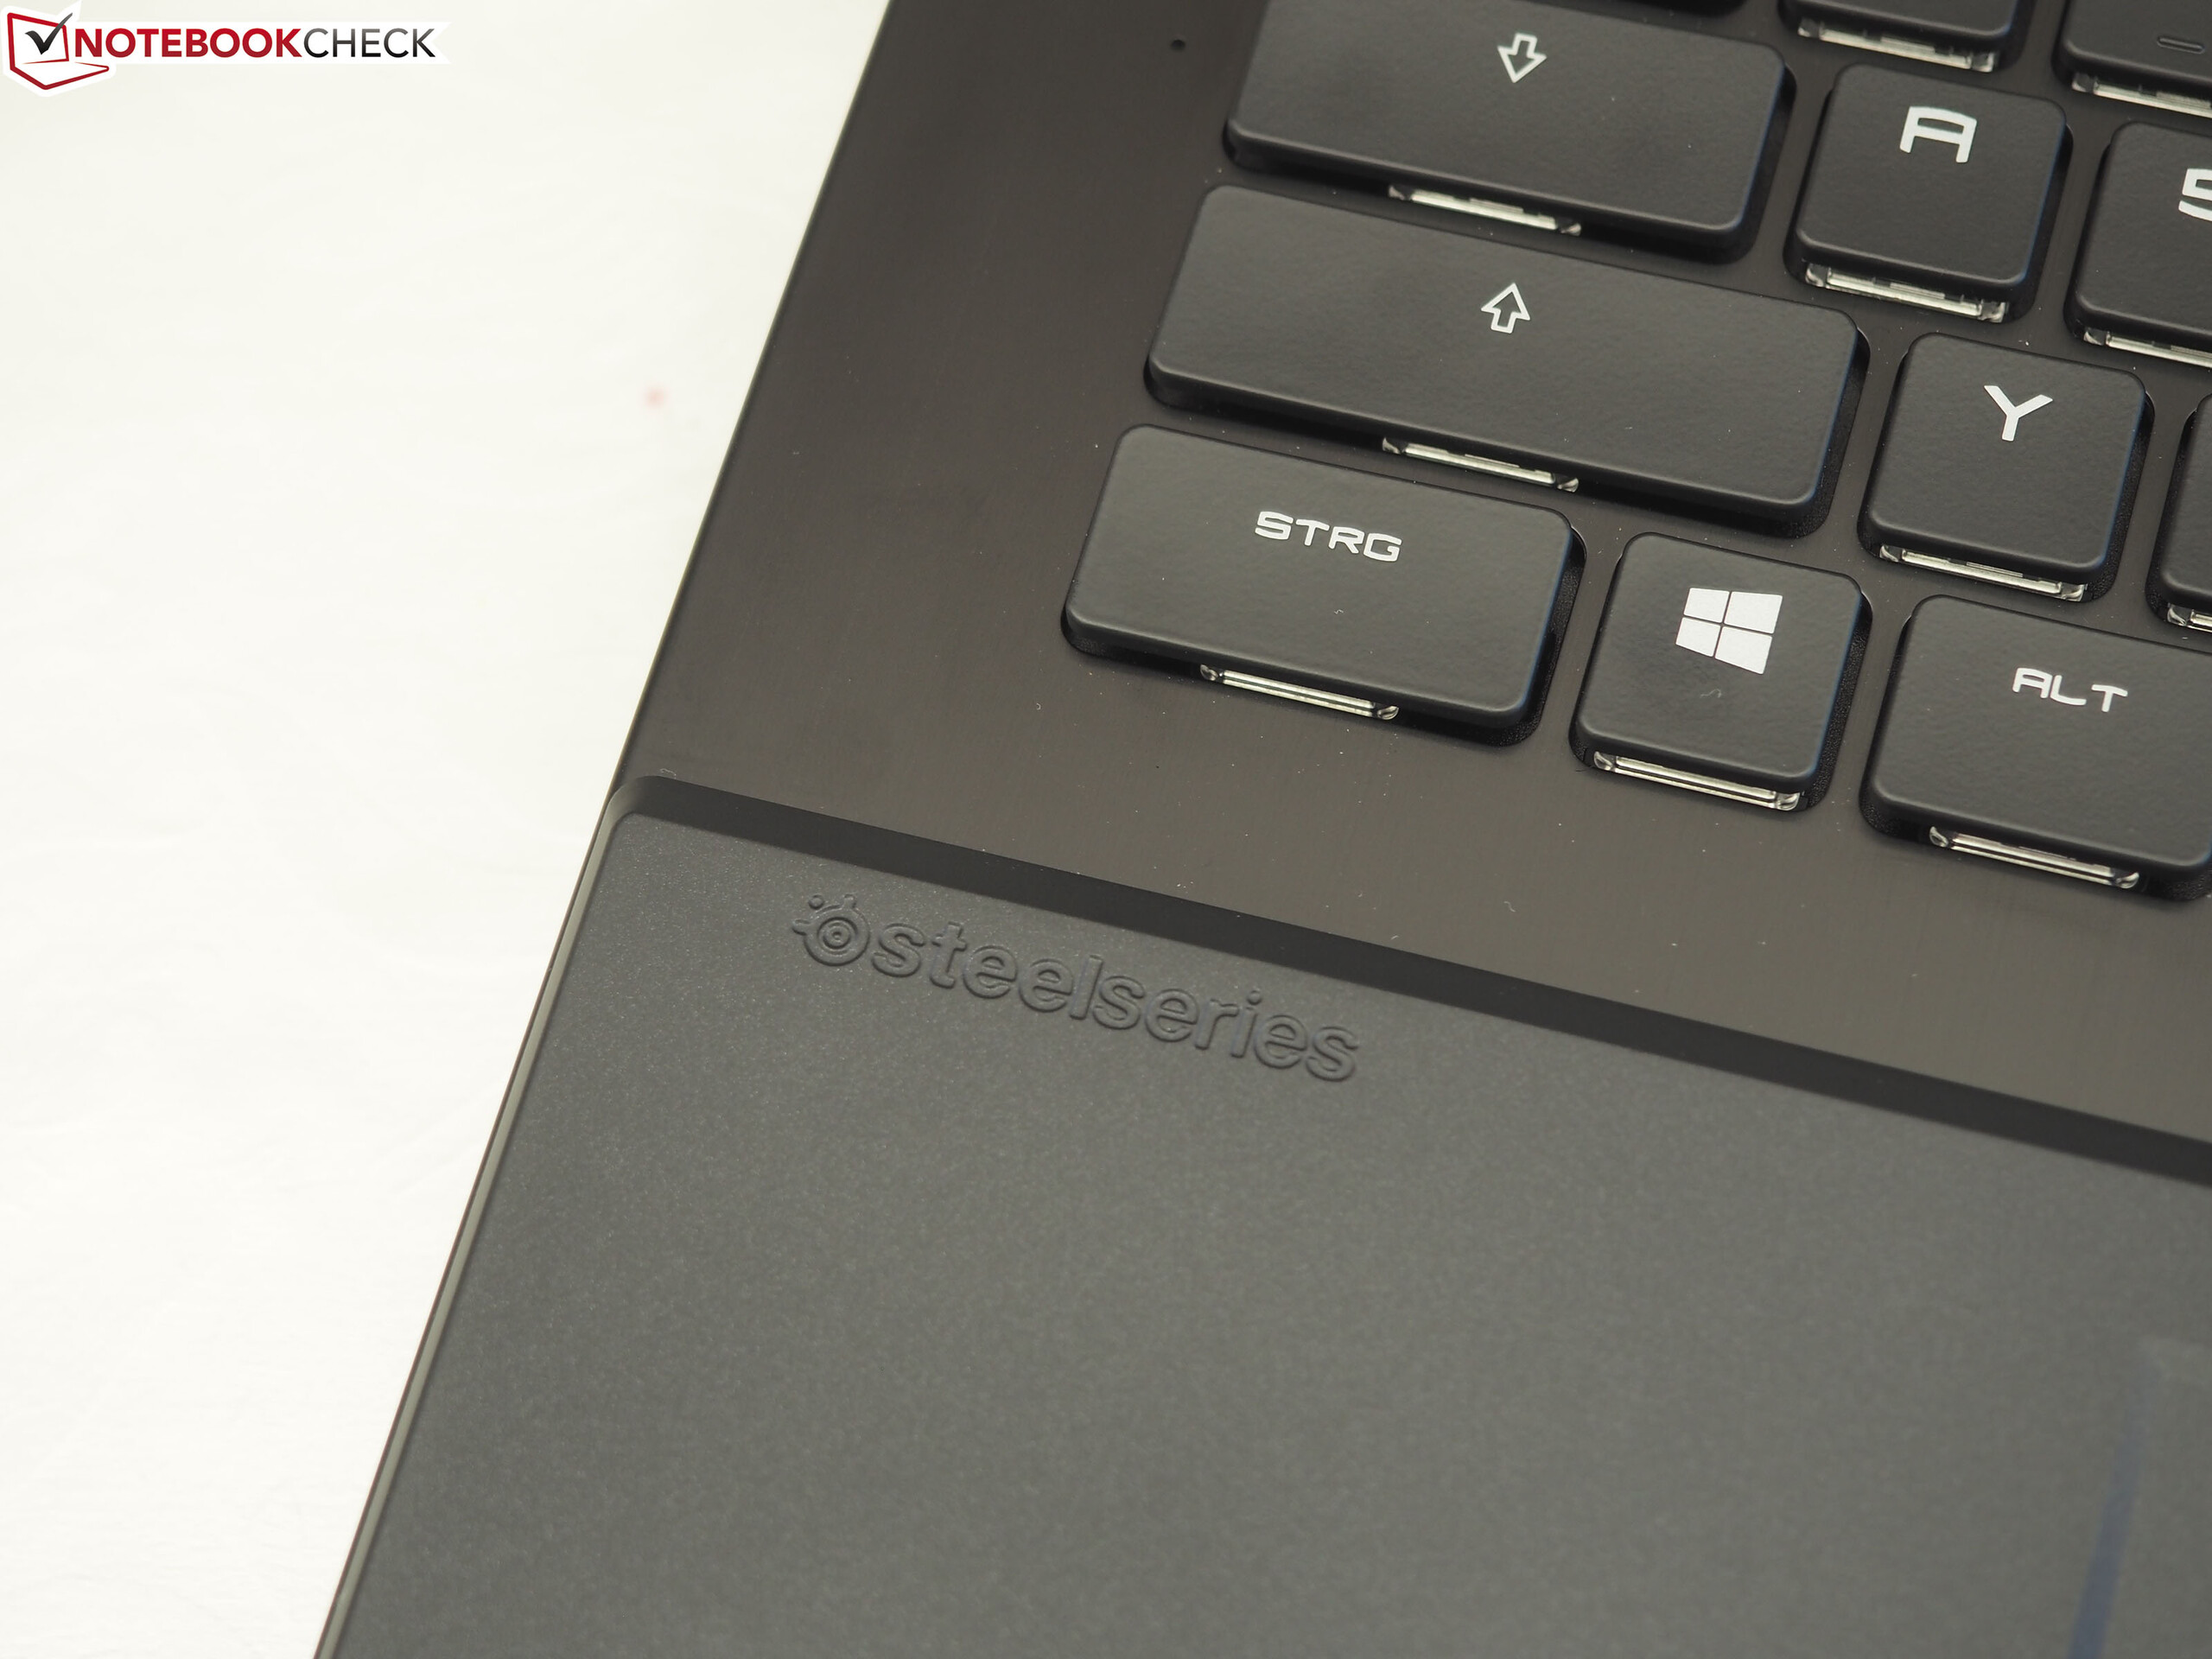
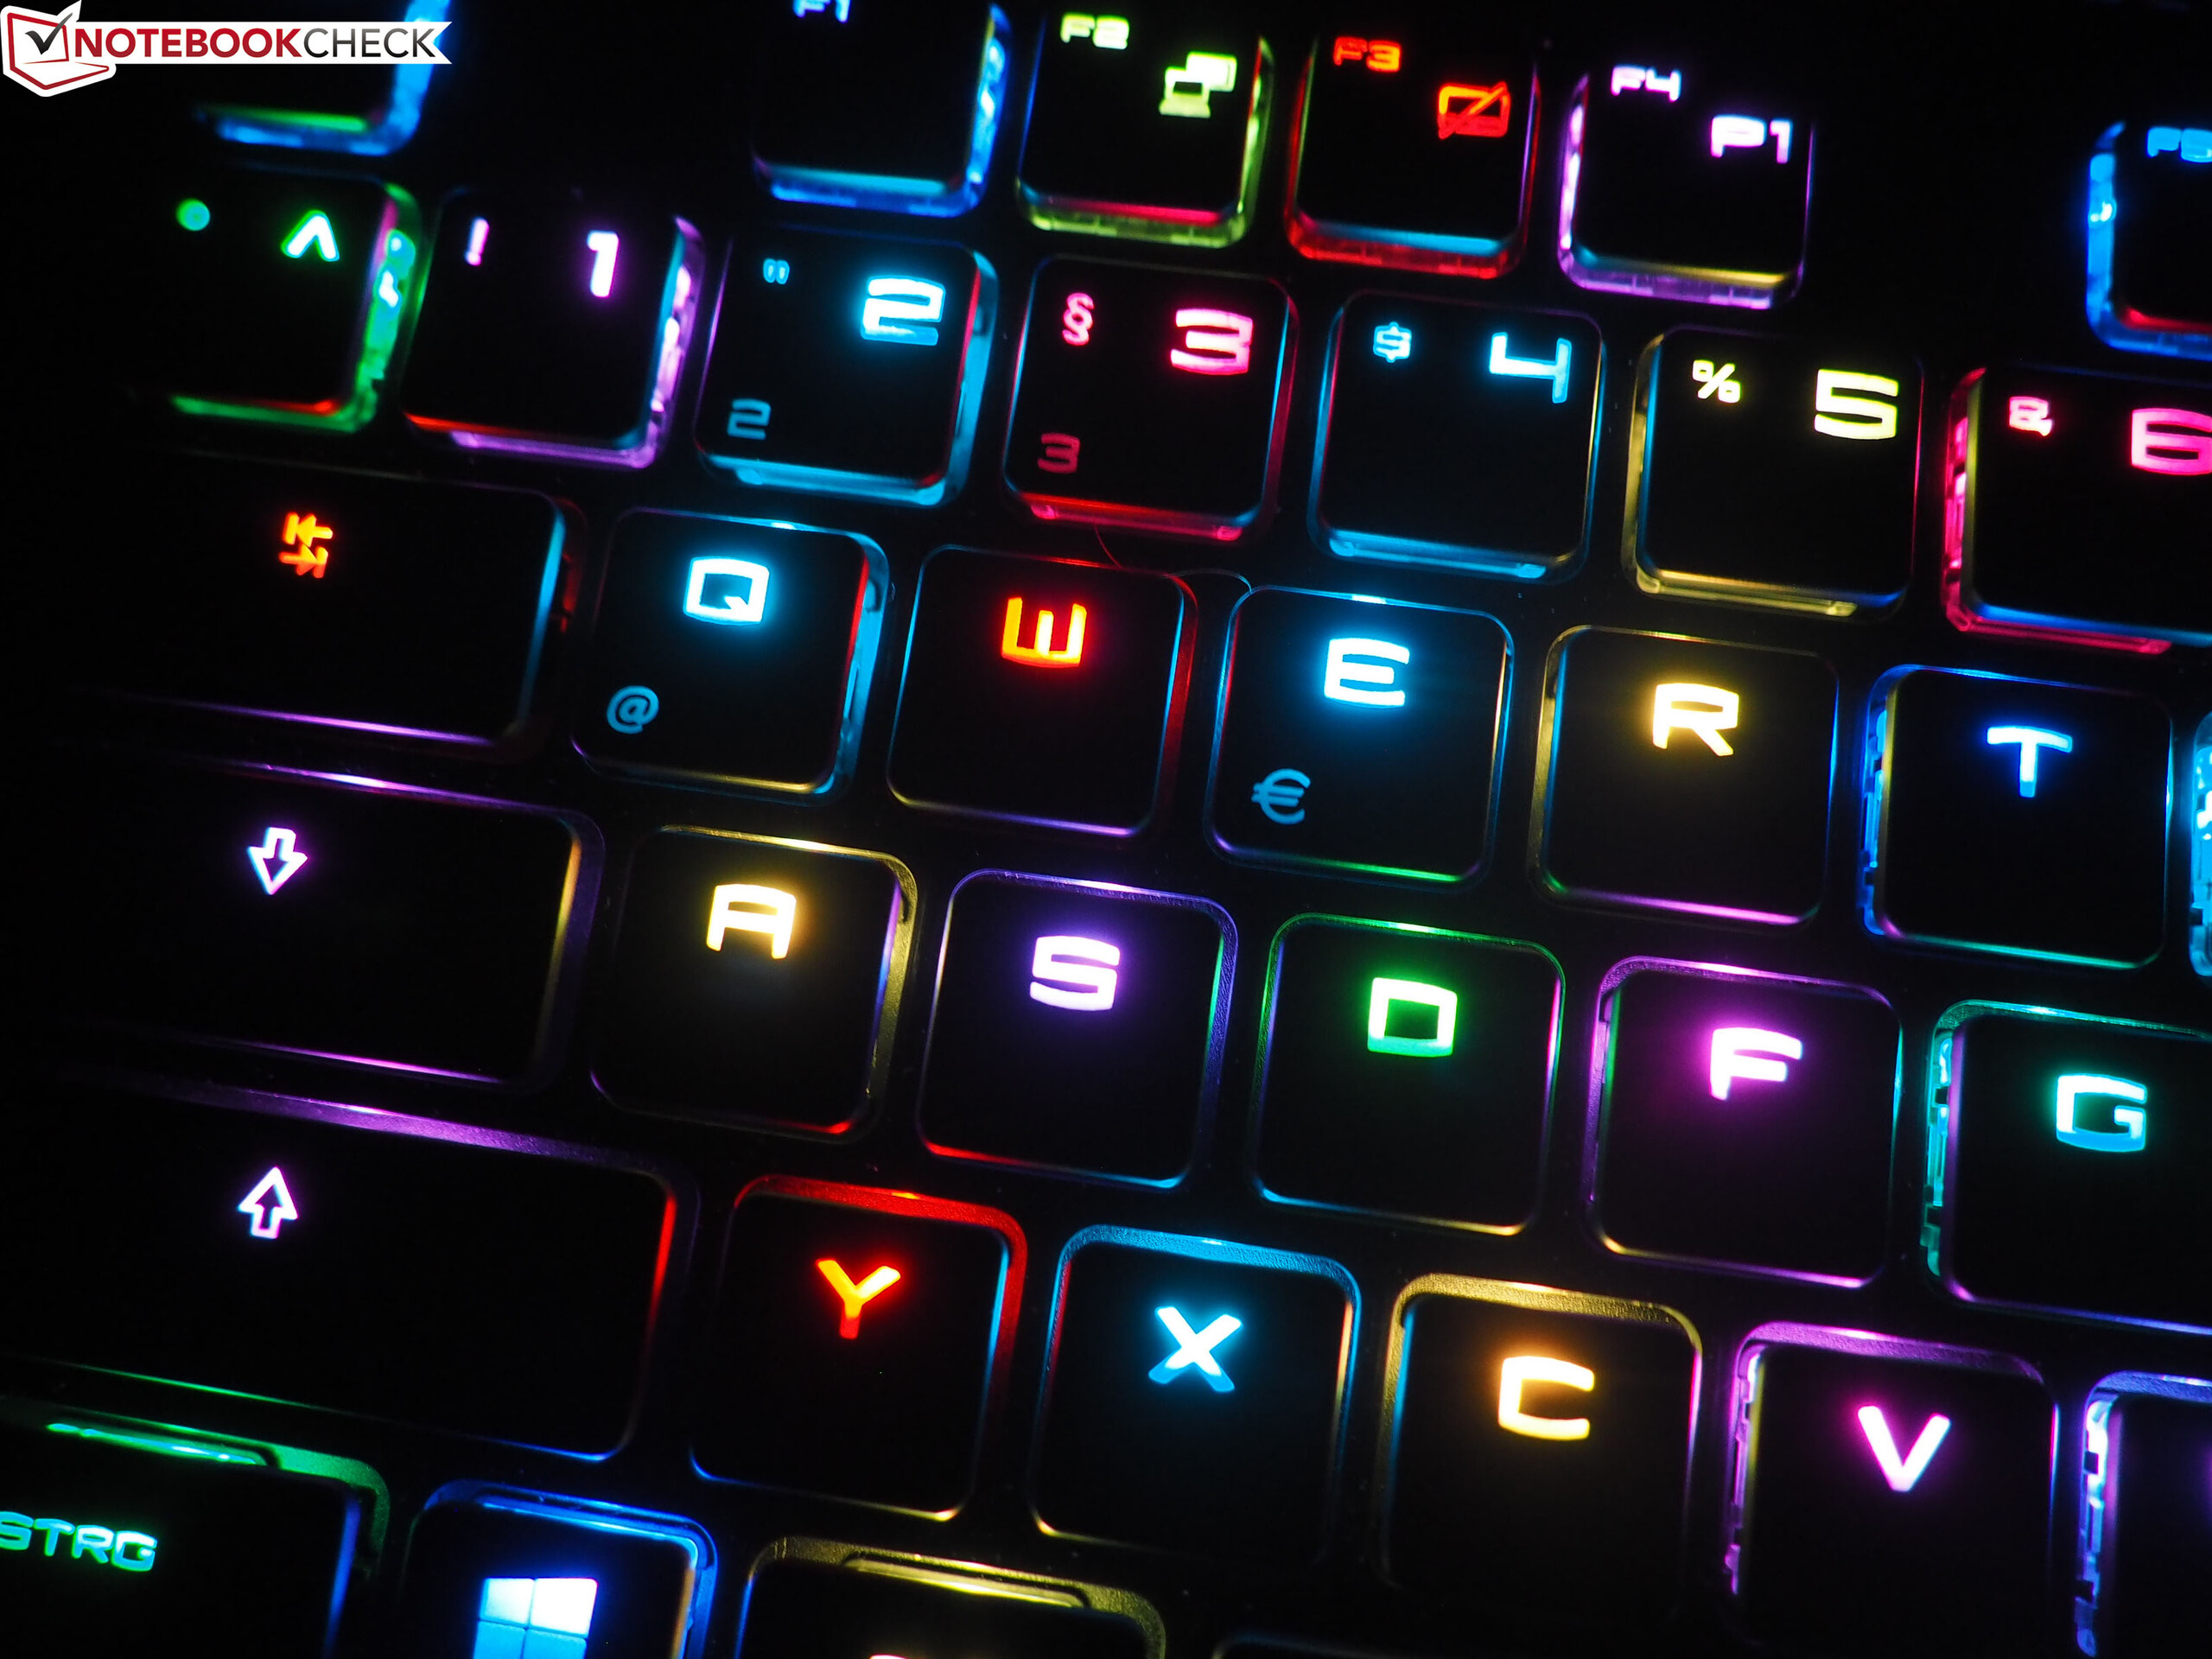
Exceto pelo layout incomum e o ruído de digitação extremamente proeminente, o teclado mecânico da SteelSeries é absolutamente agradável. Depois de digitar em um modelo correspondente, o usuário nunca mais desejará retornar para um teclado tradicional. A mudança se sente tão revolucionária como quando se muda de HD para SSD.
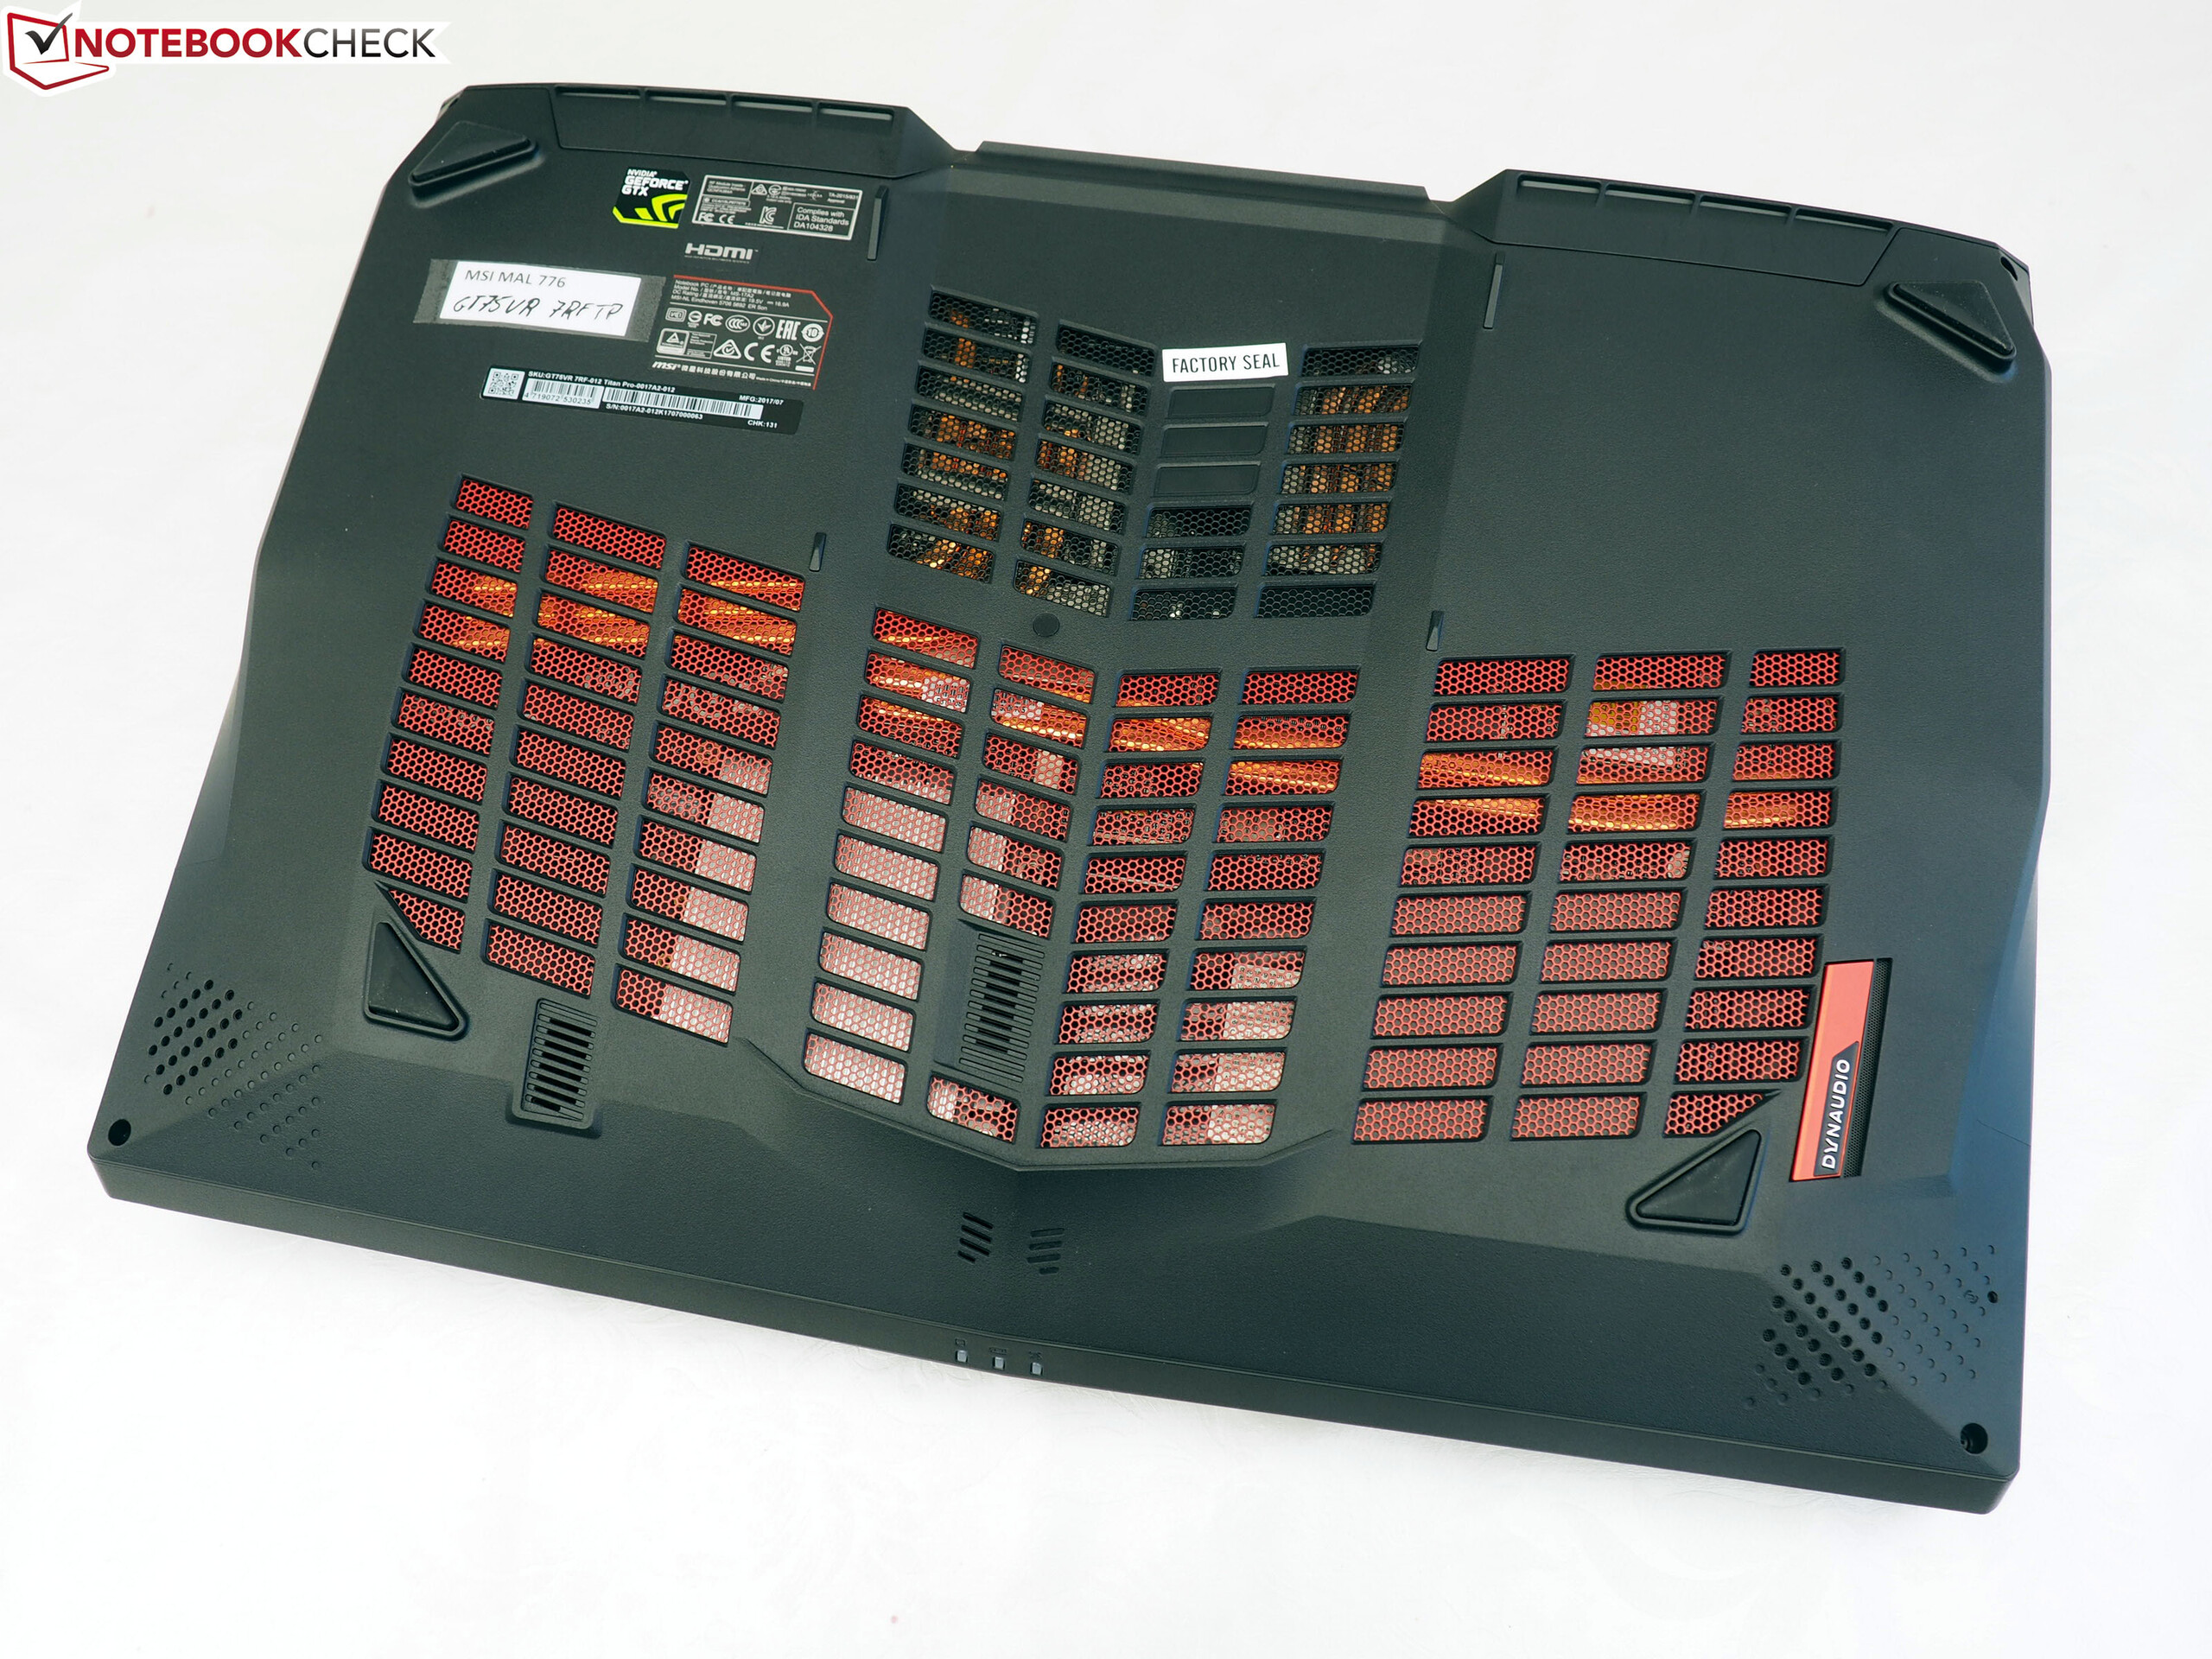
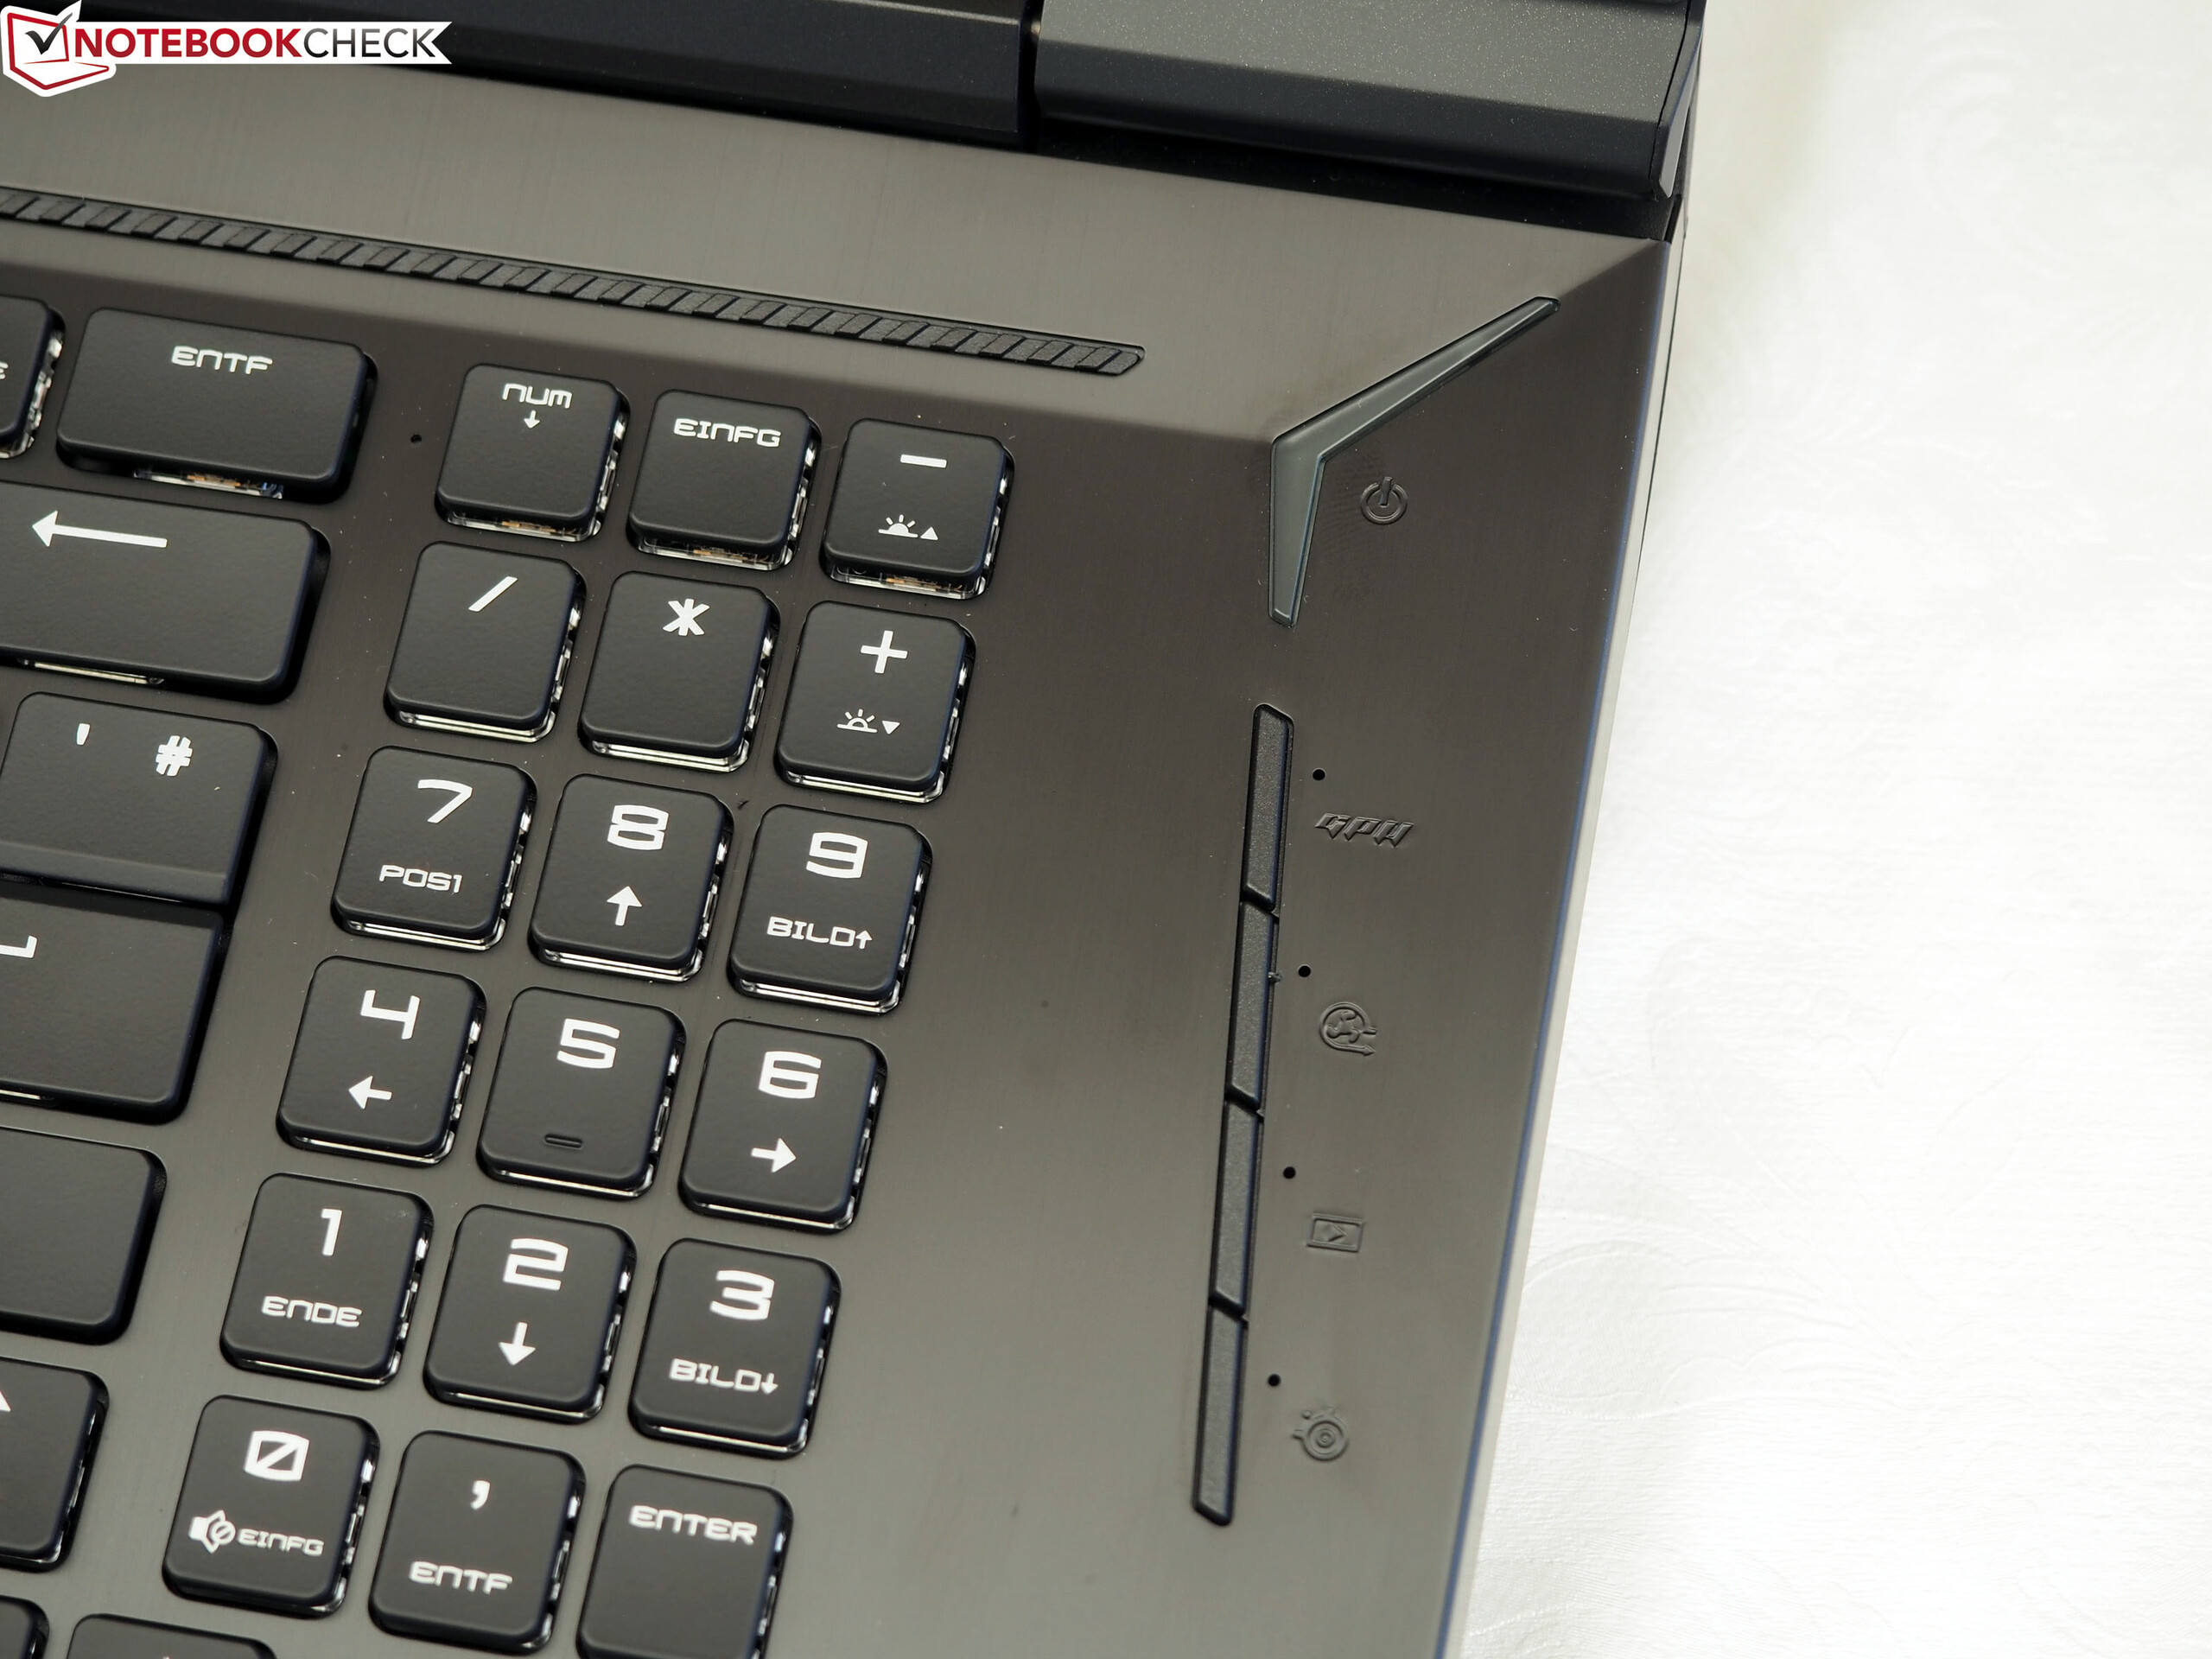
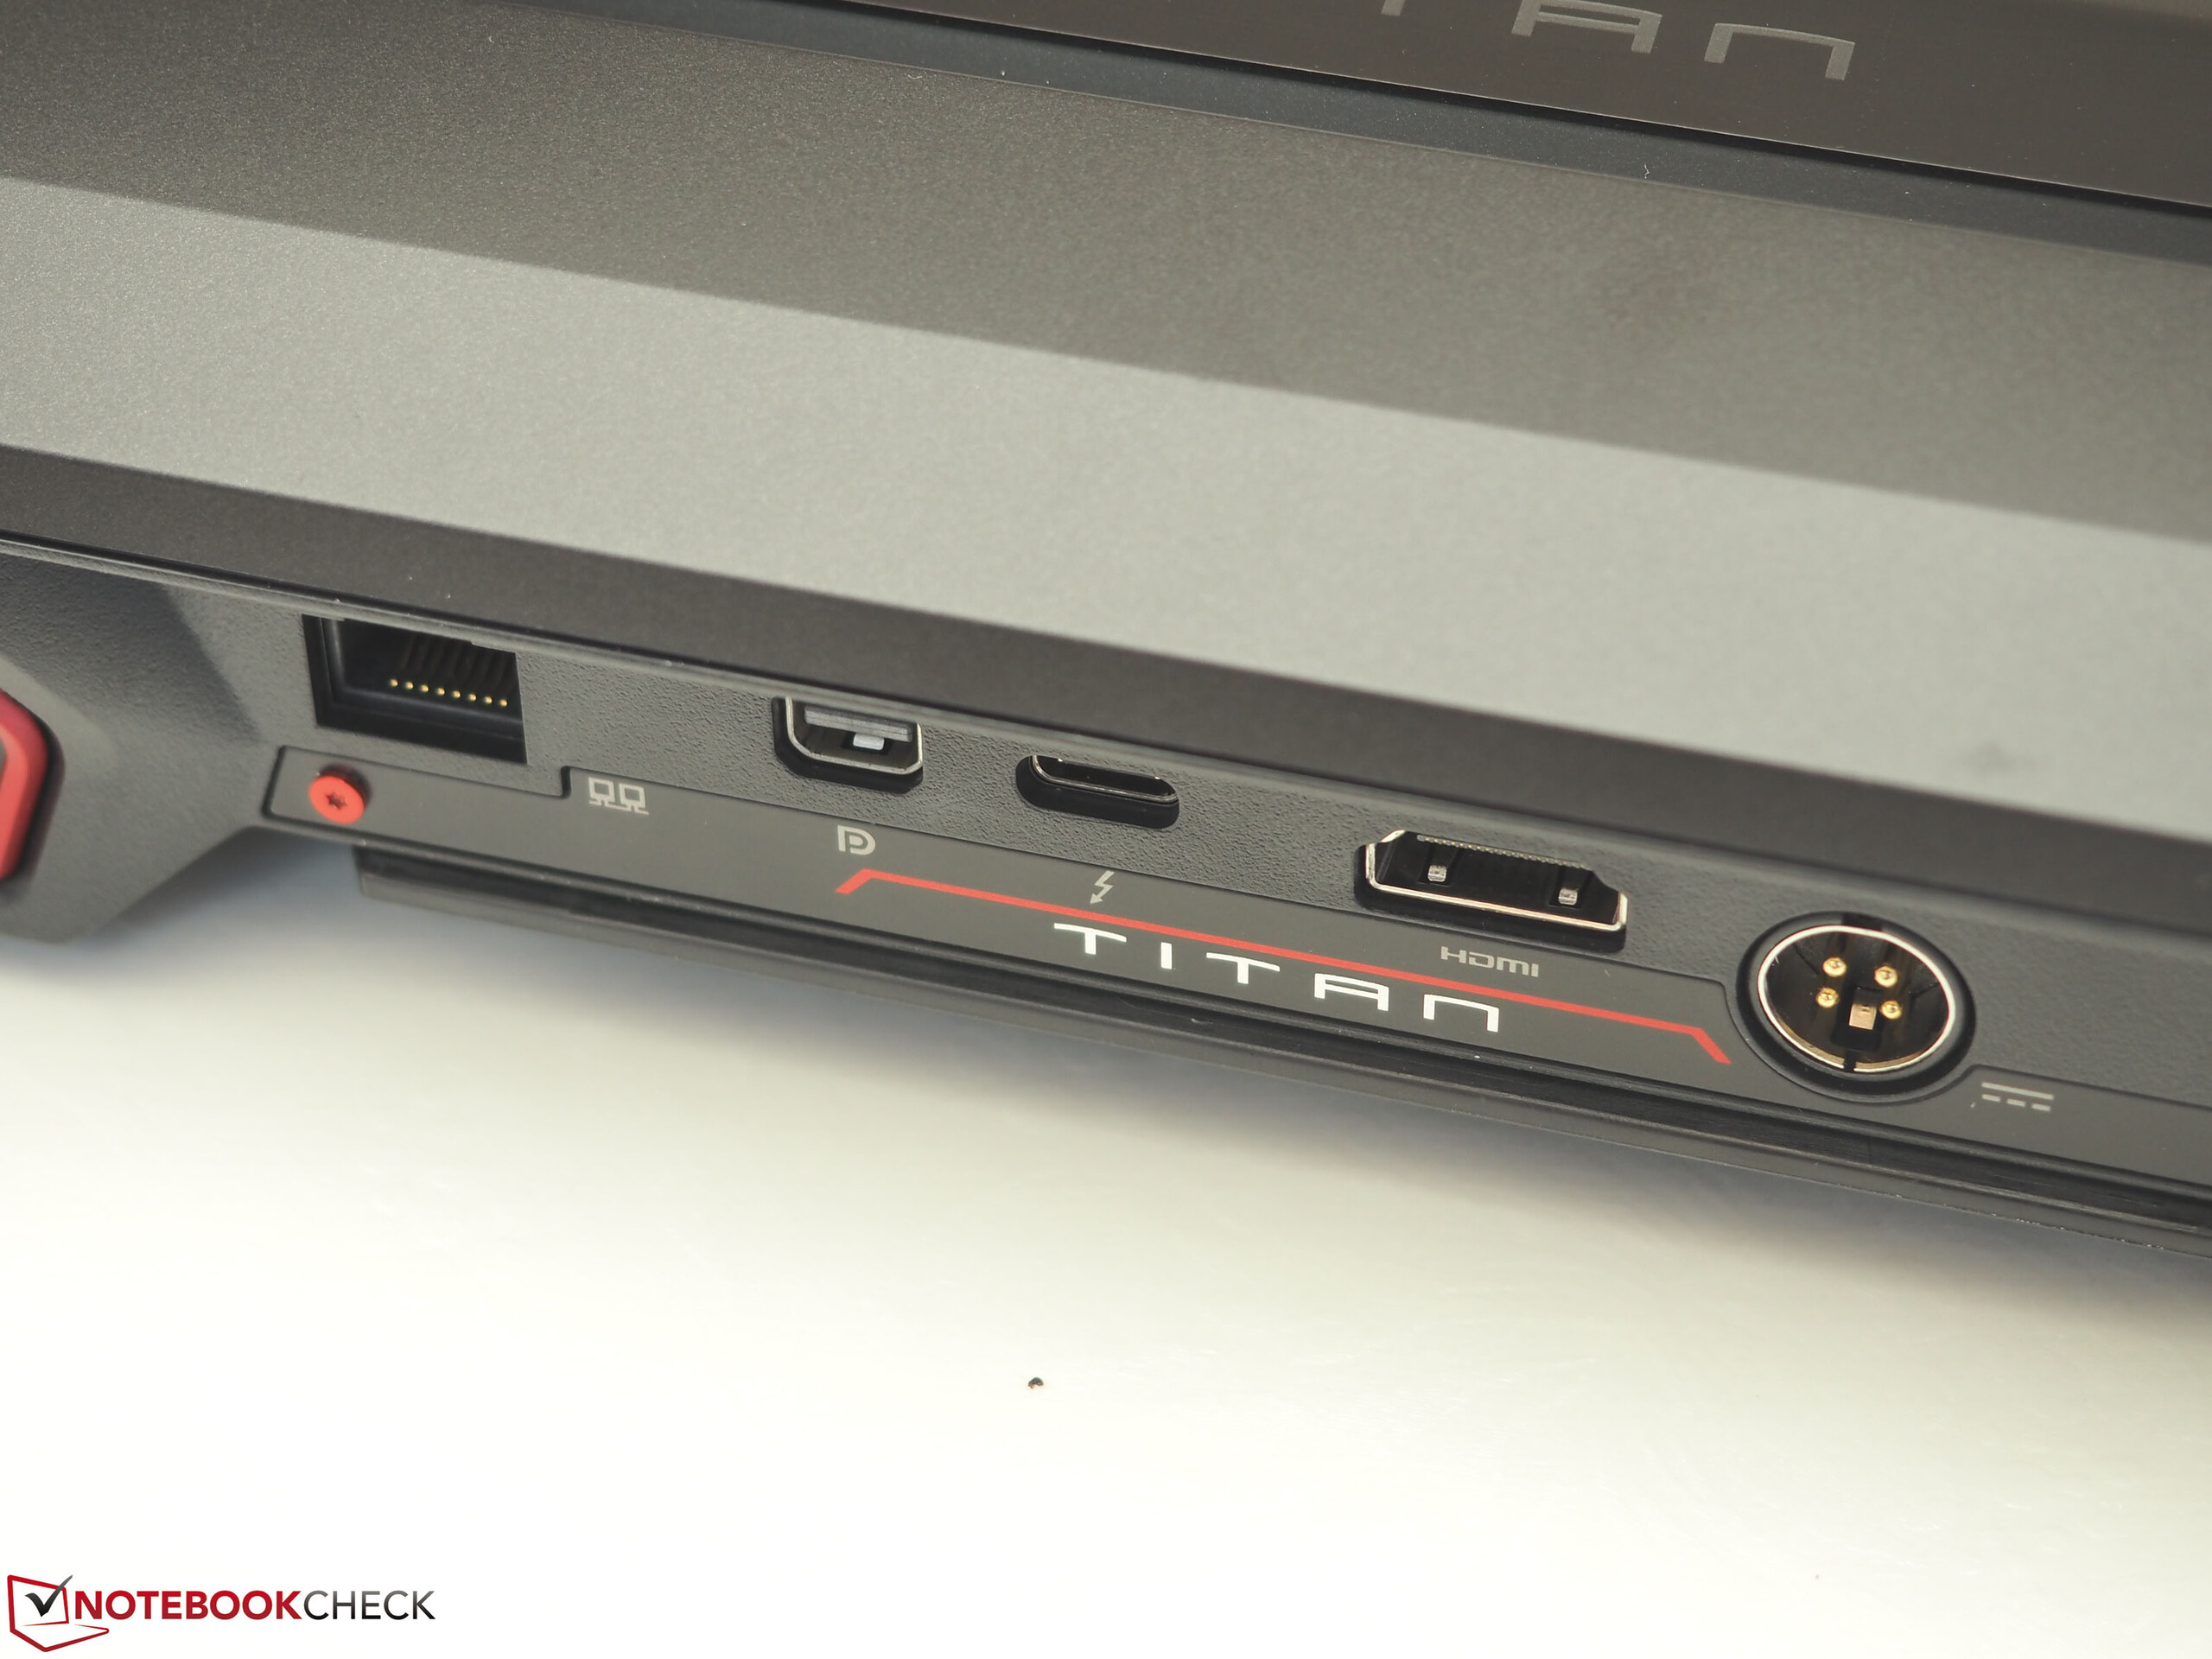
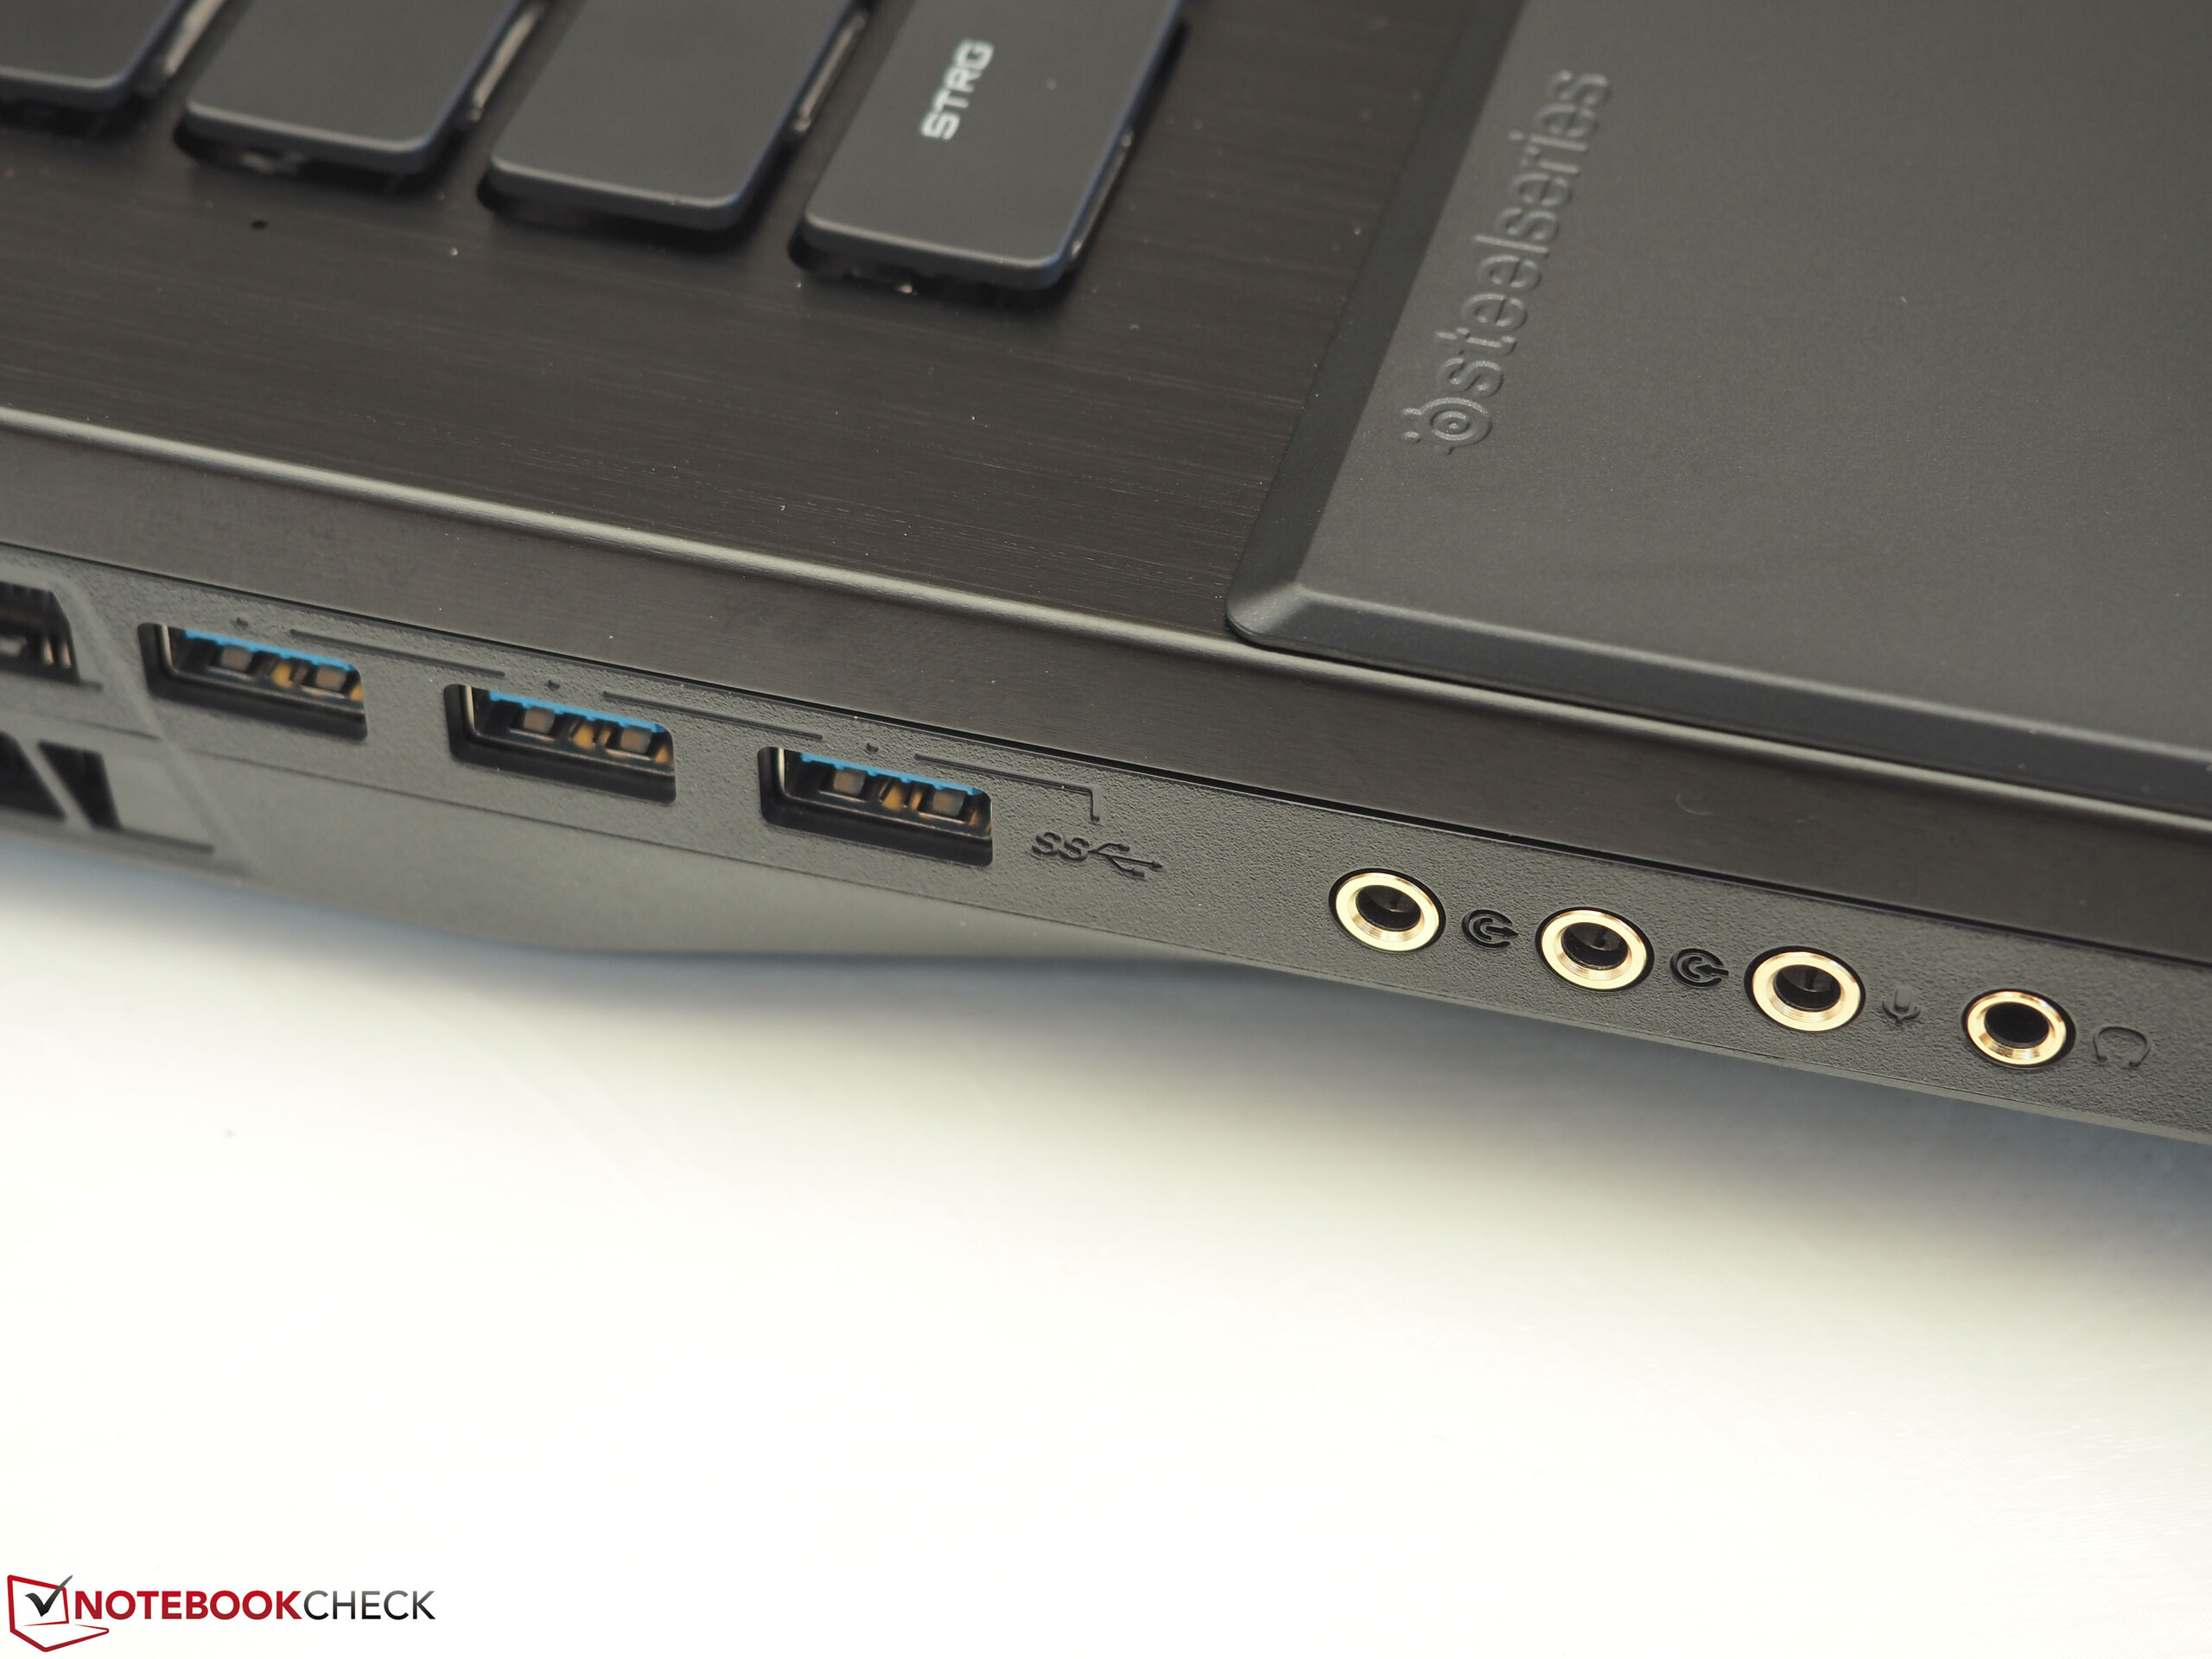
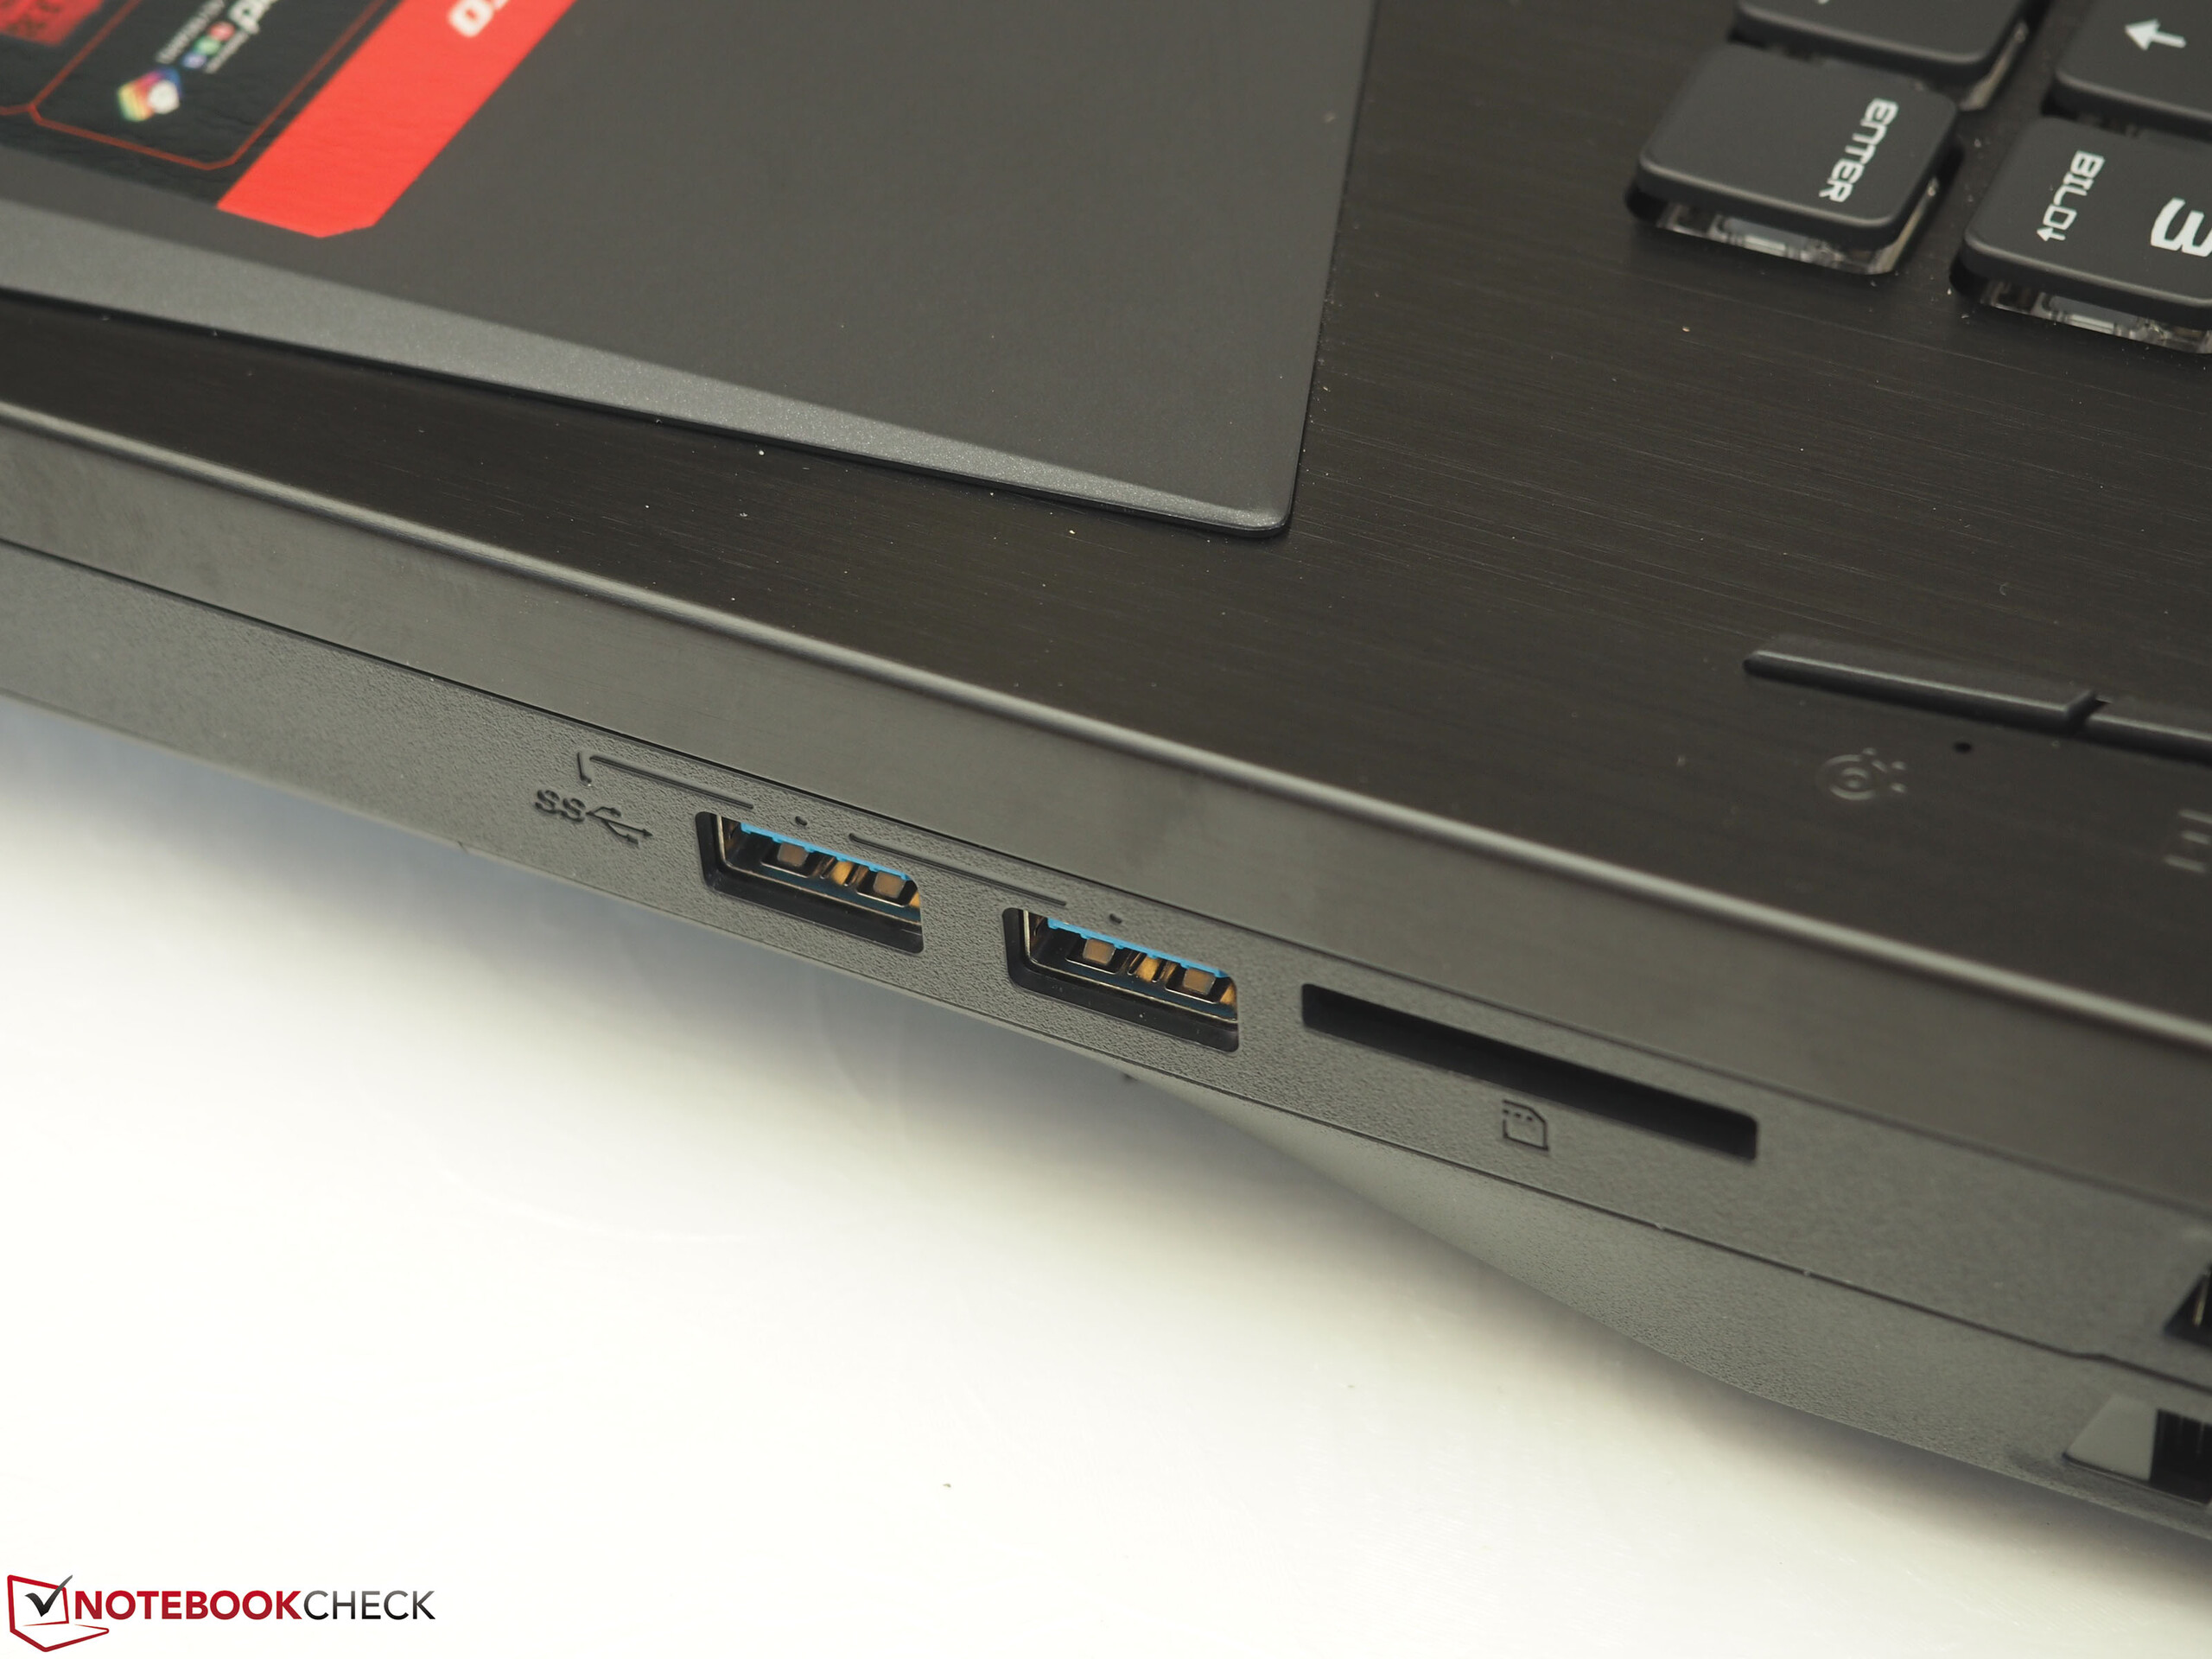
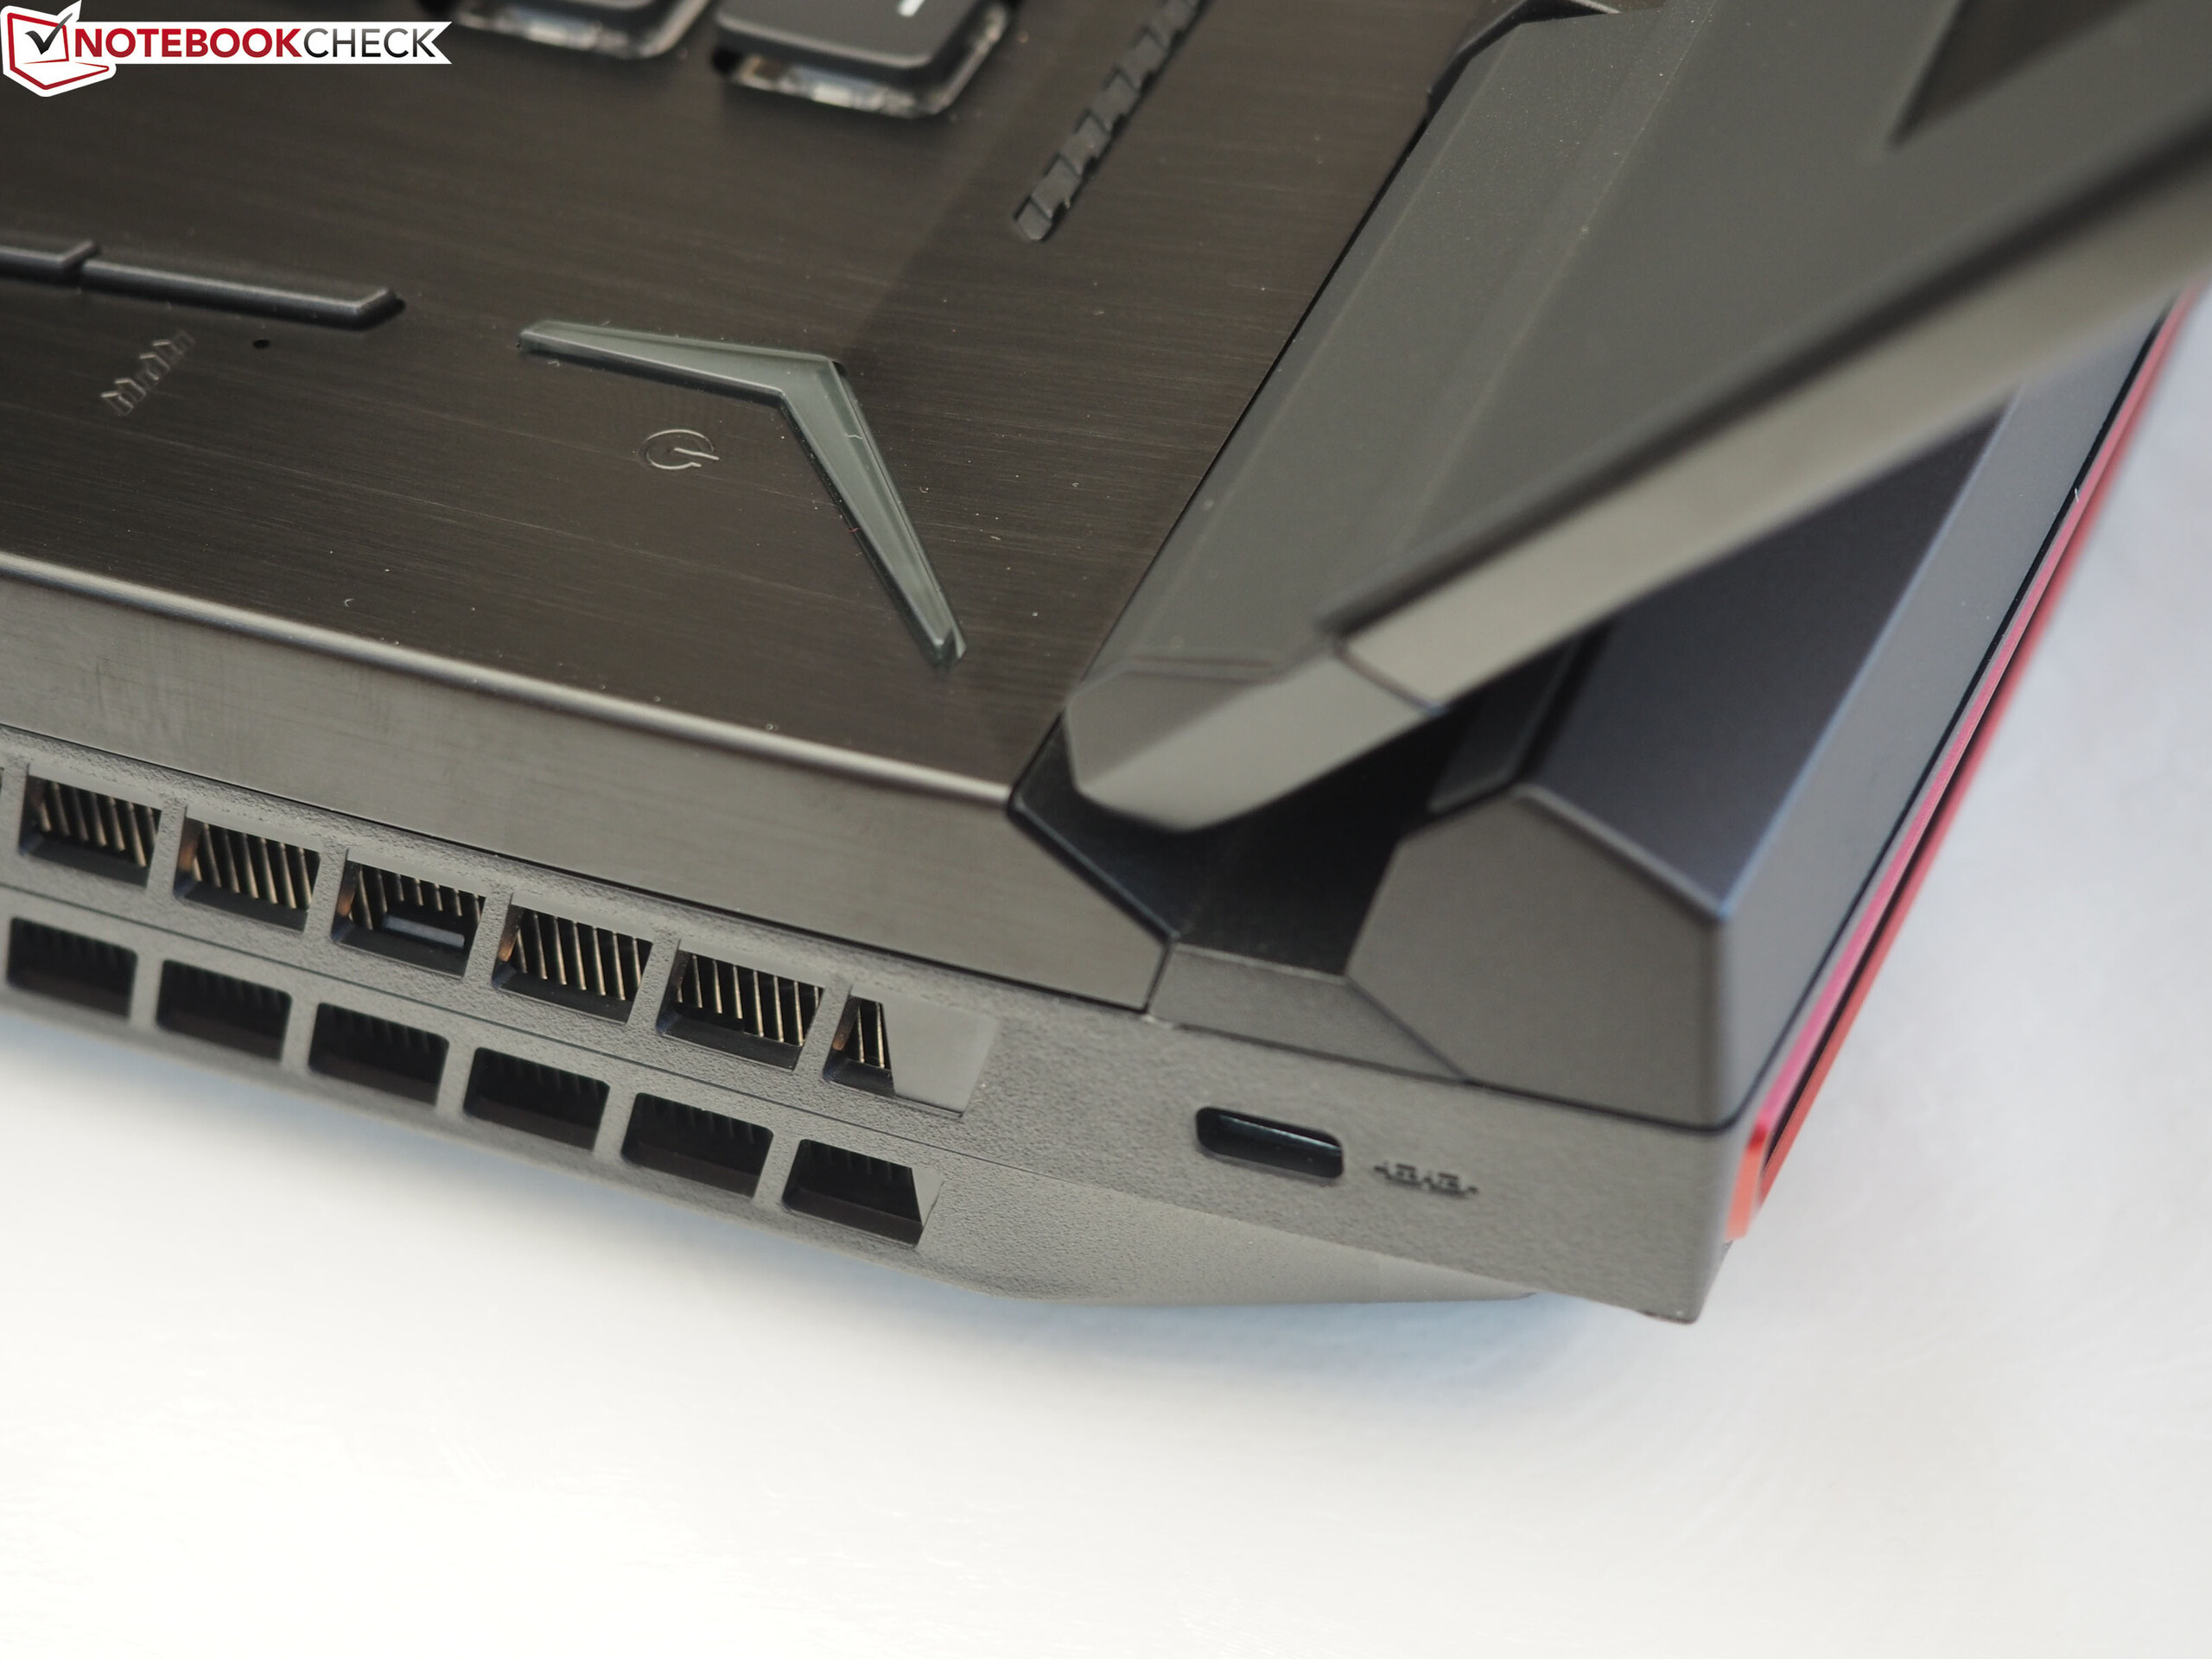
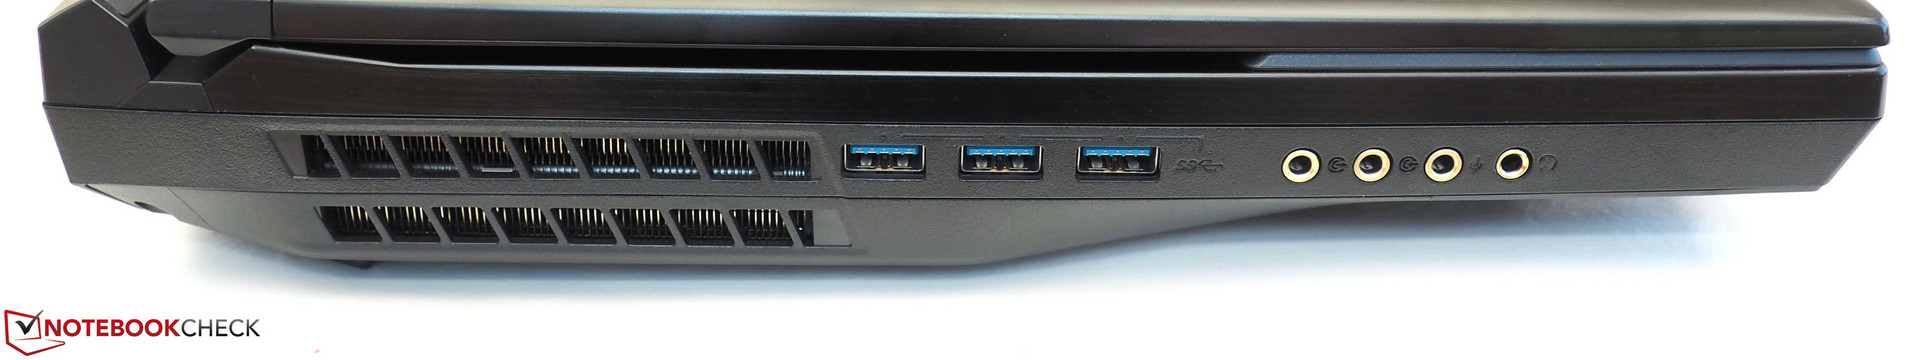
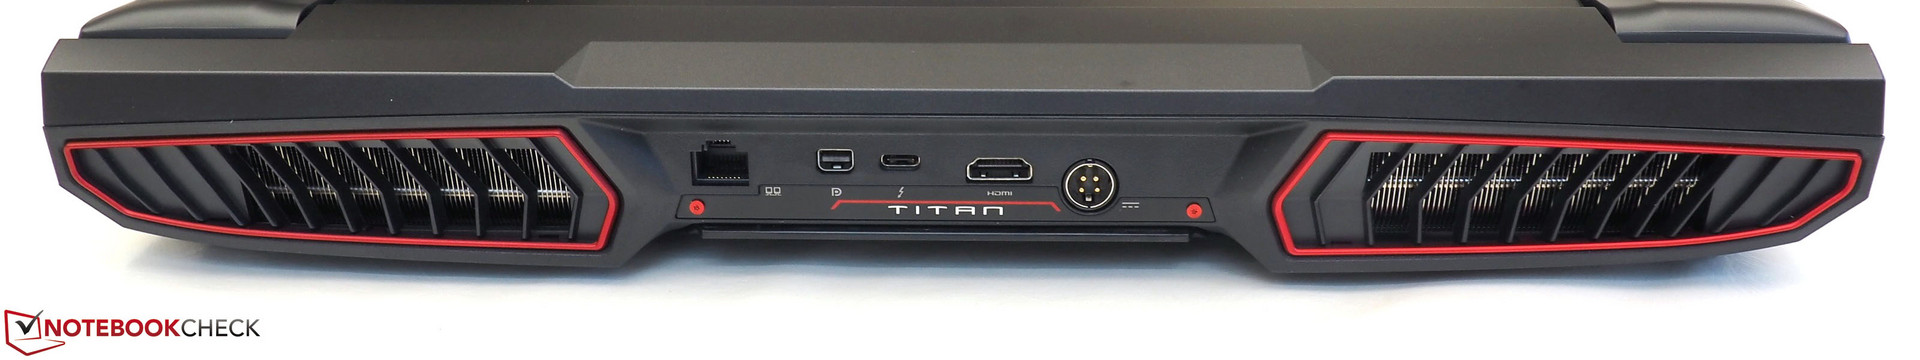
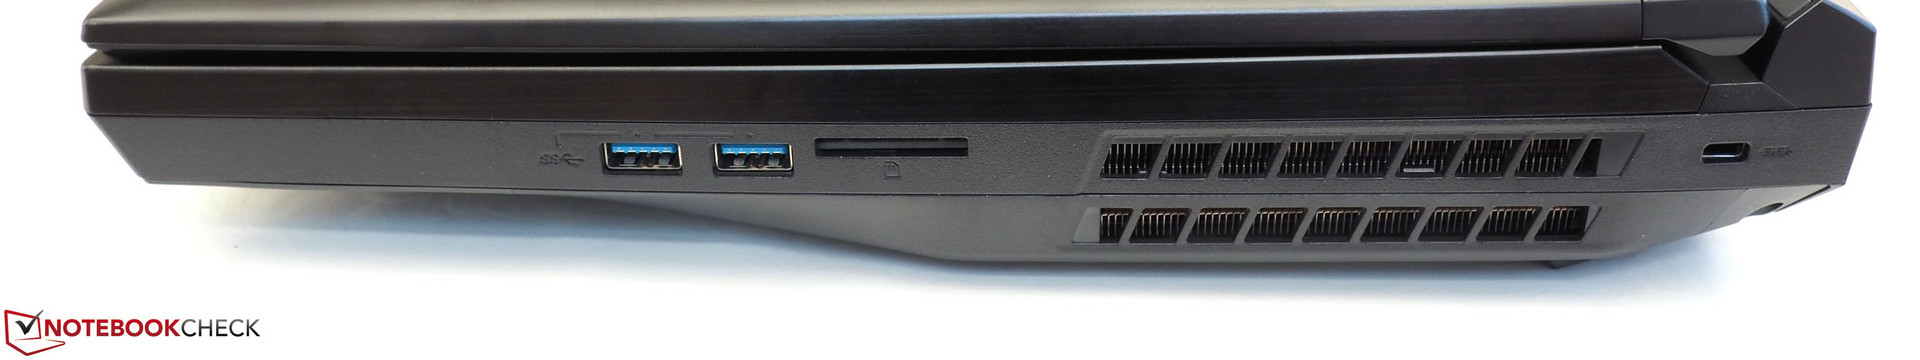
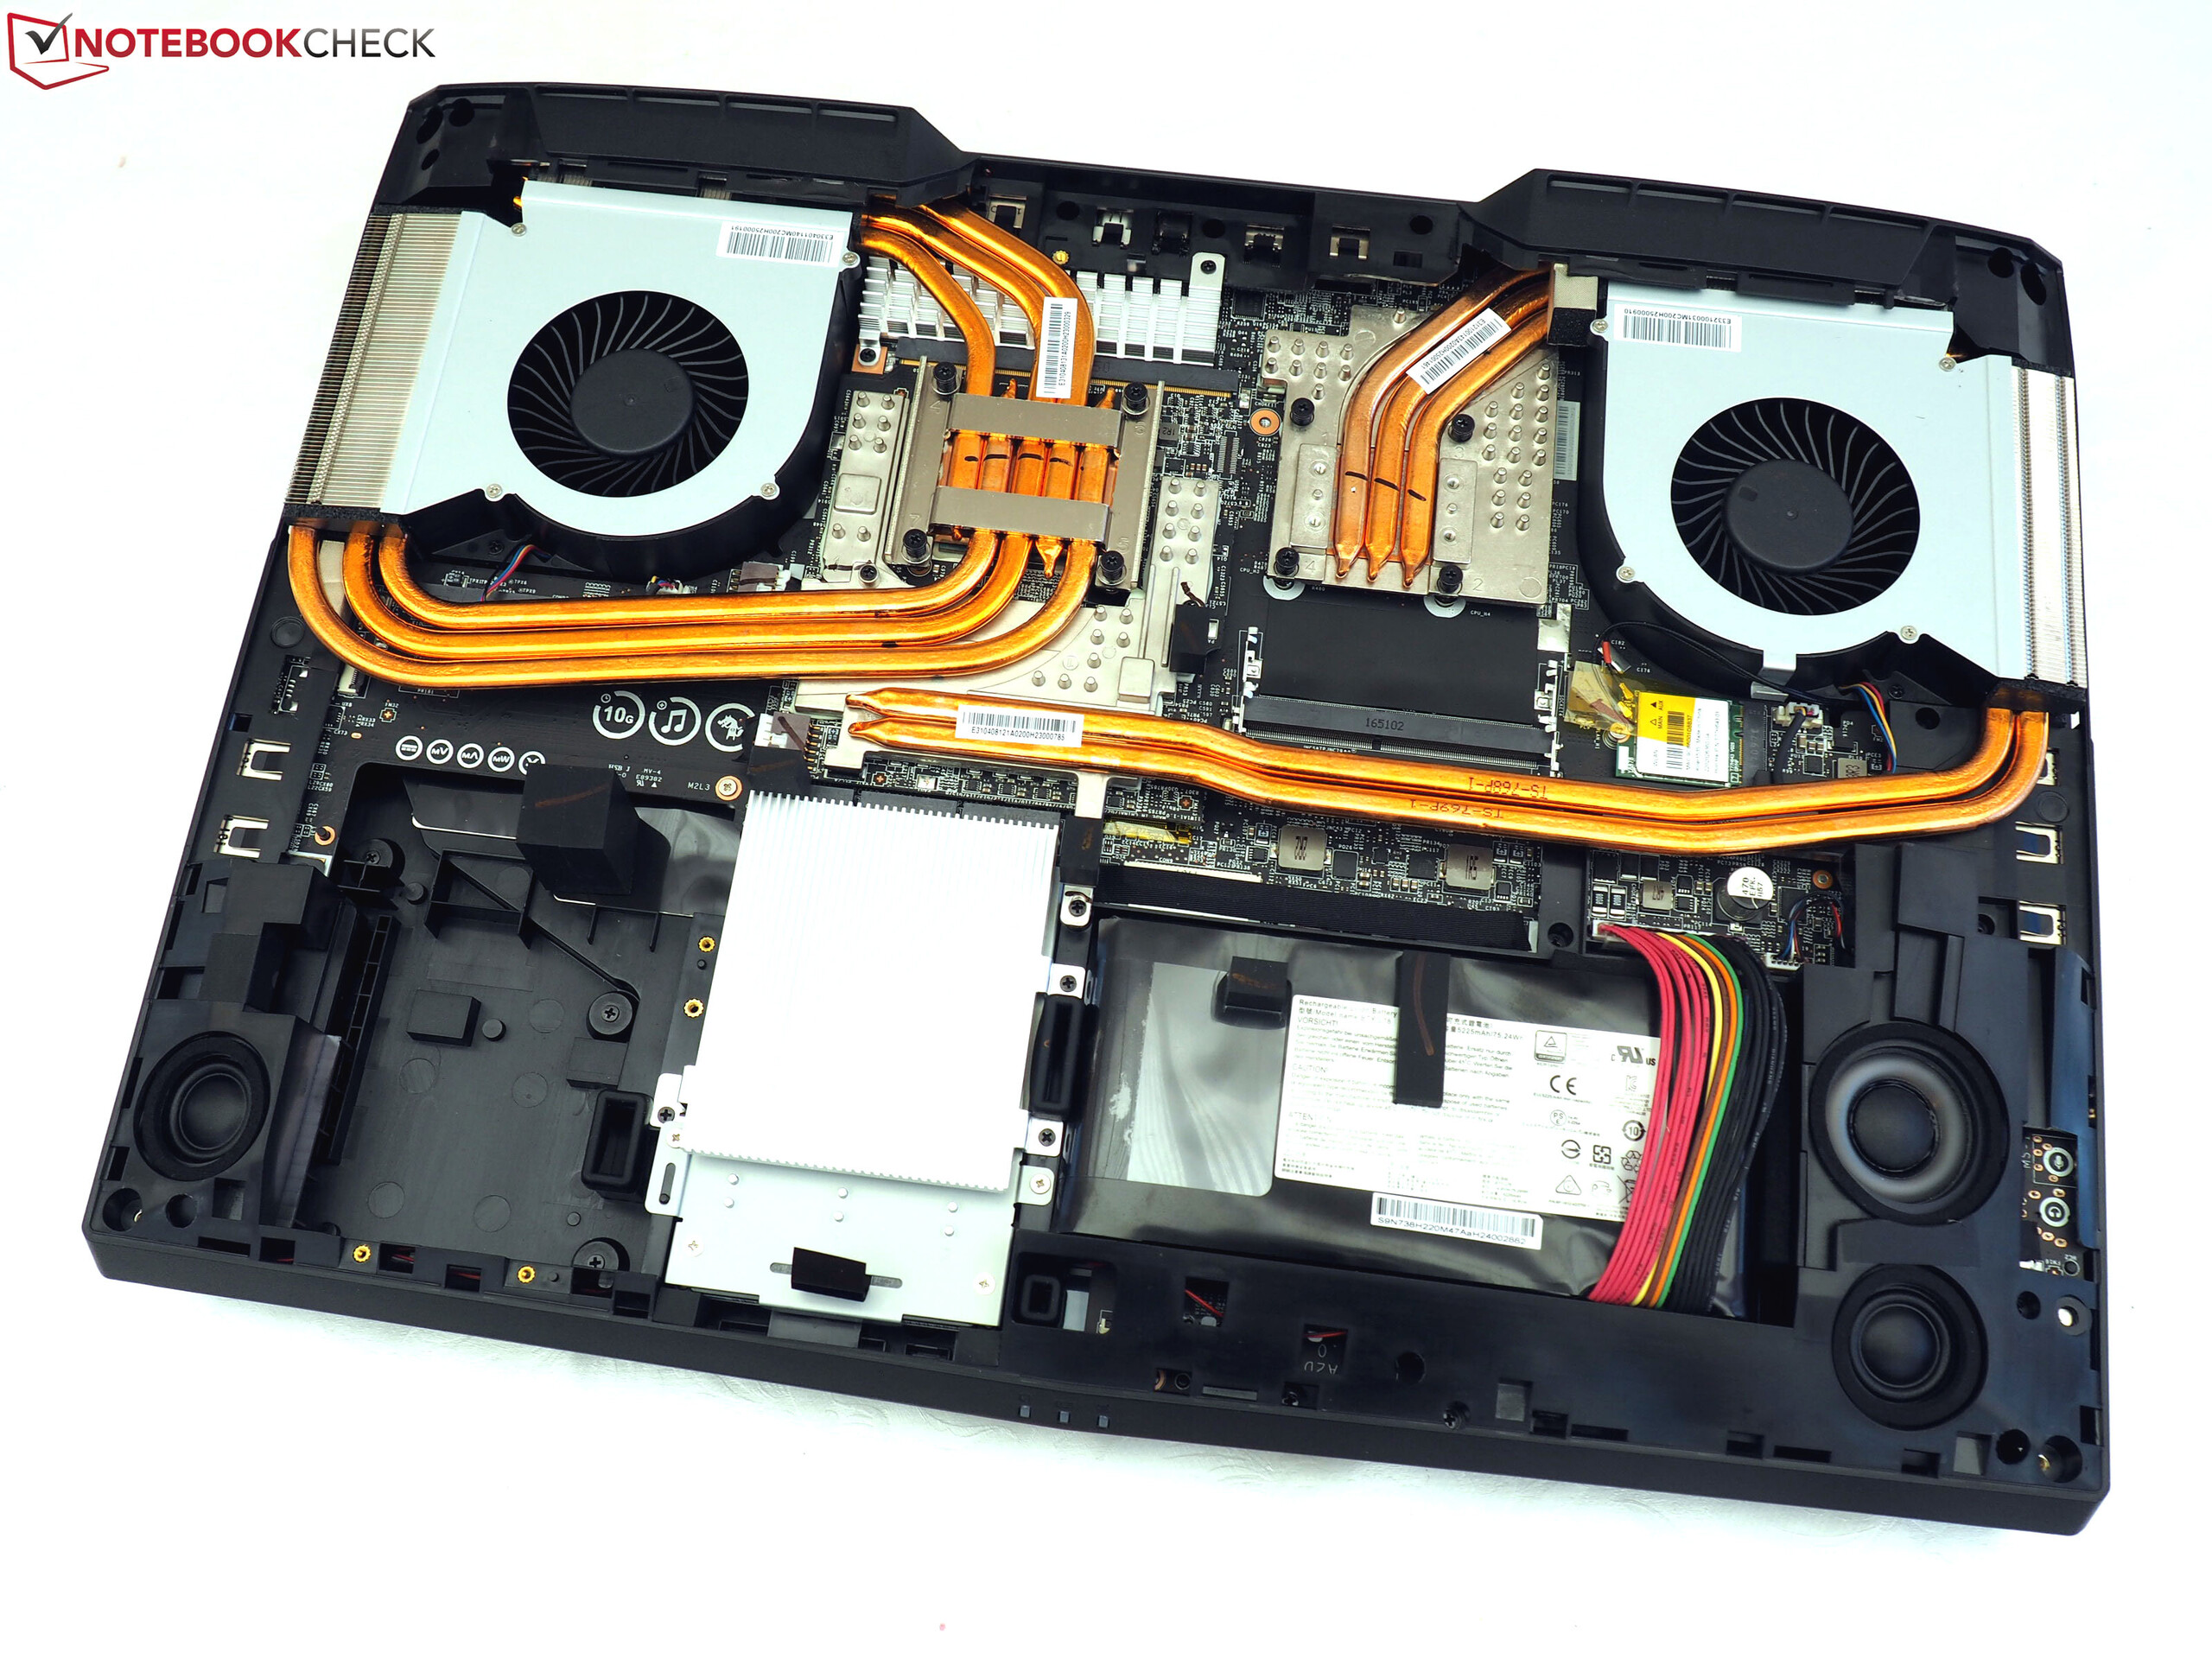
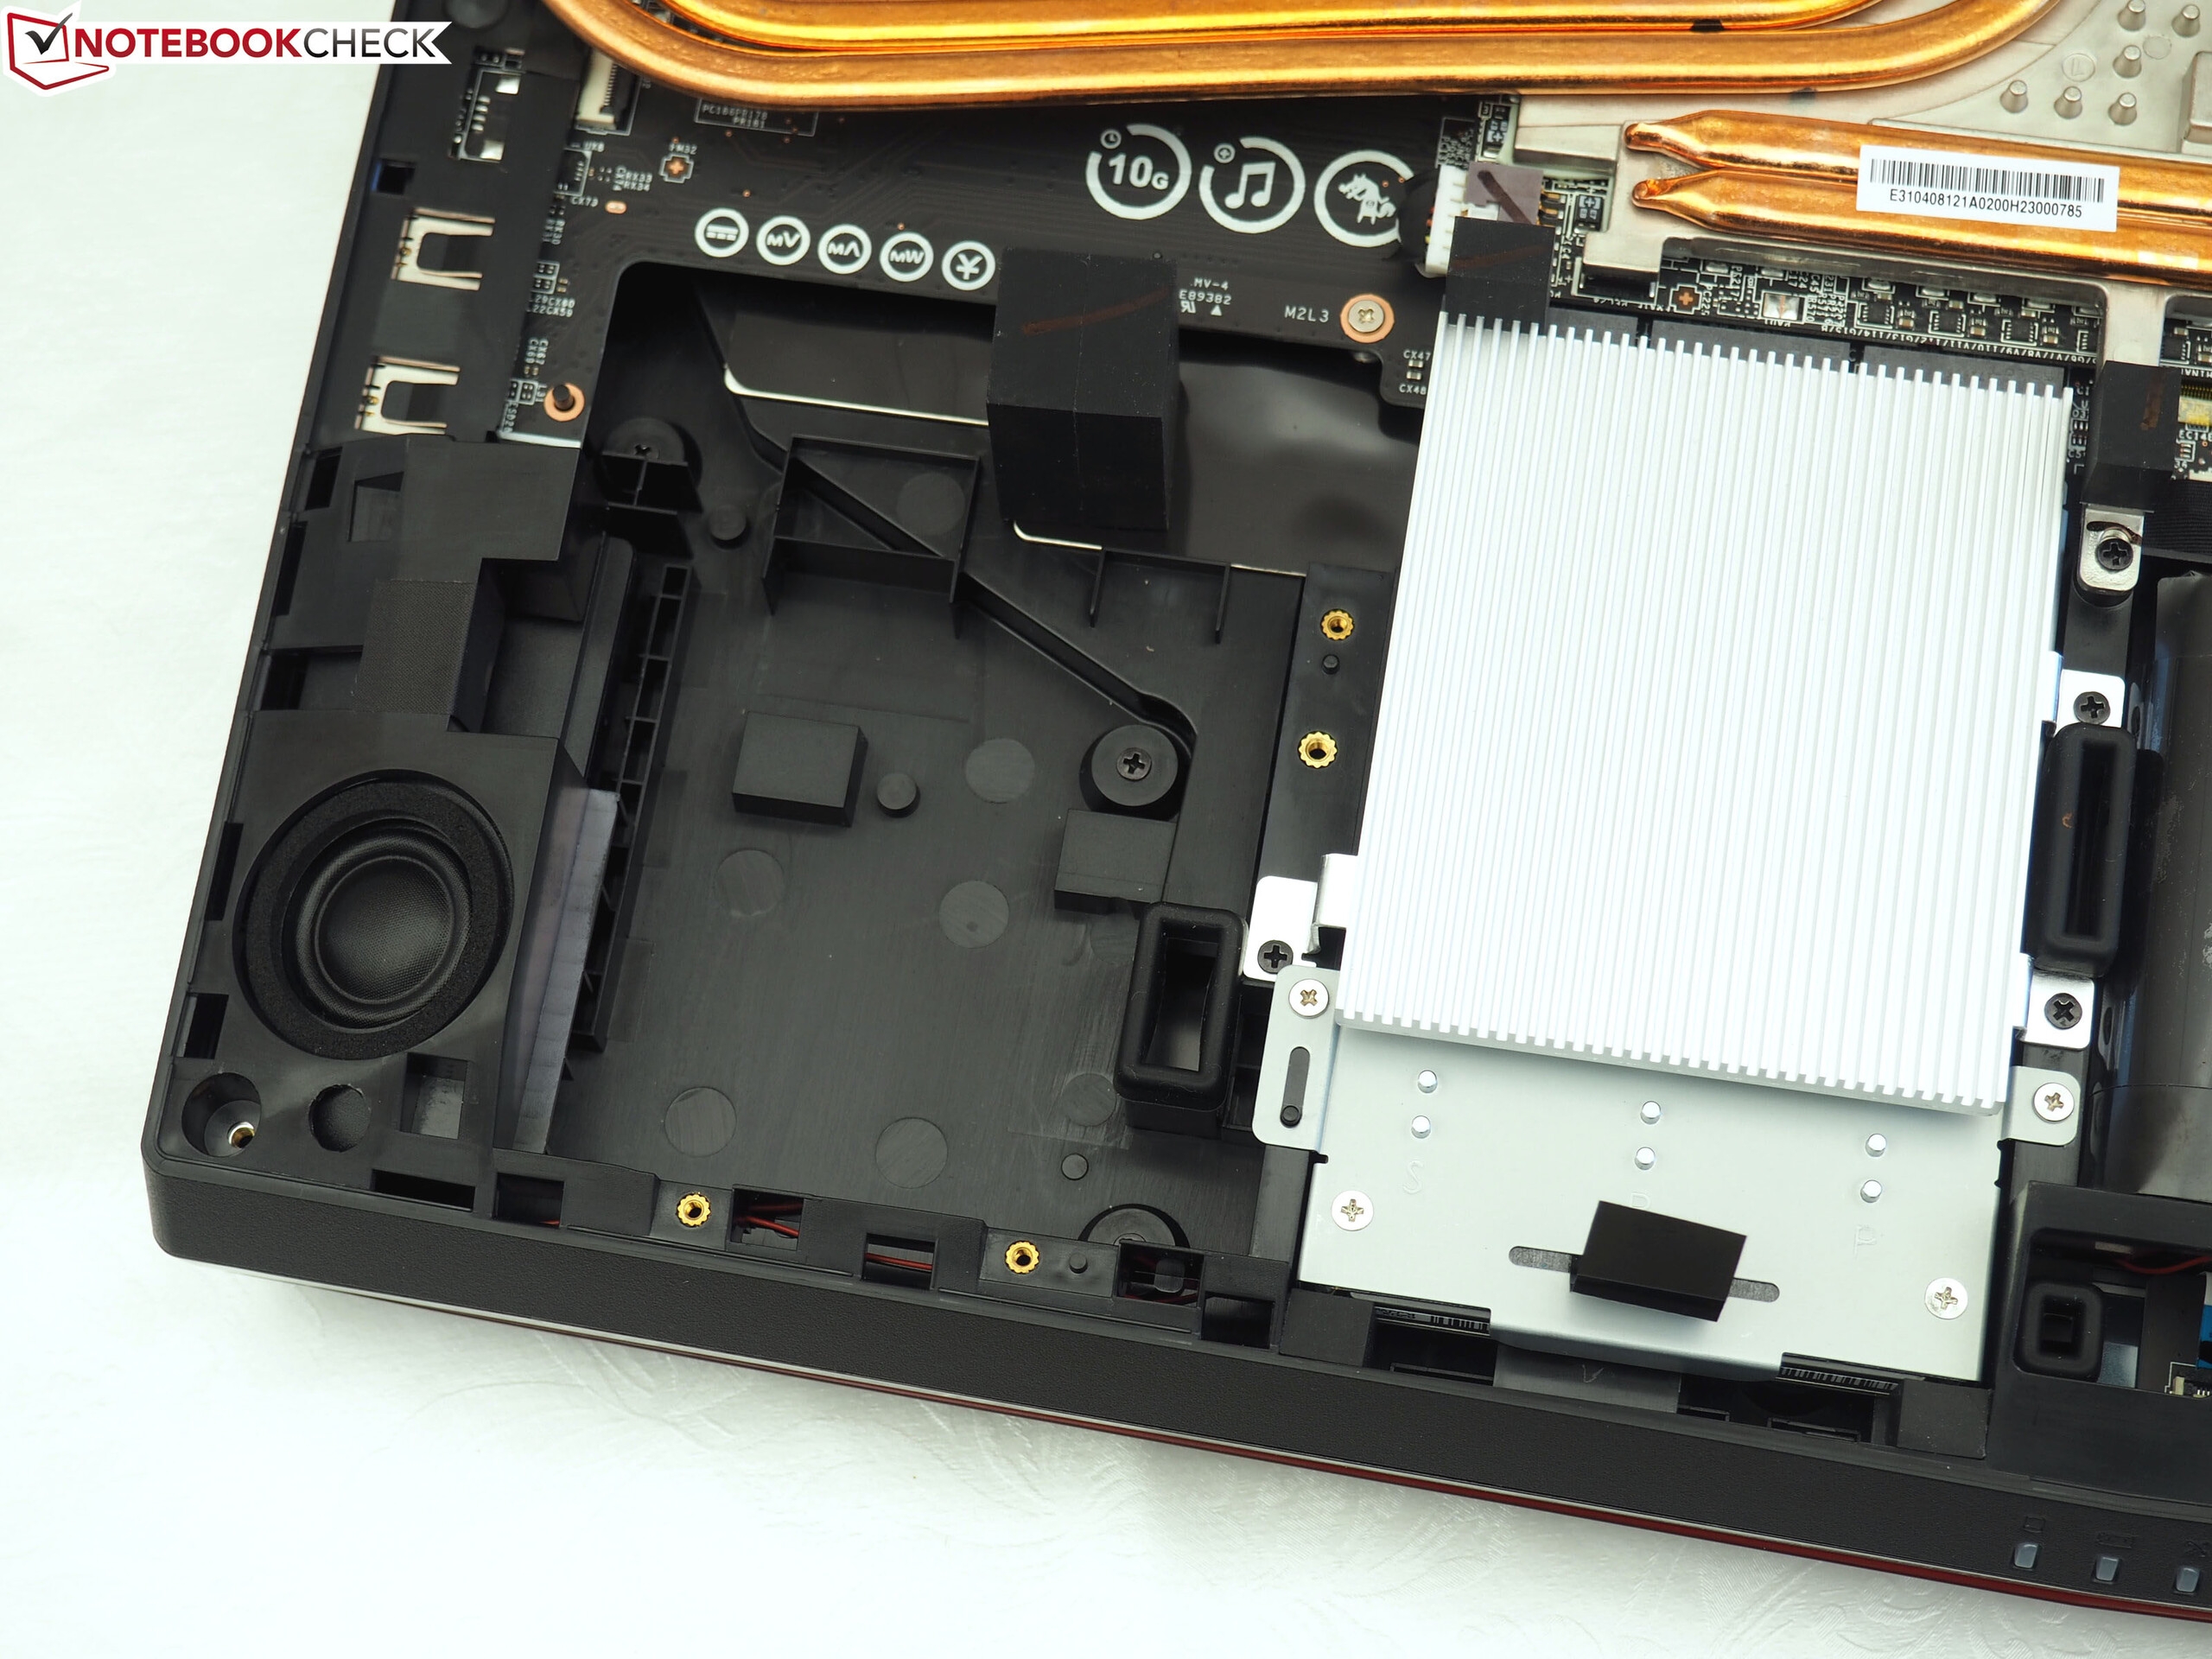
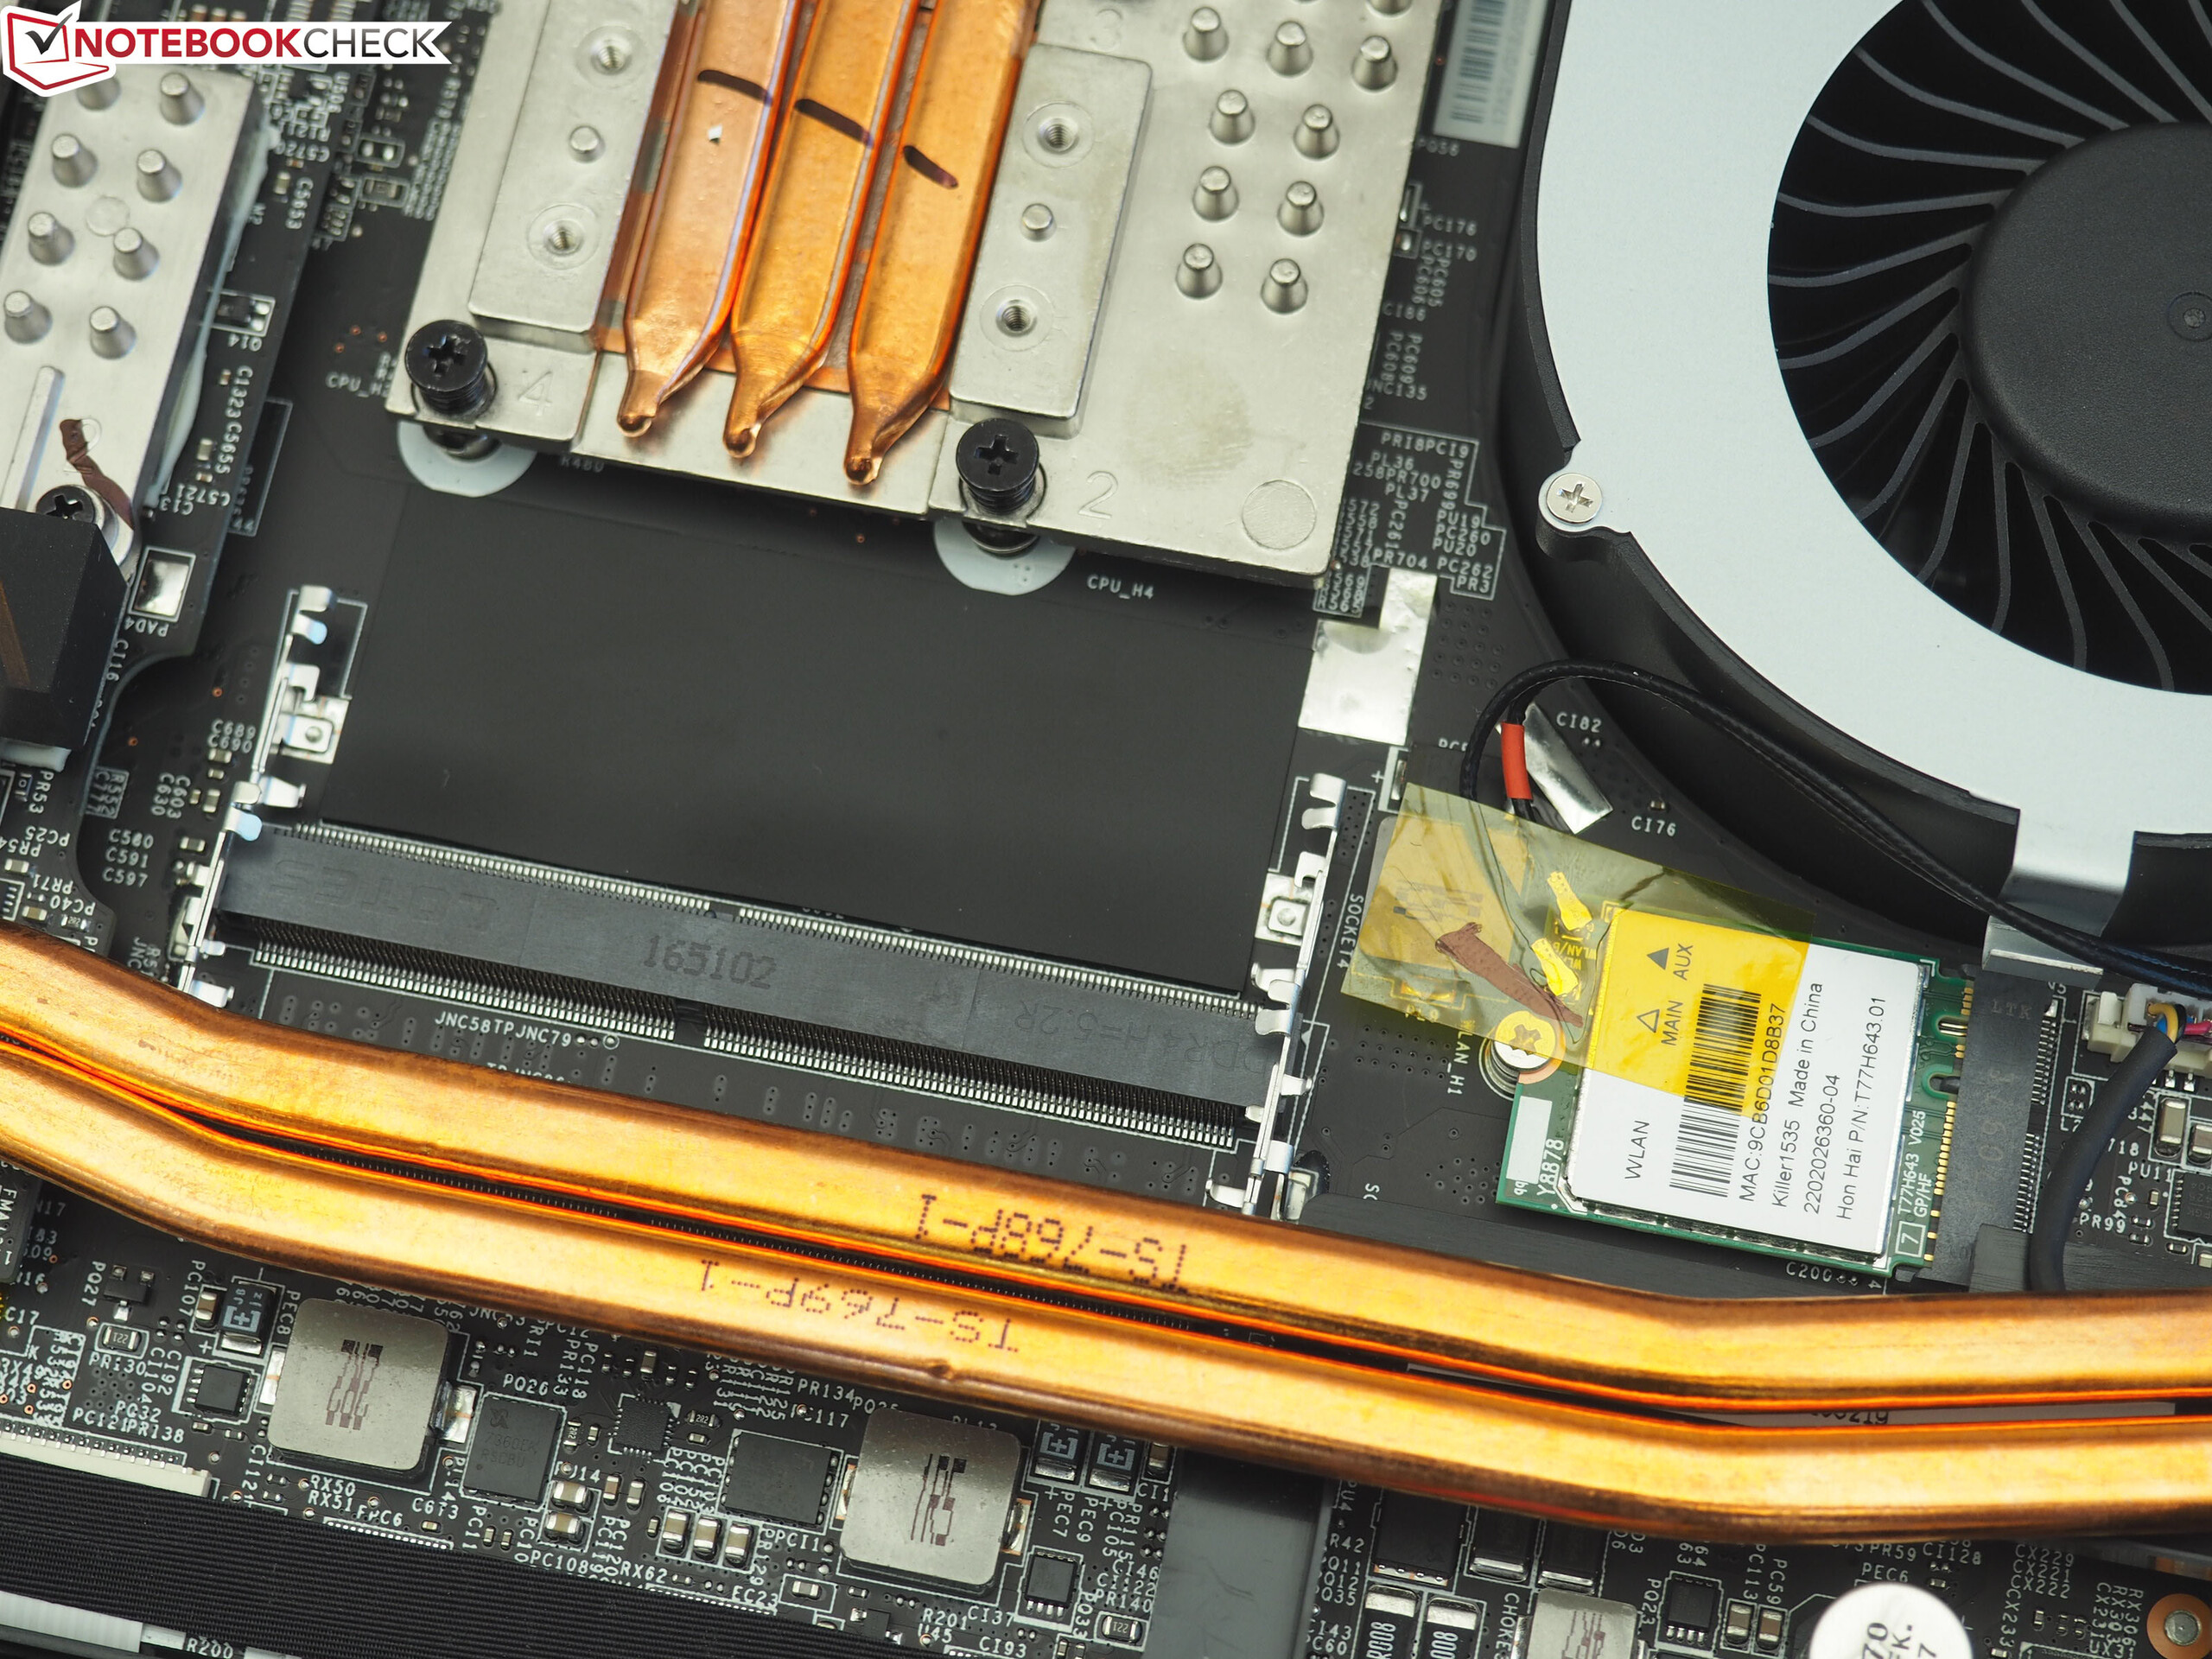
Outros componentes que já eram convincentes no GT73VR foram adotados sem muita modificação. Por exemplo, as excelentes opções de manutenção (4x RAM, 4 dispositivos de armazenamento, GPU removível, etc.), a conectividade generosa, incluindo uma porta Thunderbolt 3 ou o painel altamente responsivo e de cores realistas de 120 Hz com suporte para G-Sync.
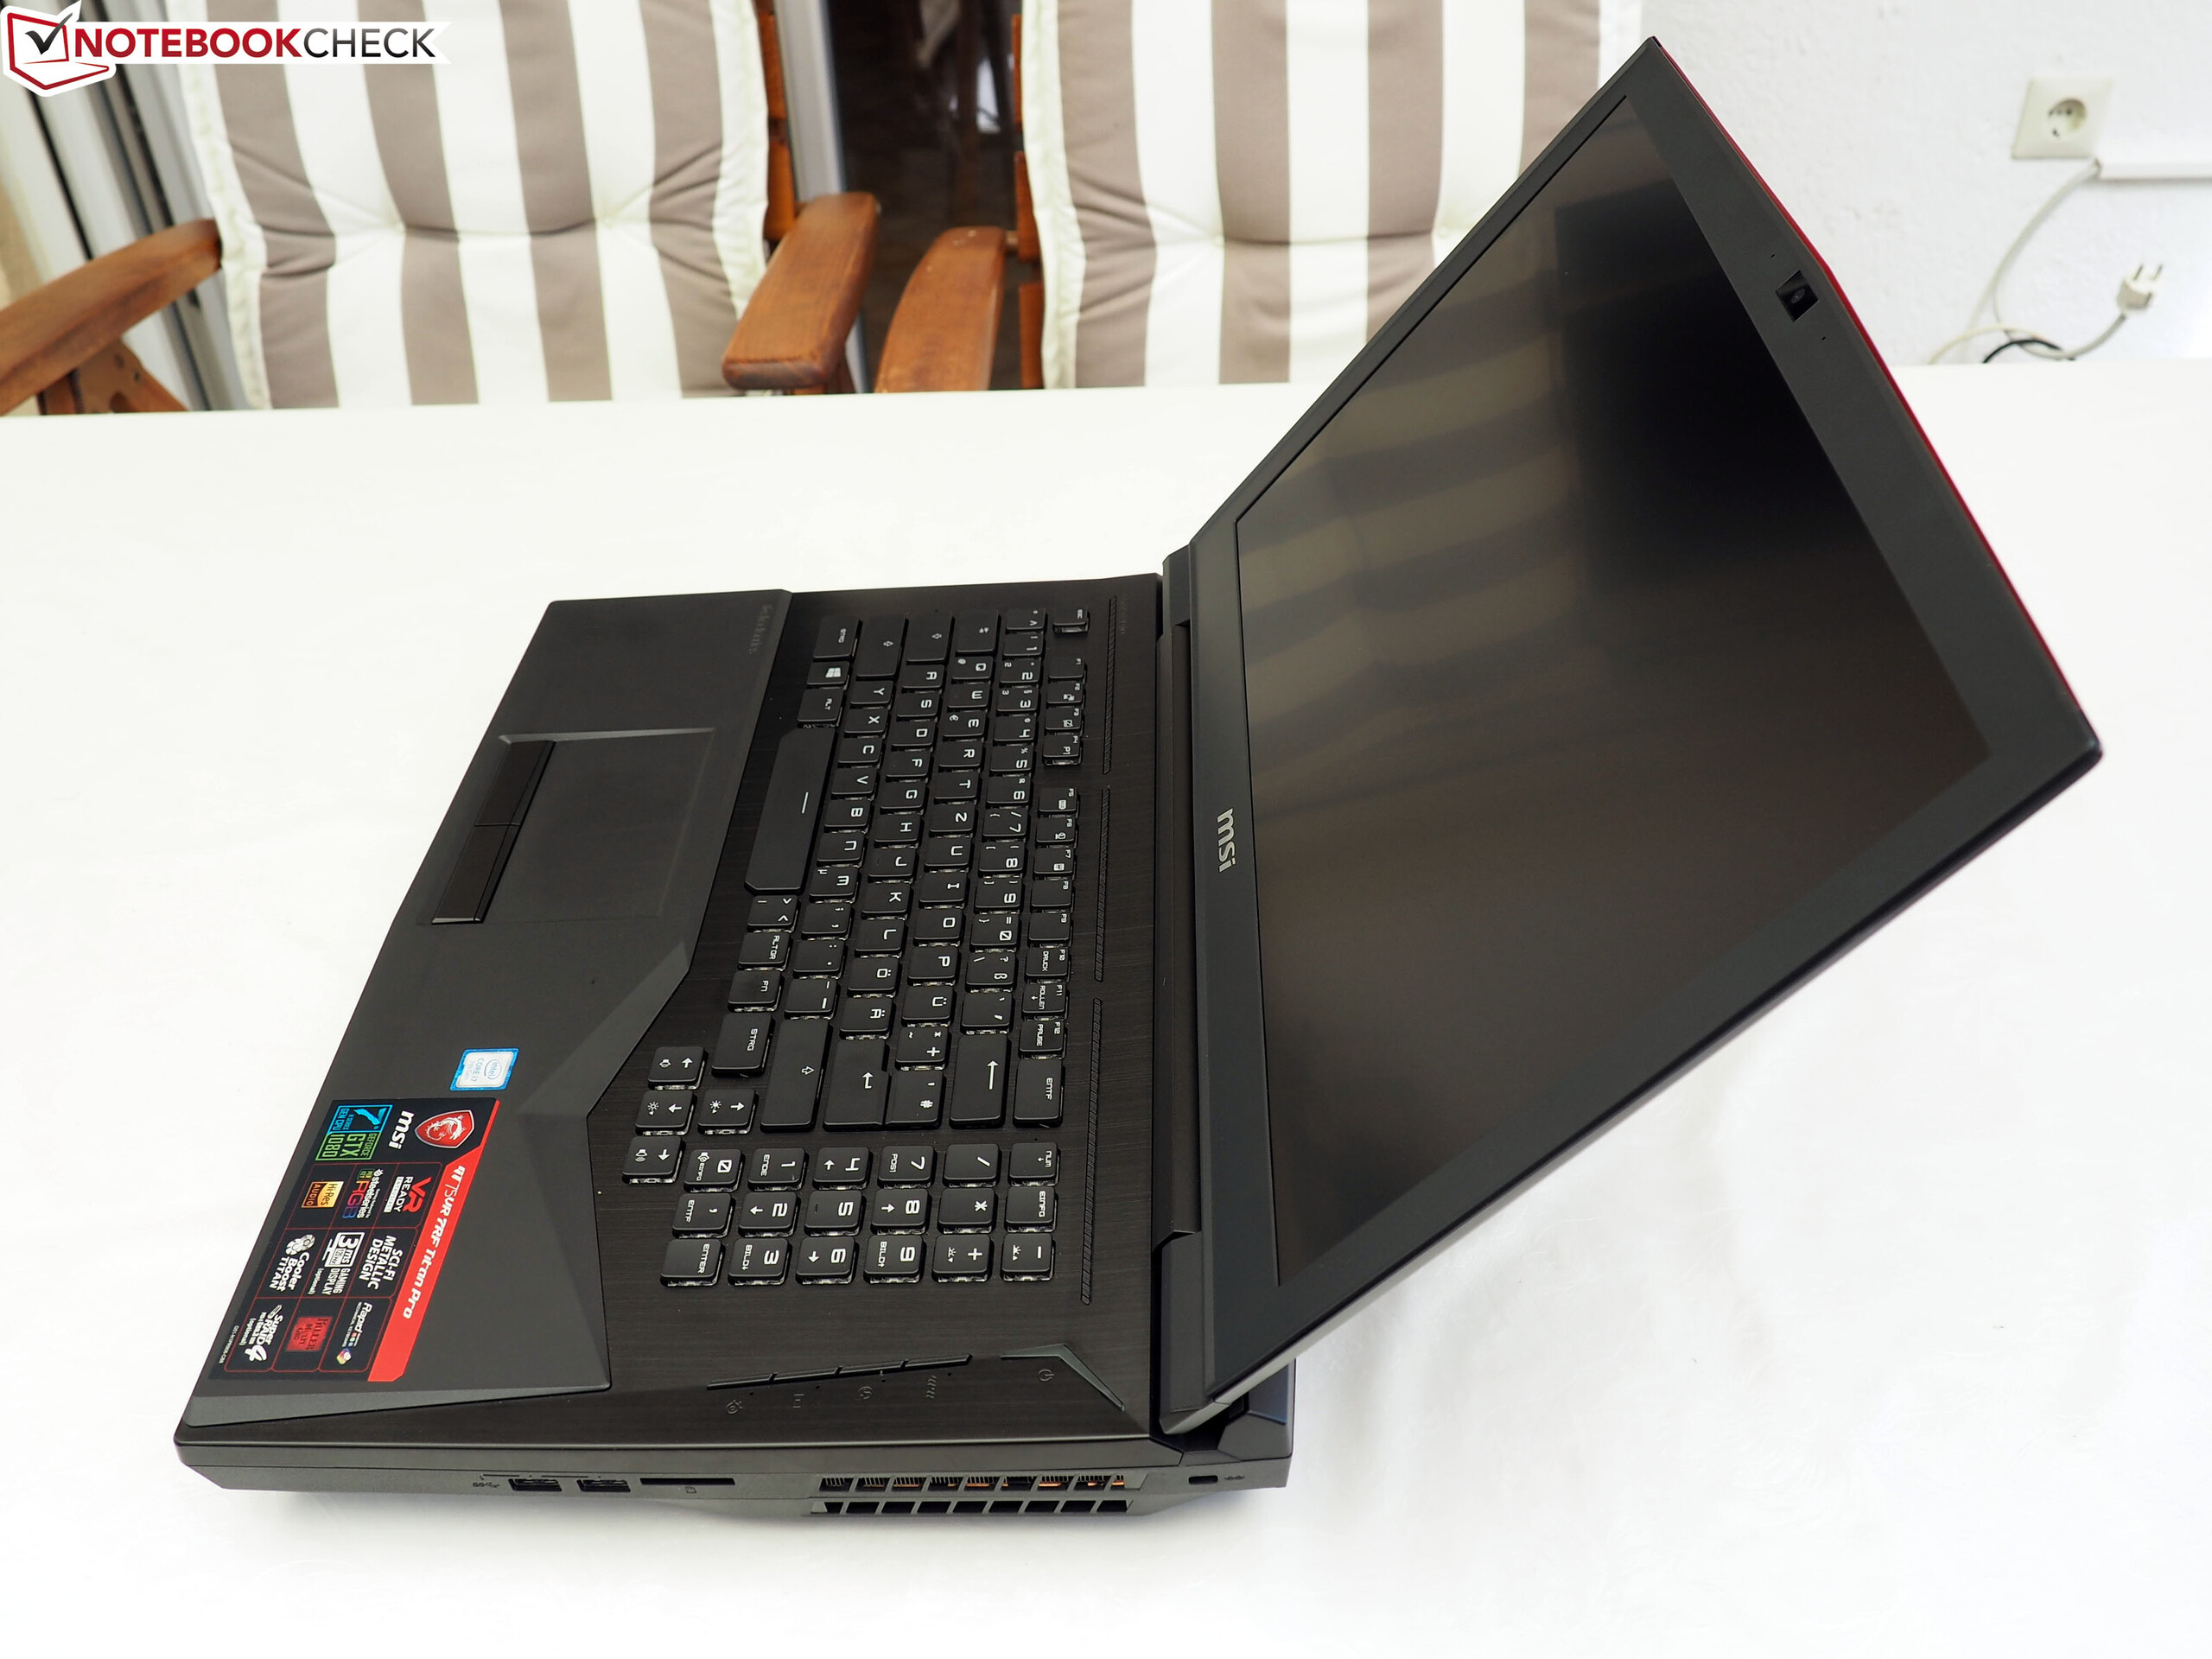
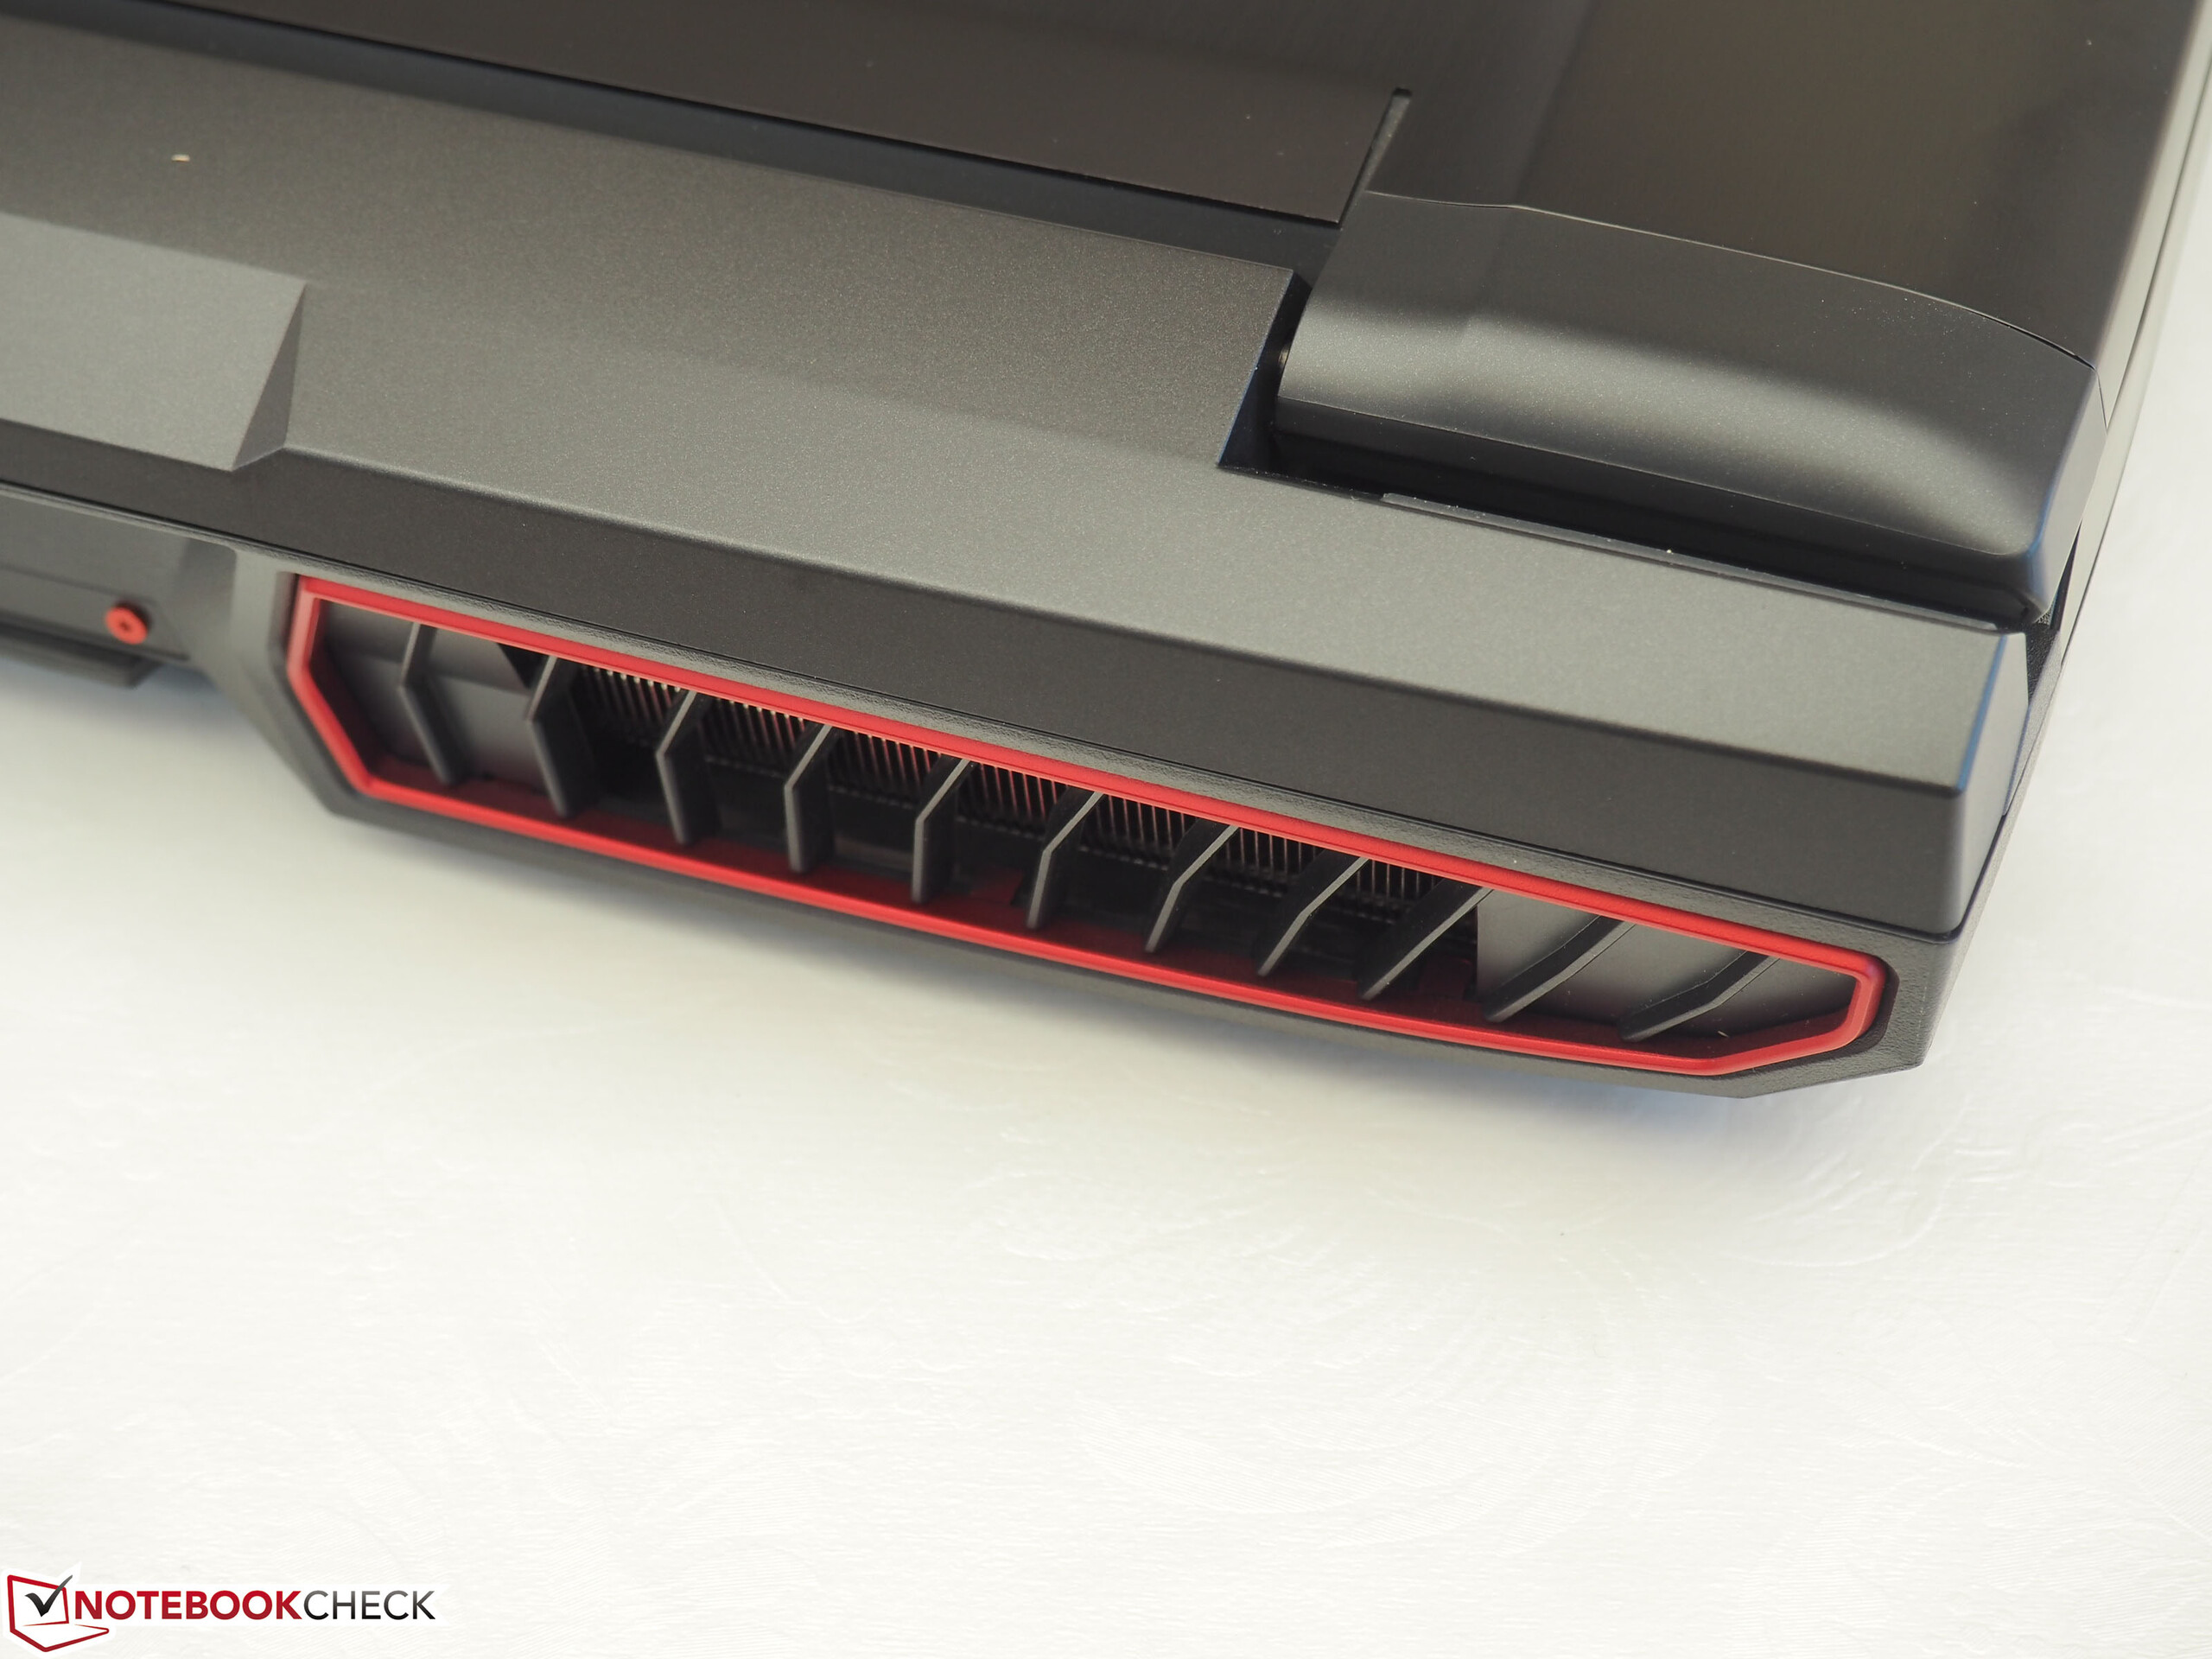
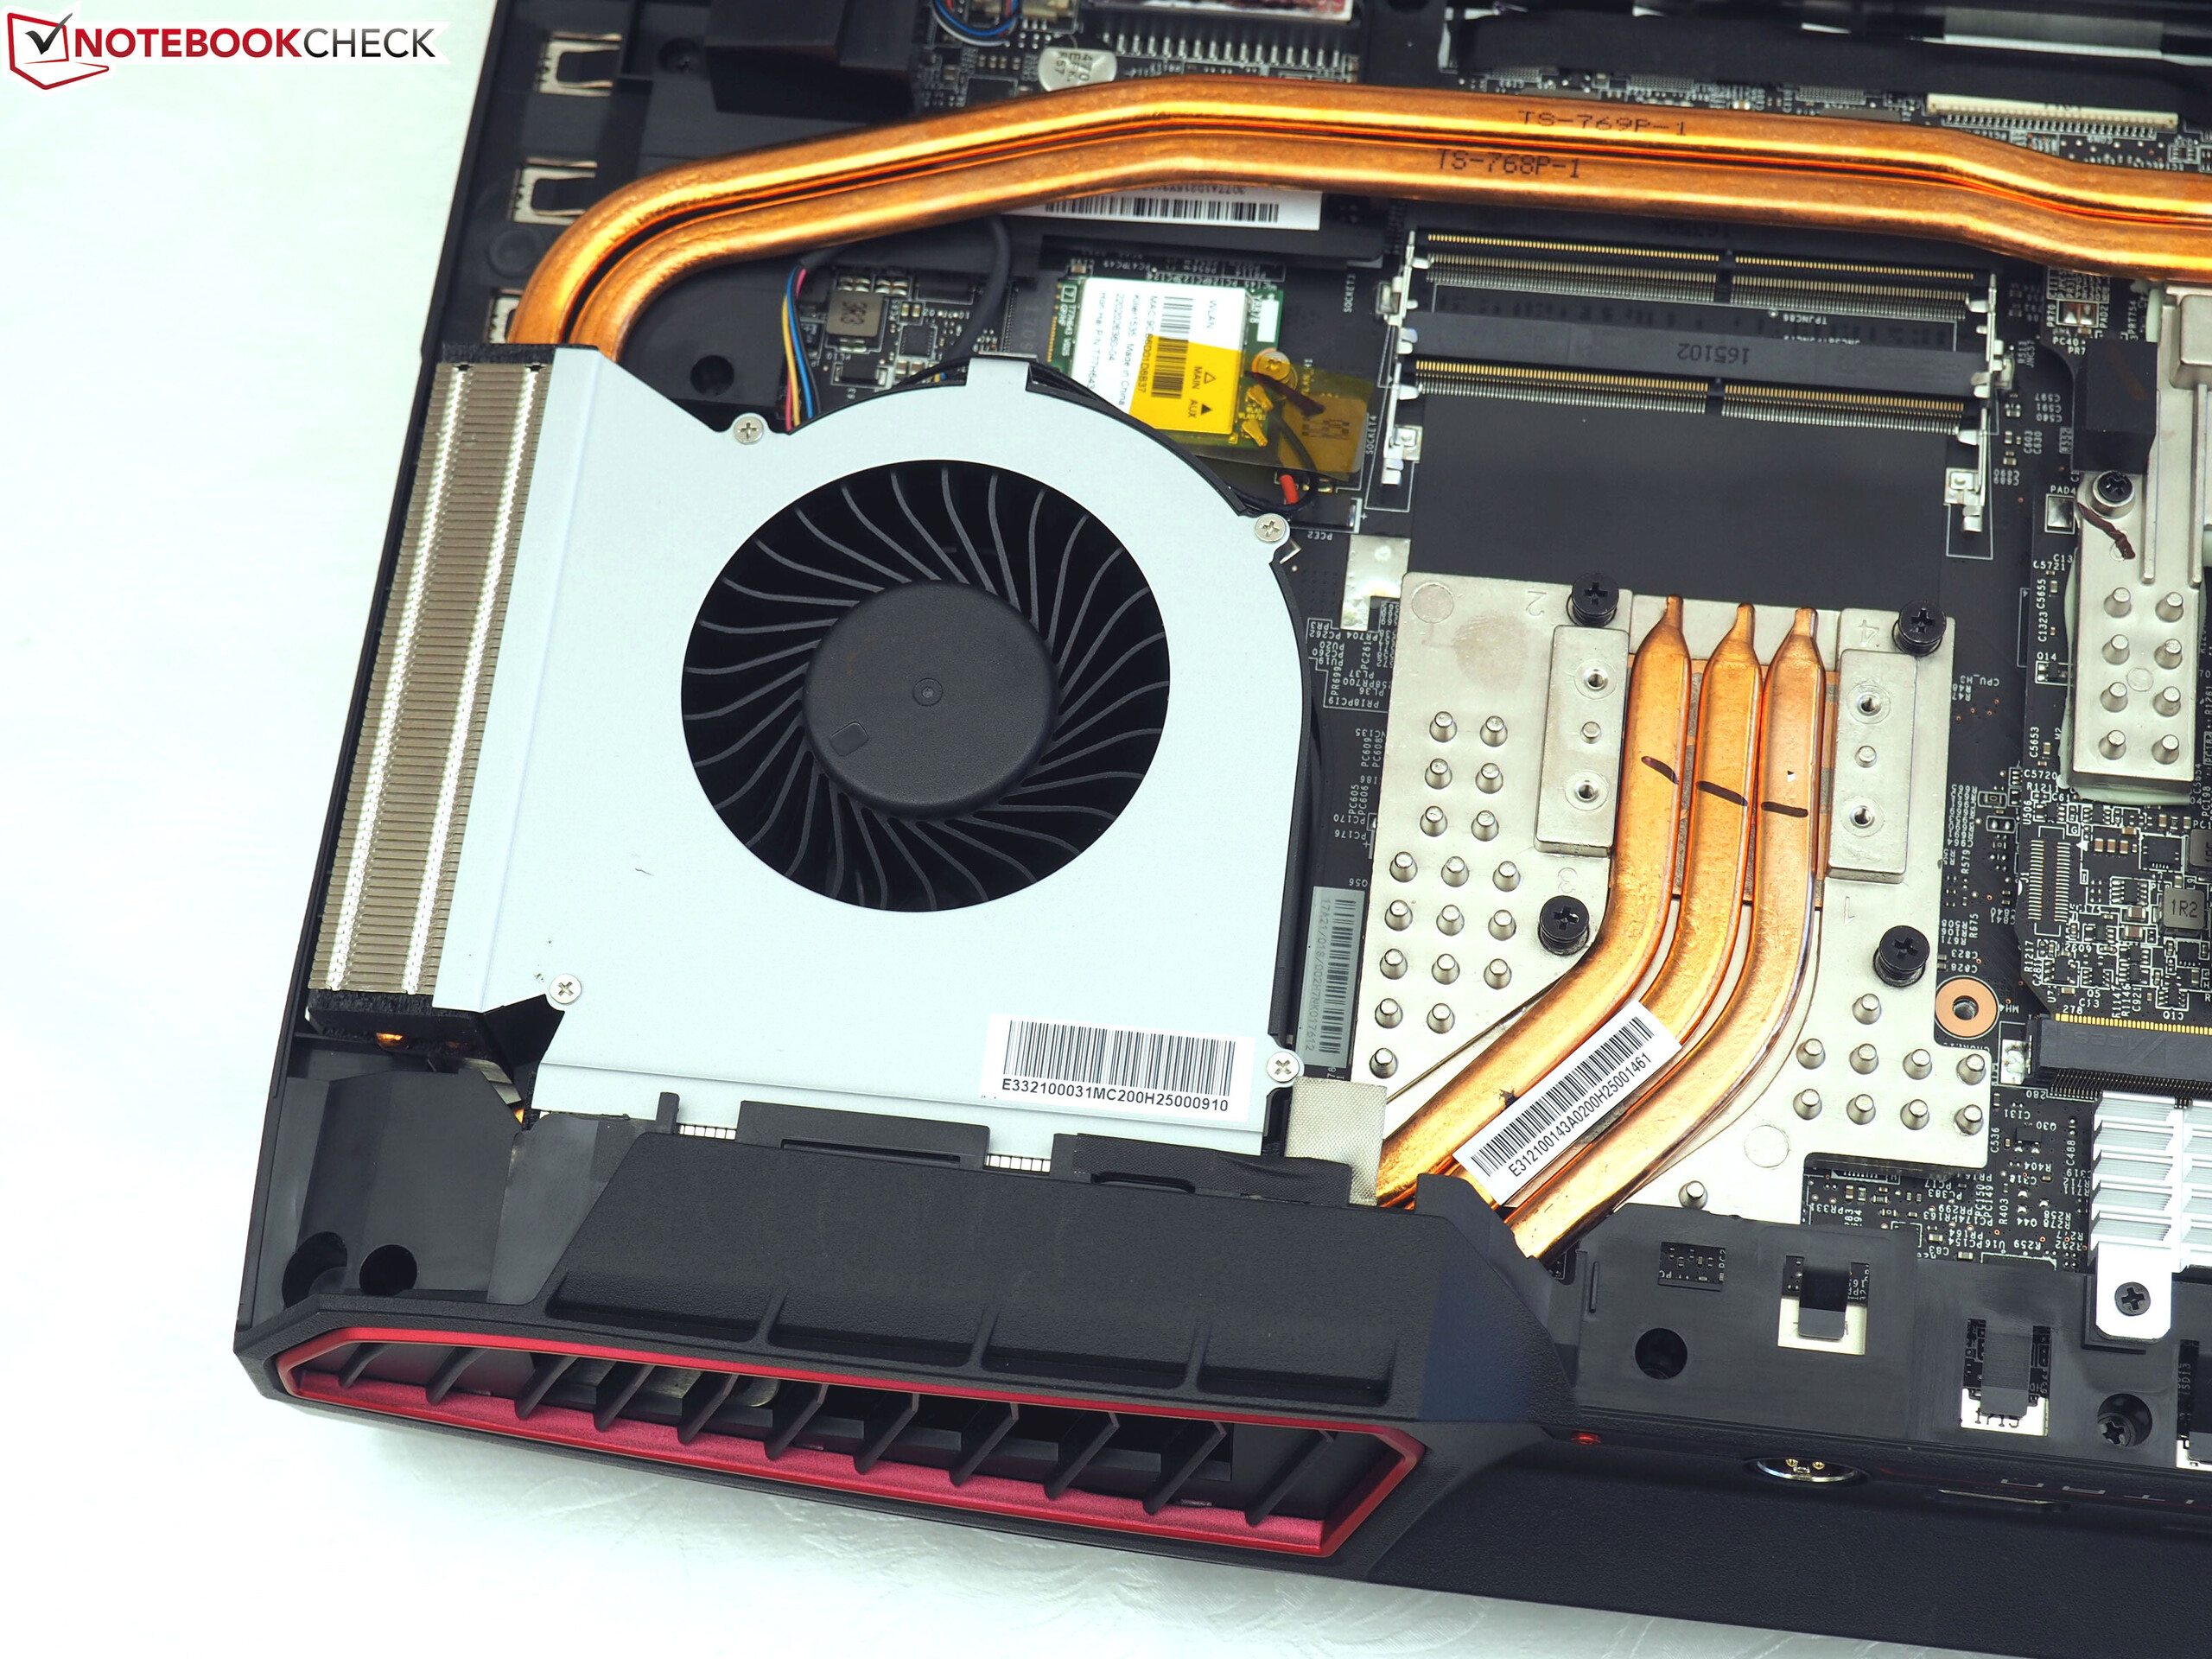
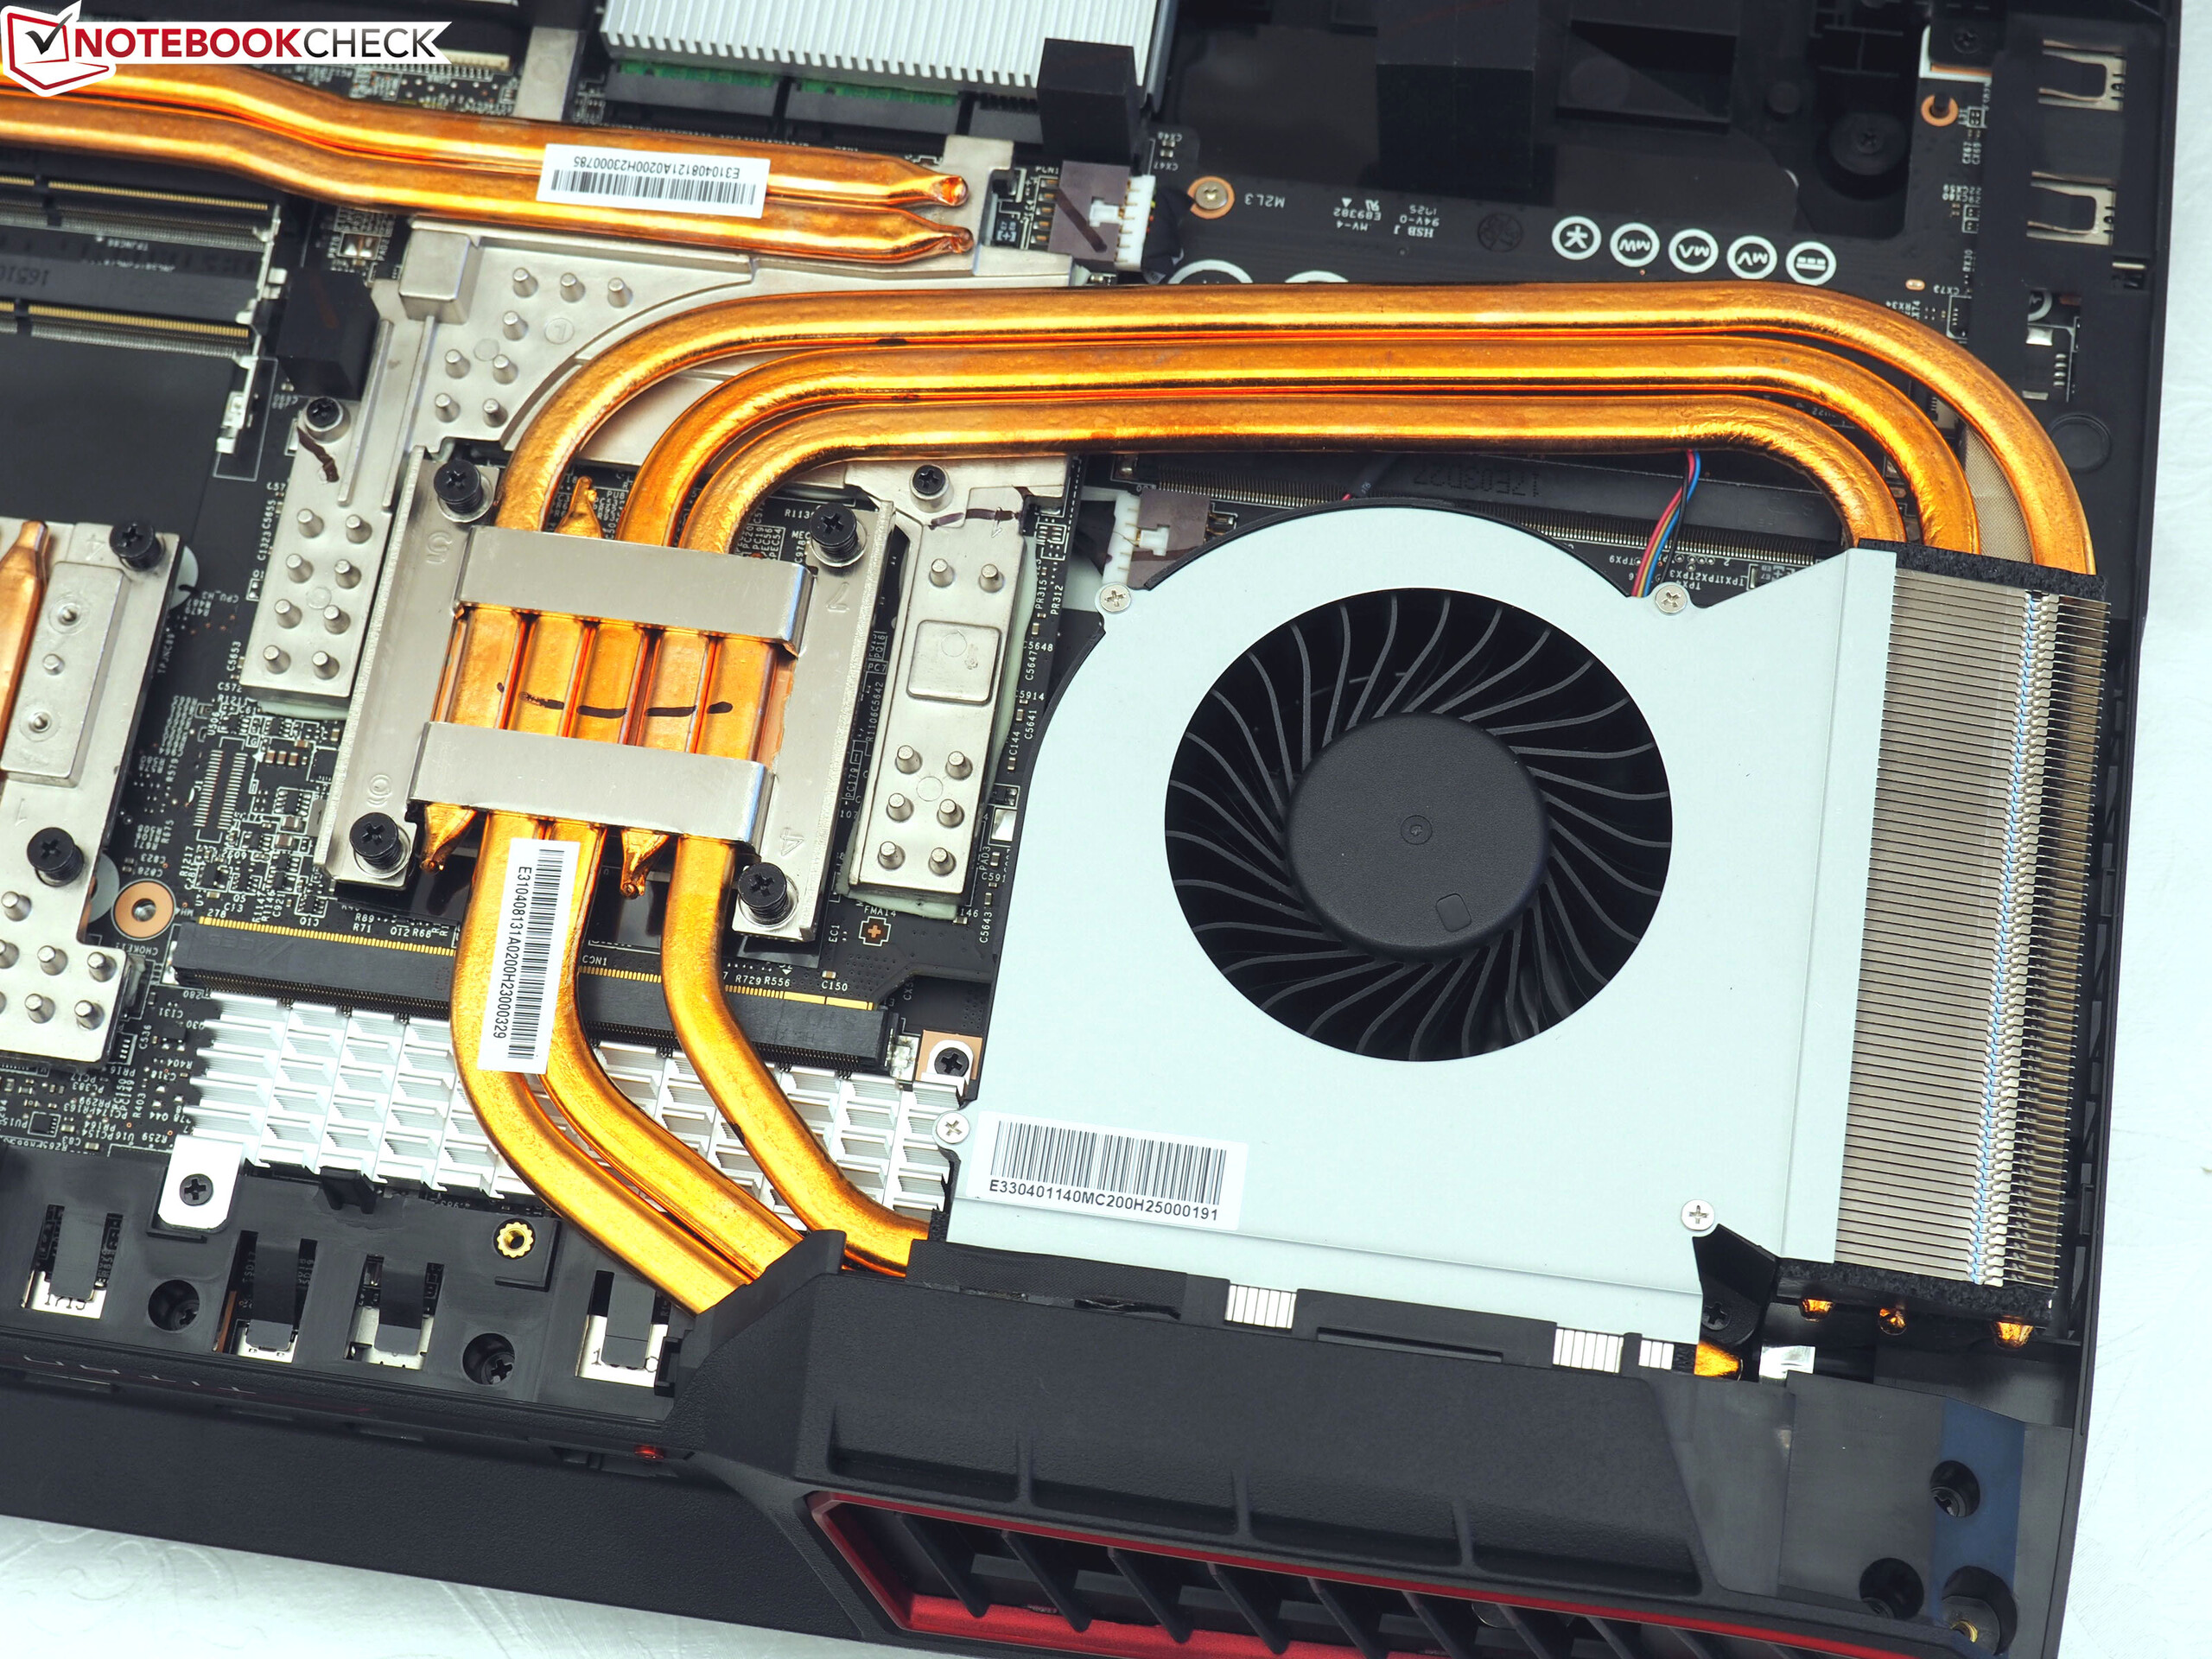
Infelizmente, regressões que nem sempre entendemos, são vistas em algumas áreas. Por que o touchpad tem que ser emborrachado (os dedos rapidamente ficam presos) é tão intrigante como o nível de ruído extremamente elevado das ventoinhas no modo 3D, que é ainda mais alto do que o GT73VR, apesar de um chassi mais grosso e maior peso. Por isso os usuários sensíveis ao ruído devem evitar o GT75VR. O mesmo é verdade para os usuários que estão frequentemente em movimento e não querem sempre reiniciar para mudar da Nvidia para a GPU da Intel para ter uma duração útil da bateria.
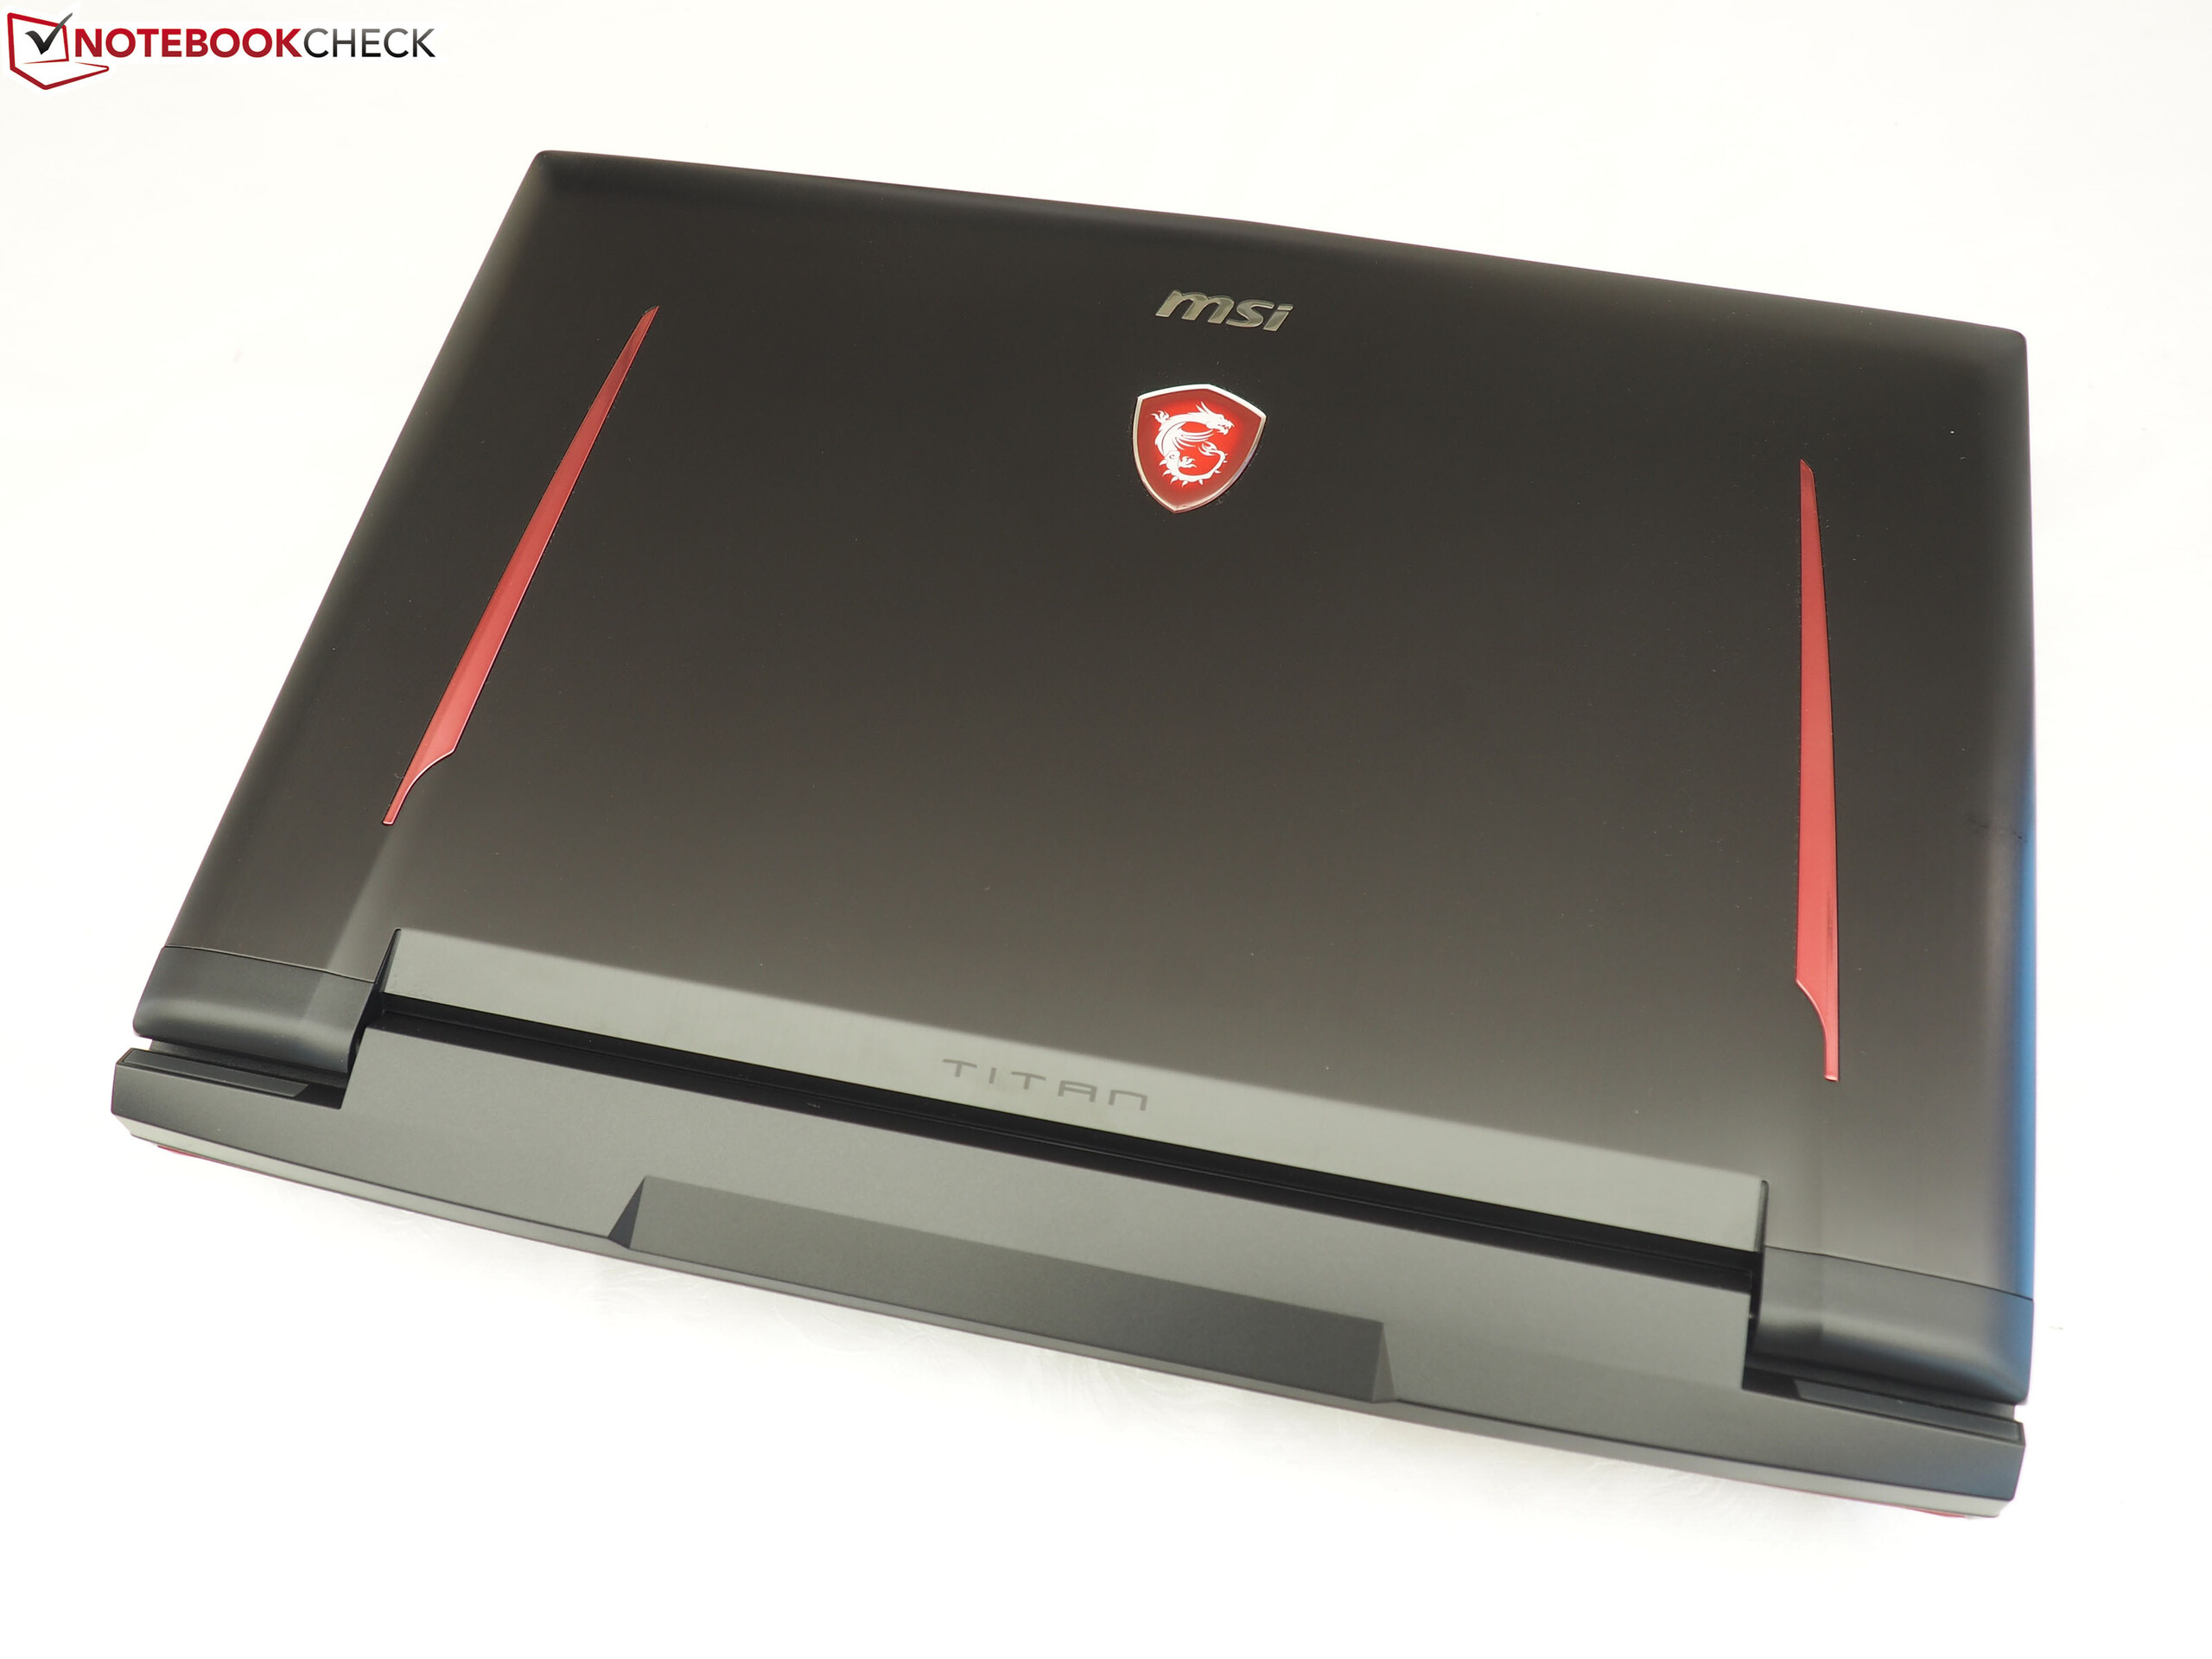
A máquina de 17-polegadas continua sendo um substituto de desktop puro que somente se vê bem no escritório em casa.
O ROG Zeyphrus GX501 da Asus, por exemplo, demonstra ser mais fino e mais silencioso é possível (com desempenho limitado). Os compradores que não tenham problema com as carcaças massivas também podem optar pelo Acer Predator 17 X, Alienware 17 R4, Asus G701VIK ou Schenker XMG U727 como alternativas similares. Eles também colheram em uma classificação similarmente alta no teste (85 a 88%). No entanto, eles não têm um teclado mecânico.
MSI GT75VR 7RF-012 Titan Pro
- 08/08/2017 v6 (old)
Florian Glaser
Price comparison