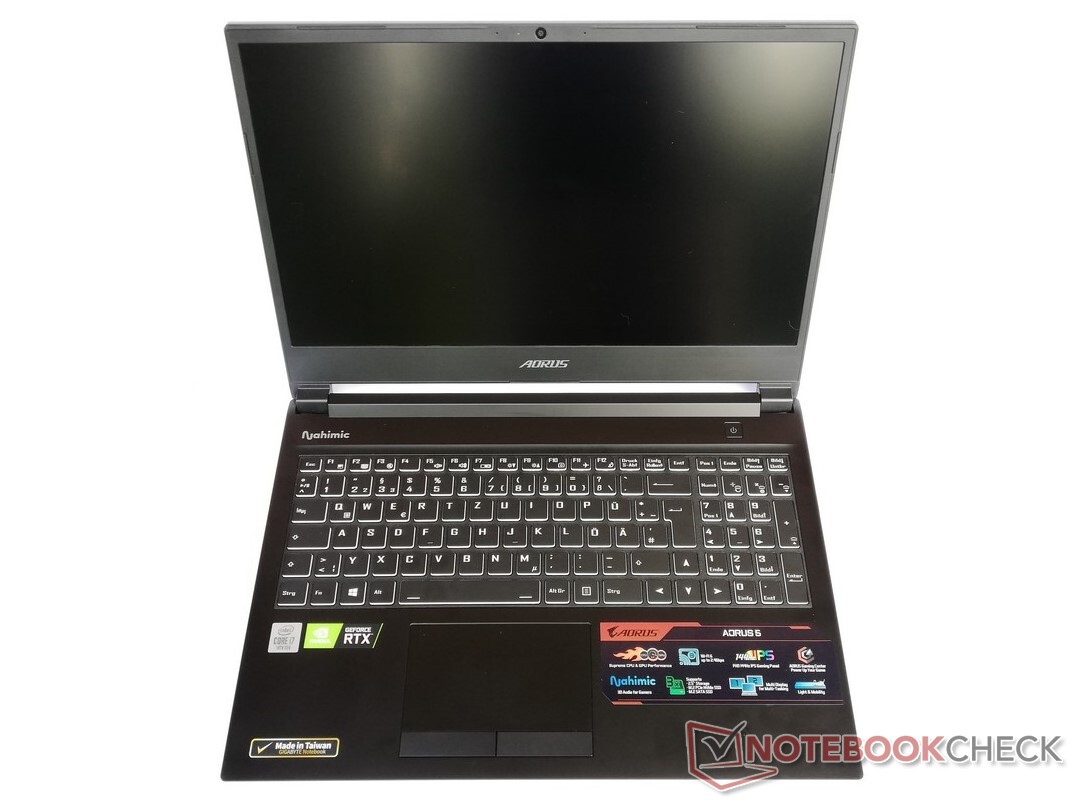
Breve Análise do Portátil Aorus 5 KB: A Gigabyte equipa o Clevo barebone com a RTX 2060
Avaliação | Data | Modelo | Peso | Altura | Size | Resolução | Preço |
|---|---|---|---|---|---|---|---|
| 83.7 % v7 (old) | 10/2020 | Aorus 5 KB i7-10750H, GeForce RTX 2060 Mobile | 2.1 kg | 28 mm | 15.60" | 1920x1080 | |
| 83.3 % v7 (old) | 03/2020 | Schenker XMG Pro 15 i7-9750H, GeForce RTX 2070 Mobile | 2.5 kg | 30 mm | 15.60" | 1920x1080 | |
| 82.7 % v7 (old) | 06/2020 | Asus TUF Gaming A15 FA506IV-HN172 R7 4800H, GeForce RTX 2060 Mobile | 2.2 kg | 24.9 mm | 15.60" | 1920x1080 | |
| 83.3 % v7 (old) | 07/2020 | Lenovo Legion 5 15IMH05H i5-10300H, GeForce RTX 2060 Mobile | 2.5 kg | 26.1 mm | 15.60" | 1920x1080 | |
| 81.1 % v7 (old) | HP Pavilion Gaming 15-ec1177ng R7 4800H, GeForce GTX 1660 Ti Max-Q | 2 kg | 23.5 mm | 15.60" | 1920x1080 |
| SD Card Reader | |
| average JPG Copy Test (av. of 3 runs) | |
| Schenker XMG Pro 15 (Toshiba Exceria Pro SDXC 64 GB UHS-II) | |
| Média da turma Gaming (20.9 - 210, n=54, últimos 2 anos) | |
| Aorus 5 KB (Toshiba Exceria Pro SDXC 64 GB UHS-II) | |
| HP Pavilion Gaming 15-ec1177ng (Toshiba Exceria Pro SDXC 64 GB UHS-II) | |
| maximum AS SSD Seq Read Test (1GB) | |
| Schenker XMG Pro 15 (Toshiba Exceria Pro SDXC 64 GB UHS-II) | |
| Média da turma Gaming (25.5 - 261, n=51, últimos 2 anos) | |
| Aorus 5 KB (Toshiba Exceria Pro SDXC 64 GB UHS-II) | |
| HP Pavilion Gaming 15-ec1177ng (Toshiba Exceria Pro SDXC 64 GB UHS-II) | |
| Networking | |
| iperf3 transmit AX12 | |
| Schenker XMG Pro 15 | |
| Aorus 5 KB | |
| Média Intel Wi-Fi 6 AX200 (447 - 1645, n=127) | |
| Asus TUF Gaming A15 FA506IV-HN172 | |
| HP Pavilion Gaming 15-ec1177ng | |
| Lenovo Legion 5 15IMH05H | |
| iperf3 receive AX12 | |
| Aorus 5 KB | |
| Schenker XMG Pro 15 | |
| Média Intel Wi-Fi 6 AX200 (523 - 1684, n=128) | |
| Lenovo Legion 5 15IMH05H | |
| HP Pavilion Gaming 15-ec1177ng | |
| Asus TUF Gaming A15 FA506IV-HN172 | |

")
")
| |||||||||||||||||||||||||
iluminação: 87 %
iluminação com acumulador: 318 cd/m²
Contraste: 1060:1 (Preto: 0.3 cd/m²)
ΔE ColorChecker Calman: 2.49 | ∀{0.5-29.43 Ø4.71}
calibrated: 1.53
ΔE Greyscale Calman: 1.6 | ∀{0.09-98 Ø4.96}
89% sRGB (Argyll 1.6.3 3D)
65% AdobeRGB 1998 (Argyll 1.6.3 3D)
64.8% AdobeRGB 1998 (Argyll 3D)
92.8% sRGB (Argyll 3D)
63.4% Display P3 (Argyll 3D)
Gamma: 2.211
CCT: 6714 K
| Aorus 5 KB LG Philips LP156WFG-SPB2 (LGD05E8), IPS, 1920x1080, 15.6" | Schenker XMG Pro 15 AU Optronics B156HAN (AUO80ED), IPS, 1920x1080, 15.6" | Asus TUF Gaming A15 FA506IV-HN172 LM156LF-2F01, IPS, 1920x1080, 15.6" | Lenovo Legion 5 15IMH05H BOE CQ NV156FHM-NX1, IPS, 1920x1080, 15.6" | HP Pavilion Gaming 15-ec1177ng LG Philips LP156WFG-SPK1, IPS, 1920x1080, 15.6" | |
|---|---|---|---|---|---|
| Display | 4% | -38% | -38% | 1% | |
| Display P3 Coverage (%) | 63.4 | 66.7 5% | 38.92 -39% | 38.8 -39% | 64.9 2% |
| sRGB Coverage (%) | 92.8 | 94.4 2% | 58.5 -37% | 57.8 -38% | 93.1 0% |
| AdobeRGB 1998 Coverage (%) | 64.8 | 68.1 5% | 40.22 -38% | 40.09 -38% | 65.9 2% |
| Response Times | -10% | -125% | -67% | -5% | |
| Response Time Grey 50% / Grey 80% * (ms) | 14.4 ? | 17.2 ? -19% | 34 ? -136% | 26 ? -81% | 16 ? -11% |
| Response Time Black / White * (ms) | 11.2 ? | 11.2 ? -0% | 24 ? -114% | 17 ? -52% | 11 ? 2% |
| PWM Frequency (Hz) | |||||
| Screen | -29% | -69% | -54% | 4% | |
| Brightness middle (cd/m²) | 318 | 346 9% | 280 -12% | 301 -5% | 363 14% |
| Brightness (cd/m²) | 298 | 346 16% | 254 -15% | 277 -7% | 327 10% |
| Brightness Distribution (%) | 87 | 89 2% | 88 1% | 77 -11% | 84 -3% |
| Black Level * (cd/m²) | 0.3 | 0.28 7% | 0.15 50% | 0.26 13% | 0.185 38% |
| Contrast (:1) | 1060 | 1236 17% | 1867 76% | 1158 9% | 1962 85% |
| Colorchecker dE 2000 * | 2.49 | 4.62 -86% | 5.89 -137% | 5.12 -106% | 2.69 -8% |
| Colorchecker dE 2000 max. * | 5.06 | 8.93 -76% | 19 -275% | 8.86 -75% | 5.06 -0% |
| Colorchecker dE 2000 calibrated * | 1.53 | 1.58 -3% | 4.79 -213% | 4.88 -219% | 1.7 -11% |
| Greyscale dE 2000 * | 1.6 | 4.95 -209% | 4.08 -155% | 3.47 -117% | 2.77 -73% |
| Gamma | 2.211 100% | 2.36 93% | 2.33 94% | 2.37 93% | 2.56 86% |
| CCT | 6714 97% | 7733 84% | 7303 89% | 7062 92% | 6385 102% |
| Color Space (Percent of AdobeRGB 1998) (%) | 65 | 61 -6% | 37 -43% | 37 -43% | 60.3 -7% |
| Color Space (Percent of sRGB) (%) | 89 | 94 6% | 58 -35% | 57 -36% | 92.8 4% |
| Média Total (Programa/Configurações) | -12% /
-21% | -77% /
-70% | -53% /
-53% | 0% /
3% |
* ... menor é melhor
Exibir tempos de resposta
| ↔ Tempo de resposta preto para branco | ||
|---|---|---|
| 11.2 ms ... ascensão ↗ e queda ↘ combinadas | ↗ 6.8 ms ascensão | 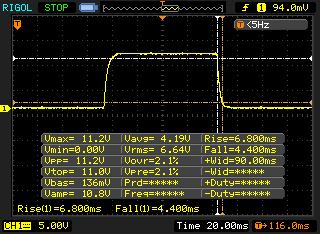 |
| ↘ 4.4 ms queda | ||
| A tela mostra boas taxas de resposta em nossos testes, mas pode ser muito lenta para jogadores competitivos. Em comparação, todos os dispositivos testados variam de 0.1 (mínimo) a 240 (máximo) ms. » 30 % de todos os dispositivos são melhores. Isso significa que o tempo de resposta medido é melhor que a média de todos os dispositivos testados (19.8 ms). | ||
| ↔ Tempo de resposta 50% cinza a 80% cinza | ||
| 14.4 ms ... ascensão ↗ e queda ↘ combinadas | ↗ 7.6 ms ascensão | 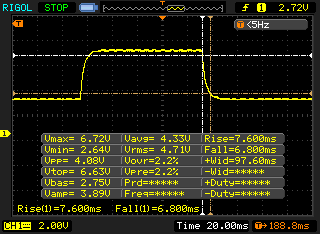 |
| ↘ 6.8 ms queda | ||
| A tela mostra boas taxas de resposta em nossos testes, mas pode ser muito lenta para jogadores competitivos. Em comparação, todos os dispositivos testados variam de 0.165 (mínimo) a 636 (máximo) ms. » 29 % de todos os dispositivos são melhores. Isso significa que o tempo de resposta medido é melhor que a média de todos os dispositivos testados (30.9 ms). | ||
Cintilação da tela / PWM (modulação por largura de pulso)
| Tela tremeluzindo / PWM não detectado | 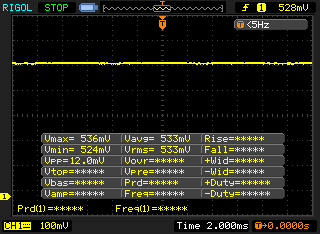 | ||
[pwm_comparison] Em comparação: 52 % de todos os dispositivos testados não usam PWM para escurecer a tela. Se PWM foi detectado, uma média de 7744 (mínimo: 5 - máximo: 343500) Hz foi medida. | |||

| Cinebench R20 | |
| CPU (Single Core) | |
| Média da turma Gaming (622 - 913, n=103, últimos 2 anos) | |
| HP Pavilion Gaming 15-ec1177ng | |
| Asus TUF Gaming A15 FA506IV-HN172 | |
| Aorus 5 KB | |
| Média Intel Core i7-10750H (431 - 504, n=43) | |
| Lenovo Legion 5 15IMH05H | |
| Schenker XMG Pro 15 | |
| CPU (Multi Core) | |
| Média da turma Gaming (4029 - 16433, n=103, últimos 2 anos) | |
| HP Pavilion Gaming 15-ec1177ng | |
| Asus TUF Gaming A15 FA506IV-HN172 | |
| Aorus 5 KB | |
| Média Intel Core i7-10750H (1749 - 3325, n=43) | |
| Schenker XMG Pro 15 | |
| Lenovo Legion 5 15IMH05H | |
| Cinebench R15 | |
| CPU Single 64Bit | |
| Média da turma Gaming (188.8 - 350, n=103, últimos 2 anos) | |
| Aorus 5 KB | |
| Média Intel Core i7-10750H (184 - 213, n=45) | |
| Lenovo Legion 5 15IMH05H | |
| HP Pavilion Gaming 15-ec1177ng | |
| Asus TUF Gaming A15 FA506IV-HN172 | |
| Schenker XMG Pro 15 | |
| CPU Multi 64Bit | |
| Média da turma Gaming (1578 - 6330, n=102, últimos 2 anos) | |
| HP Pavilion Gaming 15-ec1177ng | |
| Asus TUF Gaming A15 FA506IV-HN172 | |
| Média Intel Core i7-10750H (804 - 1418, n=50) | |
| Aorus 5 KB | |
| Schenker XMG Pro 15 | |
| Lenovo Legion 5 15IMH05H | |
| Blender - v2.79 BMW27 CPU | |
| Lenovo Legion 5 15IMH05H | |
| Schenker XMG Pro 15 | |
| Média Intel Core i7-10750H (322 - 587, n=43) | |
| Aorus 5 KB | |
| Asus TUF Gaming A15 FA506IV-HN172 | |
| HP Pavilion Gaming 15-ec1177ng | |
| Média da turma Gaming (79 - 330, n=101, últimos 2 anos) | |
| 7-Zip 18.03 | |
| 7z b 4 -mmt1 | |
| Média da turma Gaming (4824 - 7436, n=102, últimos 2 anos) | |
| Aorus 5 KB | |
| Média Intel Core i7-10750H (4504 - 5470, n=43) | |
| Lenovo Legion 5 15IMH05H | |
| HP Pavilion Gaming 15-ec1177ng | |
| Asus TUF Gaming A15 FA506IV-HN172 | |
| Schenker XMG Pro 15 | |
| 7z b 4 | |
| Média da turma Gaming (33491 - 148086, n=102, últimos 2 anos) | |
| HP Pavilion Gaming 15-ec1177ng | |
| Asus TUF Gaming A15 FA506IV-HN172 | |
| Aorus 5 KB | |
| Média Intel Core i7-10750H (26040 - 37345, n=43) | |
| Schenker XMG Pro 15 | |
| Lenovo Legion 5 15IMH05H | |
| Geekbench 5.5 | |
| Single-Core | |
| Média da turma Gaming (1403 - 2474, n=102, últimos 2 anos) | |
| Aorus 5 KB | |
| Média Intel Core i7-10750H (1114 - 1333, n=43) | |
| Lenovo Legion 5 15IMH05H | |
| HP Pavilion Gaming 15-ec1177ng | |
| Asus TUF Gaming A15 FA506IV-HN172 | |
| Schenker XMG Pro 15 | |
| Multi-Core | |
| Média da turma Gaming (6460 - 28263, n=102, últimos 2 anos) | |
| HP Pavilion Gaming 15-ec1177ng | |
| Aorus 5 KB | |
| Média Intel Core i7-10750H (4443 - 6674, n=43) | |
| Schenker XMG Pro 15 | |
| Asus TUF Gaming A15 FA506IV-HN172 | |
| Lenovo Legion 5 15IMH05H | |
| HWBOT x265 Benchmark v2.2 - 4k Preset | |
| Média da turma Gaming (11.5 - 44.4, n=102, últimos 2 anos) | |
| HP Pavilion Gaming 15-ec1177ng | |
| Asus TUF Gaming A15 FA506IV-HN172 | |
| Média Intel Core i7-10750H (5.54 - 11.6, n=43) | |
| Aorus 5 KB | |
| Schenker XMG Pro 15 | |
| Lenovo Legion 5 15IMH05H | |
| LibreOffice - 20 Documents To PDF | |
| HP Pavilion Gaming 15-ec1177ng | |
| Média Intel Core i7-10750H (43.1 - 99.2, n=43) | |
| Lenovo Legion 5 15IMH05H | |
| Média da turma Gaming (33.2 - 88.8, n=102, últimos 2 anos) | |
| Aorus 5 KB | |
| Asus TUF Gaming A15 FA506IV-HN172 | |
| R Benchmark 2.5 - Overall mean | |
| Schenker XMG Pro 15 | |
| Lenovo Legion 5 15IMH05H | |
| Média Intel Core i7-10750H (0.578 - 0.708, n=42) | |
| Asus TUF Gaming A15 FA506IV-HN172 | |
| Aorus 5 KB | |
| HP Pavilion Gaming 15-ec1177ng | |
| Média da turma Gaming (0.3439 - 0.59, n=102, últimos 2 anos) | |
* ... menor é melhor
| PCMark 10 - Score | |
| Média da turma Gaming (5828 - 12414, n=93, últimos 2 anos) | |
| HP Pavilion Gaming 15-ec1177ng | |
| Média Intel Core i7-10750H, NVIDIA GeForce RTX 2060 Mobile (4984 - 6268, n=9) | |
| Aorus 5 KB | |
| Asus TUF Gaming A15 FA506IV-HN172 | |
| Schenker XMG Pro 15 | |
| Lenovo Legion 5 15IMH05H | |
| PCMark 10 Score | 5452 pontos | |
Ajuda | ||
| DPC Latencies / LatencyMon - interrupt to process latency (max), Web, Youtube, Prime95 | |
| Aorus 5 KB | |
| Asus TUF Gaming A15 FA506IV-HN172 | |
| HP Pavilion Gaming 15-ec1177ng | |
| Lenovo Legion 5 15IMH05H | |
* ... menor é melhor
| Aorus 5 KB ADATA XPG SX8200 Pro (ASX8200PNP-512GT) | Schenker XMG Pro 15 Samsung SSD 970 EVO Plus 500GB | Asus TUF Gaming A15 FA506IV-HN172 Kingston OM8PCP3512F-AB | Lenovo Legion 5 15IMH05H Samsung PM991 MZALQ512HALU | HP Pavilion Gaming 15-ec1177ng Intel SSD 660p SSDPEKNW512G8 | Média ADATA XPG SX8200 Pro (ASX8200PNP-512GT) | |
|---|---|---|---|---|---|---|
| CrystalDiskMark 5.2 / 6 | -1% | -24% | -26% | -35% | -6% | |
| Write 4K (MB/s) | 162.1 | 120.6 -26% | 219.8 36% | 145.4 -10% | 110 -32% | 149.5 ? -8% |
| Read 4K (MB/s) | 60.7 | 46.13 -24% | 50.2 -17% | 51.6 -15% | 52.8 -13% | 53.6 ? -12% |
| Write Seq (MB/s) | 2366 | 2900 23% | 979 -59% | 1007 -57% | 983 -58% | 2346 ? -1% |
| Read Seq (MB/s) | 2633 | 2929 11% | 1990 -24% | 1145 -57% | 1608 -39% | 2501 ? -5% |
| Write 4K Q32T1 (MB/s) | 428.2 | 372.2 -13% | 516 21% | 468.4 9% | 461.3 8% | 419 ? -2% |
| Read 4K Q32T1 (MB/s) | 582 | 422.2 -27% | 298.3 -49% | 528 -9% | 345.4 -41% | 520 ? -11% |
| Write Seq Q32T1 (MB/s) | 2480 | 3245 31% | 982 -60% | 1381 -44% | 982 -60% | 2463 ? -1% |
| Read Seq Q32T1 (MB/s) | 3121 | 3565 14% | 1907 -39% | 2291 -27% | 1820 -42% | 2997 ? -4% |
| AS SSD | 40% | -21% | -31% | -32% | -5% | |
| Seq Read (MB/s) | 2795 | 2975 6% | 1682 -40% | 2012 -28% | 1553 -44% | 2688 ? -4% |
| Seq Write (MB/s) | 2172 | 2597 20% | 904 -58% | 1261 -42% | 868 -60% | 1888 ? -13% |
| 4K Read (MB/s) | 53.3 | 62.3 17% | 60.2 13% | 43.66 -18% | 56.6 6% | 53.3 ? 0% |
| 4K Write (MB/s) | 121.3 | 150.9 24% | 164.8 36% | 109.3 -10% | 153.6 27% | 124.8 ? 3% |
| 4K-64 Read (MB/s) | 714 | 1508 111% | 472.5 -34% | 851 19% | 325.3 -54% | 714 ? 0% |
| 4K-64 Write (MB/s) | 1376 | 2239 63% | 845 -39% | 780 -43% | 762 -45% | 1114 ? -19% |
| Access Time Read * (ms) | 0.049 | 0.038 22% | 0.087 -78% | 0.117 -139% | 0.07 -43% | 0.05575 ? -14% |
| Access Time Write * (ms) | 0.036 | 0.025 31% | 0.02 44% | 0.036 -0% | 0.046 -28% | 0.03125 ? 13% |
| Score Total (Points) | 3279 | 5463 67% | 2143 -35% | 2643 -19% | 1802 -45% | 2968 ? -9% |
| Média Total (Programa/Configurações) | 20% /
21% | -23% /
-22% | -29% /
-29% | -34% /
-33% | -6% /
-5% |
* ... menor é melhor

Continuous load read: DiskSpd Read Loop, Queue Depth 8
| 3DMark | |
| 1920x1080 Fire Strike Graphics | |
| Média da turma Gaming (18629 - 62849, n=112, últimos 2 anos) | |
| Schenker XMG Pro 15 | |
| Aorus 5 KB | |
| Média NVIDIA GeForce RTX 2060 Mobile (14768 - 18358, n=43) | |
| Asus TUF Gaming A15 FA506IV-HN172 | |
| Lenovo Legion 5 15IMH05H | |
| HP Pavilion Gaming 15-ec1177ng | |
| 2560x1440 Time Spy Graphics | |
| Média da turma Gaming (6387 - 26212, n=112, últimos 2 anos) | |
| Schenker XMG Pro 15 | |
| Média NVIDIA GeForce RTX 2060 Mobile (5660 - 6910, n=41) | |
| Lenovo Legion 5 15IMH05H | |
| Aorus 5 KB | |
| Asus TUF Gaming A15 FA506IV-HN172 | |
| HP Pavilion Gaming 15-ec1177ng | |
| 3DMark 11 - 1280x720 Performance | |
| Média da turma Gaming (20180 - 54833, n=103, últimos 2 anos) | |
| Schenker XMG Pro 15 | |
| Aorus 5 KB | |
| Média NVIDIA GeForce RTX 2060 Mobile (15612 - 20404, n=40) | |
| Asus TUF Gaming A15 FA506IV-HN172 | |
| HP Pavilion Gaming 15-ec1177ng | |
| Lenovo Legion 5 15IMH05H | |
| 3DMark 11 Performance | 18491 pontos | |
| 3DMark Fire Strike Score | 15034 pontos | |
| 3DMark Time Spy Score | 6258 pontos | |
Ajuda | ||
| The Witcher 3 - 1920x1080 Ultra Graphics & Postprocessing (HBAO+) | |
| Média da turma Gaming (104.7 - 240, n=7, últimos 2 anos) | |
| Schenker XMG Pro 15 | |
| Lenovo Legion 5 15IMH05H | |
| Média NVIDIA GeForce RTX 2060 Mobile (50.6 - 74, n=40) | |
| Asus TUF Gaming A15 FA506IV-HN172 | |
| Aorus 5 KB | |
| HP Pavilion Gaming 15-ec1177ng | |
| Far Cry 5 - 1920x1080 Ultra Preset AA:T | |
| Média da turma Gaming (70 - 151, n=6, últimos 2 anos) | |
| Lenovo Legion 5 15IMH05H | |
| Aorus 5 KB | |
| Média NVIDIA GeForce RTX 2060 Mobile (76 - 90, n=9) | |
| Final Fantasy XV Benchmark - 1920x1080 High Quality | |
| Média da turma Gaming (64.2 - 215, n=91, últimos 2 anos) | |
| Aorus 5 KB | |
| Média NVIDIA GeForce RTX 2060 Mobile (52 - 67.5, n=7) | |
| Doom Eternal - 1920x1080 Ultra Preset | |
| Aorus 5 KB | |
| Lenovo Legion 5 15IMH05H | |
| Média NVIDIA GeForce RTX 2060 Mobile (98.7 - 138, n=10) | |
| HP Pavilion Gaming 15-ec1177ng | |
| baixo | média | alto | ultra | |
|---|---|---|---|---|
| The Witcher 3 (2015) | 57 | |||
| Dota 2 Reborn (2015) | 140 | 128 | 121 | 115 |
| Final Fantasy XV Benchmark (2018) | 66.1 | |||
| X-Plane 11.11 (2018) | 107 | 93.1 | 79.1 | |
| Far Cry 5 (2018) | 84 | |||
| Doom Eternal (2020) | 129 |
Barulho
| Ocioso |
| 26 / 30 / 34 dB |
| Carga |
| 53 / 56 dB |
 | ||
30 dB silencioso 40 dB(A) audível 50 dB(A) ruidosamente alto |
||
min: | ||
(-) A temperatura máxima no lado superior é 50 °C / 122 F, em comparação com a média de 40.4 °C / 105 F , variando de 21.2 a 68.8 °C para a classe Gaming.
(-) A parte inferior aquece até um máximo de 49 °C / 120 F, em comparação com a média de 43.2 °C / 110 F
(+) Em uso inativo, a temperatura média para o lado superior é 31.8 °C / 89 F, em comparação com a média do dispositivo de 33.9 °C / ### class_avg_f### F.
(-) Jogando The Witcher 3, a temperatura média para o lado superior é 42.6 °C / 109 F, em comparação com a média do dispositivo de 33.9 °C / ## #class_avg_f### F.
(±) Os apoios para as mãos e o touchpad podem ficar muito quentes ao toque, com um máximo de 39 °C / 102.2 F.
(-) A temperatura média da área do apoio para as mãos de dispositivos semelhantes foi 28.8 °C / 83.8 F (-10.2 °C / -18.4 F).
Aorus 5 KB análise de áudio
(+) | os alto-falantes podem tocar relativamente alto (###valor### dB)
Graves 100 - 315Hz
(-) | quase nenhum baixo - em média 33.1% menor que a mediana
(-) | graves não são lineares (16.2% delta para frequência anterior)
Médios 400 - 2.000 Hz
(+) | médios equilibrados - apenas 4.3% longe da mediana
(+) | médios são lineares (4.1% delta para frequência anterior)
Altos 2 - 16 kHz
(+) | agudos equilibrados - apenas 2.8% longe da mediana
(+) | os máximos são lineares (4% delta da frequência anterior)
Geral 100 - 16.000 Hz
(±) | a linearidade do som geral é média (17.7% diferença em relação à mediana)
Comparado com a mesma classe
» 52% de todos os dispositivos testados nesta classe foram melhores, 10% semelhantes, 38% piores
» O melhor teve um delta de 6%, a média foi 18%, o pior foi 132%
Comparado com todos os dispositivos testados
» 35% de todos os dispositivos testados foram melhores, 8% semelhantes, 56% piores
» O melhor teve um delta de 4%, a média foi 23%, o pior foi 134%
HP Pavilion Gaming 15-ec1177ng análise de áudio
(-) | alto-falantes não muito altos (###valor### dB)
Graves 100 - 315Hz
(-) | quase nenhum baixo - em média 22% menor que a mediana
(±) | a linearidade dos graves é média (11.9% delta para a frequência anterior)
Médios 400 - 2.000 Hz
(+) | médios equilibrados - apenas 2.7% longe da mediana
(±) | a linearidade dos médios é média (10.9% delta para frequência anterior)
Altos 2 - 16 kHz
(+) | agudos equilibrados - apenas 2.3% longe da mediana
(±) | a linearidade dos máximos é média (7.3% delta para frequência anterior)
Geral 100 - 16.000 Hz
(±) | a linearidade do som geral é média (23.2% diferença em relação à mediana)
Comparado com a mesma classe
» 84% de todos os dispositivos testados nesta classe foram melhores, 4% semelhantes, 11% piores
» O melhor teve um delta de 6%, a média foi 18%, o pior foi 132%
Comparado com todos os dispositivos testados
» 70% de todos os dispositivos testados foram melhores, 5% semelhantes, 25% piores
» O melhor teve um delta de 4%, a média foi 23%, o pior foi 134%
| desligado | |
| Ocioso | |
| Carga |
|
Key:
min: | |
| Aorus 5 KB i7-10750H, GeForce RTX 2060 Mobile | Schenker XMG Pro 15 i7-9750H, GeForce RTX 2070 Mobile | Asus TUF Gaming A15 FA506IV-HN172 R7 4800H, GeForce RTX 2060 Mobile | Lenovo Legion 5 15IMH05H i5-10300H, GeForce RTX 2060 Mobile | HP Pavilion Gaming 15-ec1177ng R7 4800H, GeForce GTX 1660 Ti Max-Q | Média da turma Gaming | |
|---|---|---|---|---|---|---|
| Power Consumption | -32% | 20% | 31% | 38% | -29% | |
| Idle Minimum * (Watt) | 8 | 15 -88% | 5.4 32% | 3.2 60% | 3.8 52% | 13.1 ? -64% |
| Idle Average * (Watt) | 12 | 19 -58% | 10 17% | 8.3 31% | 7.7 36% | 19 ? -58% |
| Idle Maximum * (Watt) | 21 | 26 -24% | 10.5 50% | 8.7 59% | 9.5 55% | 24.6 ? -17% |
| Load Average * (Watt) | 128 | 101 21% | 135 -5% | 82 36% | 90 30% | 111.3 ? 13% |
| Witcher 3 ultra * (Watt) | 138 | 177 -28% | 144 -4% | 151 -9% | 99 28% | |
| Load Maximum * (Watt) | 217 | 245 -13% | 147 32% | 195 10% | 156 28% | 260 ? -20% |
* ... menor é melhor
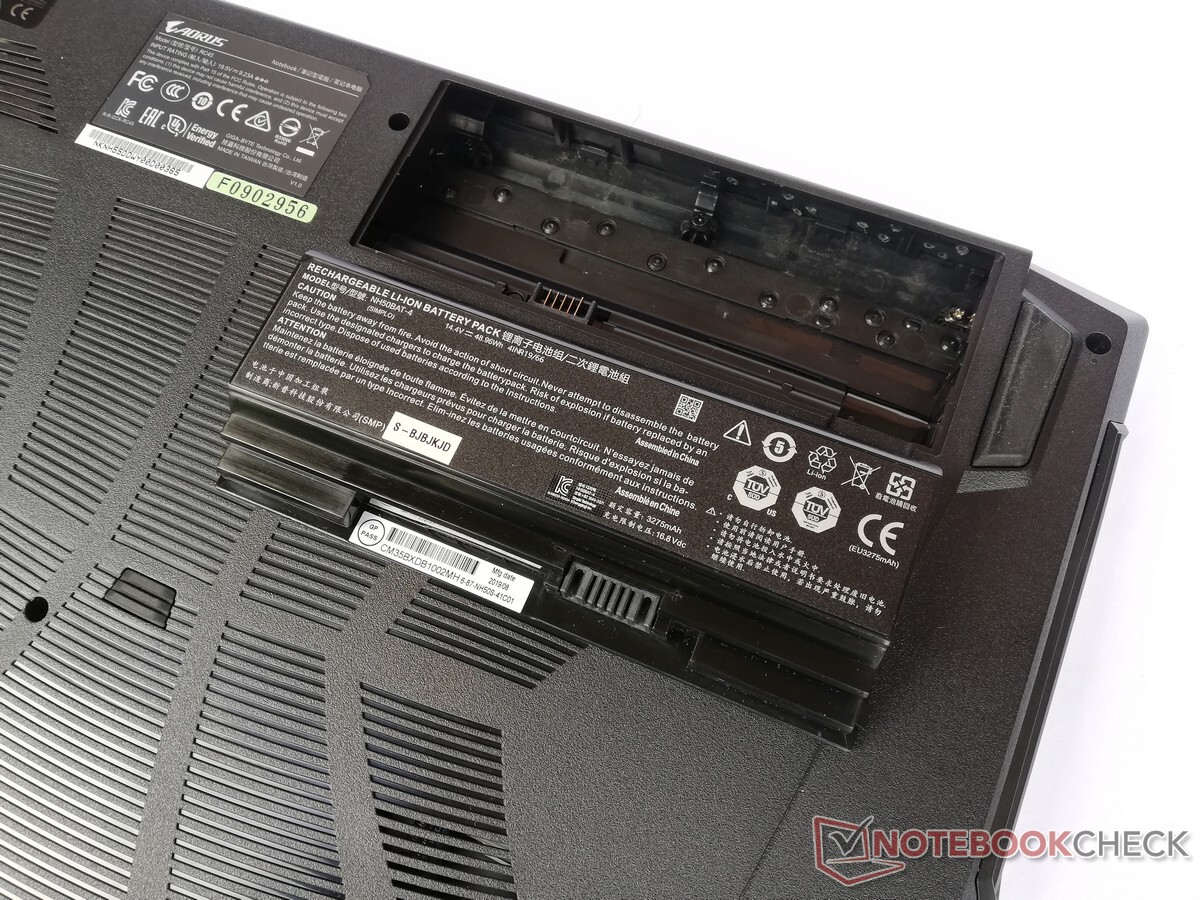
| Aorus 5 KB i7-10750H, GeForce RTX 2060 Mobile, 48.96 Wh | Schenker XMG Pro 15 i7-9750H, GeForce RTX 2070 Mobile, 62 Wh | Asus TUF Gaming A15 FA506IV-HN172 R7 4800H, GeForce RTX 2060 Mobile, 48 Wh | Lenovo Legion 5 15IMH05H i5-10300H, GeForce RTX 2060 Mobile, 60 Wh | HP Pavilion Gaming 15-ec1177ng R7 4800H, GeForce GTX 1660 Ti Max-Q, 52.5 Wh | Média da turma Gaming | |
|---|---|---|---|---|---|---|
| Duração da bateria | -16% | 43% | 49% | 27% | 28% | |
| Reader / Idle (h) | 9 | 5.2 -42% | 9.8 9% | 14.1 57% | 7.84 ? -13% | |
| WiFi v1.3 (h) | 4.8 | 3.5 -27% | 6.2 29% | 7.2 50% | 6.1 27% | 7.08 ? 48% |
| Load (h) | 1 | 1.2 20% | 1.9 90% | 1.4 40% | 1.496 ? 50% |
Pro
Contra
Veredicto - Barebone sólido e bem-equipado
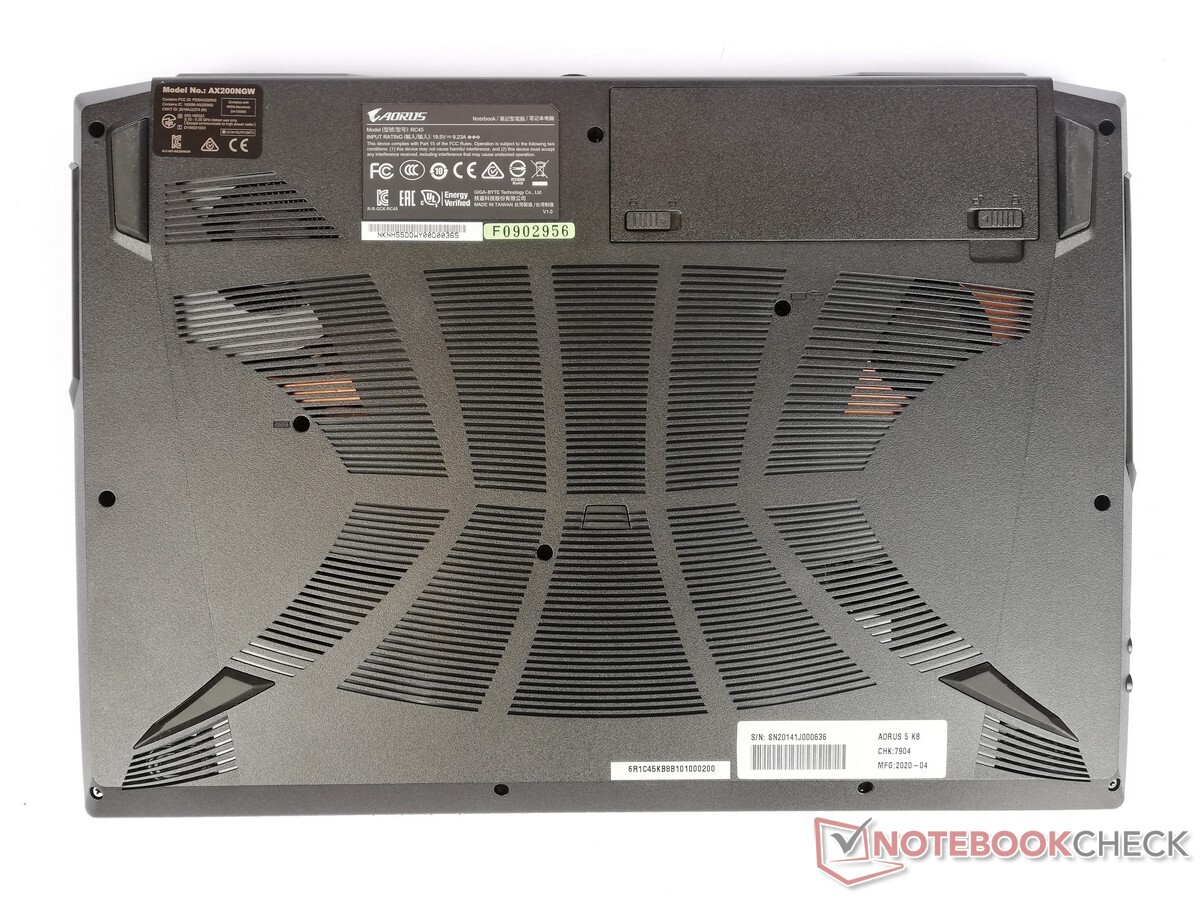
Com o Aorus 5 KB, a Gigabyte entrega um portátil para jogos comparativamente econômico que brilha com suas extensas opções de manutenção. Especialmente as opções de expansão para os dispositivos de armazenamento são diversos, mas também é possível acessar a RAM e os ventiladores. O desempenho está no nível esperado para o hardware e também pode ser mantido sob uso intenso. Além disso, a possibilidade de influir no desempenho e no comportamento do ventilador através do software também fornece aos usuários bons mecanismos de controle.
O Aorus 5 KB oferece muitas opções de manutenção e podem manter o desempenho, inclusive sob uso intenso.
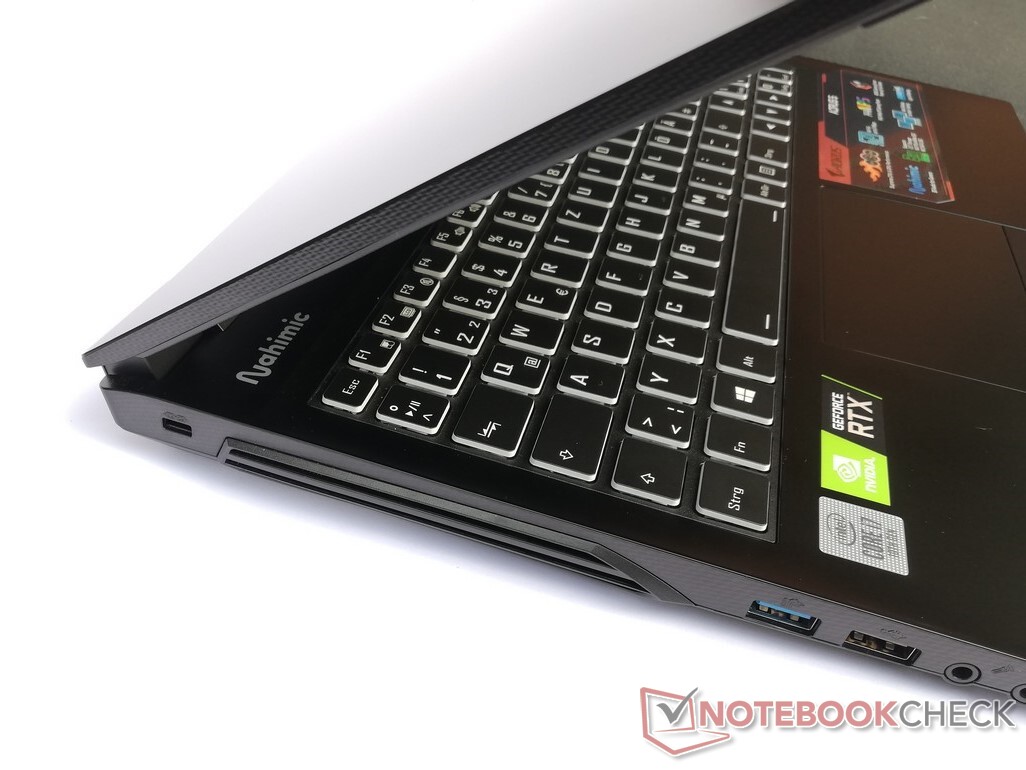
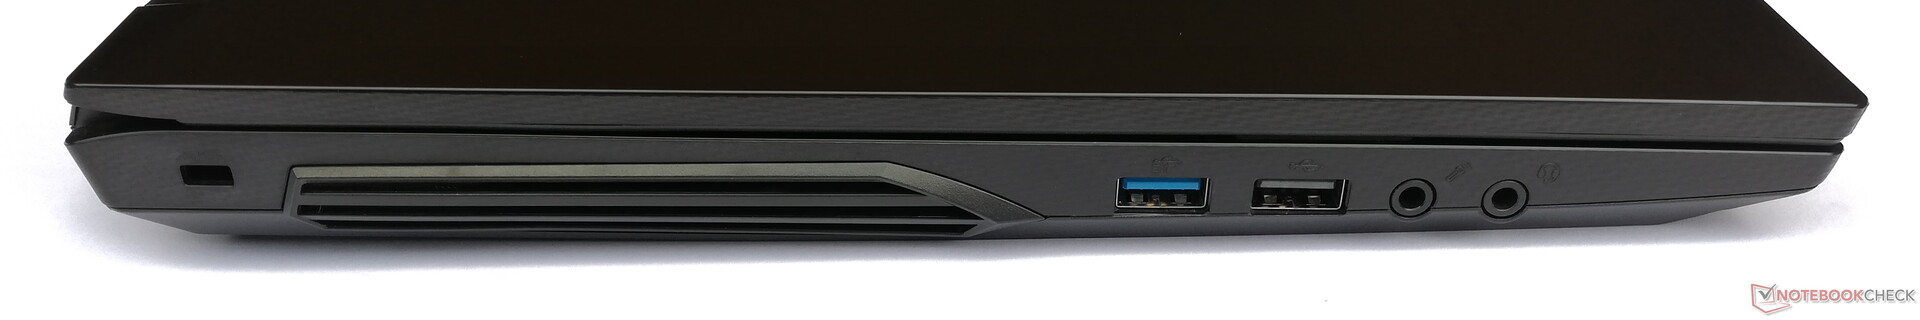
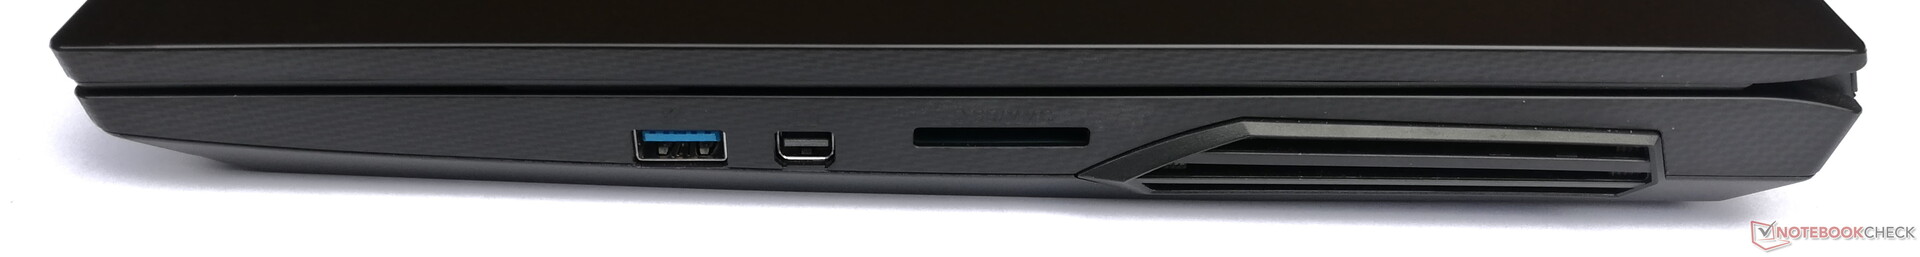
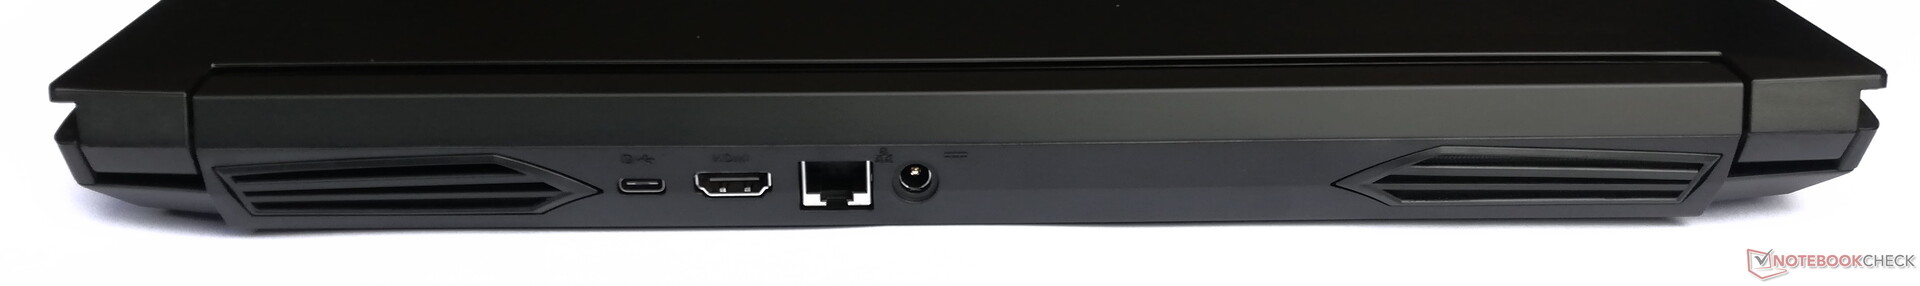
Ao usar um Clevo barebone, a Aorus não colocou seus próprios acentos. Além disso, o controle da retro iluminação do teclado se limita a cores pré determinados. No entanto, o acabamento, o painel de 144 Hz, e a seleção de portas são muito sólidos e deveriam agradar a maioria de usuários.
Aorus 5 KB
- 10/06/2020 v7 (old)
Mike Wobker
Price comparison
