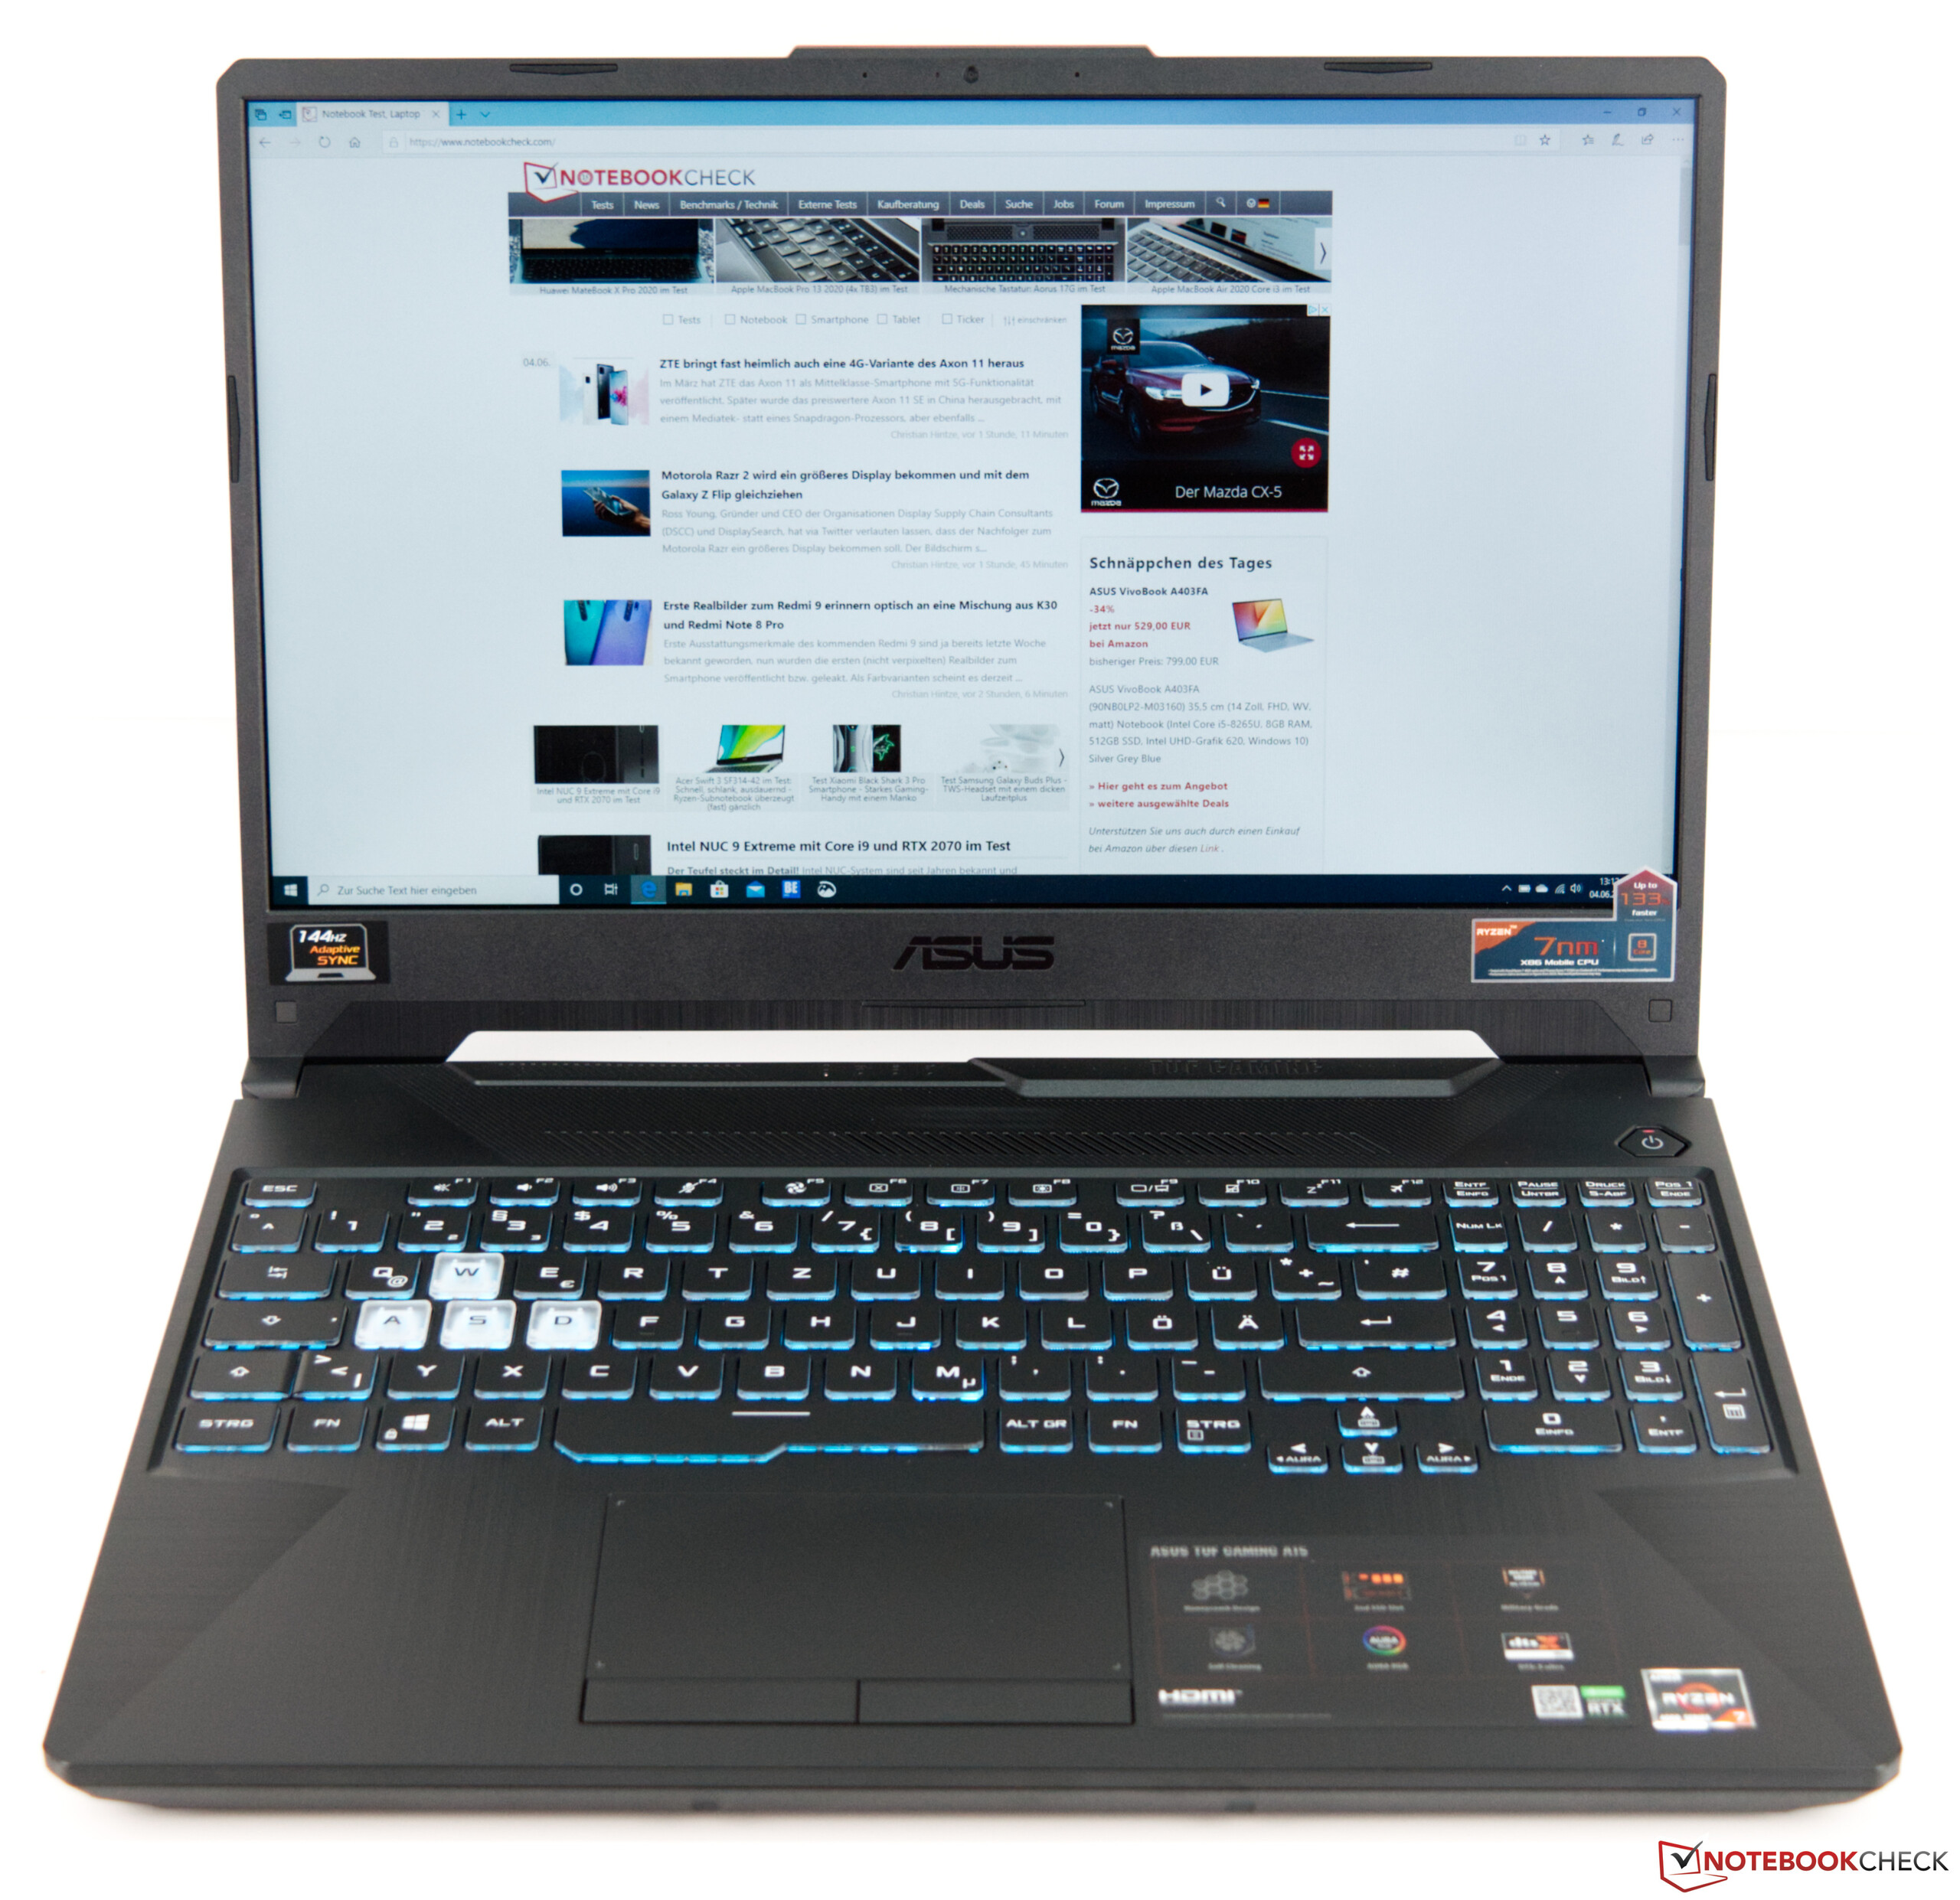
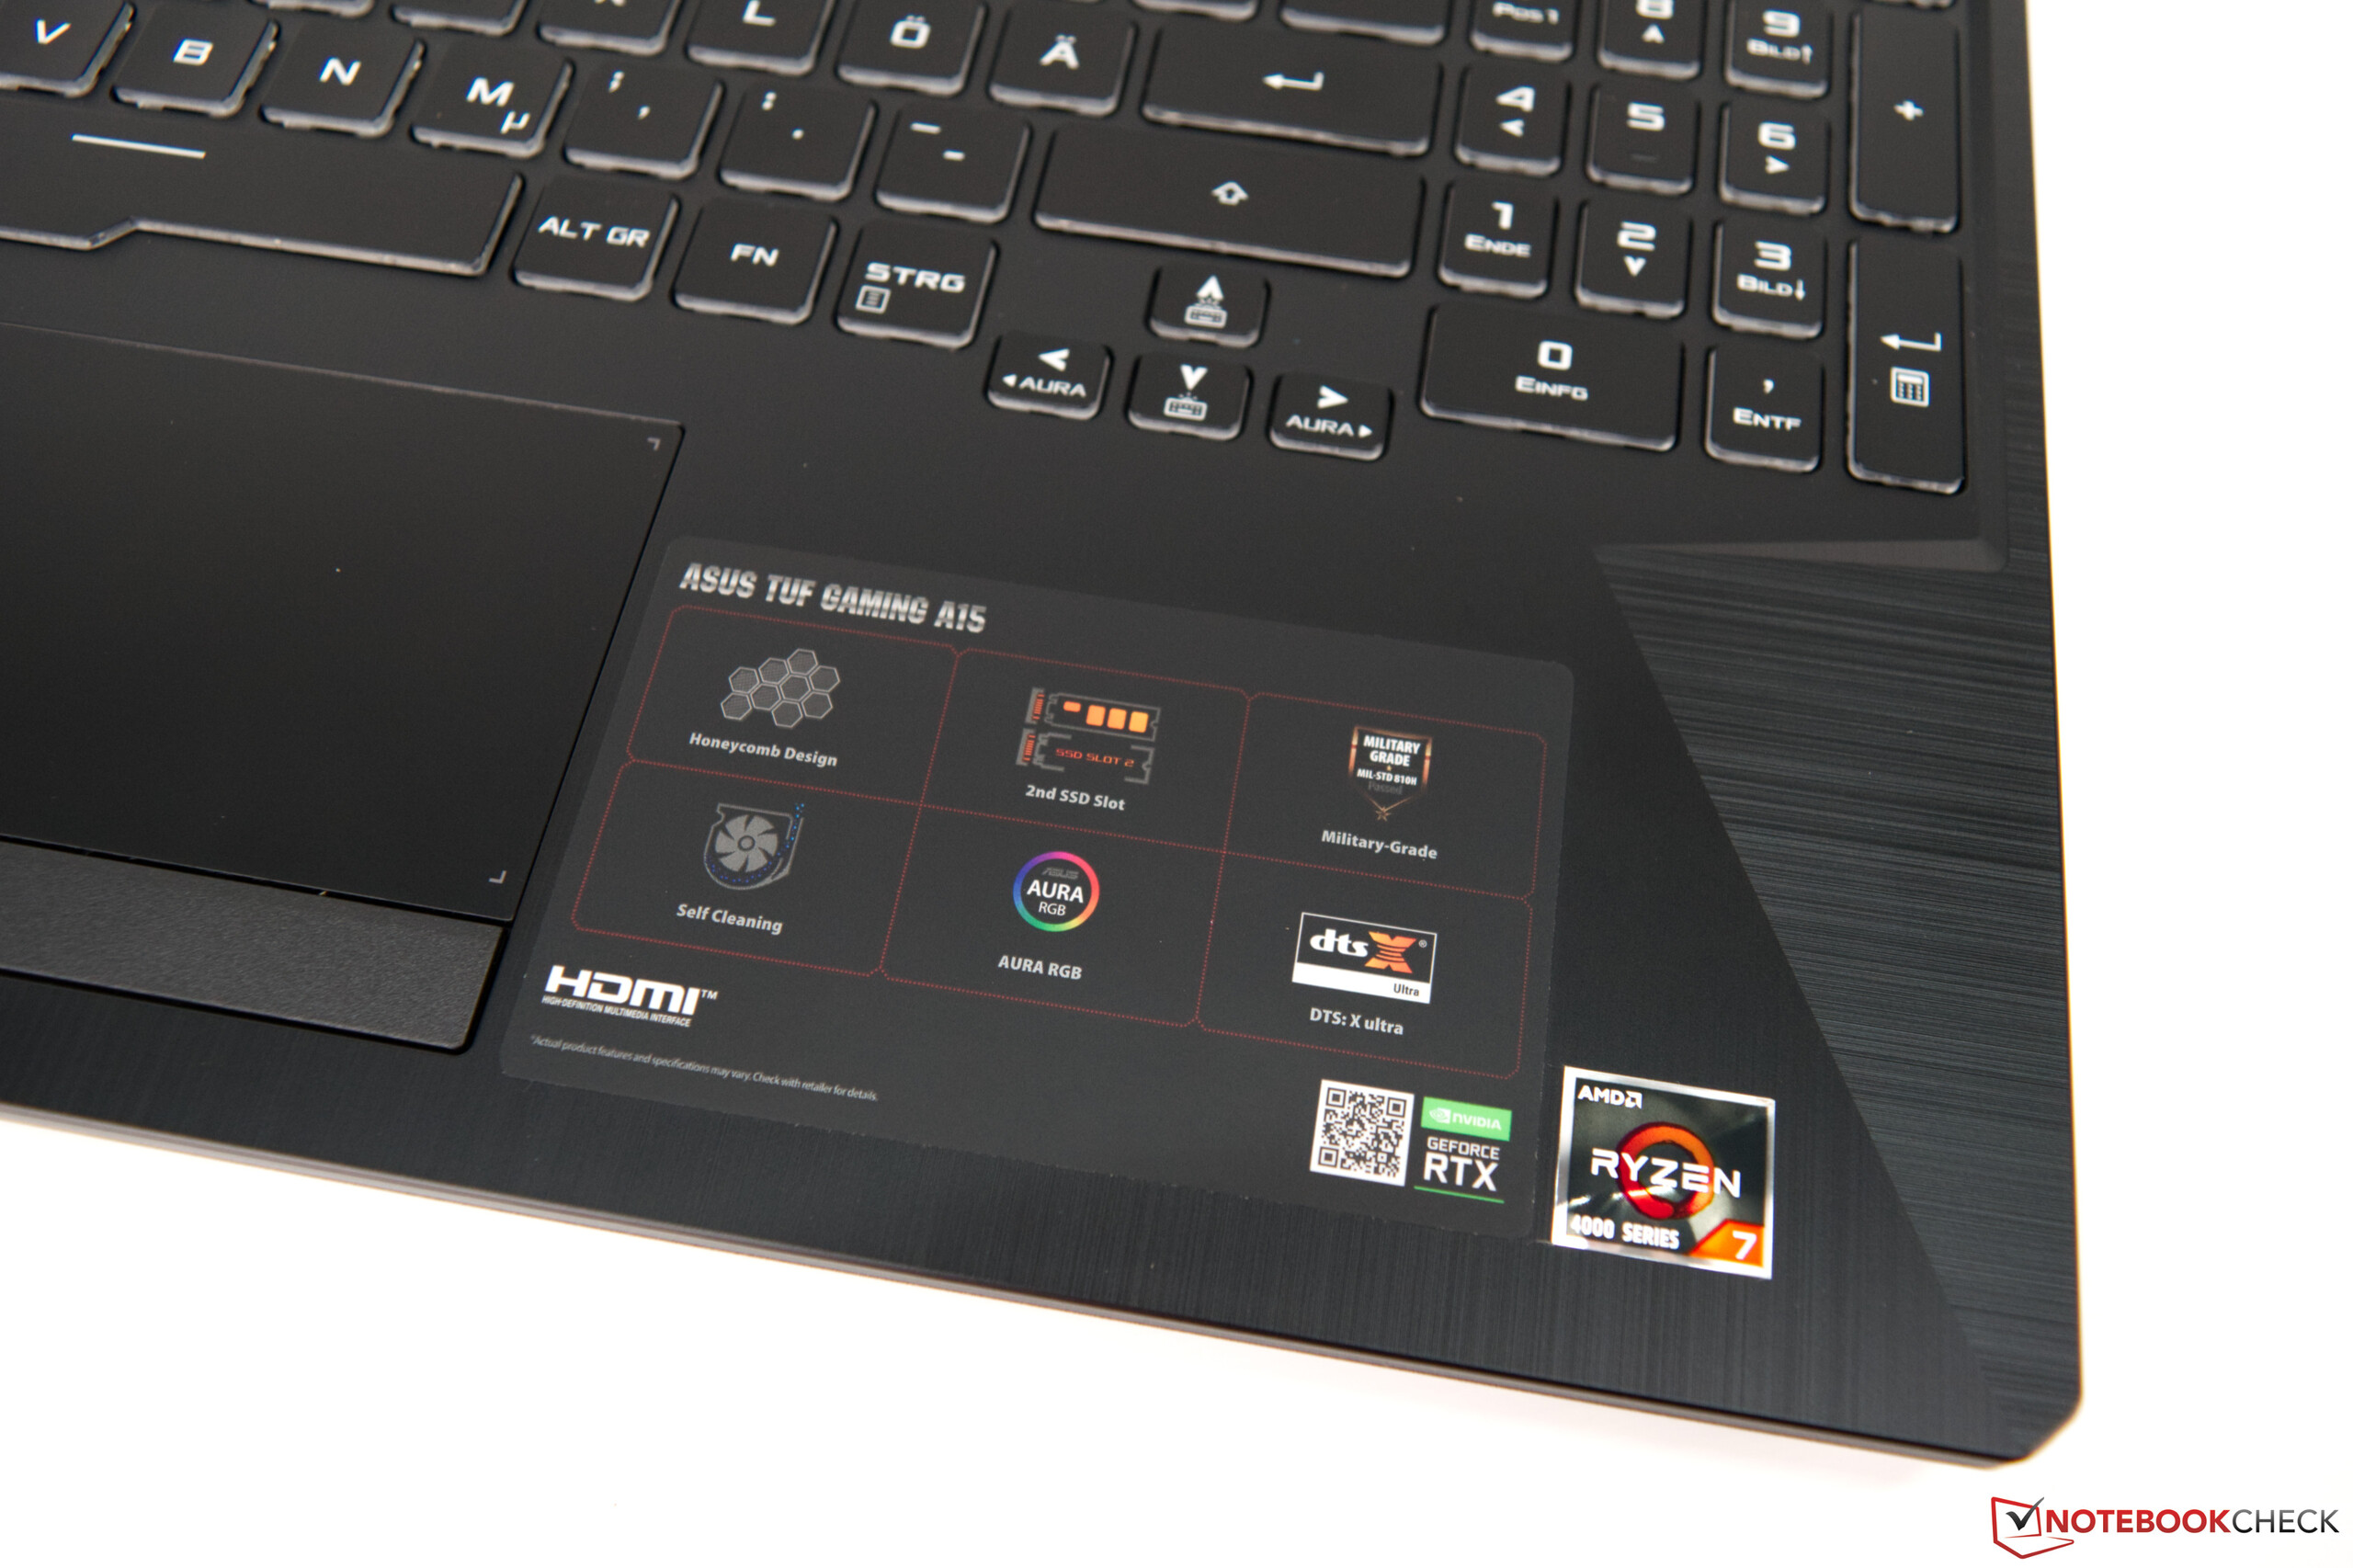
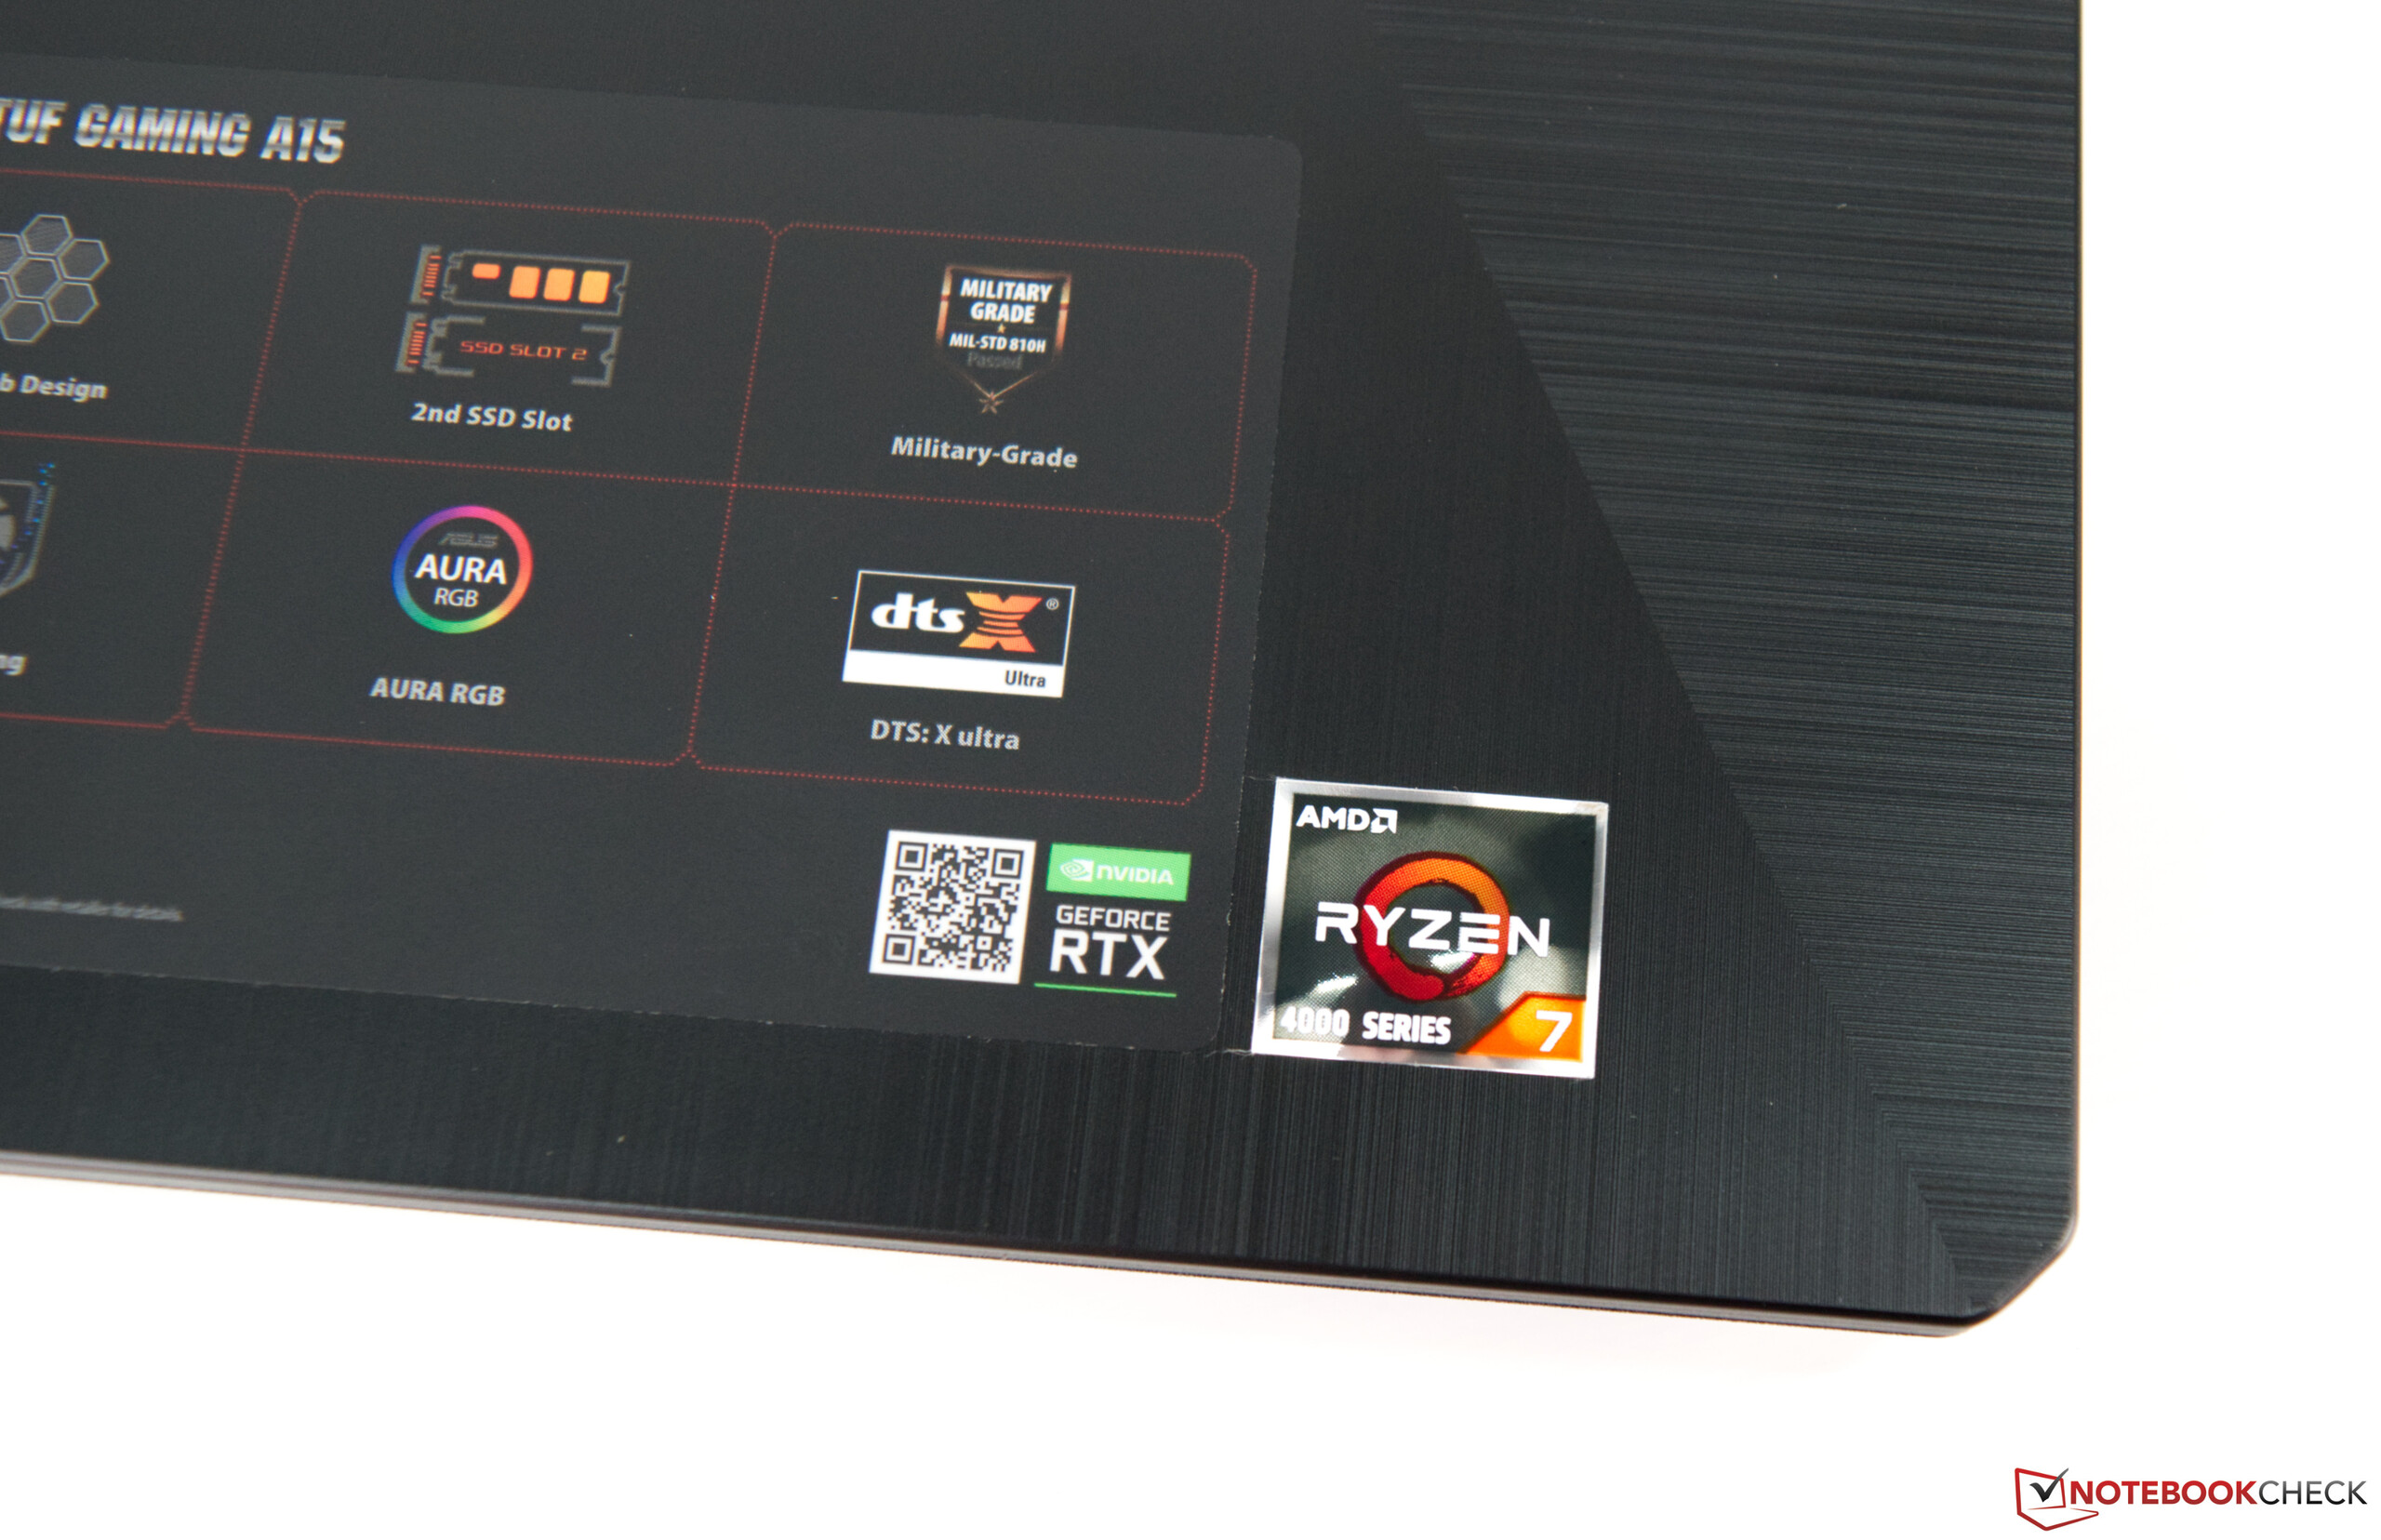
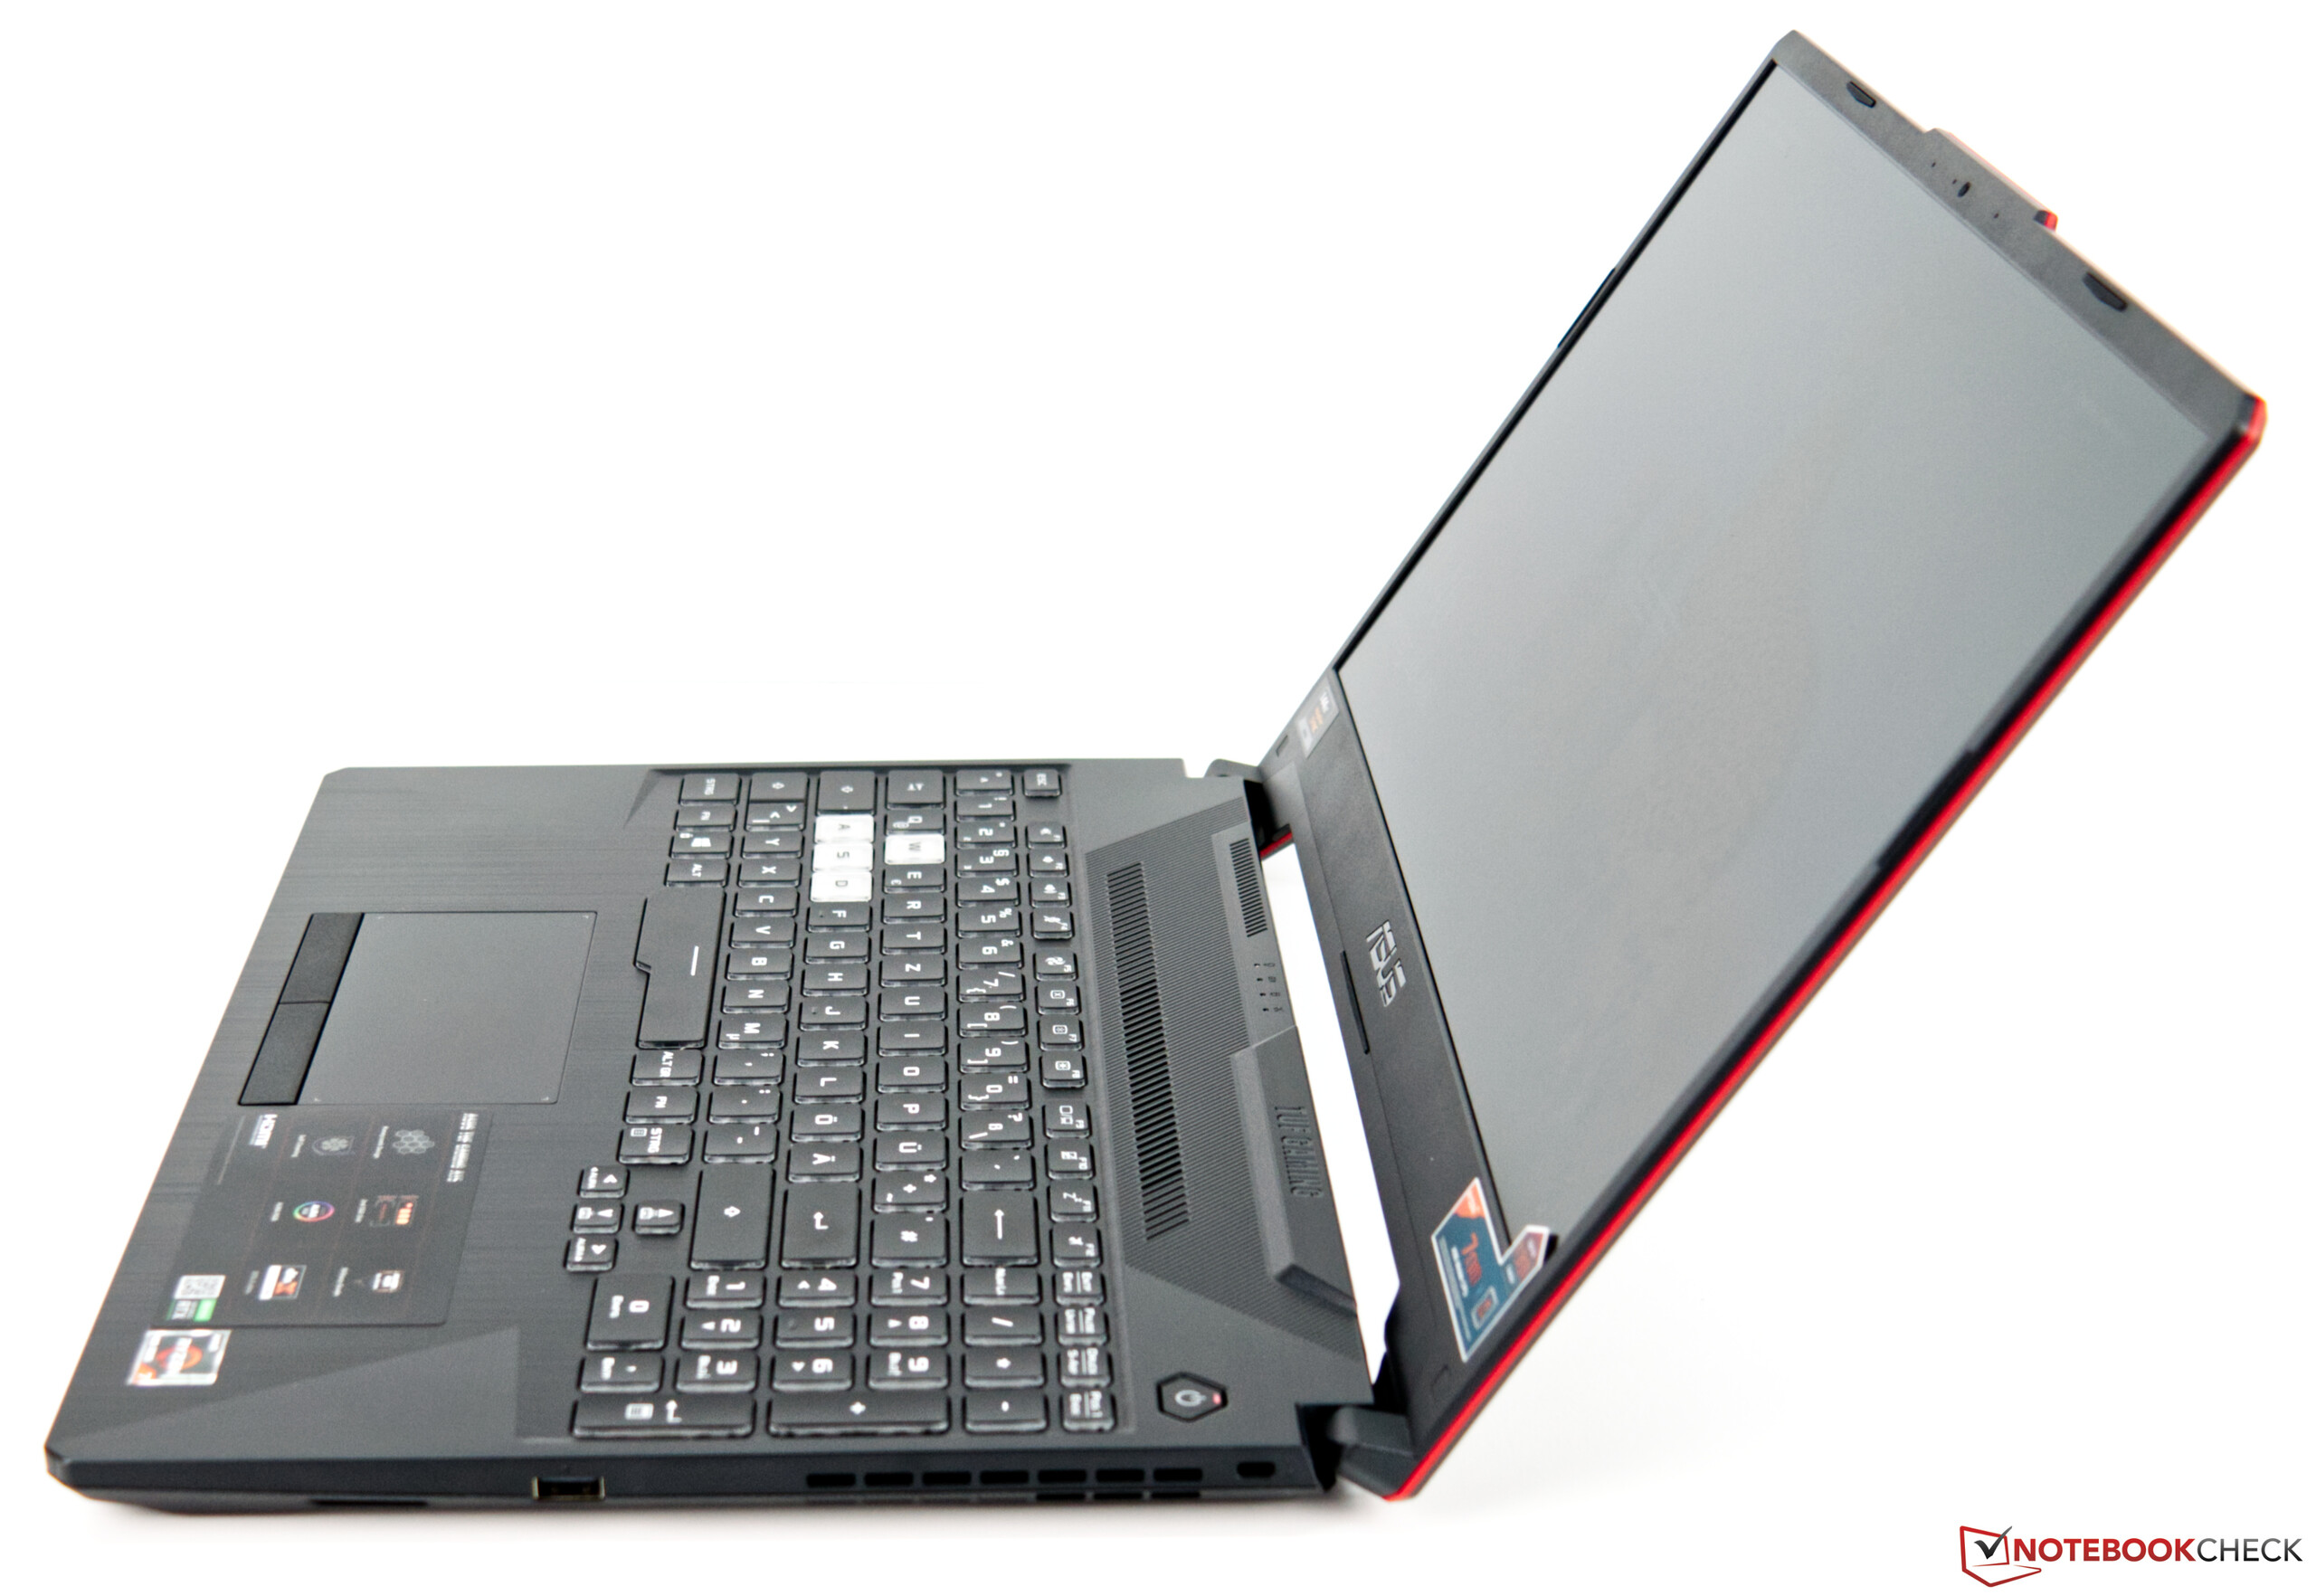
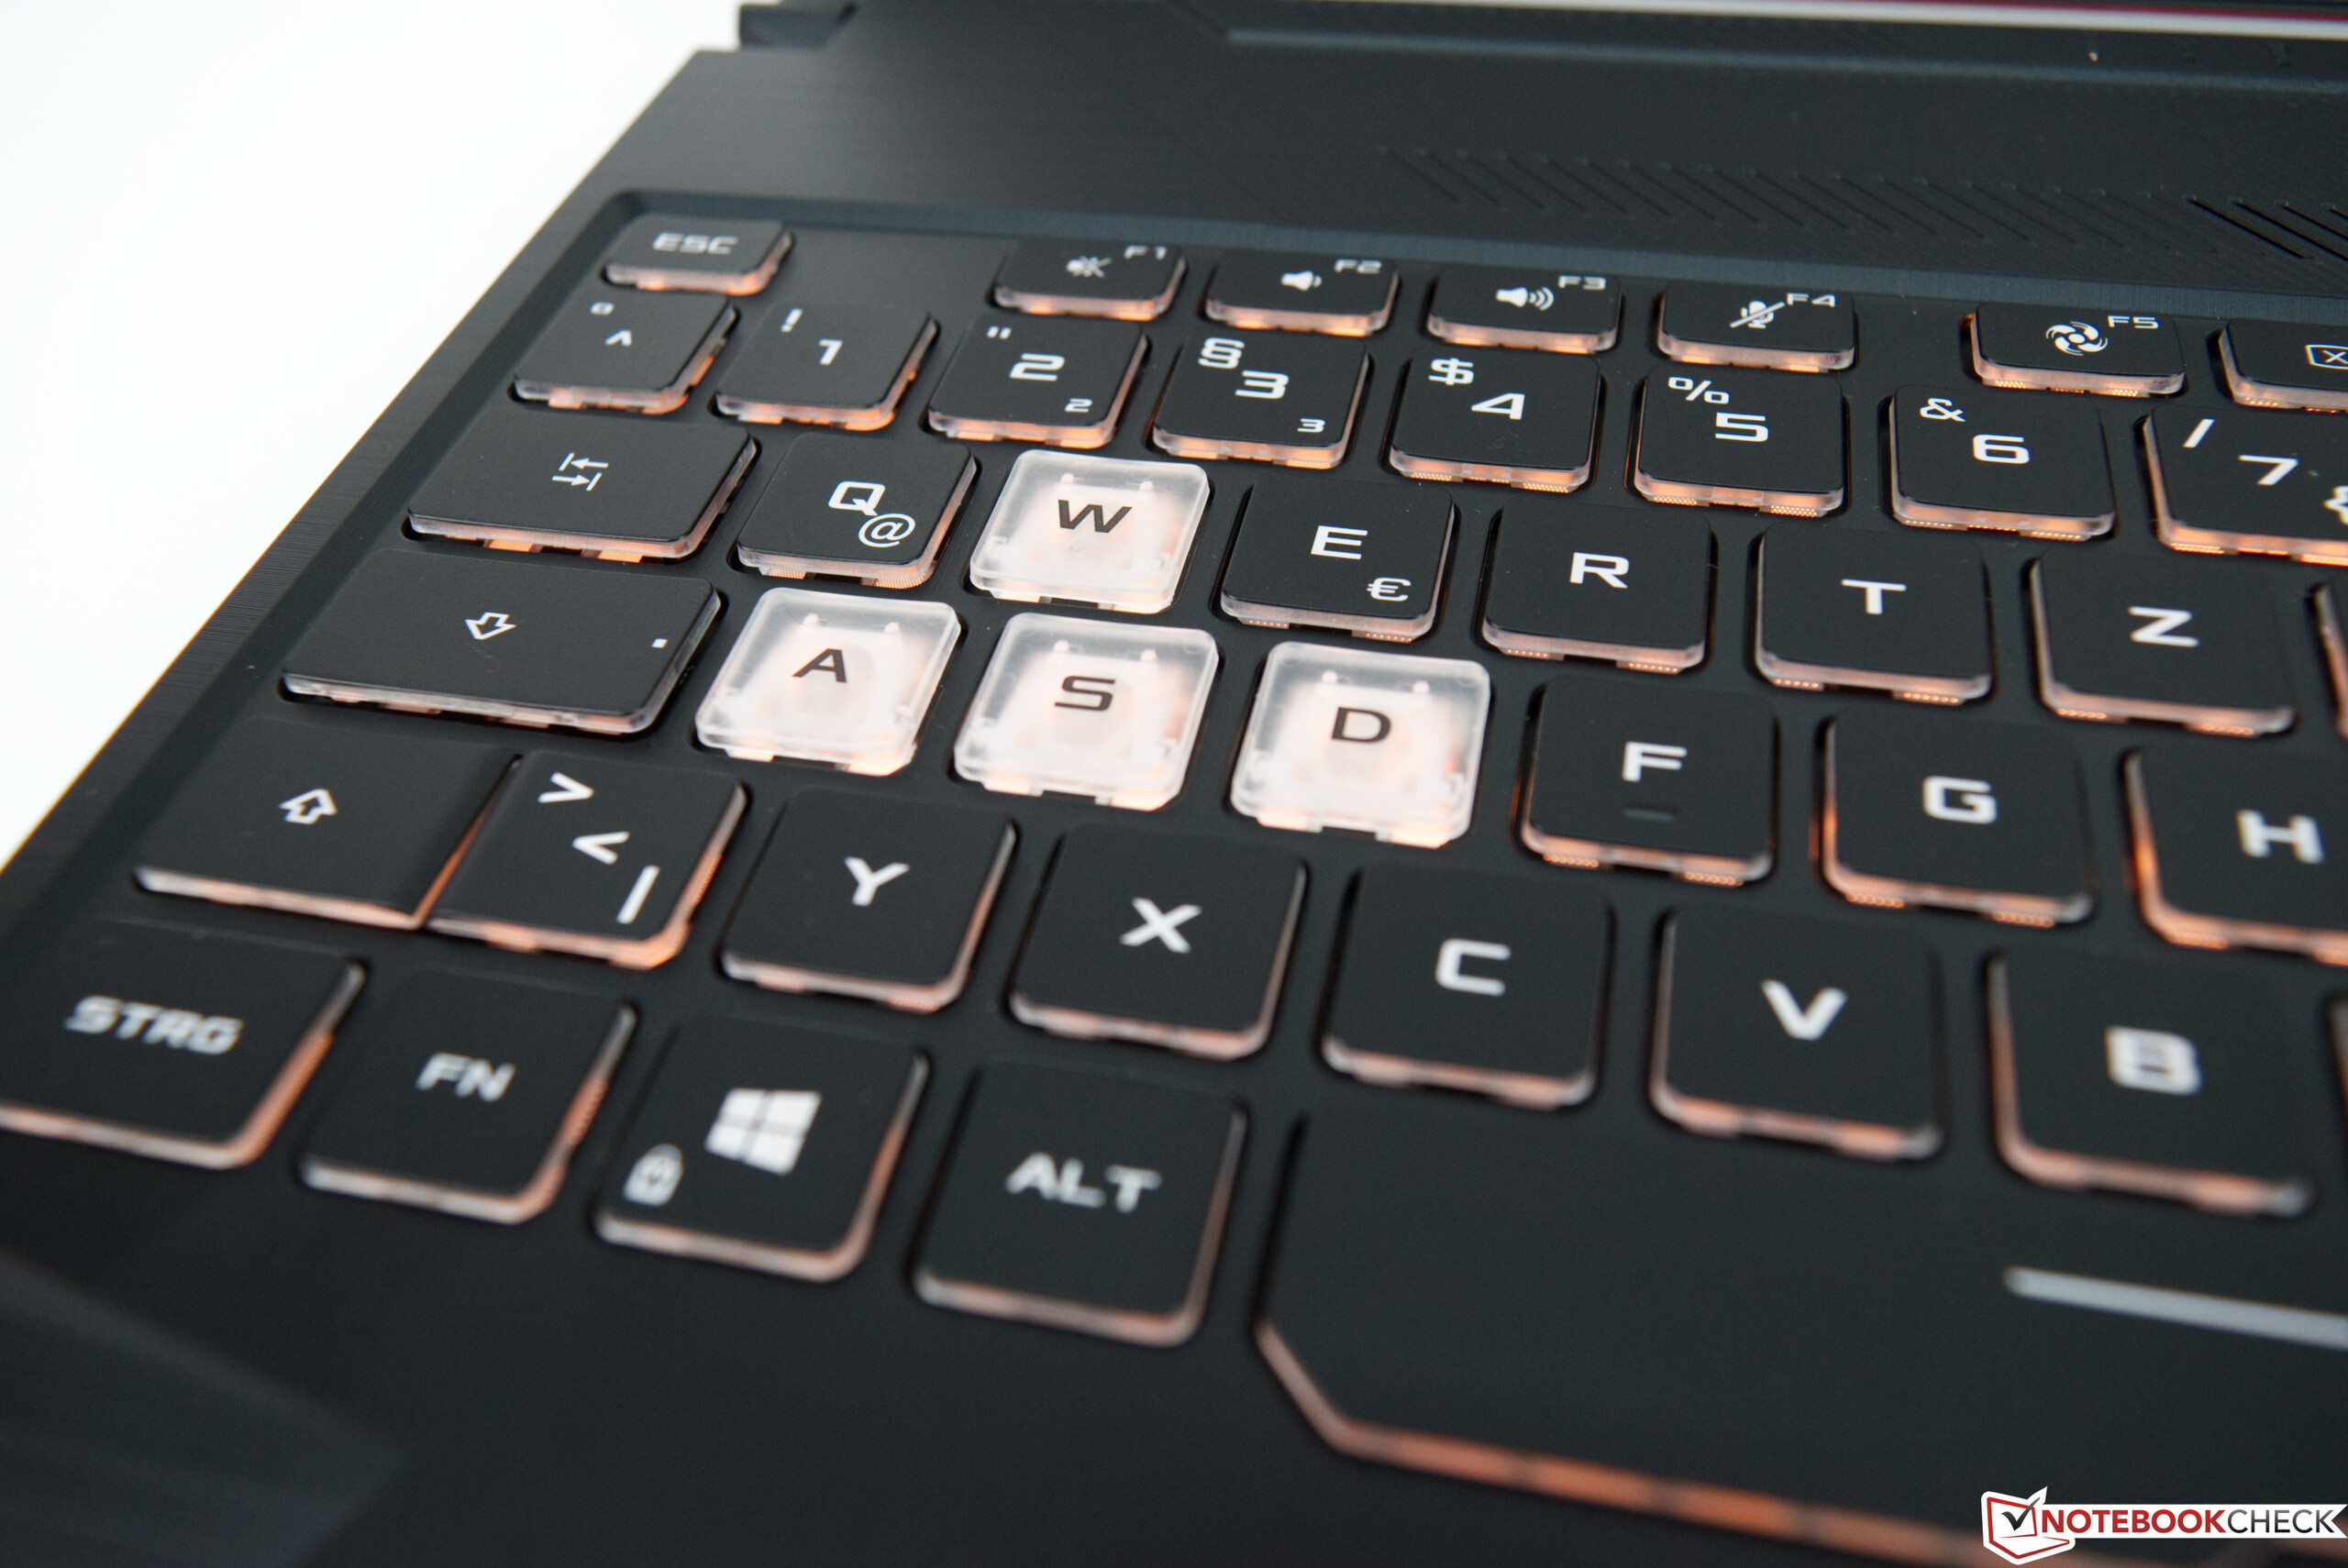
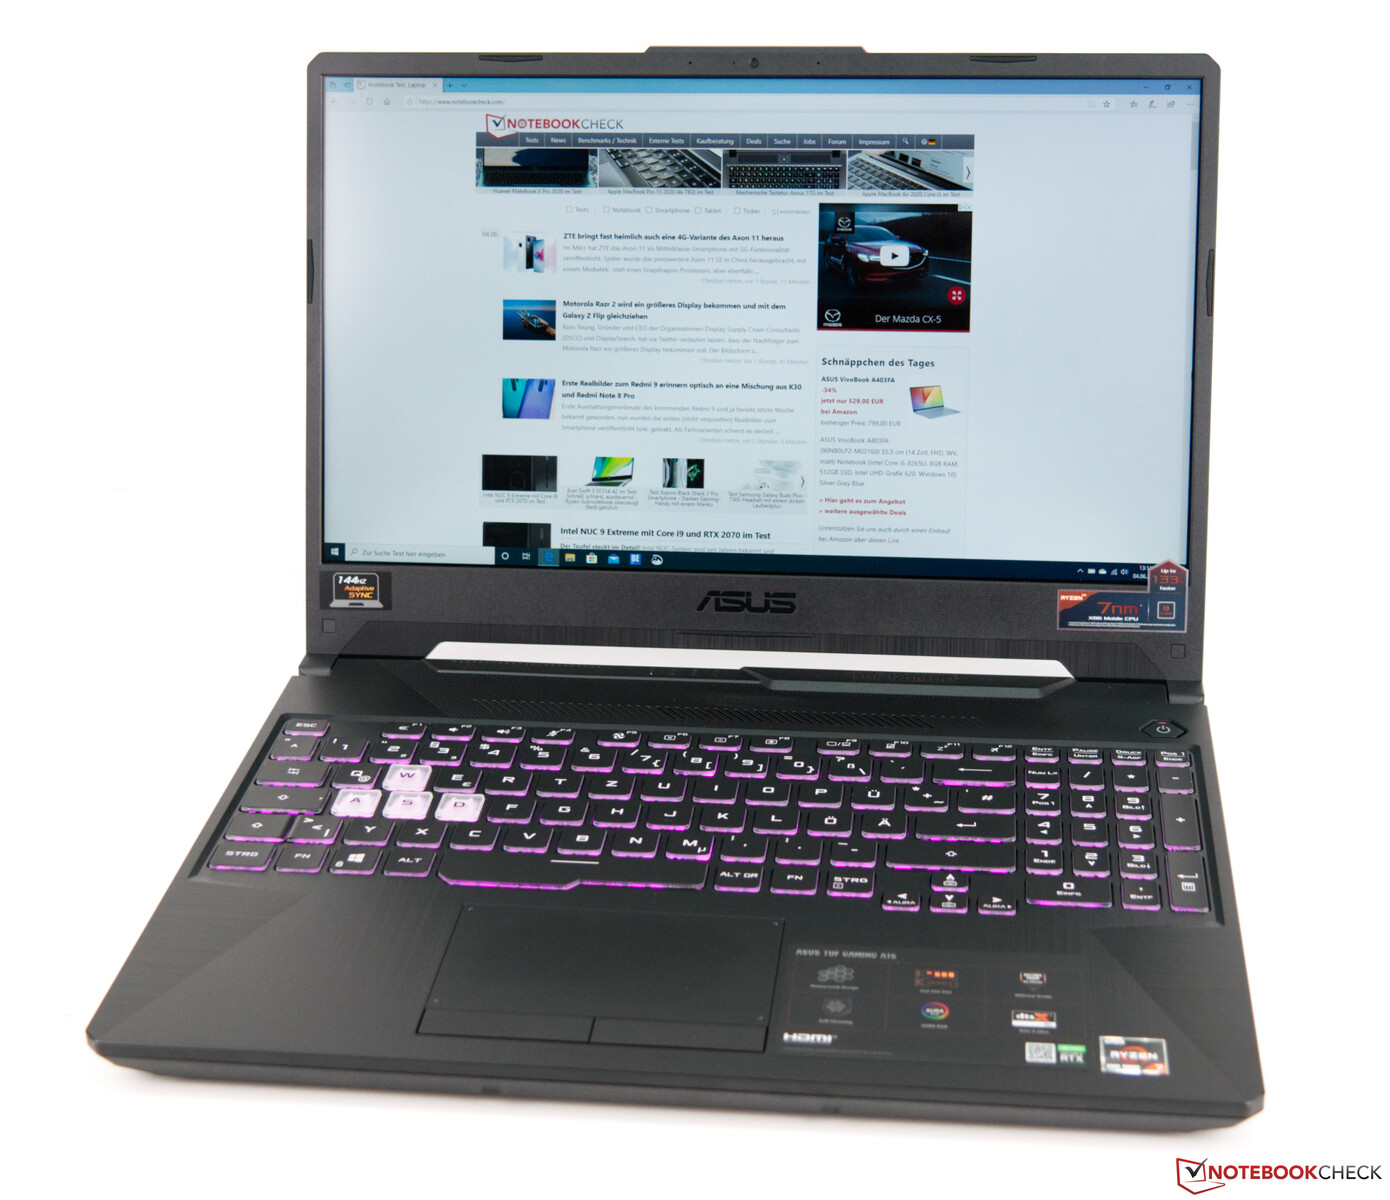
Breve Análise do Asus TUF A15 com AMD Renoir e gráficos Nvidia Graphics
Avaliação | Data | Modelo | Peso | Altura | Size | Resolução | Preço |
|---|---|---|---|---|---|---|---|
| 82.7 % v7 (old) | 06/2020 | Asus TUF Gaming A15 FA506IV-HN172 R7 4800H, GeForce RTX 2060 Mobile | 2.2 kg | 24.9 mm | 15.60" | 1920x1080 | |
| 82.3 % v7 (old) | 08/2019 | Lenovo Legion Y540-15IRH-81SX00B2GE i7-9750H, GeForce GTX 1660 Ti Mobile | 2.2 kg | 26 mm | 15.60" | 1920x1080 | |
| 78.8 % v7 (old) | 02/2020 | MSI Alpha 15 A3DDK-034 R7 3750H, Radeon RX 5500M | 2.3 kg | 27.5 mm | 15.60" | 1920x1080 | |
| 80.8 % v7 (old) | 10/2019 | MSI GL65 9SEK i7-9750H, GeForce RTX 2060 Mobile | 2.3 kg | 27.5 mm | 15.60" | 1920x1080 | |
| 81.5 % v7 (old) | 07/2019 | HP Omen 15-dc1020ng i5-9300H, GeForce GTX 1650 Mobile | 2.3 kg | 25 mm | 15.60" | 1920x1080 | |
| 83.3 % v6 (old) | 05/2019 | Asus ROG Zephyrus G15 GA502DU R7 3750H, GeForce GTX 1660 Ti Max-Q | 2.1 kg | 20.4 mm | 15.60" | 1920x1080 |


| |||||||||||||||||||||||||
iluminação: 88 %
iluminação com acumulador: 280 cd/m²
Contraste: 1867:1 (Preto: 0.15 cd/m²)
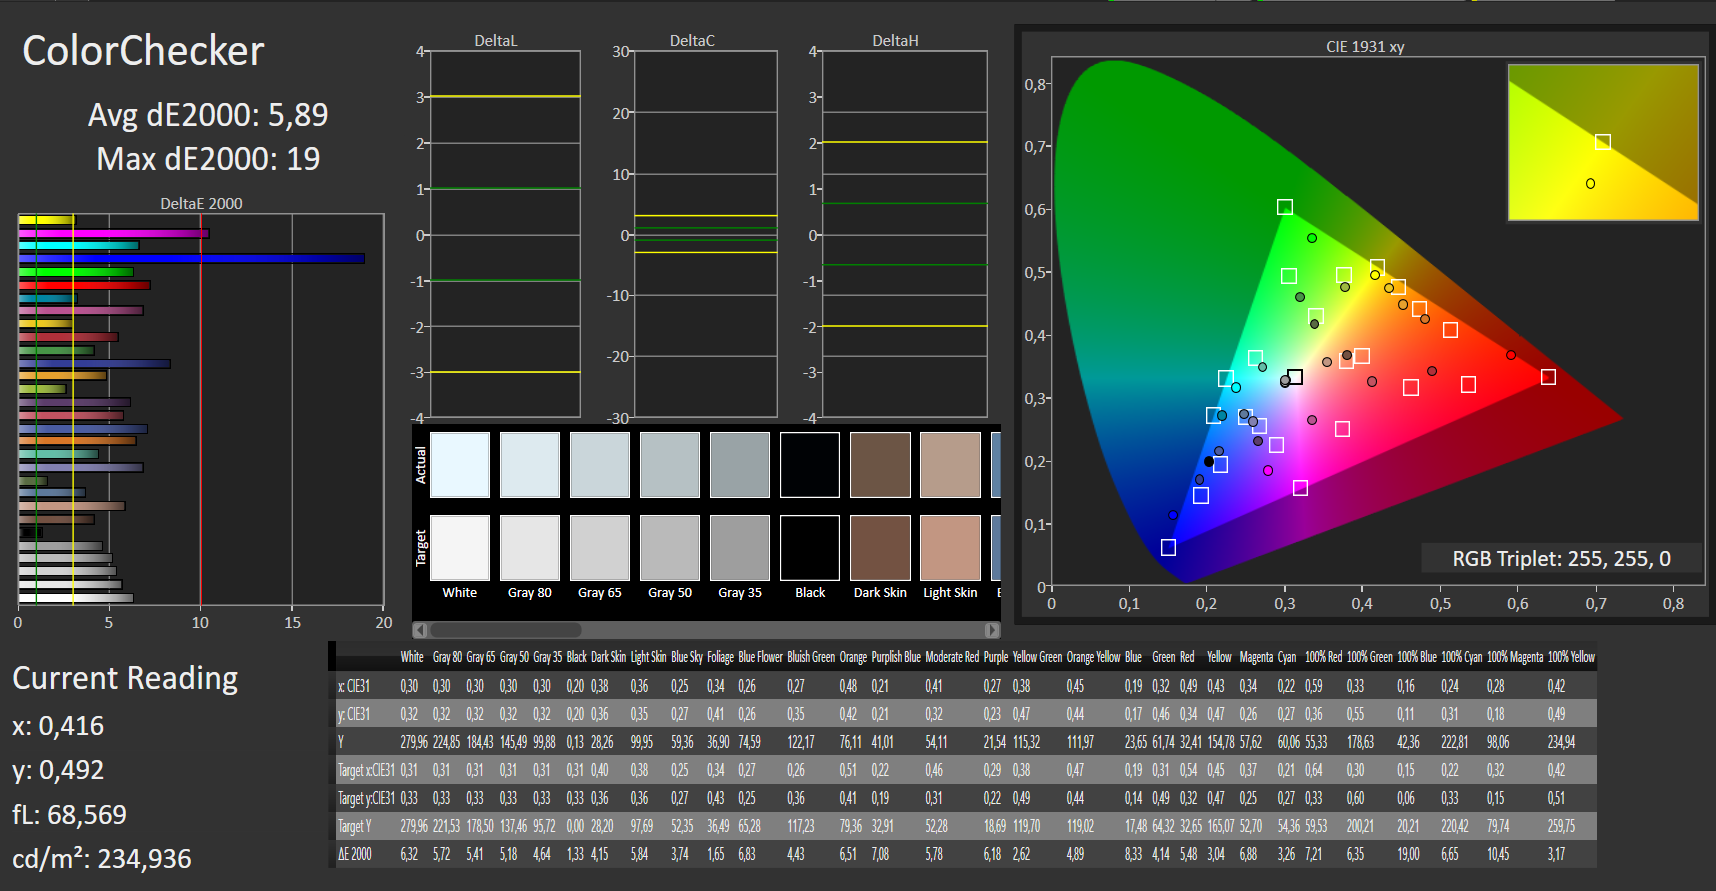
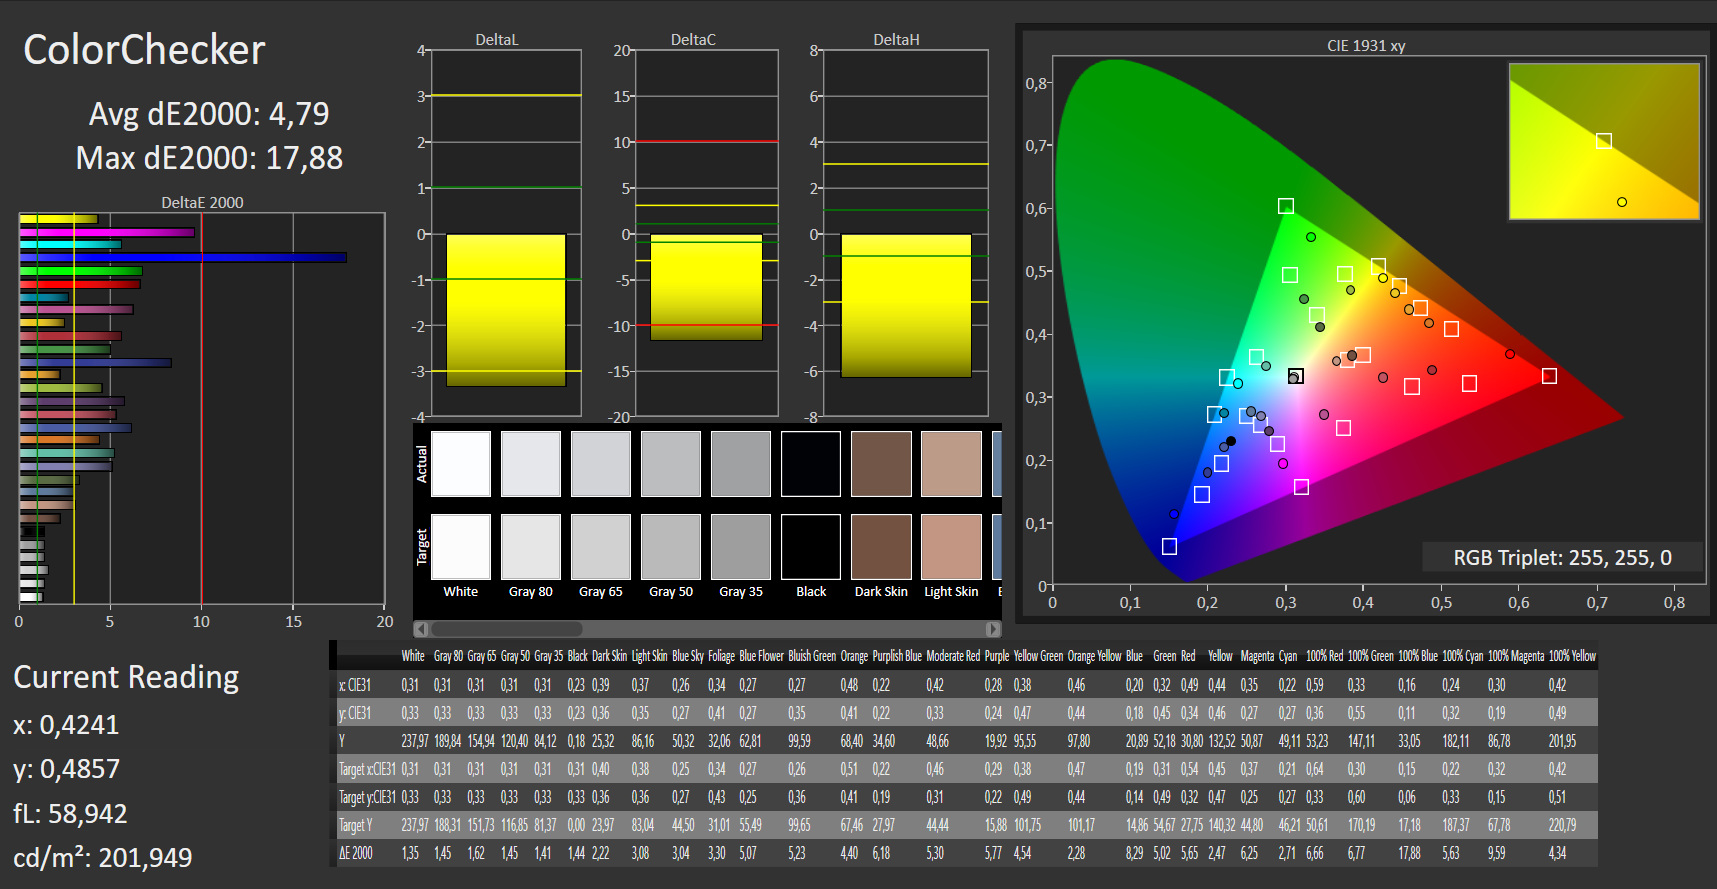
ΔE ColorChecker Calman: 5.89 | ∀{0.5-29.43 Ø4.73}
calibrated: 4.79
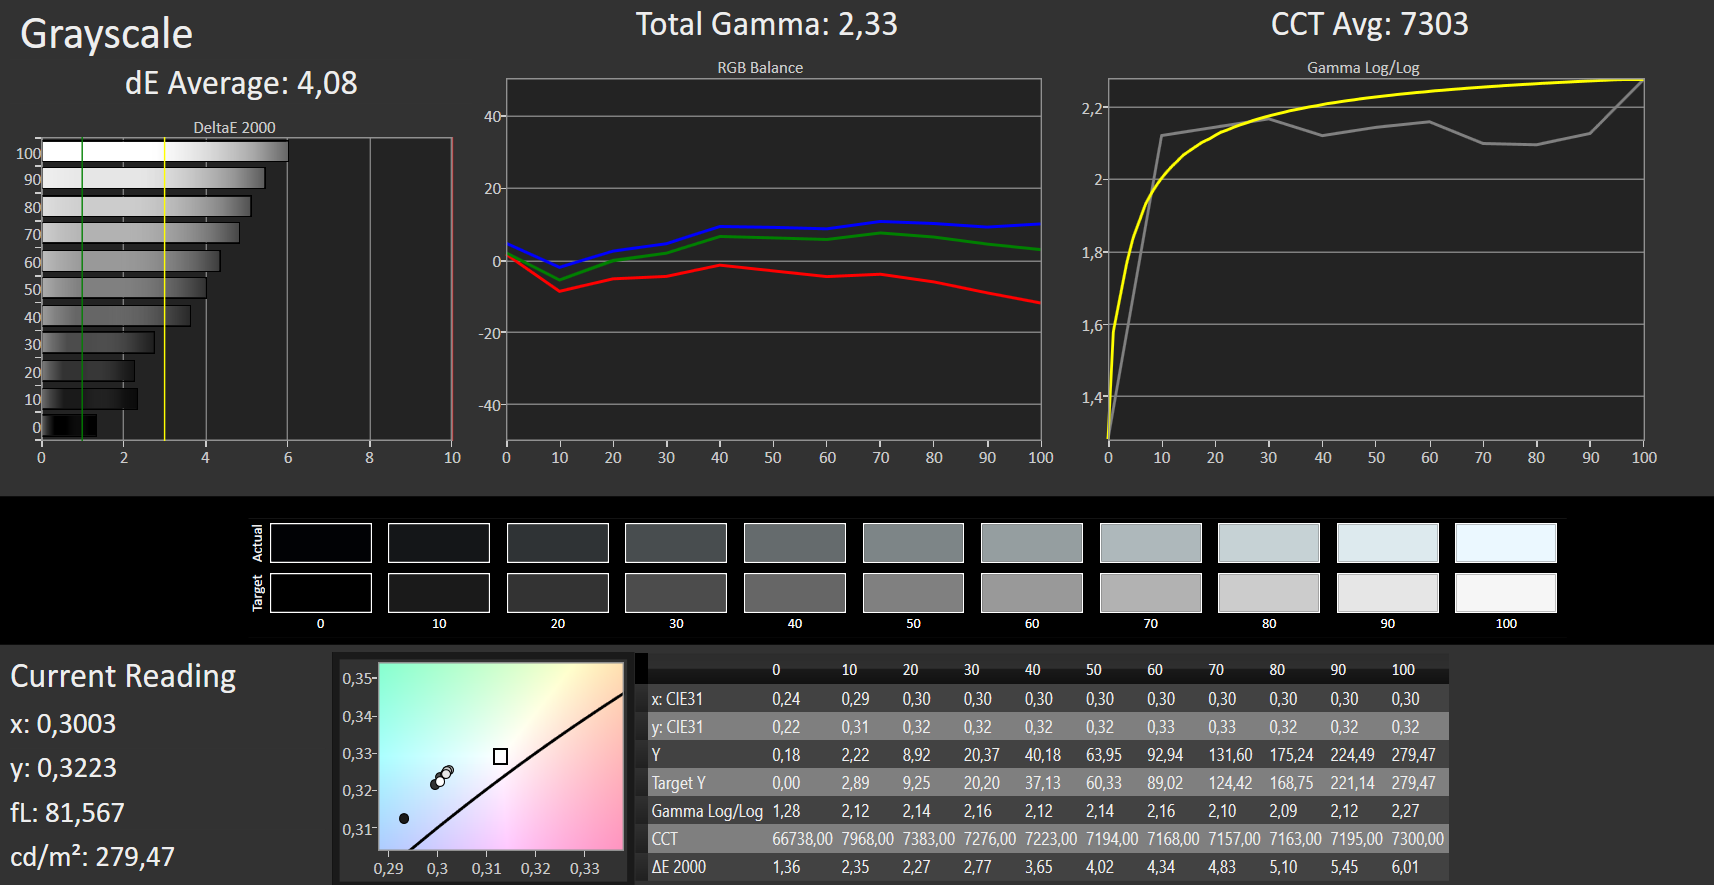
ΔE Greyscale Calman: 4.08 | ∀{0.09-98 Ø4.97}
58% sRGB (Argyll 1.6.3 3D)
37% AdobeRGB 1998 (Argyll 1.6.3 3D)
40.22% AdobeRGB 1998 (Argyll 3D)
58.5% sRGB (Argyll 3D)
38.92% Display P3 (Argyll 3D)
Gamma: 2.33
CCT: 7303 K
| Asus TUF Gaming A15 FA506IV-HN172 LM156LF-2F01, IPS, 1920x1080, 15.6" | Lenovo Legion Y540-15IRH-81SX00B2GE BOE 084D, IPS, 1920x1080, 15.6" | MSI Alpha 15 A3DDK-034 AU Optronics B156HAN08.0 (AUO80ED), IPS, 1920x1080, 15.6" | MSI GL65 9SEK AU Optronics B156HAN13.0, IPS, 1920x1080, 15.6" | HP Omen 15-dc1020ng LGD05CE, IPS, 1920x1080, 15.6" | Asus ROG Zephyrus G15 GA502DU Panda LM156LF-CL03, IPS, 1920x1080, 15.6" | |
|---|---|---|---|---|---|---|
| Display | 61% | 64% | -6% | -1% | 4% | |
| Display P3 Coverage (%) | 38.92 | 63.6 63% | 66.4 71% | 36.63 -6% | 38.37 -1% | 40.33 4% |
| sRGB Coverage (%) | 58.5 | 91.7 57% | 91 56% | 55 -6% | 57.6 -2% | 60.6 4% |
| AdobeRGB 1998 Coverage (%) | 40.22 | 65.2 62% | 66.6 66% | 37.85 -6% | 39.69 -1% | 41.69 4% |
| Response Times | 62% | 68% | -2% | -21% | -9% | |
| Response Time Grey 50% / Grey 80% * (ms) | 34 ? | 8.8 ? 74% | 7 ? 79% | 26.4 ? 22% | 40 ? -18% | 34 ? -0% |
| Response Time Black / White * (ms) | 24 ? | 12 ? 50% | 10.4 ? 57% | 30 ? -25% | 29.6 ? -23% | 28 ? -17% |
| PWM Frequency (Hz) | 21280 ? | |||||
| Screen | 15% | 11% | -4% | -7% | -11% | |
| Brightness middle (cd/m²) | 280 | 299 7% | 310 11% | 277.3 -1% | 251 -10% | 240.1 -14% |
| Brightness (cd/m²) | 254 | 290 14% | 310 22% | 256 1% | 232 -9% | 231 -9% |
| Brightness Distribution (%) | 88 | 89 1% | 86 -2% | 86 -2% | 76 -14% | 85 -3% |
| Black Level * (cd/m²) | 0.15 | 0.29 -93% | 0.29 -93% | 0.2 -33% | 0.17 -13% | 0.34 -127% |
| Contrast (:1) | 1867 | 1031 -45% | 1069 -43% | 1387 -26% | 1476 -21% | 706 -62% |
| Colorchecker dE 2000 * | 5.89 | 3.7 37% | 4.78 19% | 5.25 11% | 6.2 -5% | 4.2 29% |
| Colorchecker dE 2000 max. * | 19 | 7 63% | 8.1 57% | 19.43 -2% | 18.6 2% | 17.8 6% |
| Colorchecker dE 2000 calibrated * | 4.79 | 2 58% | 2.36 51% | 4.39 8% | 4.8 -0% | 4.09 15% |
| Greyscale dE 2000 * | 4.08 | 4.1 -0% | 4.78 -17% | 3.5 14% | 4.2 -3% | 2.8 31% |
| Gamma | 2.33 94% | 2.19 100% | 2.43 91% | 2.1 105% | 2.32 95% | 2.2 100% |
| CCT | 7303 89% | 7166 91% | 7739 84% | 6895 94% | 7454 87% | 6925 94% |
| Color Space (Percent of AdobeRGB 1998) (%) | 37 | 59.3 60% | 59 59% | 35 -5% | 36.5 -1% | 38.4 4% |
| Color Space (Percent of sRGB) (%) | 58 | 91.5 58% | 91 57% | 55 -5% | 57.4 -1% | 60.4 4% |
| Média Total (Programa/Configurações) | 46% /
29% | 48% /
28% | -4% /
-4% | -10% /
-8% | -5% /
-8% |
* ... menor é melhor

Exibir tempos de resposta
| ↔ Tempo de resposta preto para branco | ||
|---|---|---|
| 24 ms ... ascensão ↗ e queda ↘ combinadas | ↗ 13 ms ascensão | 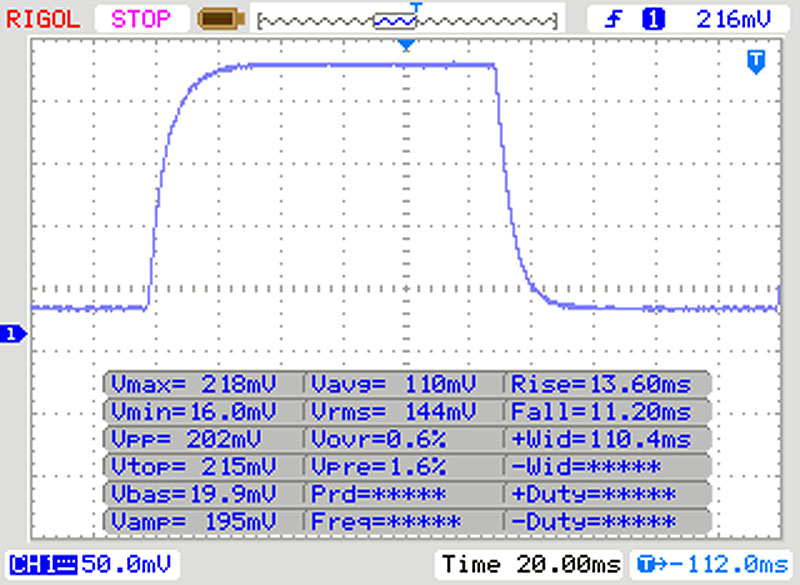 |
| ↘ 11 ms queda | ||
| A tela mostra boas taxas de resposta em nossos testes, mas pode ser muito lenta para jogadores competitivos. Em comparação, todos os dispositivos testados variam de 0.1 (mínimo) a 240 (máximo) ms. » 54 % de todos os dispositivos são melhores. Isso significa que o tempo de resposta medido é pior que a média de todos os dispositivos testados (19.9 ms). | ||
| ↔ Tempo de resposta 50% cinza a 80% cinza | ||
| 34 ms ... ascensão ↗ e queda ↘ combinadas | ↗ 16 ms ascensão | 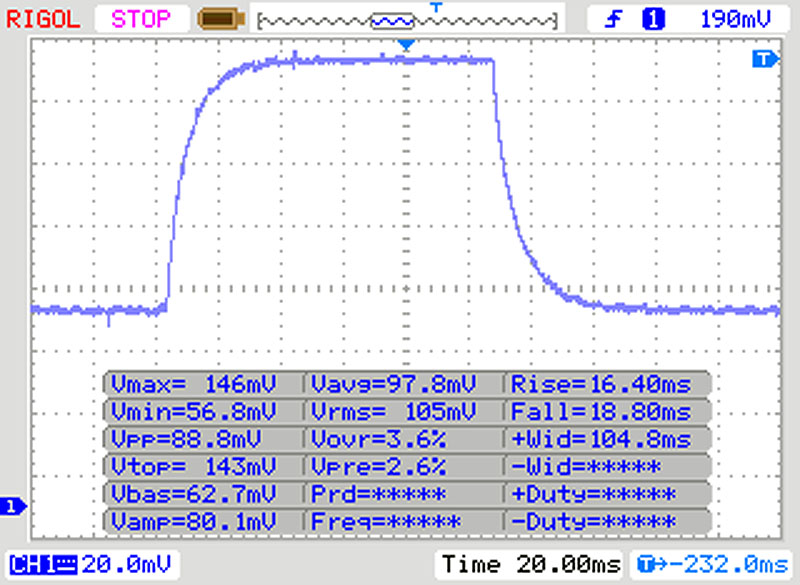 |
| ↘ 18 ms queda | ||
| A tela mostra taxas de resposta lentas em nossos testes e será insatisfatória para os jogadores. Em comparação, todos os dispositivos testados variam de 0.165 (mínimo) a 636 (máximo) ms. » 47 % de todos os dispositivos são melhores. Isso significa que o tempo de resposta medido é semelhante à média de todos os dispositivos testados (31.1 ms). | ||
Cintilação da tela / PWM (modulação por largura de pulso)
| Tela tremeluzindo / PWM não detectado | 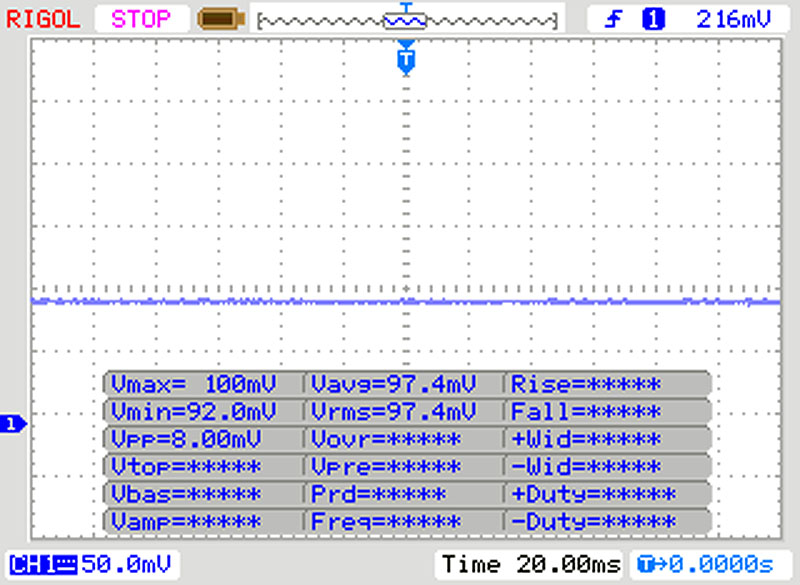 | ||
[pwm_comparison] Em comparação: 52 % de todos os dispositivos testados não usam PWM para escurecer a tela. Se PWM foi detectado, uma média de 7784 (mínimo: 5 - máximo: 343500) Hz foi medida. | |||
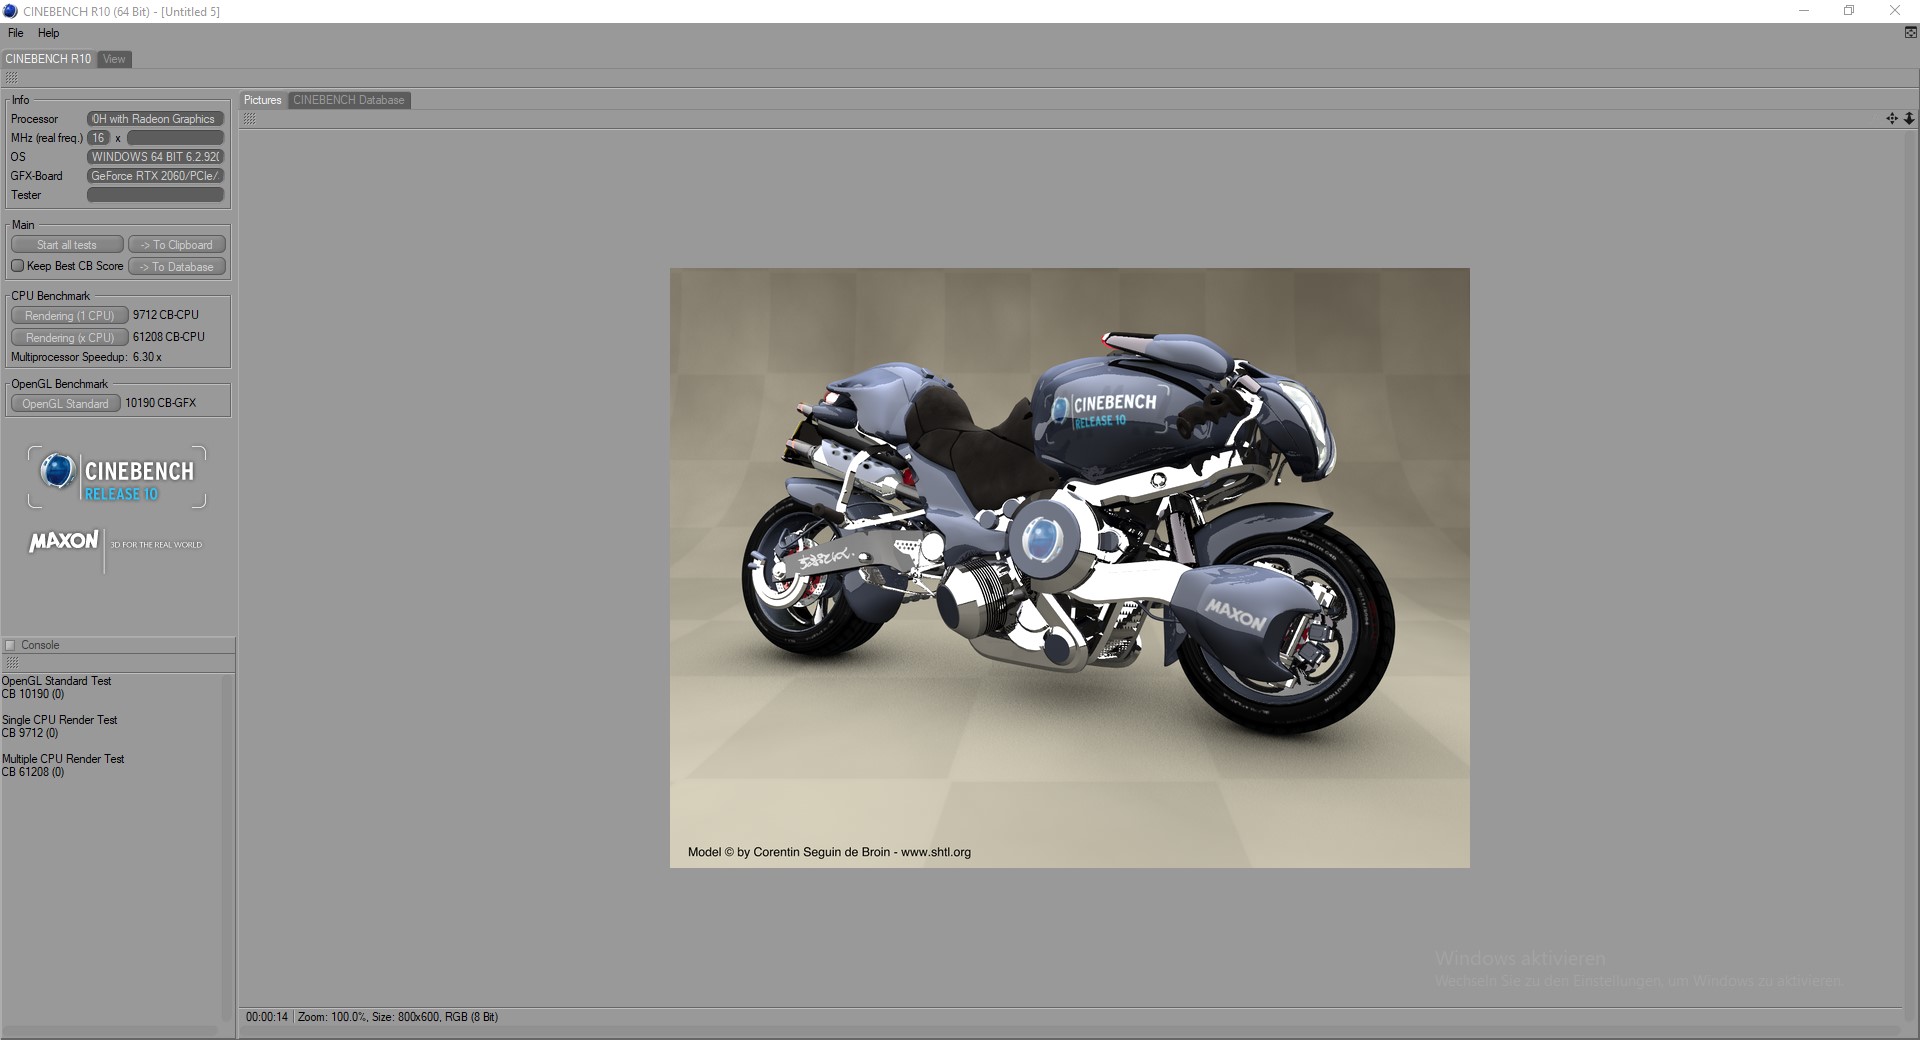
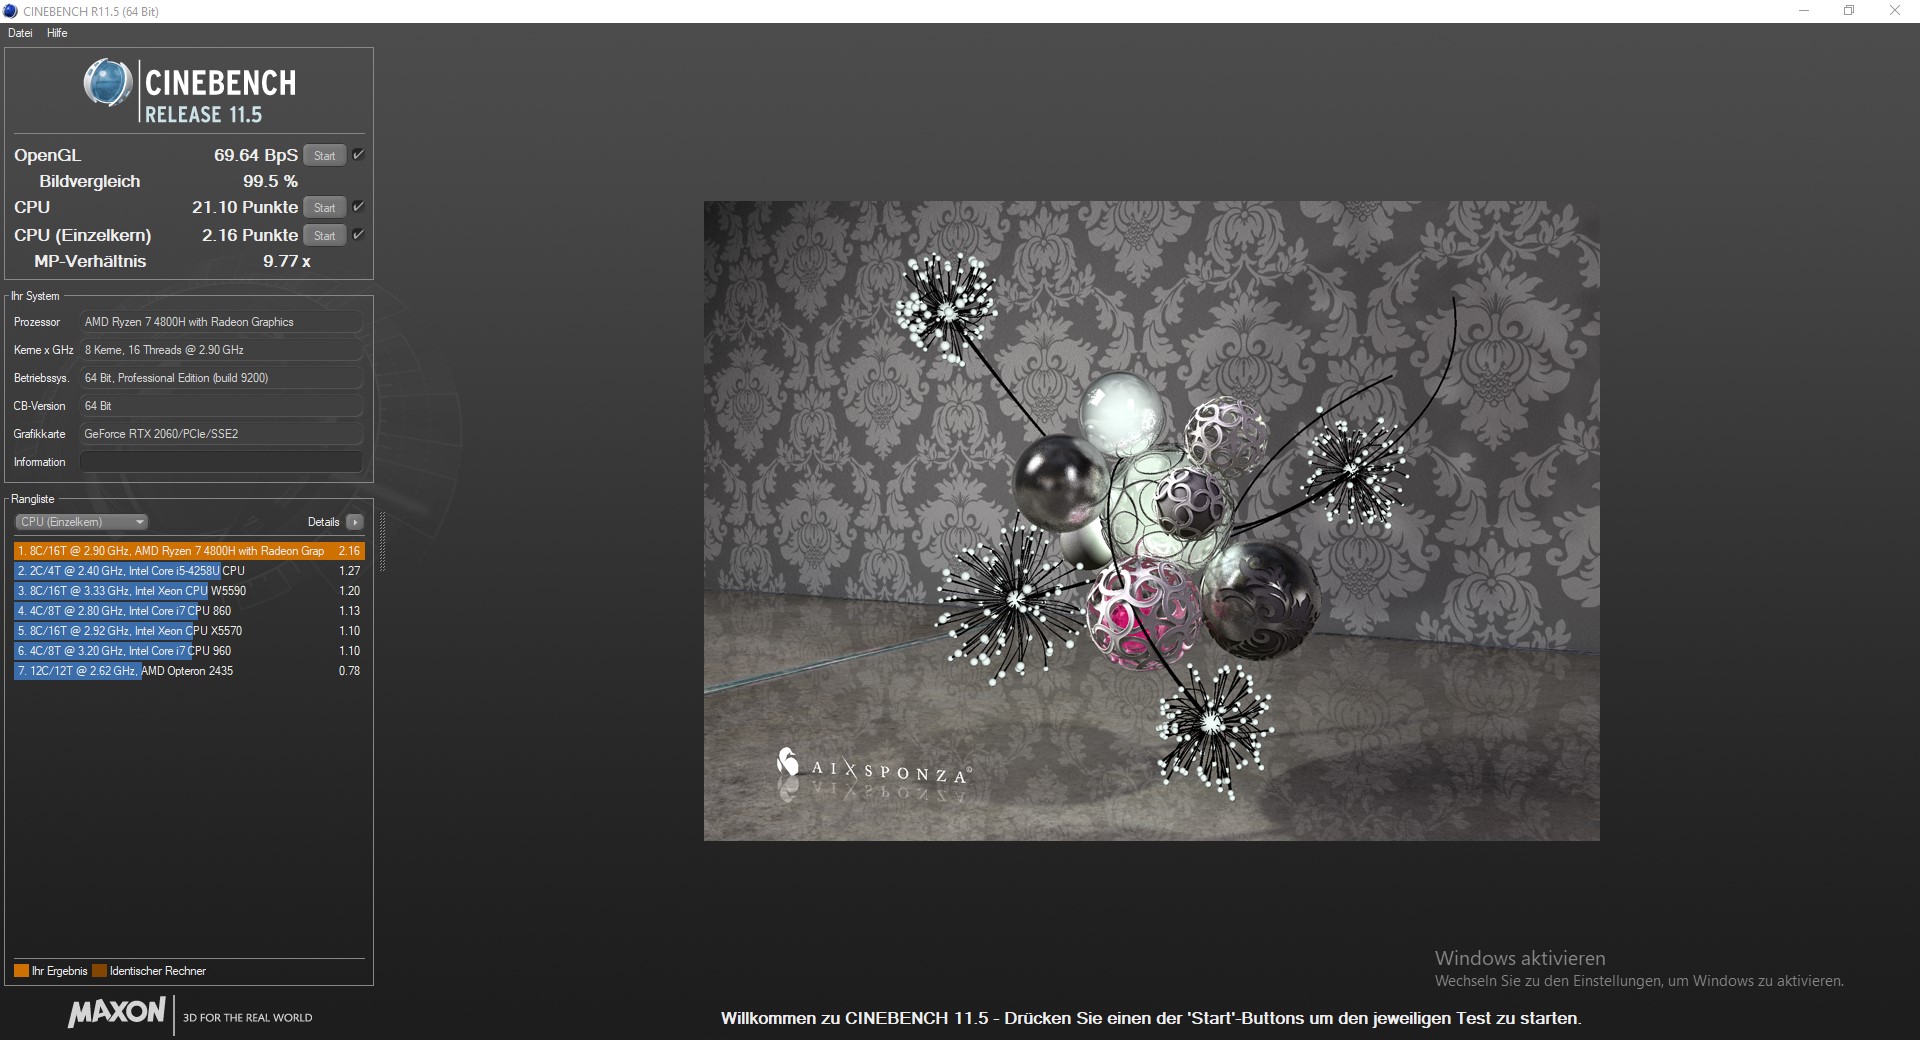
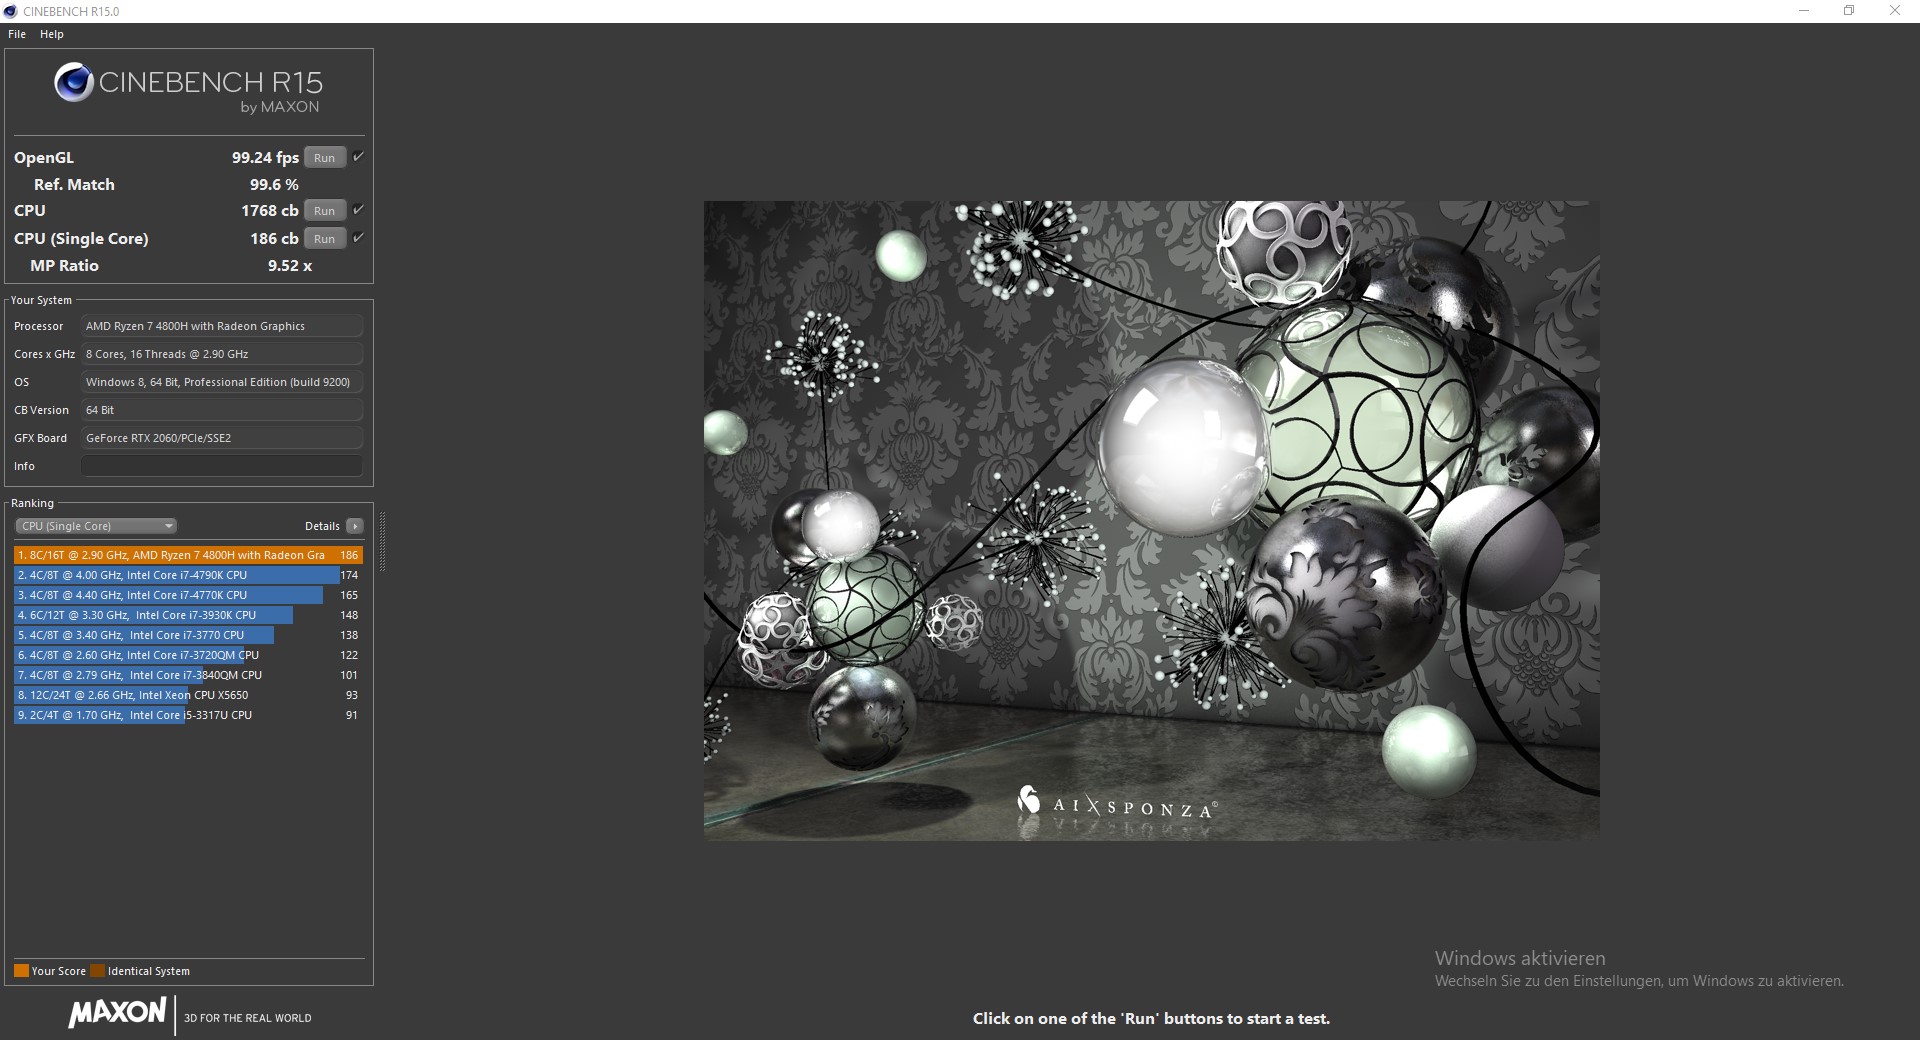
Cinebench R15: CPU Single 64Bit | CPU Multi 64Bit
Blender: v2.79 BMW27 CPU
7-Zip 18.03: 7z b 4 -mmt1 | 7z b 4
Geekbench 5.5: Single-Core | Multi-Core
HWBOT x265 Benchmark v2.2: 4k Preset
LibreOffice : 20 Documents To PDF
R Benchmark 2.5: Overall mean
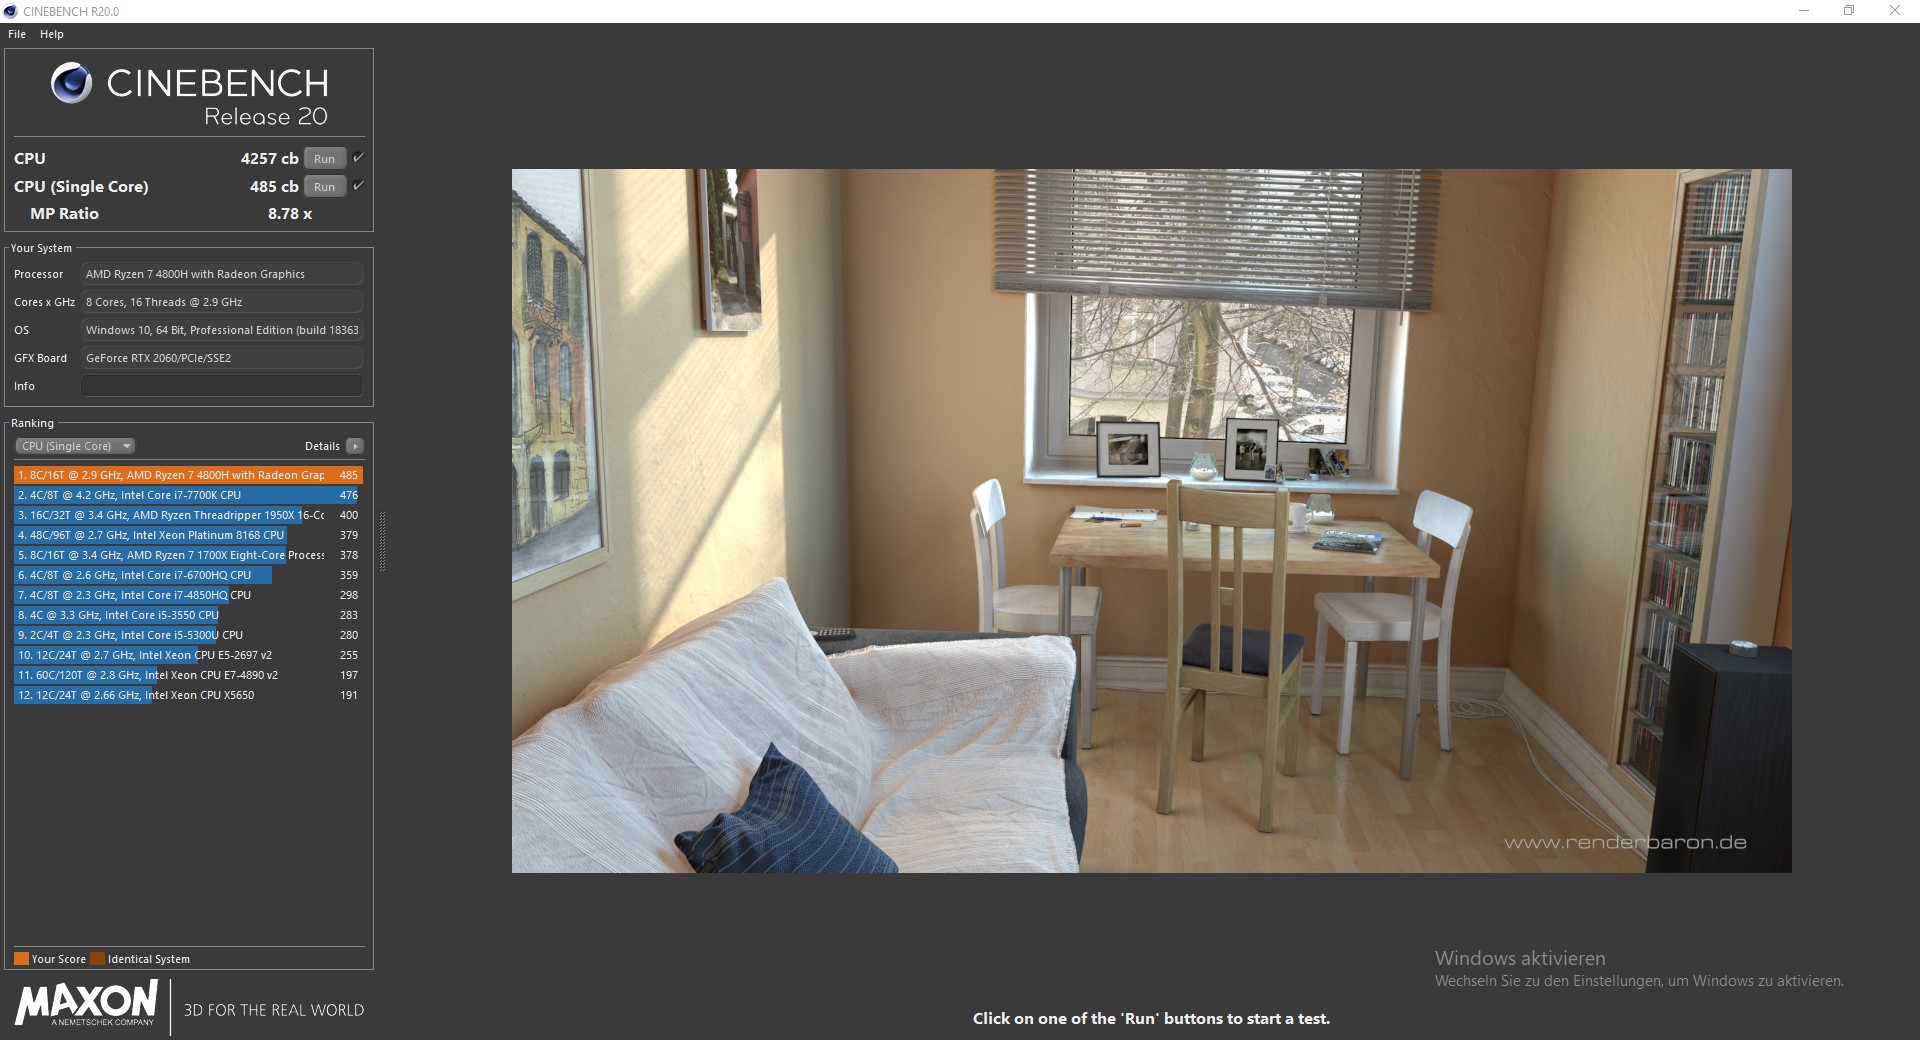
| Cinebench R20 / CPU (Single Core) | |
| Média da turma Gaming (442 - 895, n=109, últimos 2 anos) | |
| Média Intel Core i7-10875H (430 - 524, n=32) | |
| Asus TUF Gaming A15 FA506IV-HN172 | |
| MSI GL65 9SEK | |
| Lenovo Legion Y540-15IRH-81SX00B2GE | |
| HP Omen 15-dc1020ng | |
| MSI Alpha 15 A3DDK-034 | |
| Asus ROG Zephyrus G15 GA502DU | |
| Cinebench R20 / CPU (Multi Core) | |
| Média da turma Gaming (4029 - 16108, n=109, últimos 2 anos) | |
| Asus TUF Gaming A15 FA506IV-HN172 | |
| Média Intel Core i7-10875H (1986 - 4176, n=32) | |
| MSI GL65 9SEK | |
| Lenovo Legion Y540-15IRH-81SX00B2GE | |
| Asus ROG Zephyrus G15 GA502DU | |
| HP Omen 15-dc1020ng | |
| MSI Alpha 15 A3DDK-034 | |
| Cinebench R15 / CPU Single 64Bit | |
| Média da turma Gaming (188.8 - 343, n=109, últimos 2 anos) | |
| Média Intel Core i7-10875H (190 - 220, n=37) | |
| MSI GL65 9SEK | |
| Lenovo Legion Y540-15IRH-81SX00B2GE | |
| Asus TUF Gaming A15 FA506IV-HN172 | |
| HP Omen 15-dc1020ng | |
| Asus ROG Zephyrus G15 GA502DU | |
| MSI Alpha 15 A3DDK-034 | |
| Cinebench R15 / CPU Multi 64Bit | |
| Média da turma Gaming (1578 - 6271, n=109, últimos 2 anos) | |
| Asus TUF Gaming A15 FA506IV-HN172 | |
| Média Intel Core i7-10875H (1003 - 1833, n=38) | |
| MSI GL65 9SEK | |
| Lenovo Legion Y540-15IRH-81SX00B2GE | |
| Asus ROG Zephyrus G15 GA502DU | |
| HP Omen 15-dc1020ng | |
| MSI Alpha 15 A3DDK-034 | |
| Blender / v2.79 BMW27 CPU | |
| HP Omen 15-dc1020ng | |
| Asus ROG Zephyrus G15 GA502DU | |
| Lenovo Legion Y540-15IRH-81SX00B2GE | |
| Média Intel Core i7-10875H (259 - 535, n=30) | |
| Asus TUF Gaming A15 FA506IV-HN172 | |
| Média da turma Gaming (80 - 330, n=107, últimos 2 anos) | |
| 7-Zip 18.03 / 7z b 4 -mmt1 | |
| Média da turma Gaming (4199 - 7436, n=108, últimos 2 anos) | |
| Média Intel Core i7-10875H (5071 - 5780, n=31) | |
| Lenovo Legion Y540-15IRH-81SX00B2GE | |
| Asus TUF Gaming A15 FA506IV-HN172 | |
| HP Omen 15-dc1020ng | |
| Asus ROG Zephyrus G15 GA502DU | |
| 7-Zip 18.03 / 7z b 4 | |
| Média da turma Gaming (33491 - 148086, n=108, últimos 2 anos) | |
| Asus TUF Gaming A15 FA506IV-HN172 | |
| Média Intel Core i7-10875H (29844 - 49562, n=31) | |
| Lenovo Legion Y540-15IRH-81SX00B2GE | |
| HP Omen 15-dc1020ng | |
| Asus ROG Zephyrus G15 GA502DU | |
| Geekbench 5.5 / Single-Core | |
| Média da turma Gaming (986 - 2474, n=108, últimos 2 anos) | |
| Média Intel Core i7-10875H (1233 - 1371, n=29) | |
| Asus TUF Gaming A15 FA506IV-HN172 | |
| MSI Alpha 15 A3DDK-034 | |
| Geekbench 5.5 / Multi-Core | |
| Média da turma Gaming (6460 - 27010, n=108, últimos 2 anos) | |
| Média Intel Core i7-10875H (5715 - 8620, n=29) | |
| Asus TUF Gaming A15 FA506IV-HN172 | |
| MSI Alpha 15 A3DDK-034 | |
| HWBOT x265 Benchmark v2.2 / 4k Preset | |
| Média da turma Gaming (11.5 - 44.3, n=108, últimos 2 anos) | |
| Média Intel Core i7-10875H (7.27 - 14.1, n=27) | |
| Asus TUF Gaming A15 FA506IV-HN172 | |
| Lenovo Legion Y540-15IRH-81SX00B2GE | |
| HP Omen 15-dc1020ng | |
| Asus ROG Zephyrus G15 GA502DU | |
| LibreOffice / 20 Documents To PDF | |
| Média Intel Core i7-10875H (30.2 - 84.3, n=30) | |
| Média da turma Gaming (19 - 88.8, n=108, últimos 2 anos) | |
| Asus TUF Gaming A15 FA506IV-HN172 | |
| R Benchmark 2.5 / Overall mean | |
| Asus TUF Gaming A15 FA506IV-HN172 | |
| Média Intel Core i7-10875H (0.546 - 0.662, n=29) | |
| Média da turma Gaming (0.3439 - 0.759, n=109, últimos 2 anos) | |
* ... menor é melhor
Cinebench R15 Multi-Thread Loop
| PCMark 8 Home Score Accelerated v2 | 4698 pontos | |
| PCMark 8 Creative Score Accelerated v2 | 7841 pontos | |
| PCMark 8 Work Score Accelerated v2 | 5773 pontos | |
| PCMark 10 Score | 5095 pontos | |
Ajuda | ||
| DPC Latencies / LatencyMon - interrupt to process latency (max), Web, Youtube, Prime95 | |
| Asus TUF Gaming A15 FA506IV-HN172 | |
* ... menor é melhor
| Asus TUF Gaming A15 FA506IV-HN172 Kingston OM8PCP3512F-AB | Lenovo Legion Y540-15IRH-81SX00B2GE WDC PC SN720 SDAPNTW-512G | MSI Alpha 15 A3DDK-034 Kingston RBUSNS8154P3512GJ | MSI GL65 9SEK WDC PC SN520 SDAPNUW-512G | HP Omen 15-dc1020ng WDC PC SN720 SDAQNTW-512G | Asus ROG Zephyrus G15 GA502DU Intel SSD 660p SSDPEKNW512G8 | Média Kingston OM8PCP3512F-AB | |
|---|---|---|---|---|---|---|---|
| CrystalDiskMark 5.2 / 6 | 30% | -20% | 10% | 35% | -17% | -5% | |
| Write 4K (MB/s) | 219.8 | 158.8 -28% | 105.4 -52% | 150.2 -32% | 112.1 -49% | 132.2 -40% | 194.5 ? -12% |
| Read 4K (MB/s) | 50.2 | 29.11 -42% | 33.24 -34% | 43.46 -13% | 42.01 -16% | 55.5 11% | 47.3 ? -6% |
| Write Seq (MB/s) | 979 | 1584 62% | 1029 5% | 1412 44% | 1964 101% | 986 1% | 978 ? 0% |
| Read Seq (MB/s) | 1990 | 1694 -15% | 1098 -45% | 1340 -33% | 2065 4% | 1318 -34% | 1299 ? -35% |
| Write 4K Q32T1 (MB/s) | 516 | 536 4% | 322.1 -38% | 482.2 -7% | 318.2 -38% | 220.3 -57% | 505 ? -2% |
| Read 4K Q32T1 (MB/s) | 298.3 | 363.9 22% | 352 18% | 535 79% | 406.7 36% | 315.5 6% | 301 ? 1% |
| Write Seq Q32T1 (MB/s) | 982 | 2536 158% | 1036 5% | 1454 48% | 2534 158% | 987 1% | 978 ? 0% |
| Read Seq Q32T1 (MB/s) | 1907 | 3458 81% | 1606 -16% | 1744 -9% | 3438 80% | 1416 -26% | 1930 ? 1% |
| Write 4K Q8T8 (MB/s) | 981 | 981 ? 0% | |||||
| Read 4K Q8T8 (MB/s) | 300.9 | 301 ? 0% | |||||
| AS SSD | 63% | -9% | 10% | 66% | -10% | -9% | |
| Seq Read (MB/s) | 1682 | 2927 74% | 1423 -15% | 1315 -22% | 2955 76% | 907 -46% | 1570 ? -7% |
| Seq Write (MB/s) | 904 | 2149 138% | 958 6% | 1378 52% | 2440 170% | 926 2% | 904 ? 0% |
| 4K Read (MB/s) | 60.2 | 42.43 -30% | 33.2 -45% | 25.31 -58% | 40.56 -33% | 47.26 -21% | 48.2 ? -20% |
| 4K Write (MB/s) | 164.8 | 147.1 -11% | 80.7 -51% | 118.2 -28% | 118.6 -28% | 98.7 -40% | 118.9 ? -28% |
| 4K-64 Read (MB/s) | 472.5 | 1286 172% | 816 73% | 839 78% | 1283 172% | 321.5 -32% | 415 ? -12% |
| 4K-64 Write (MB/s) | 845 | 1432 69% | 708 -16% | 720 -15% | 1538 82% | 736 -13% | 829 ? -2% |
| Access Time Read * (ms) | 0.087 | 0.065 25% | 0.1 -15% | 0.116 -33% | 0.084 3% | 0.064 26% | 0.1294 ? -49% |
| Access Time Write * (ms) | 0.02 | 0.026 -30% | 0.047 -135% | 0.091 -355% | 0.032 -60% | 0.045 -125% | 0.0371 ? -86% |
| Score Read (Points) | 701 | 1621 131% | 991 41% | 996 42% | 1619 131% | 459 -35% | 619 ? -12% |
| Score Write (Points) | 1101 | 1794 63% | 885 -20% | 976 -11% | 1901 73% | 927 -16% | 1036 ? -6% |
| Score Total (Points) | 2143 | 4208 96% | 2365 10% | 2485 16% | 4323 102% | 1641 -23% | 1955 ? -9% |
| Copy ISO MB/s (MB/s) | 675 | 1043 55% | 1279 89% | 1418 110% | 905 34% | 977 ? 45% | |
| Copy Program MB/s (MB/s) | 248.4 | 252.7 2% | 889 258% | 392.5 58% | 496.9 100% | 373 ? 50% | |
| Copy Game MB/s (MB/s) | 535 | 483.6 -10% | 1218 128% | 907 70% | 819 53% | 610 ? 14% | |
| Média Total (Programa/Configurações) | 47% /
49% | -15% /
-13% | 10% /
10% | 51% /
55% | -14% /
-12% | -7% /
-7% |
* ... menor é melhor

Continuous read performance: DiskSpd Read Loop, Queue Depth 8
| 3DMark 11 Performance | 17390 pontos | |
| 3DMark Ice Storm Standard Score | 72466 pontos | |
| 3DMark Cloud Gate Standard Score | 34649 pontos | |
| 3DMark Fire Strike Score | 14757 pontos | |
| 3DMark Fire Strike Extreme Score | 7382 pontos | |
| 3DMark Time Spy Score | 6256 pontos | |
Ajuda | ||
| baixo | média | alto | ultra | |
|---|---|---|---|---|
| BioShock Infinite (2013) | 232 | 209 | 189 | 119 |
| The Witcher 3 (2015) | 191 | 160 | 105 | 60.5 |
| Dota 2 Reborn (2015) | 103.8 | 94.7 | 85.4 | 81.3 |
| Rise of the Tomb Raider (2016) | 99.7 | 124 | 85.2 | |
| X-Plane 11.11 (2018) | 69.9 | 63.9 | 55.6 |
Barulho
| Ocioso |
| 30.2 / 30.2 / 30.2 dB |
| Carga |
| 40 / 49 dB |
 | ||
30 dB silencioso 40 dB(A) audível 50 dB(A) ruidosamente alto |
||
min: | ||
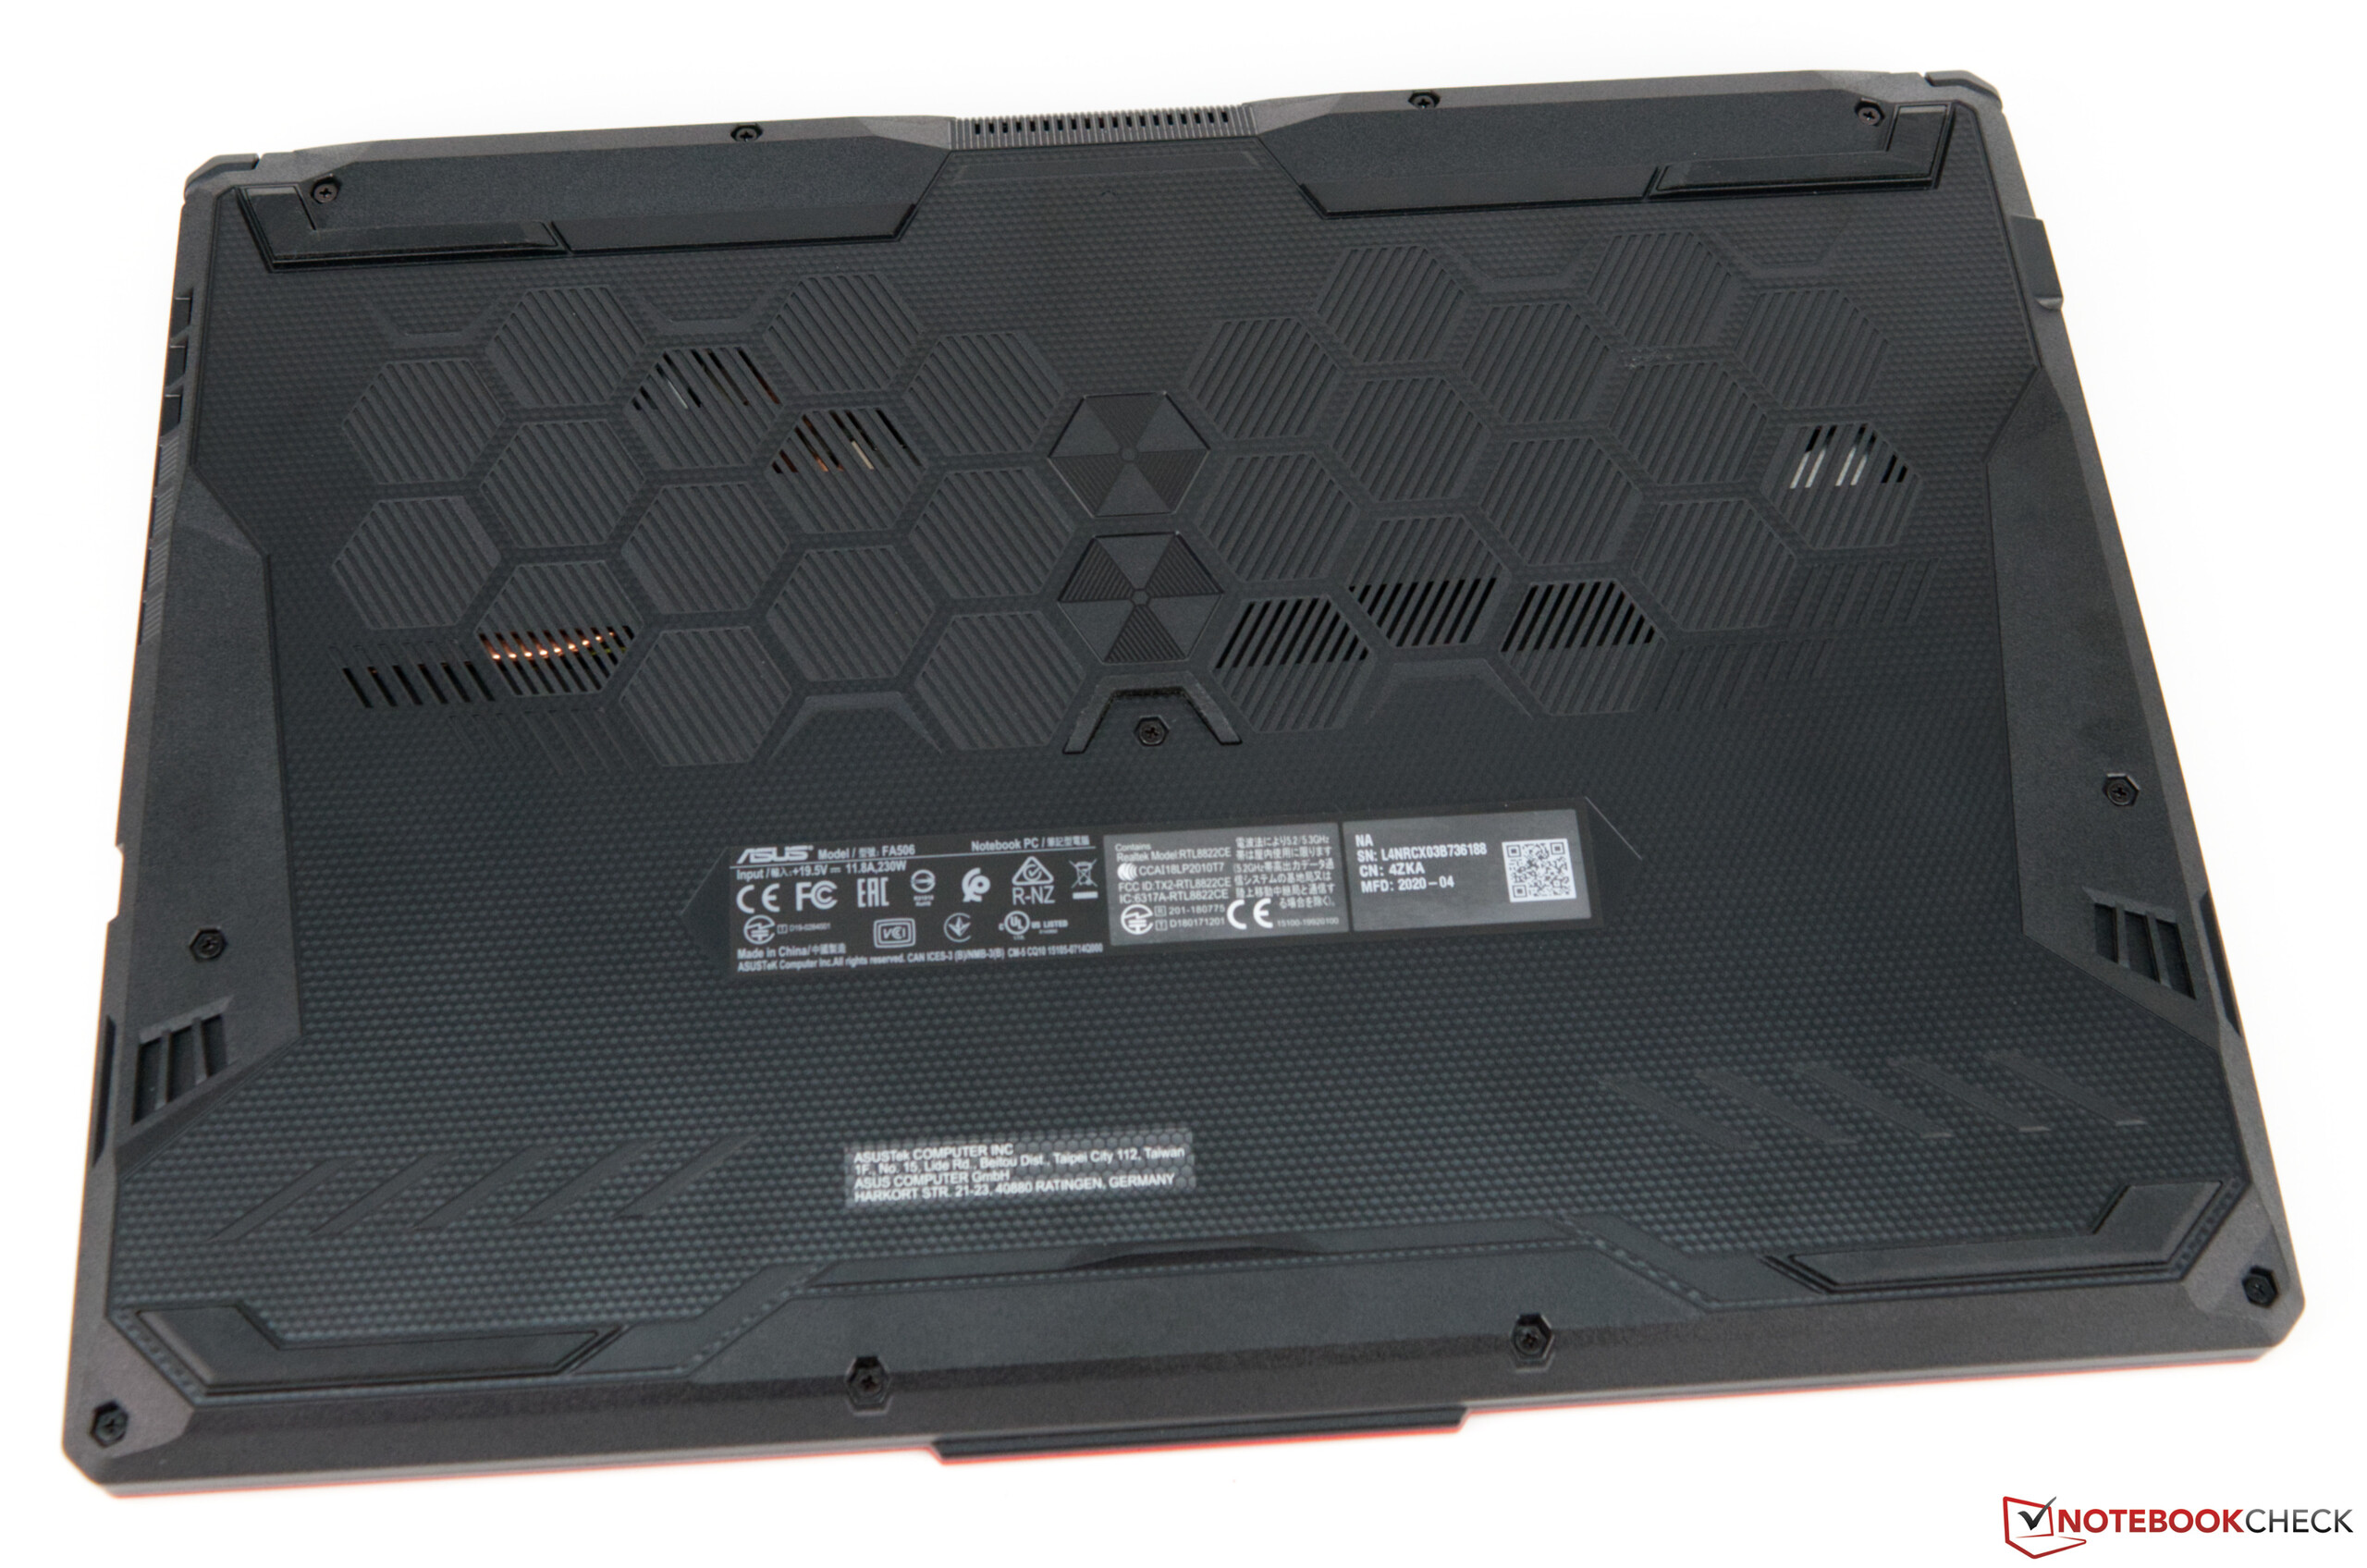
(±) A temperatura máxima no lado superior é 42.9 °C / 109 F, em comparação com a média de 40.4 °C / 105 F , variando de 21.2 a 68.8 °C para a classe Gaming.
(-) A parte inferior aquece até um máximo de 49.9 °C / 122 F, em comparação com a média de 43.2 °C / 110 F
(+) Em uso inativo, a temperatura média para o lado superior é 26.4 °C / 80 F, em comparação com a média do dispositivo de 33.9 °C / ### class_avg_f### F.
(±) Jogando The Witcher 3, a temperatura média para o lado superior é 32.9 °C / 91 F, em comparação com a média do dispositivo de 33.9 °C / ## #class_avg_f### F.
(+) Os apoios para as mãos e o touchpad são mais frios que a temperatura da pele, com um máximo de 26.9 °C / 80.4 F e, portanto, são frios ao toque.
(±) A temperatura média da área do apoio para as mãos de dispositivos semelhantes foi 28.8 °C / 83.8 F (+1.9 °C / 3.4 F).
Lenovo Legion Y540-15IRH-81SX00B2GE análise de áudio
(±) | o volume do alto-falante é médio, mas bom (###valor### dB)
Graves 100 - 315Hz
(-) | quase nenhum baixo - em média 17.7% menor que a mediana
(±) | a linearidade dos graves é média (11.6% delta para a frequência anterior)
Médios 400 - 2.000 Hz
(+) | médios equilibrados - apenas 3.7% longe da mediana
(+) | médios são lineares (4.5% delta para frequência anterior)
Altos 2 - 16 kHz
(+) | agudos equilibrados - apenas 3.3% longe da mediana
(+) | os máximos são lineares (5.9% delta da frequência anterior)
Geral 100 - 16.000 Hz
(±) | a linearidade do som geral é média (18.1% diferença em relação à mediana)
Comparado com a mesma classe
» 57% de todos os dispositivos testados nesta classe foram melhores, 8% semelhantes, 35% piores
» O melhor teve um delta de 6%, a média foi 18%, o pior foi 132%
Comparado com todos os dispositivos testados
» 38% de todos os dispositivos testados foram melhores, 8% semelhantes, 54% piores
» O melhor teve um delta de 4%, a média foi 24%, o pior foi 134%
| desligado | |
| Ocioso | |
| Carga |
|
Key:
min: | |
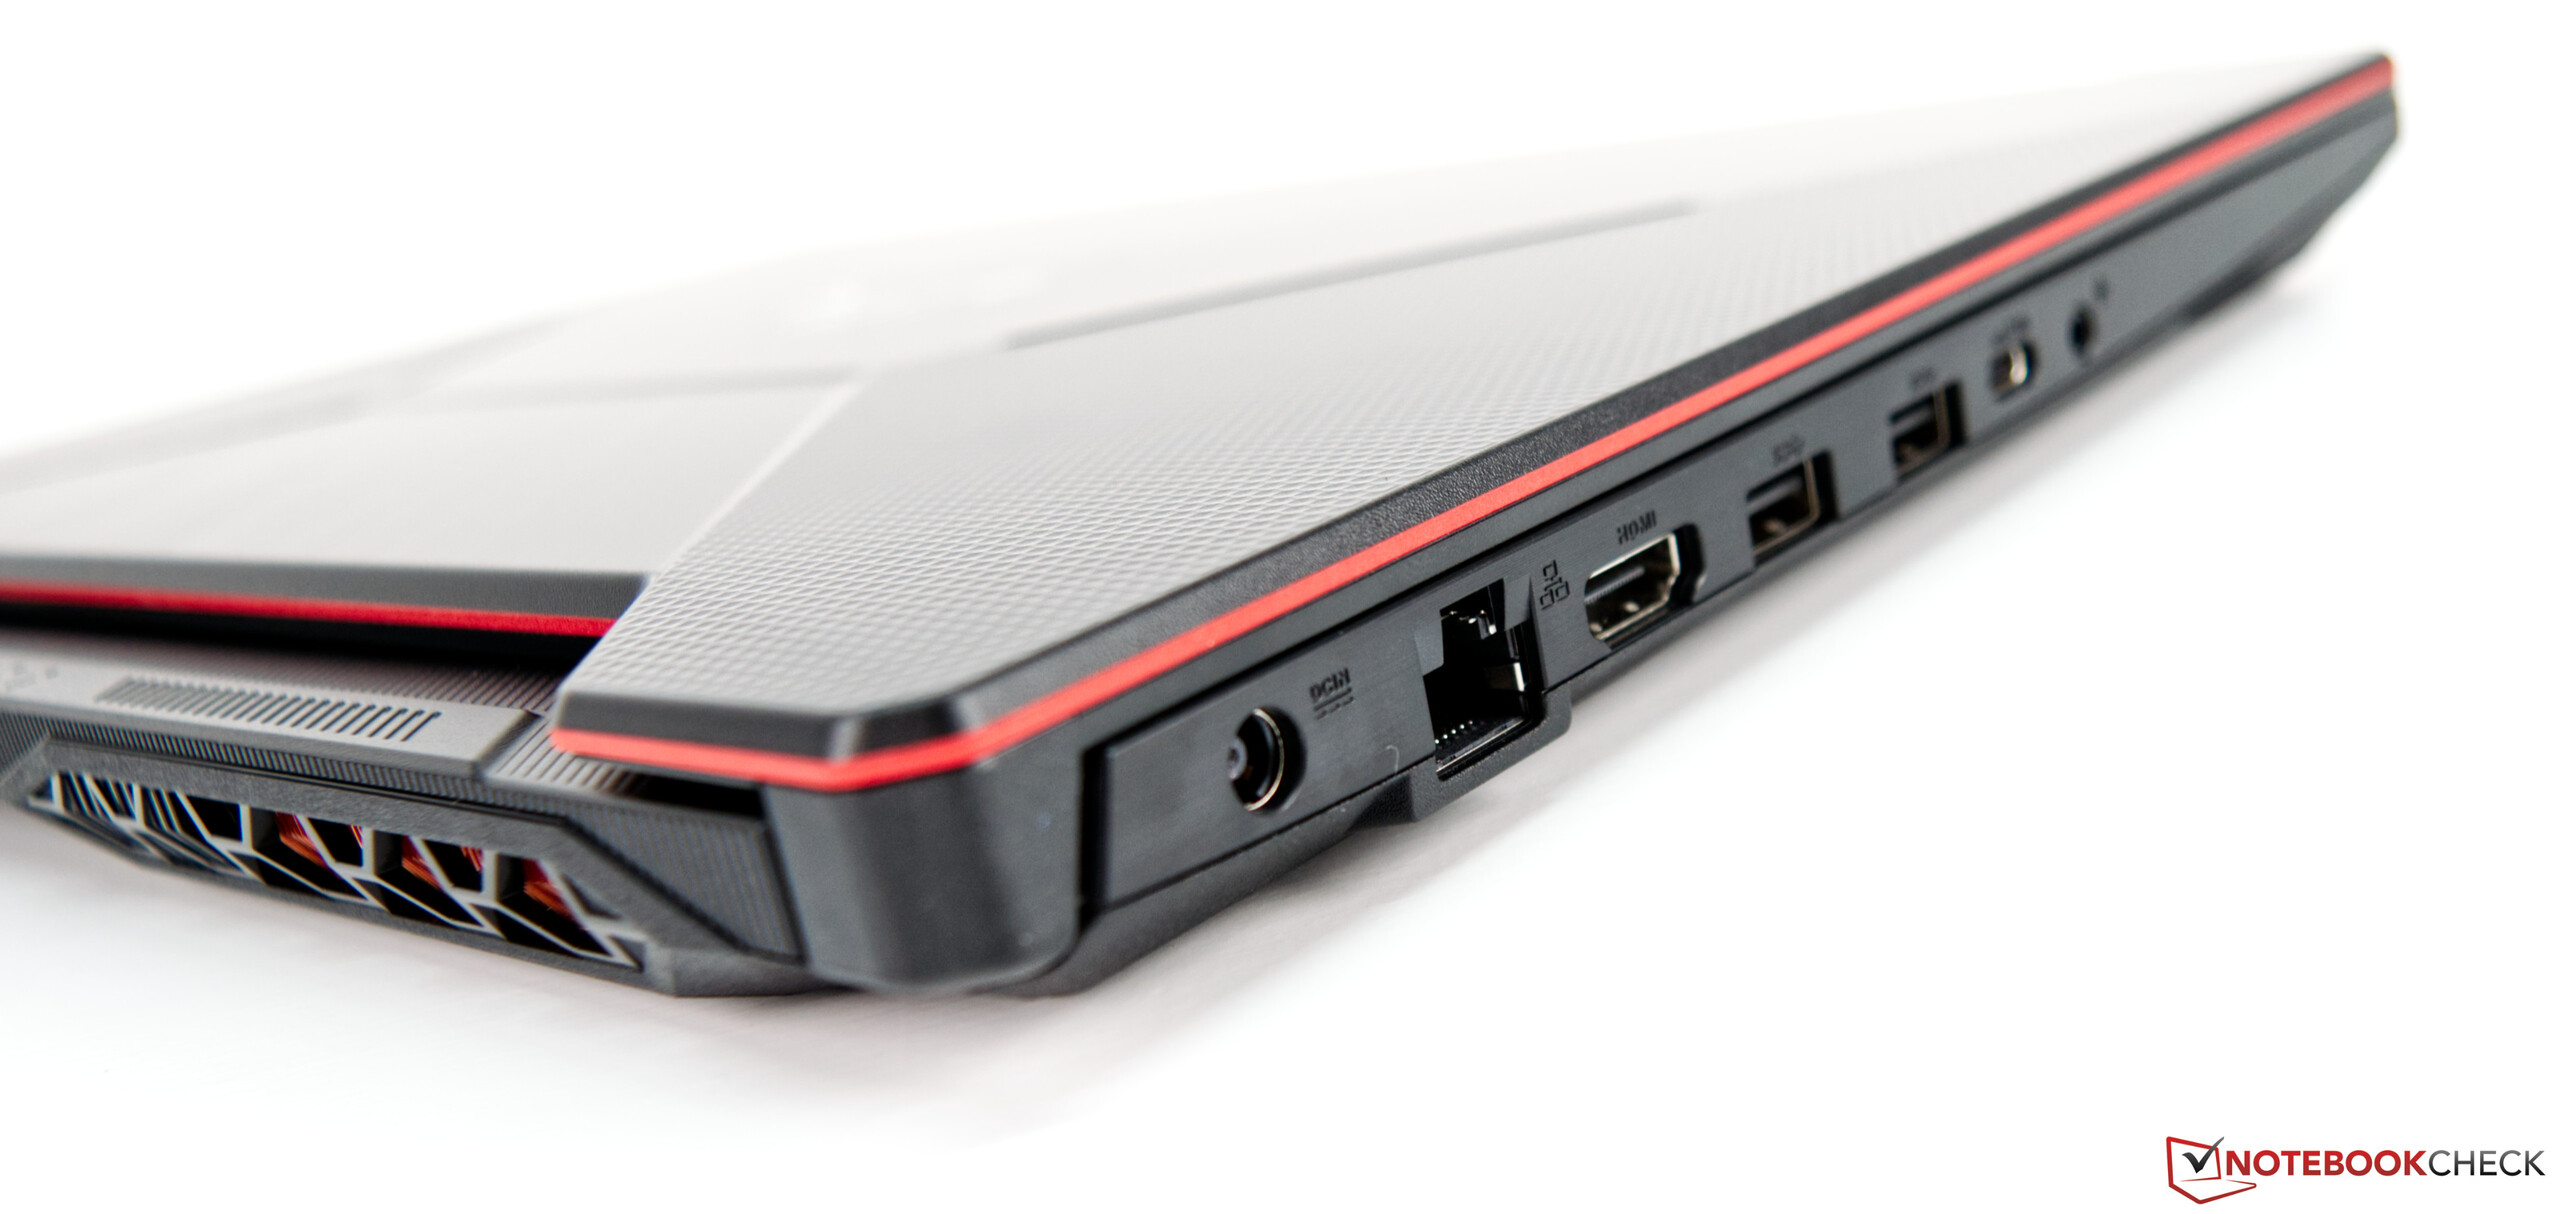
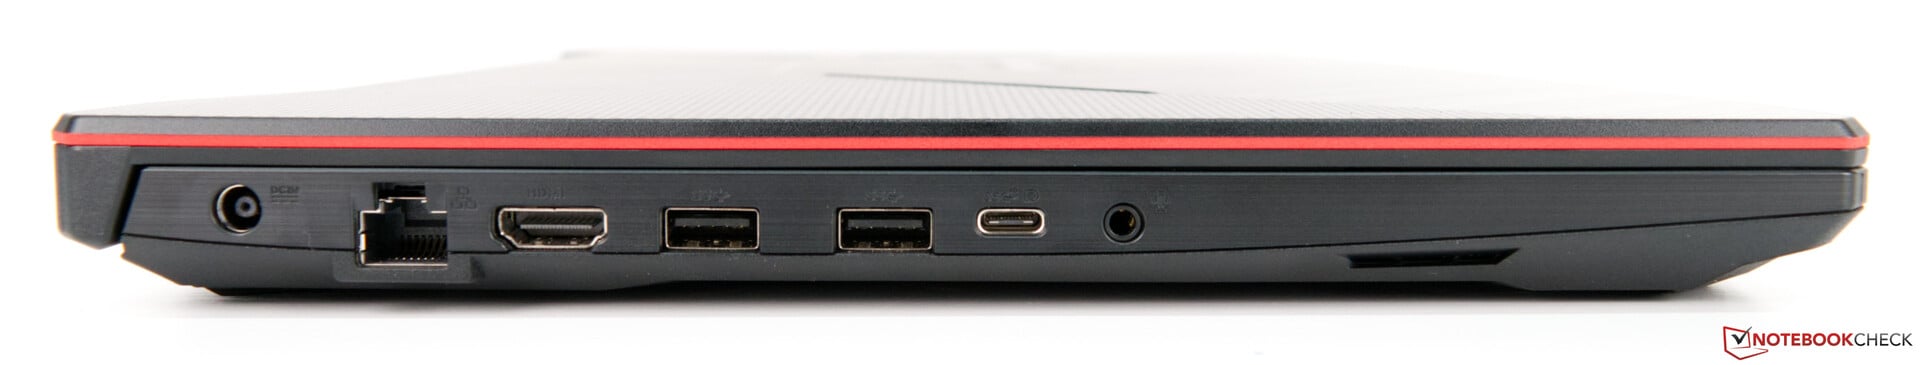
| Asus TUF Gaming A15 FA506IV-HN172 R7 4800H, GeForce RTX 2060 Mobile, Kingston OM8PCP3512F-AB, IPS, 1920x1080, 15.6" | Lenovo Legion Y540-15IRH-81SX00B2GE i7-9750H, GeForce GTX 1660 Ti Mobile, WDC PC SN720 SDAPNTW-512G, IPS, 1920x1080, 15.6" | MSI Alpha 15 A3DDK-034 R7 3750H, Radeon RX 5500M, Kingston RBUSNS8154P3512GJ, IPS, 1920x1080, 15.6" | MSI GL65 9SEK i7-9750H, GeForce RTX 2060 Mobile, WDC PC SN520 SDAPNUW-512G, IPS, 1920x1080, 15.6" | HP Omen 15-dc1020ng i5-9300H, GeForce GTX 1650 Mobile, WDC PC SN720 SDAQNTW-512G, IPS, 1920x1080, 15.6" | Asus ROG Zephyrus G15 GA502DU R7 3750H, GeForce GTX 1660 Ti Max-Q, Intel SSD 660p SSDPEKNW512G8, IPS, 1920x1080, 15.6" | Média NVIDIA GeForce RTX 2060 Mobile | Média da turma Gaming | |
|---|---|---|---|---|---|---|---|---|
| Power Consumption | -56% | -68% | -230% | 20% | -36% | -64% | -83% | |
| Idle Minimum * (Watt) | 5.4 | 14.5 -169% | 14 -159% | 41 -659% | 4.04 25% | 7.4 -37% | 11.5 ? -113% | 13.2 ? -144% |
| Idle Average * (Watt) | 10 | 18.5 -85% | 18 -80% | 45.3 -353% | 7.2 28% | 8.6 14% | 16.5 ? -65% | 18.9 ? -89% |
| Idle Maximum * (Watt) | 10.5 | 20 -90% | 32 -205% | 47.1 -349% | 11.4 -9% | 39.1 -272% | 23.7 ? -126% | 24.3 ? -131% |
| Load Average * (Watt) | 135 | 81.6 40% | 64 53% | 94.9 30% | 80.8 40% | 65.9 51% | 107.5 ? 20% | 108.3 ? 20% |
| Witcher 3 ultra * (Watt) | 144 | 132 8% | 123 15% | 149.4 -4% | 93.6 35% | 106.9 26% | ||
| Load Maximum * (Watt) | 147 | 208.1 -42% | 193 -31% | 214.2 -46% | 144.5 2% | 141.3 4% | 199.7 ? -36% | 254 ? -73% |
* ... menor é melhor
| Asus TUF Gaming A15 FA506IV-HN172 R7 4800H, GeForce RTX 2060 Mobile, 48 Wh | Lenovo Legion Y540-15IRH-81SX00B2GE i7-9750H, GeForce GTX 1660 Ti Mobile, 57 Wh | MSI Alpha 15 A3DDK-034 R7 3750H, Radeon RX 5500M, 51 Wh | MSI GL65 9SEK i7-9750H, GeForce RTX 2060 Mobile, 51 Wh | HP Omen 15-dc1020ng i5-9300H, GeForce GTX 1650 Mobile, 52.5 Wh | Asus ROG Zephyrus G15 GA502DU R7 3750H, GeForce GTX 1660 Ti Max-Q, 76 Wh | Média da turma Gaming | |
|---|---|---|---|---|---|---|---|
| Duração da bateria | -51% | -40% | -47% | 19% | 32% | 8% | |
| Reader / Idle (h) | 9.8 | 4 -59% | 5.8 -41% | 4.4 -55% | 15.9 62% | 15.3 56% | 8.71 ? -11% |
| H.264 (h) | 5.4 | 3.9 -28% | 8 48% | 8.26 ? 53% | |||
| WiFi v1.3 (h) | 6.2 | 2.4 -61% | 4.1 -34% | 3.8 -39% | 6.4 3% | 8 29% | 7.04 ? 14% |
| Load (h) | 1.9 | 1.3 -32% | 0.8 -58% | 1 -47% | 1.2 -37% | 2.1 11% | 1.47 ? -23% |
| Witcher 3 ultra (h) | 1 |


Pro
Contra
Veredicto - Preço Competitivo e Desempenho Sólido
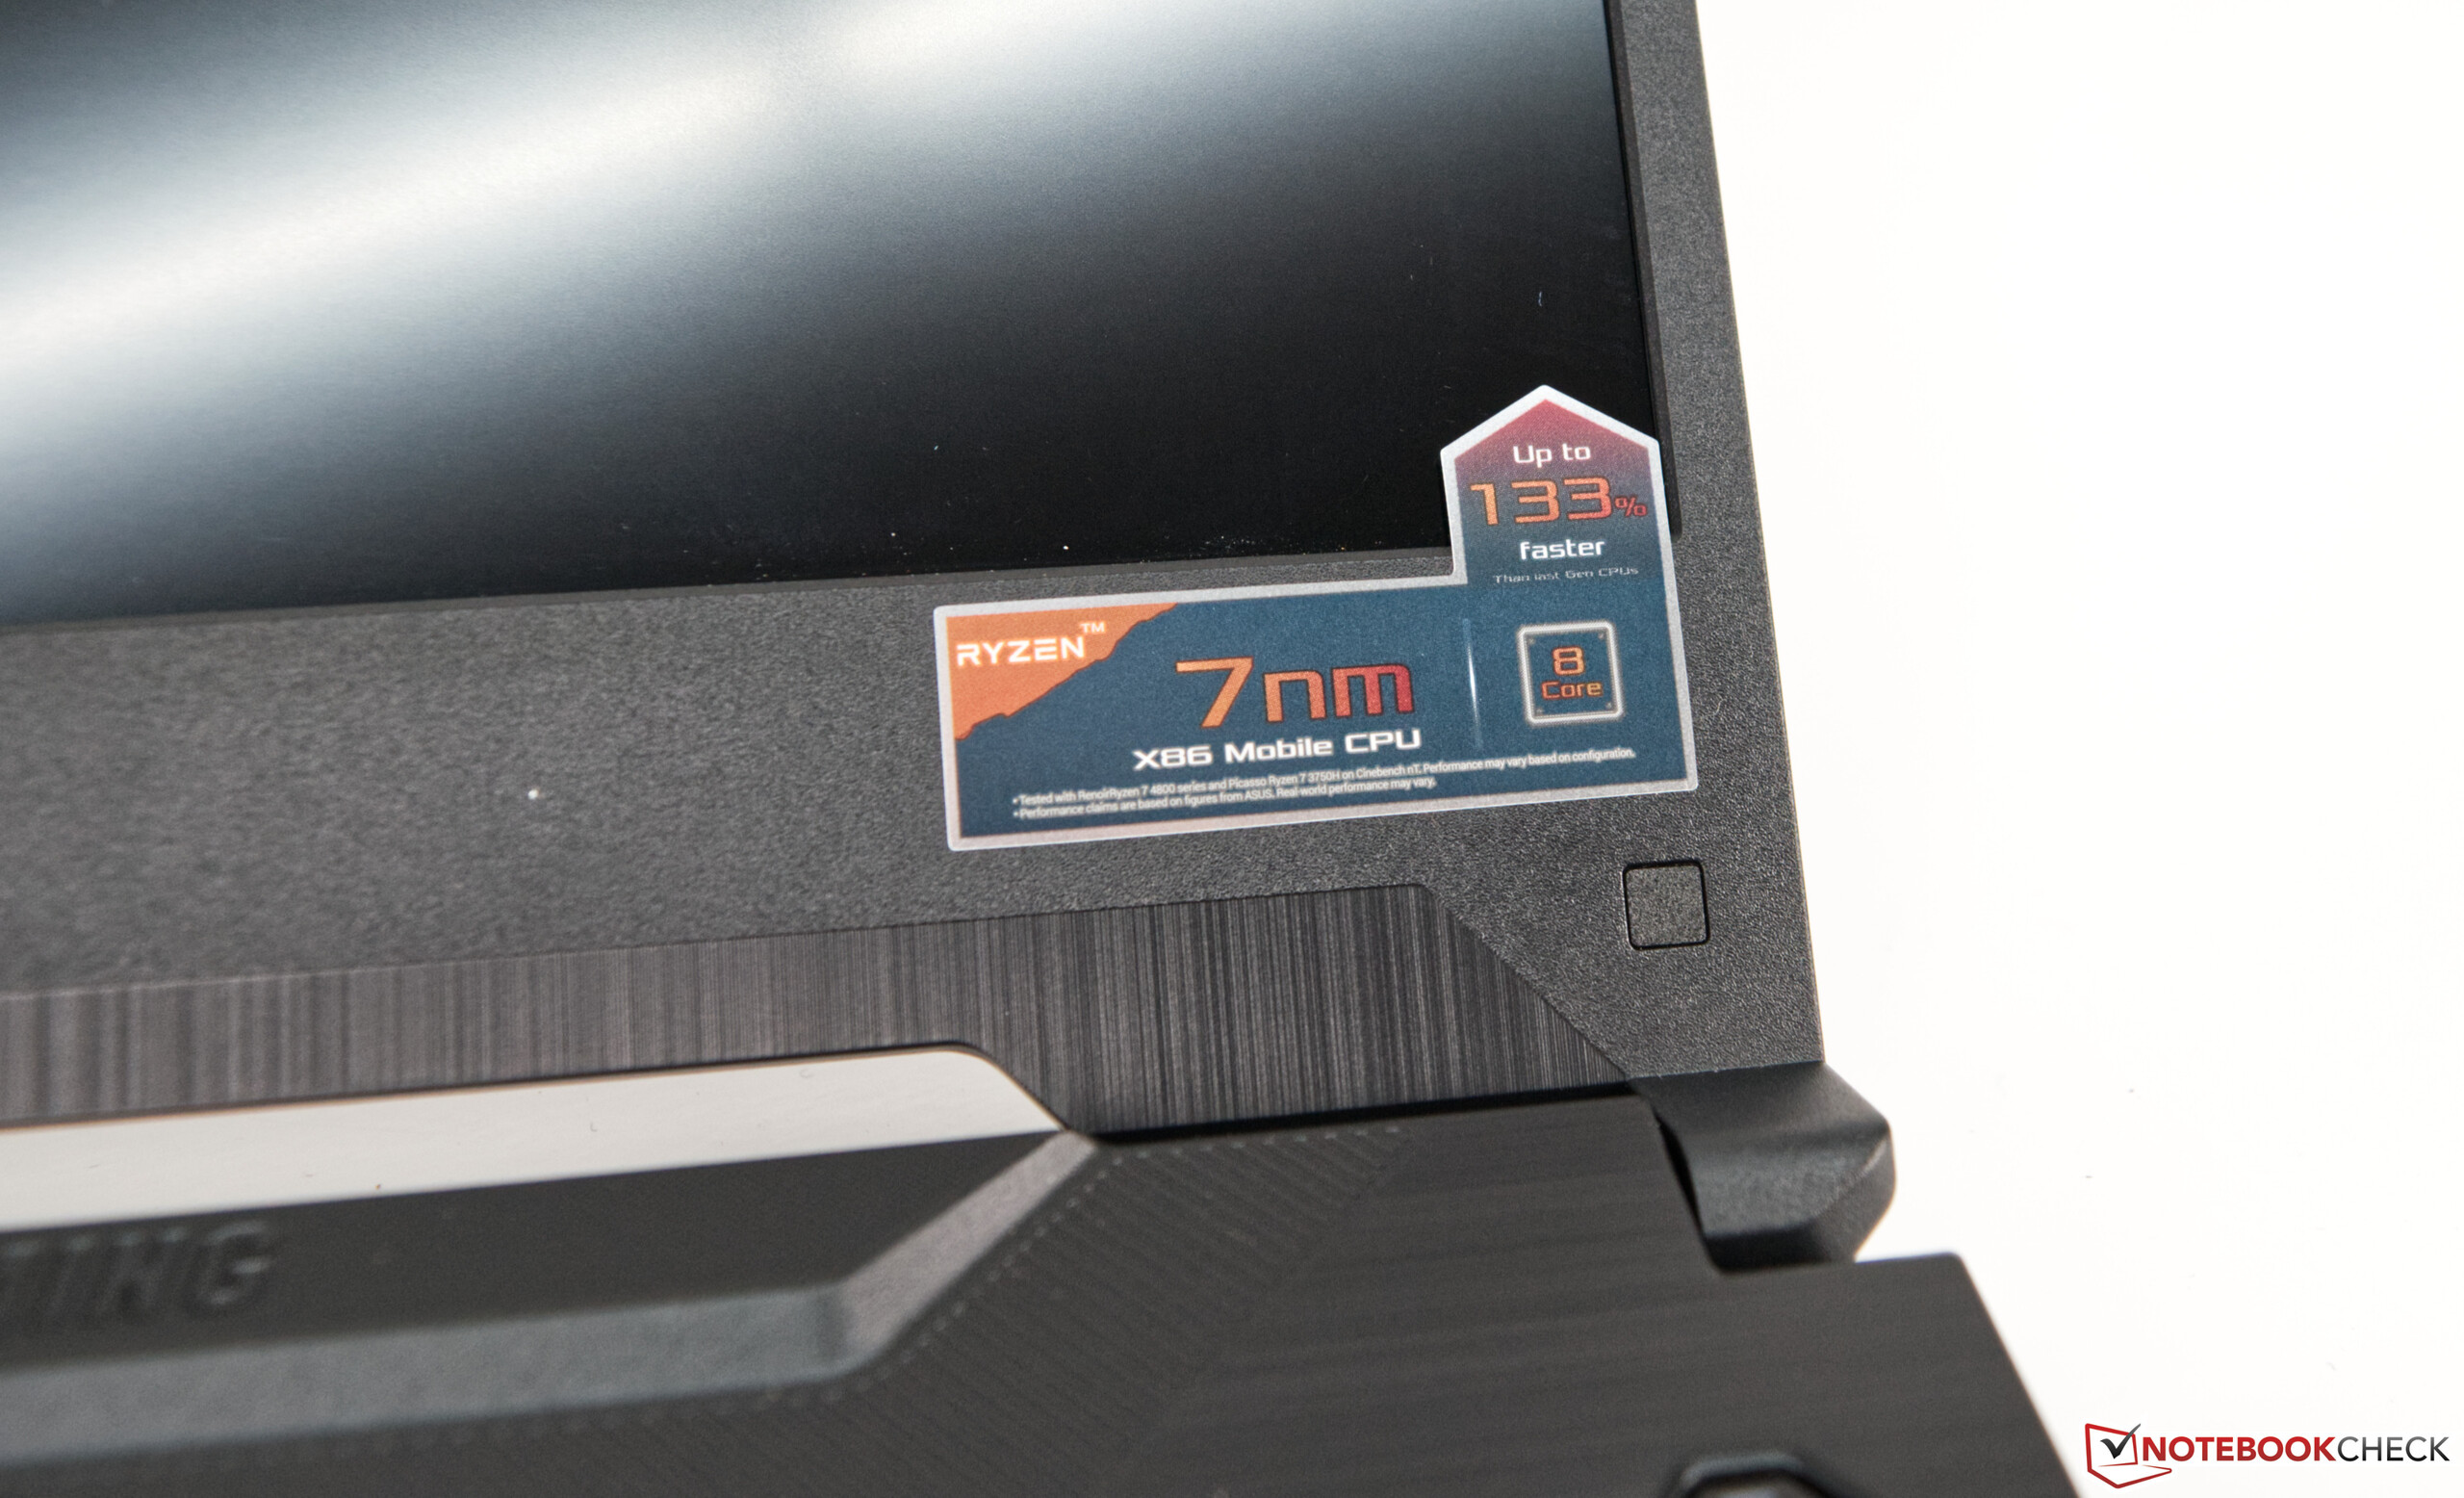
O Asus TUF A15 FA506 é um portátil para jogos com ótimo hardware por um preço justo. O aparelho pode ser adquirido de vários revendedores online por menos de 1.300 Euros (~$1.470), e vem com a novíssima CPU AMD Ryzen 7 4800H, que supera a sua contraparte Intel graças aos seus oito núcleos. A anterior é uma sólida CPU de jogos e adequada como base para uma máquina de jogos, que roda até mesmo jogos muito exigentes com detalhes no máximo quando emparelhada com a Nvidia GeForce RTX 2060.
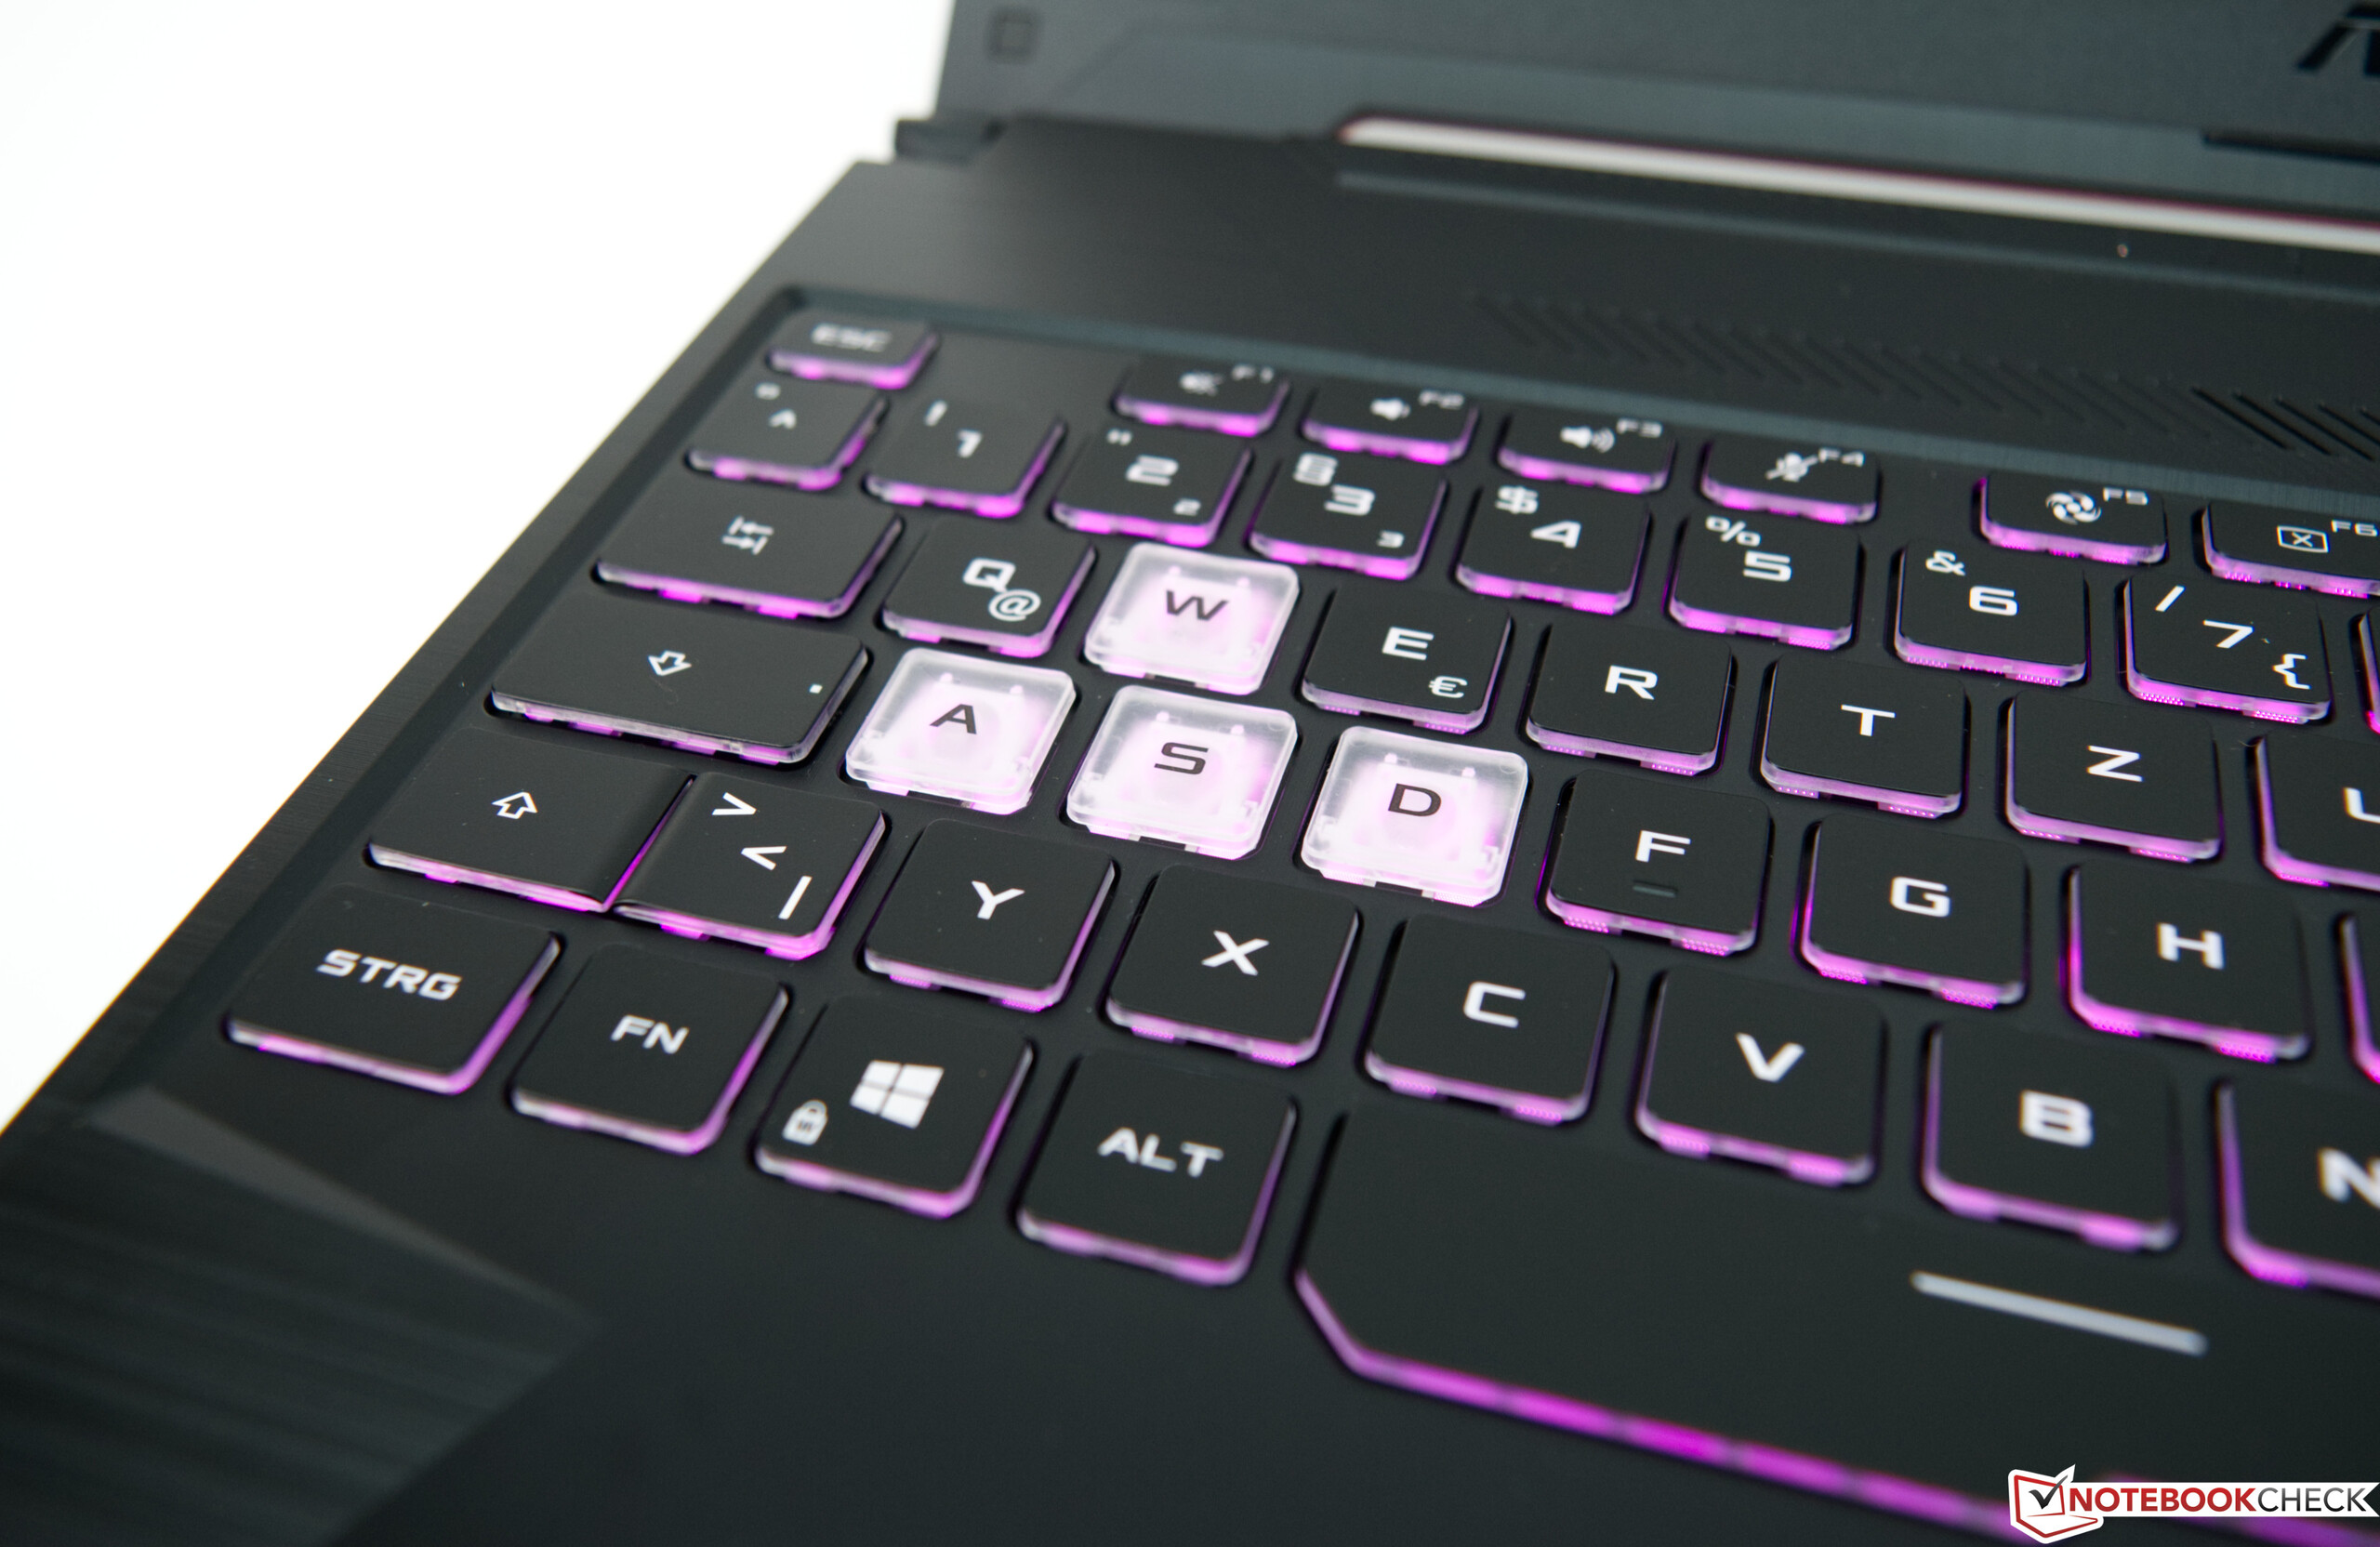
Por falar de visual, a tela instalada oferece uma ótima relação de contraste e uma rápida taxa de atualização de 144-Hz. Além disso, não há PWM e, portanto, não há fadiga ocular adicional durante o uso prolongado. Dito isto, ficamos desapontados com a pequena gama de cores. Enquanto isso, a carcaça é decente, embora sua sensação não tenha nos convencido inteiramente devido à construção plástica. Pelo contrário, não temos nenhuma reclamação quando se trata de desempenho bruto, que pode ser parcialmente atribuído ao SoC da AMD. Dispositivos similares nesta classe de preço tendem a ser limitados a processadores com 6 núcleos. É difícil reclamar de dois núcleos adicionais pelo mesmo preço.
Com bom desempenho e um preço competitivo, o Asus TUF A15 FA506 vale definitivamente a pena considerar se você está procurando um portátil para jogos de baixo custo.
Além disso, a duração da bateria é surpreendentemente boa, o que não pode ser tomado como garantido, particularmente em um dispositivo de jogos. Se você está interessado neste sistema, vale a pena dar uma olhada nas opções de atualização de RAM e armazenamento. Infelizmente, nosso modelo só está equipado com a configuração mínima de memória para um portátil de jogos. Dito isto, 8 GB de RAM e 512 GB de armazenamento SSD ainda são suficientes para muitas tarefas e aplicações.
The Asus TUF A15 FA506 is a gaming laptop with great hardware for a fair price. The device can be purchased from various online retailers for below 1300 Euros (~$1470), and it comes with the brand-new AMD Ryzen 7 4800H CPU, which outperforms its Intel counterpart thanks to its eight cores. The former is a solid gaming CPU and suitable as a foundation for a gaming machine, which runs even very demanding games at maximum details when paired with the Nvidia GeForce RTX 2060.
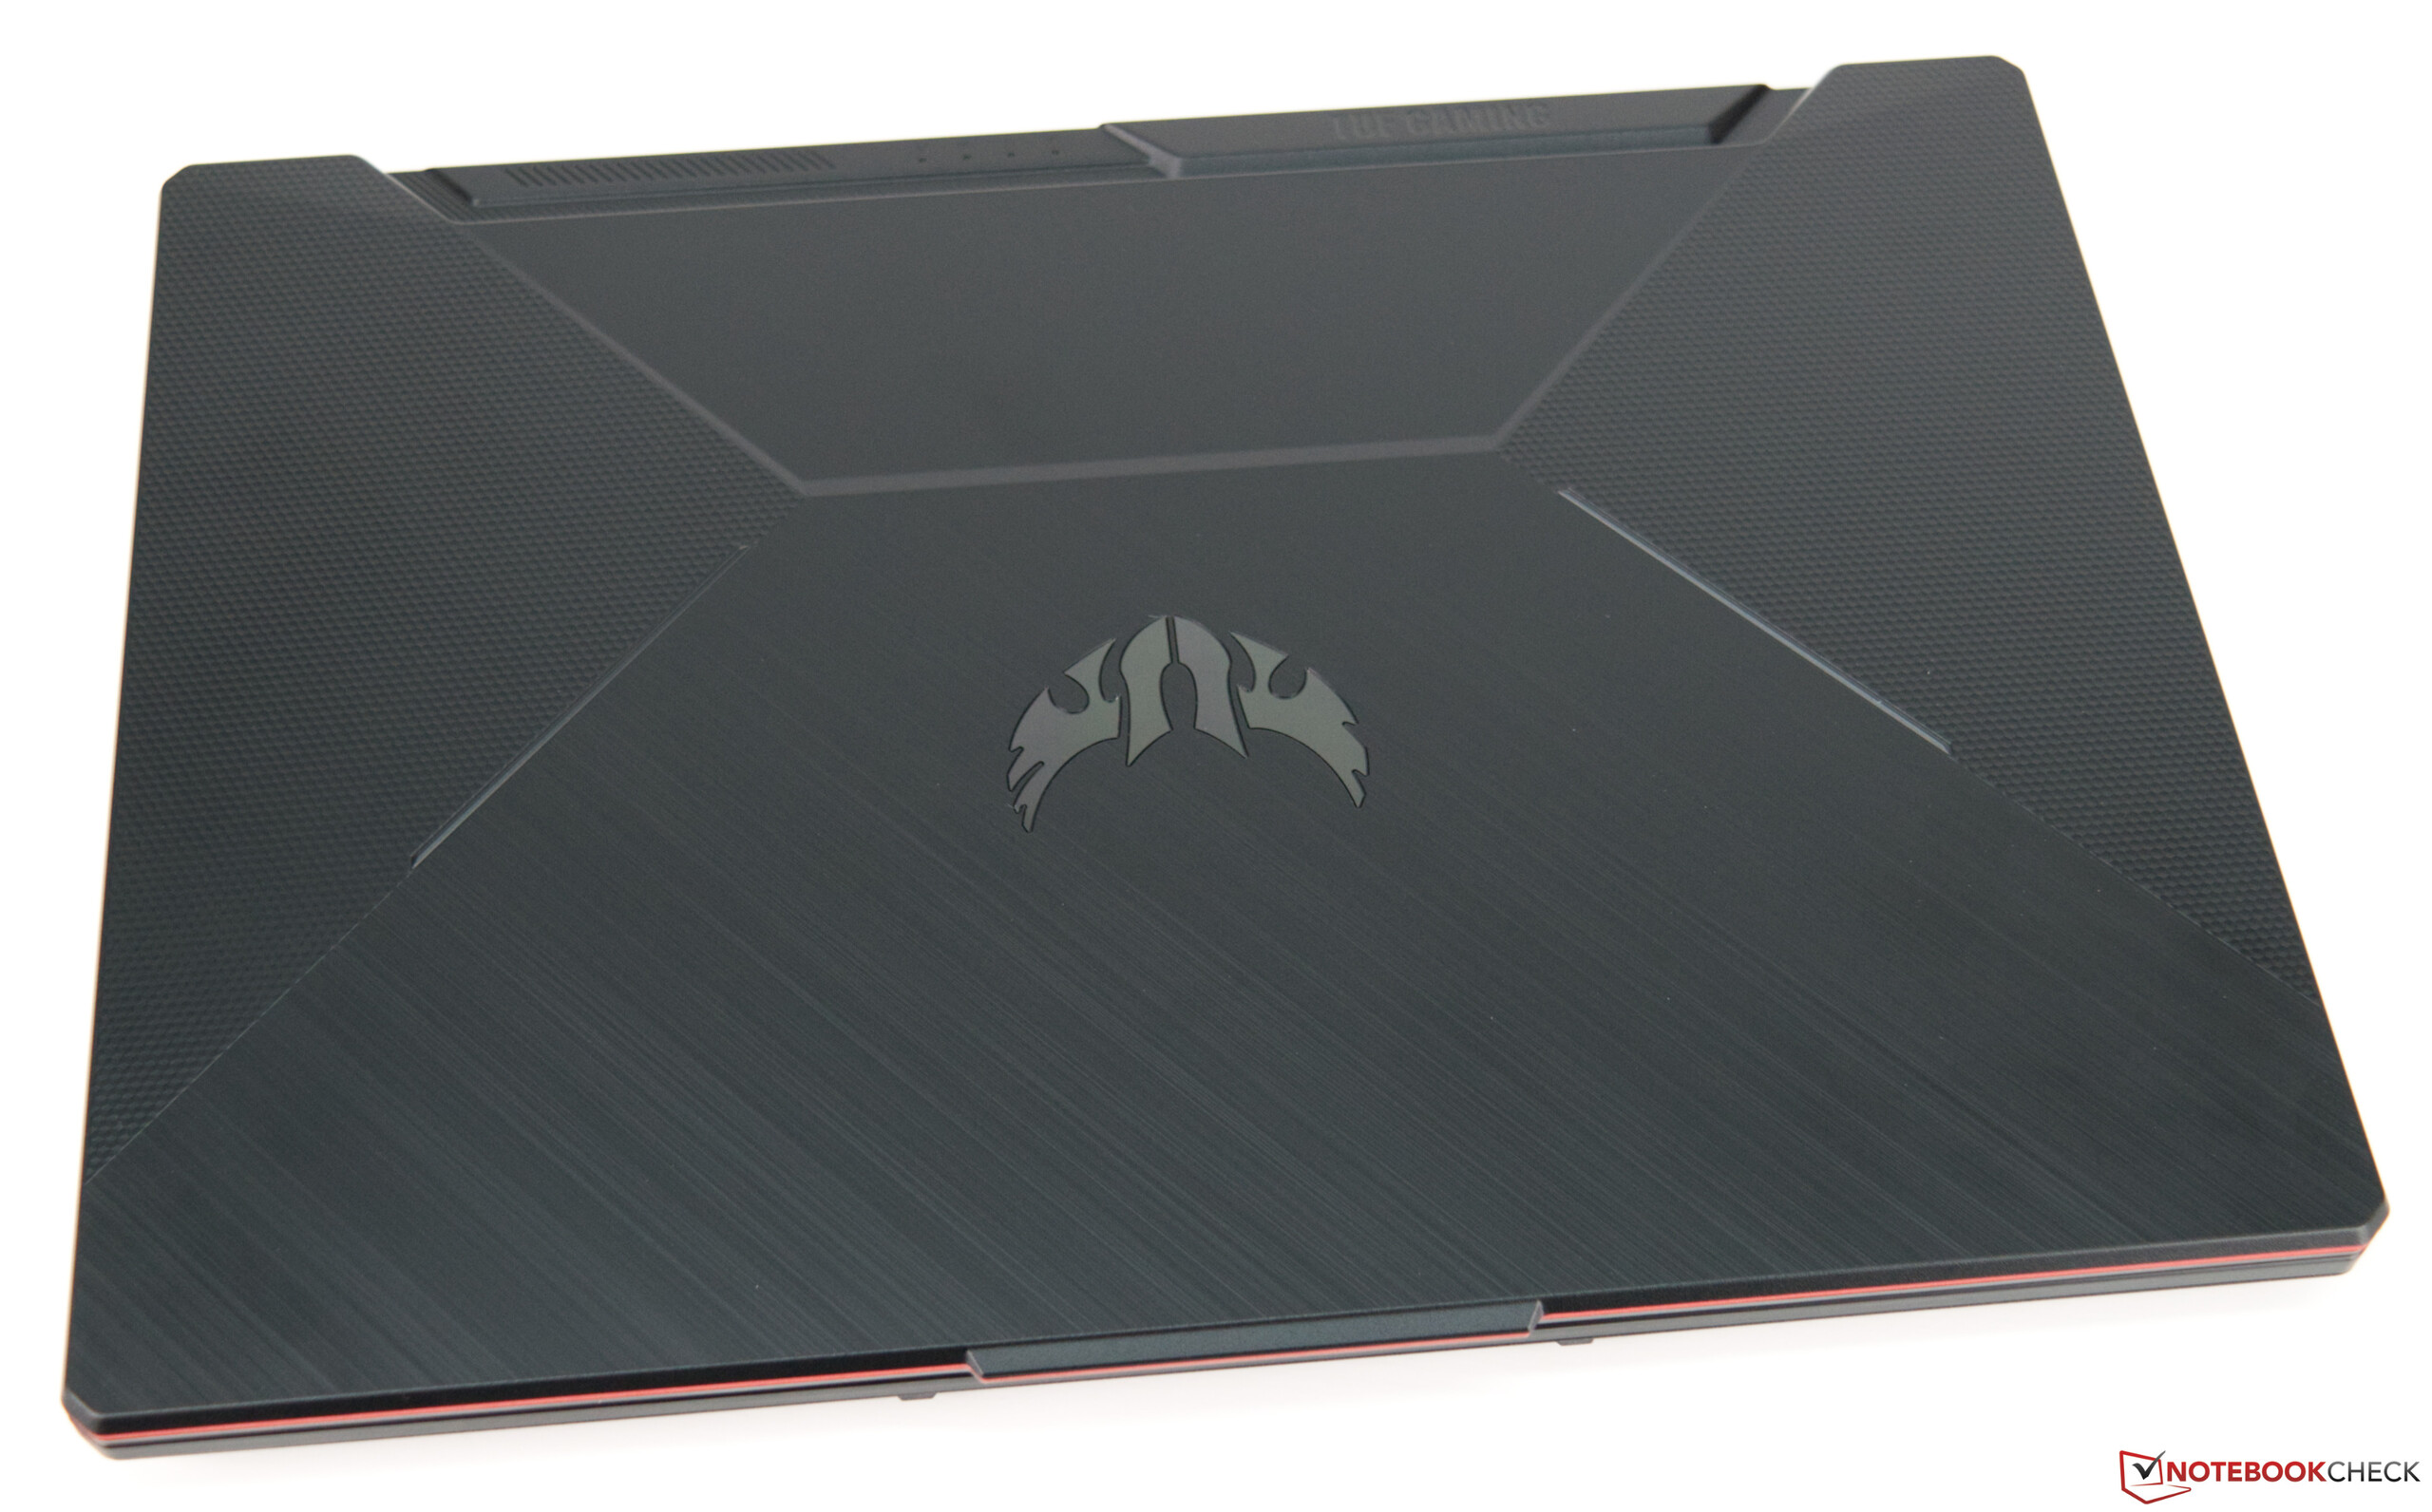
Speaking of visuals, the installed display offers a great contrast ratio and a fast 144-Hz refresh rate. Furthermore, there is no PWM and thus, no additional eyestrain during prolonged use. That being said, we were disappointed with the small color gamut. Meanwhile, the case is decent, although its feel did not entirely convince us due to the full plastic construction. By contrast, we have no complaints at all when it comes to raw performance, which can be partially attributed to the AMD SoC. Similar devices in this price class tend to be limited to 6-core processors. It is hard to complain about two additional cores for the same price.
With good performance and a competitive price, the Asus TUF A15 FA506 is definitely worth considering if you are looking for an inexpensive gaming laptop.
Furthermore, the battery life is surprisingly good, which cannot be taken for granted, particularly on a gaming device. If you are interested in this system, RAM and storage upgrade options are worth taking a look at. Unfortunately, our model is only equipped with the bare minimum memory configuration for a gaming laptop. That being said, 8 GB of RAM and 512 GB of SSD storage are still sufficient for many tasks and applications.
Asus TUF Gaming A15 FA506IV-HN172
- 06/09/2020 v7 (old)
Sebastian Bade
Price comparison
