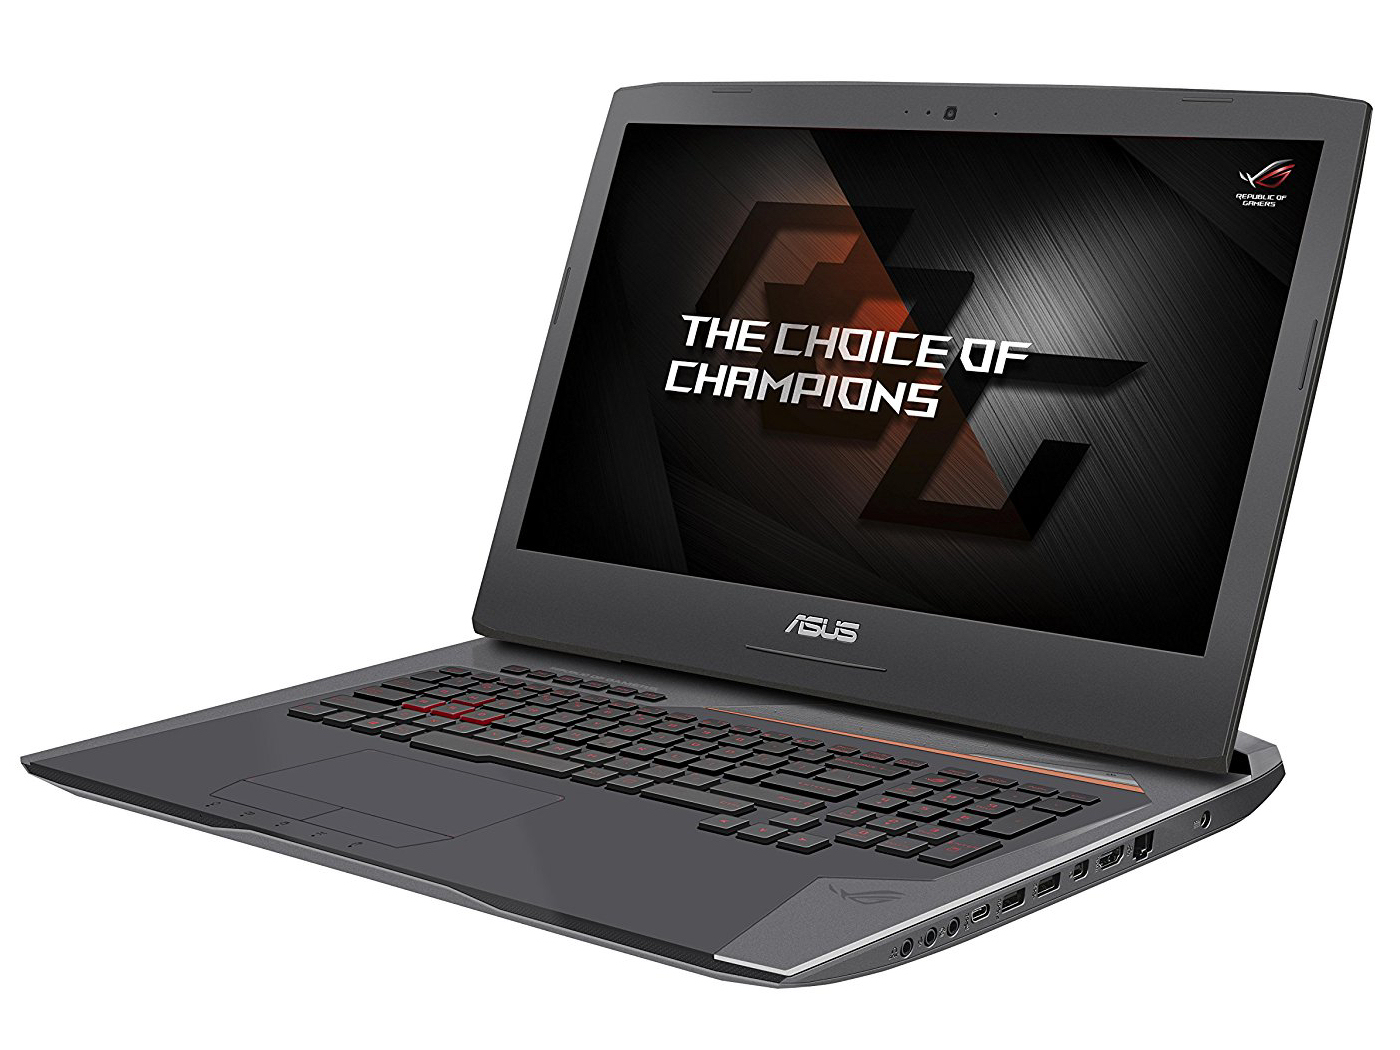
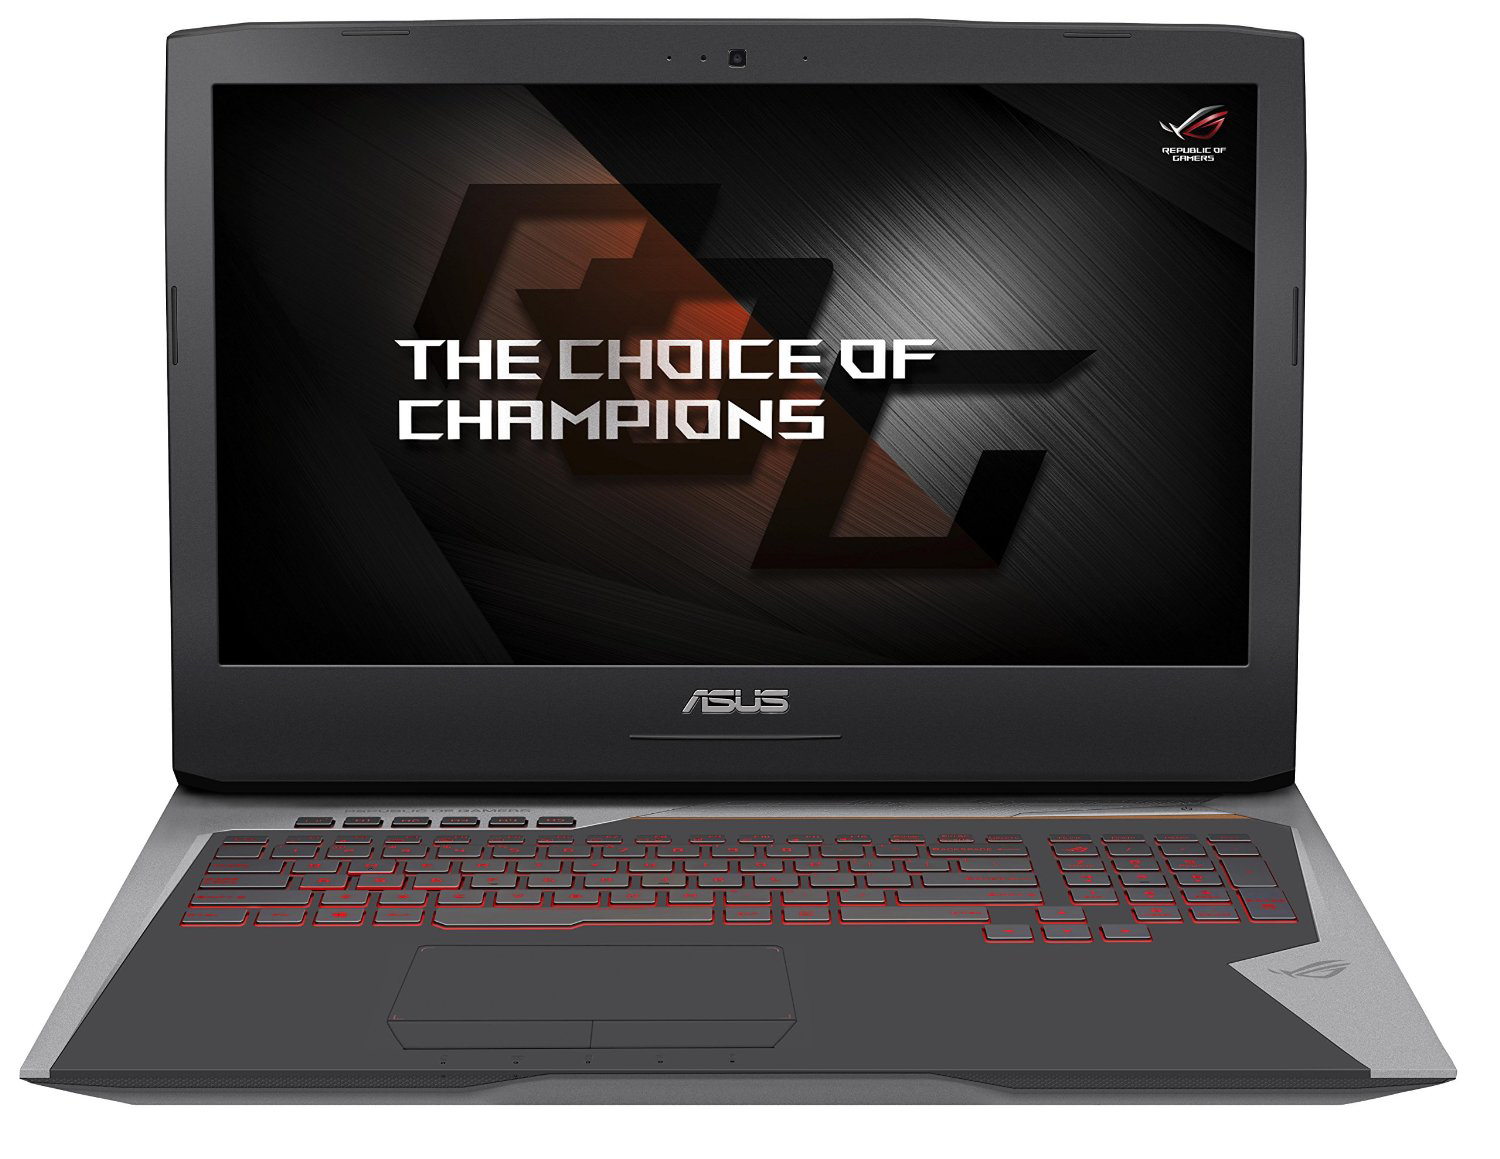
Breve Análise do Portátil Asus ROG G752VS (7700HQ, GTX 1070, FHD)
| SD Card Reader | |
| average JPG Copy Test (av. of 3 runs) | |
| MSI GT72VR 7RE-433 | |
| Acer Predator 17 G9-793-70PJ | |
| Gigabyte P57X v7 | |
| Asus G752VS-BA338T | |
| Asus G752VS-XB78K | |
| Nexoc G734IV | |
| maximum AS SSD Seq Read Test (1GB) | |
| MSI GT72VR 7RE-433 | |
| Gigabyte P57X v7 | |
| Acer Predator 17 G9-793-70PJ | |
| Nexoc G734IV | |
| Asus G752VS-BA338T | |
| Asus G752VS-XB78K | |
| Networking | |
| iperf3 transmit AX12 | |
| Acer Predator 17 G9-793-70PJ | |
| MSI GT72VR 7RE-433 | |
| Alienware 17 R4 | |
| Nexoc G734IV | |
| Asus G752VS-BA338T | |
| iperf3 receive AX12 | |
| Acer Predator 17 G9-793-70PJ | |
| Asus G752VS-BA338T | |
| Nexoc G734IV | |
| MSI GT72VR 7RE-433 | |
| Alienware 17 R4 | |
| |||||||||||||||||||||||||
iluminação: 88 %
iluminação com acumulador: 307 cd/m²
Contraste: 959:1 (Preto: 0.32 cd/m²)
ΔE ColorChecker Calman: 5.53 | ∀{0.5-29.43 Ø4.71}
ΔE Greyscale Calman: 7 | ∀{0.09-98 Ø4.96}
90% sRGB (Argyll 1.6.3 3D)
58% AdobeRGB 1998 (Argyll 1.6.3 3D)
62.8% AdobeRGB 1998 (Argyll 3D)
90.3% sRGB (Argyll 3D)
61.6% Display P3 (Argyll 3D)
Gamma: 2.48
CCT: 8103 K
| Asus G752VS-BA338T AU Optronics B173HAN01.1 (AUO119D), IPS, 1920x1080 | Asus G752VS-XB78K LG Philips LP173WF4-SPF3 (LGD04E8), IPS, 1920x1080 | MSI GT72VR 7RE-433 Chi Mei N173HHE-G32 (CMN1747), TN LED, 1920x1080 | Gigabyte P57X v7 SHP145E, IPS, 3840x2160 | Nexoc G734IV LG Philips LP173WF4-SPD1 (LGD046C), IPS, 1920x1080 | Acer Predator 17 G9-793-70PJ AU Optronics B173ZAN01.0 (AUO109B), IPS, 3840x2160 | Alienware 17 R4 TN LED, 2560x1440 | |
|---|---|---|---|---|---|---|---|
| Display | 1% | 3% | 37% | -1% | 36% | -4% | |
| Display P3 Coverage (%) | 61.6 | 66.9 9% | 68.3 11% | 87.8 43% | 66.2 7% | 86.4 40% | 61.2 -1% |
| sRGB Coverage (%) | 90.3 | 85.2 -6% | 86.7 -4% | 100 11% | 83.7 -7% | 99.9 11% | 82.9 -8% |
| AdobeRGB 1998 Coverage (%) | 62.8 | 62.3 -1% | 63.4 1% | 98.9 57% | 61.2 -3% | 99.1 58% | 60.5 -4% |
| Response Times | 5% | 46% | -67% | -13% | -19% | 34% | |
| Response Time Grey 50% / Grey 80% * (ms) | 36 ? | 38 ? -6% | 29 ? 19% | 55.6 ? -54% | 42 ? -17% | 50 ? -39% | 30 ? 17% |
| Response Time Black / White * (ms) | 26 ? | 22 ? 15% | 7 ? 73% | 46.8 ? -80% | 28 ? -8% | 25.6 ? 2% | 12.8 ? 51% |
| PWM Frequency (Hz) | 1000 ? | ||||||
| Screen | 14% | -9% | 17% | 12% | 22% | -4% | |
| Brightness middle (cd/m²) | 307 | 328 7% | 299 -3% | 441.3 44% | 348 13% | 343 12% | 402.3 31% |
| Brightness (cd/m²) | 300 | 317 6% | 277 -8% | 408 36% | 336 12% | 328 9% | 372 24% |
| Brightness Distribution (%) | 88 | 88 0% | 87 -1% | 86 -2% | 91 3% | 84 -5% | 86 -2% |
| Black Level * (cd/m²) | 0.32 | 0.3 6% | 0.27 16% | 0.44 -38% | 0.32 -0% | 0.29 9% | 0.62 -94% |
| Contrast (:1) | 959 | 1093 14% | 1107 15% | 1003 5% | 1088 13% | 1183 23% | 649 -32% |
| Colorchecker dE 2000 * | 5.53 | 3.74 32% | 9.65 -75% | 5.1 8% | 4.13 25% | 4.01 27% | 5.6 -1% |
| Colorchecker dE 2000 max. * | 11.54 | 8.97 22% | 15.43 -34% | 9.8 15% | 9.21 20% | 6.03 48% | 9.8 15% |
| Greyscale dE 2000 * | 7 | 2.67 62% | 9.68 -38% | 4.3 39% | 3.52 50% | 4.7 33% | 4.7 33% |
| Gamma | 2.48 89% | 2.41 91% | 1.89 116% | 2.08 106% | 2.32 95% | 2.4 92% | 2.14 103% |
| CCT | 8103 80% | 6861 95% | 11652 56% | 7345 88% | 6228 104% | 6451 101% | 7519 86% |
| Color Space (Percent of AdobeRGB 1998) (%) | 58 | 56 -3% | 75 29% | 87 50% | 55 -5% | 88 52% | 53.7 -7% |
| Color Space (Percent of sRGB) (%) | 90 | 85 -6% | 100 11% | 100 11% | 84 -7% | 100 11% | 82.2 -9% |
| Média Total (Programa/Configurações) | 7% /
10% | 13% /
1% | -4% /
10% | -1% /
6% | 13% /
19% | 9% /
1% |
* ... menor é melhor
Cintilação da tela / PWM (modulação por largura de pulso)
| Tela tremeluzindo / PWM não detectado | 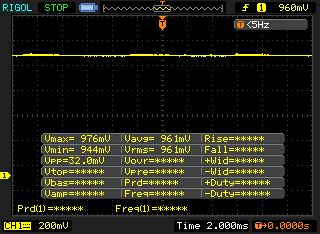 | ||
[pwm_comparison] Em comparação: 52 % de todos os dispositivos testados não usam PWM para escurecer a tela. Se PWM foi detectado, uma média de 7757 (mínimo: 5 - máximo: 343500) Hz foi medida. | |||
Exibir tempos de resposta
| ↔ Tempo de resposta preto para branco | ||
|---|---|---|
| 26 ms ... ascensão ↗ e queda ↘ combinadas | ↗ 14.4 ms ascensão | 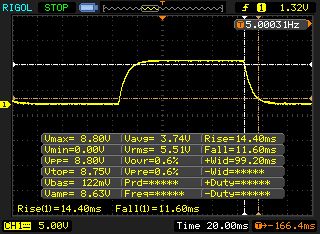 |
| ↘ 11.6 ms queda | ||
| A tela mostra taxas de resposta relativamente lentas em nossos testes e pode ser muito lenta para os jogadores. Em comparação, todos os dispositivos testados variam de 0.1 (mínimo) a 240 (máximo) ms. » 63 % de todos os dispositivos são melhores. Isso significa que o tempo de resposta medido é pior que a média de todos os dispositivos testados (19.8 ms). | ||
| ↔ Tempo de resposta 50% cinza a 80% cinza | ||
| 36 ms ... ascensão ↗ e queda ↘ combinadas | ↗ 18 ms ascensão | 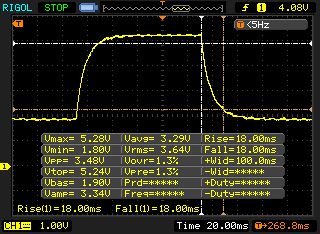 |
| ↘ 18 ms queda | ||
| A tela mostra taxas de resposta lentas em nossos testes e será insatisfatória para os jogadores. Em comparação, todos os dispositivos testados variam de 0.165 (mínimo) a 636 (máximo) ms. » 51 % de todos os dispositivos são melhores. Isso significa que o tempo de resposta medido é pior que a média de todos os dispositivos testados (31 ms). | ||
| Cinebench R10 | |
| Rendering Multiple CPUs 32Bit | |
| Alienware 17 R4 | |
| Asus G752VS-XB78K | |
| Asus G752VS-BA338T | |
| MSI GT72VR 7RE-433 | |
| Nexoc G734IV | |
| Rendering Single 32Bit | |
| Alienware 17 R4 | |
| Asus G752VS-XB78K | |
| Asus G752VS-BA338T | |
| MSI GT72VR 7RE-433 | |
| Nexoc G734IV | |
| Geekbench 3 | |
| 32 Bit Multi-Core Score | |
| Nexoc G734IV | |
| Asus G752VS-BA338T | |
| MSI GT72VR 7RE-433 | |
| 32 Bit Single-Core Score | |
| Asus G752VS-BA338T | |
| Nexoc G734IV | |
| MSI GT72VR 7RE-433 | |
| Geekbench 4.0 | |
| 64 Bit Multi-Core Score | |
| Nexoc G734IV | |
| Asus G752VS-BA338T | |
| MSI GT72VR 7RE-433 | |
| 64 Bit Single-Core Score | |
| Asus G752VS-BA338T | |
| Nexoc G734IV | |
| MSI GT72VR 7RE-433 | |
| Geekbench 4.4 | |
| 64 Bit Multi-Core Score | |
| Asus G752VS-BA338T | |
| 64 Bit Single-Core Score | |
| Asus G752VS-BA338T | |
| JetStream 1.1 - 1.1 Total | |
| Asus G752VS-BA338T | |
| Nexoc G734IV | |
| MSI GT72VR 7RE-433 | |
| Asus G752VS-XB78K | |
| Alienware 17 R4 | |
| PCMark 7 Score | 6805 pontos | |
| PCMark 8 Home Score Accelerated v2 | 5103 pontos | |
| PCMark 8 Creative Score Accelerated v2 | 8191 pontos | |
| PCMark 8 Work Score Accelerated v2 | 5410 pontos | |
Ajuda | ||

| Asus G752VS-BA338T Samsung SM961 MZVKW512HMJP m.2 PCI-e | MSI GT72VR 7RE-433 Kingston RBU-SNS8152S3256GG5 | Gigabyte P57X v7 Transcend MTS800 256GB M.2 (TS256GMTS800) | Nexoc G734IV Samsung SM961 MZVKW512HMJP m.2 PCI-e | Alienware 17 R4 SK Hynix PC300 NVMe 512 GB | Asus G752VS-XB78K Toshiba NVMe THNSN5512GPU7 | |
|---|---|---|---|---|---|---|
| CrystalDiskMark 3.0 | -49% | -58% | -6% | -11% | 19% | |
| Read Seq (MB/s) | 2791 | 521 -81% | 517 -81% | 2268 -19% | 1277 -54% | 1718 -38% |
| Write Seq (MB/s) | 1596 | 311.8 -80% | 305.7 -81% | 1559 -2% | 786 -51% | 1305 -18% |
| Read 512 (MB/s) | 400.8 | 403.1 1% | 315 -21% | 413.8 3% | 894 123% | 1250 212% |
| Write 512 (MB/s) | 1606 | 332.3 -79% | 306.1 -81% | 1167 -27% | 659 -59% | 1438 -10% |
| Read 4k (MB/s) | 55.1 | 33.35 -39% | 26.04 -53% | 54 -2% | 38.11 -31% | 44.42 -19% |
| Write 4k (MB/s) | 163.8 | 111.1 -32% | 82.3 -50% | 154.9 -5% | 128.5 -22% | 154.4 -6% |
| Read 4k QD32 (MB/s) | 607 | 331.1 -45% | 281.3 -54% | 634 4% | 628 3% | 744 23% |
| Write 4k QD32 (MB/s) | 527 | 318.3 -40% | 296 -44% | 509 -3% | 531 1% | 578 10% |
| 3DMark 06 Standard Score | 30279 pontos | |
| 3DMark 11 Performance | 17222 pontos | |
| 3DMark Ice Storm Standard Score | 122763 pontos | |
| 3DMark Cloud Gate Standard Score | 26609 pontos | |
| 3DMark Fire Strike Score | 14277 pontos | |
| 3DMark Fire Strike Extreme Score | 7961 pontos | |
| 3DMark Time Spy Score | 5392 pontos | |
Ajuda | ||
| 3DMark - 1920x1080 Fire Strike Graphics | |
| Alienware 17 R4 | |
| Asus G752VS-BA338T | |
| MSI GT72VR 7RE-433 | |
| Nexoc G734IV | |
| Gigabyte P57X v7 | |
| Acer Predator 17 G9-793-70PJ | |
| Asus G752VS-XB78K | |
| 3DMark 11 - 1280x720 Performance GPU | |
| Alienware 17 R4 | |
| Asus G752VS-BA338T | |
| Gigabyte P57X v7 | |
| MSI GT72VR 7RE-433 | |
| Acer Predator 17 G9-793-70PJ | |
| Asus G752VS-XB78K | |
| Nexoc G734IV | |
| BioShock Infinite - 1920x1080 Ultra Preset, DX11 (DDOF) | |
| Alienware 17 R4 | |
| Asus G752VS-BA338T | |
| Asus G752VS-XB78K | |
| MSI GT72VR 7RE-433 | |
| Gigabyte P57X v7 | |
| Nexoc G734IV | |
| The Witcher 3 - 1920x1080 Ultra Graphics & Postprocessing (HBAO+) | |
| Alienware 17 R4 | |
| Asus G752VS-BA338T | |
| Acer Predator 17 G9-793-70PJ | |
| Asus G752VS-XB78K | |
| Far Cry Primal - 1920x1080 Ultra Preset AA:SM | |
| Asus G752VS-XB78K | |
| Asus G752VS-BA338T | |
| Rise of the Tomb Raider - 1920x1080 Very High Preset AA:FX AF:16x | |
| Alienware 17 R4 | |
| Asus G752VS-BA338T | |
| Asus G752VS-XB78K | |
| Nexoc G734IV | |
| For Honor - 1920x1080 Extreme Preset AA:T AF:16x | |
| Asus G752VS-BA338T | |
| Acer Predator 17 G9-793-70PJ | |
| baixo | média | alto | ultra | |
|---|---|---|---|---|
| Tomb Raider (2013) | 431.5 | 407.8 | 339 | 192 |
| BioShock Infinite (2013) | 260.3 | 220.8 | 207.5 | 139.4 |
| The Witcher 3 (2015) | 228.1 | 184.4 | 117 | 59.6 |
| Rise of the Tomb Raider (2016) | 219.7 | 180.1 | 117.7 | 99 |
| Far Cry Primal (2016) | 118 | 103 | 93 | 86 |
| For Honor (2017) | 242.6 | 160 | 154 | 113.4 |
| Ghost Recon Wildlands (2017) | 127 | 96.3 | 91 | 54.4 |
| Prey (2017) | 142 | 140.2 | 135.2 | 132.5 |
Barulho
| Ocioso |
| 30 / 32 / 36 dB |
| HDD |
| 34 dB |
| DVD |
| 40 / dB |
| Carga |
| 43 / 49 dB |
 | ||
30 dB silencioso 40 dB(A) audível 50 dB(A) ruidosamente alto |
||
min: | ||
| Asus G752VS-BA338T i7-7700HQ, GeForce GTX 1070 Mobile | MSI GT72VR 7RE-433 i7-7700HQ, GeForce GTX 1070 Mobile | Gigabyte P57X v7 i7-7700HQ, GeForce GTX 1070 Mobile | Nexoc G734IV i7-7700HQ, GeForce GTX 1070 Mobile | Acer Predator 17 G9-793-70PJ i7-7700HQ, GeForce GTX 1070 Mobile | Alienware 17 R4 i7-7820HK, GeForce GTX 1080 Mobile | Asus G752VS-XB78K 6820HK, GeForce GTX 1070 Mobile | |
|---|---|---|---|---|---|---|---|
| Noise | -1% | 0% | -13% | -4% | -8% | 3% | |
| desligado / ambiente * (dB) | 30 | 31 -3% | 29 3% | 30 -0% | 31 -3% | 28.2 6% | 30 -0% |
| Idle Minimum * (dB) | 30 | 34 -13% | 30.4 -1% | 34 -13% | 32 -7% | 35.6 -19% | 31 -3% |
| Idle Average * (dB) | 32 | 35 -9% | 32.1 -0% | 35 -9% | 35 -9% | 35.6 -11% | 32 -0% |
| Idle Maximum * (dB) | 36 | 37 -3% | 32.1 11% | 46 -28% | 38 -6% | 35.7 1% | 33 8% |
| Load Average * (dB) | 43 | 37 14% | 45.6 -6% | 49 -14% | 42 2% | 50.2 -17% | 40 7% |
| Witcher 3 ultra * (dB) | 43 | 44 -2% | 50.2 -17% | ||||
| Load Maximum * (dB) | 49 | 44 10% | 51.5 -5% | 56 -14% | 50 -2% | 50.2 -2% | 47 4% |
* ... menor é melhor
(±) A temperatura máxima no lado superior é 41 °C / 106 F, em comparação com a média de 40.4 °C / 105 F , variando de 21.2 a 68.8 °C para a classe Gaming.
(+) A parte inferior aquece até um máximo de 39.3 °C / 103 F, em comparação com a média de 43.2 °C / 110 F
(+) Em uso inativo, a temperatura média para o lado superior é 26.8 °C / 80 F, em comparação com a média do dispositivo de 33.9 °C / ### class_avg_f### F.
(+) Jogando The Witcher 3, a temperatura média para o lado superior é 31.3 °C / 88 F, em comparação com a média do dispositivo de 33.9 °C / ## #class_avg_f### F.
(+) Os apoios para as mãos e o touchpad são mais frios que a temperatura da pele, com um máximo de 27.6 °C / 81.7 F e, portanto, são frios ao toque.
(±) A temperatura média da área do apoio para as mãos de dispositivos semelhantes foi 28.8 °C / 83.8 F (+1.2 °C / 2.1 F).
| Asus G752VS-BA338T i7-7700HQ, GeForce GTX 1070 Mobile | MSI GT72VR 7RE-433 i7-7700HQ, GeForce GTX 1070 Mobile | Gigabyte P57X v7 i7-7700HQ, GeForce GTX 1070 Mobile | Nexoc G734IV i7-7700HQ, GeForce GTX 1070 Mobile | Acer Predator 17 G9-793-70PJ i7-7700HQ, GeForce GTX 1070 Mobile | Alienware 17 R4 i7-7820HK, GeForce GTX 1080 Mobile | Asus G752VS-XB78K 6820HK, GeForce GTX 1070 Mobile | |
|---|---|---|---|---|---|---|---|
| Heat | -4% | -20% | -15% | 1% | -18% | -7% | |
| Maximum Upper Side * (°C) | 41 | 41.5 -1% | 51.2 -25% | 48.1 -17% | 39.1 5% | 49.6 -21% | 42.9 -5% |
| Maximum Bottom * (°C) | 39.3 | 50.6 -29% | 56.8 -45% | 59.3 -51% | 42.1 -7% | 56 -42% | 41.5 -6% |
| Idle Upper Side * (°C) | 28.8 | 26.4 8% | 29.2 -1% | 28.2 2% | 27.9 3% | 29.6 -3% | 31.6 -10% |
| Idle Bottom * (°C) | 27.3 | 25.4 7% | 29.2 -7% | 26 5% | 26.1 4% | 29.2 -7% | 29.5 -8% |
* ... menor é melhor
Asus G752VS-BA338T análise de áudio
(±) | o volume do alto-falante é médio, mas bom (###valor### dB)
Graves 100 - 315Hz
(±) | graves reduzidos - em média 9.4% menor que a mediana
(±) | a linearidade dos graves é média (11.1% delta para a frequência anterior)
Médios 400 - 2.000 Hz
(+) | médios equilibrados - apenas 4.2% longe da mediana
(+) | médios são lineares (6% delta para frequência anterior)
Altos 2 - 16 kHz
(±) | máximos reduzidos - em média 7.7% menor que a mediana
(±) | a linearidade dos máximos é média (10% delta para frequência anterior)
Geral 100 - 16.000 Hz
(±) | a linearidade do som geral é média (21.2% diferença em relação à mediana)
Comparado com a mesma classe
» 76% de todos os dispositivos testados nesta classe foram melhores, 4% semelhantes, 19% piores
» O melhor teve um delta de 6%, a média foi 18%, o pior foi 132%
Comparado com todos os dispositivos testados
» 59% de todos os dispositivos testados foram melhores, 7% semelhantes, 34% piores
» O melhor teve um delta de 4%, a média foi 23%, o pior foi 134%
Acer Predator 17 G9-793-70PJ análise de áudio
(+) | os alto-falantes podem tocar relativamente alto (###valor### dB)
Graves 100 - 315Hz
(±) | graves reduzidos - em média 5.5% menor que a mediana
(±) | a linearidade dos graves é média (8% delta para a frequência anterior)
Médios 400 - 2.000 Hz
(+) | médios equilibrados - apenas 2.9% longe da mediana
(+) | médios são lineares (3.5% delta para frequência anterior)
Altos 2 - 16 kHz
(±) | máximos reduzidos - em média 5.2% menor que a mediana
(+) | os máximos são lineares (6.2% delta da frequência anterior)
Geral 100 - 16.000 Hz
(+) | o som geral é linear (10.3% diferença em relação à mediana)
Comparado com a mesma classe
» 6% de todos os dispositivos testados nesta classe foram melhores, 2% semelhantes, 93% piores
» O melhor teve um delta de 6%, a média foi 18%, o pior foi 132%
Comparado com todos os dispositivos testados
» 5% de todos os dispositivos testados foram melhores, 1% semelhantes, 94% piores
» O melhor teve um delta de 4%, a média foi 23%, o pior foi 134%
| desligado | |
| Ocioso | |
| Carga |
|
Key:
min: | |
| Asus G752VS-BA338T i7-7700HQ, GeForce GTX 1070 Mobile | MSI GT72VR 7RE-433 i7-7700HQ, GeForce GTX 1070 Mobile | Gigabyte P57X v7 i7-7700HQ, GeForce GTX 1070 Mobile | Nexoc G734IV i7-7700HQ, GeForce GTX 1070 Mobile | Acer Predator 17 G9-793-70PJ i7-7700HQ, GeForce GTX 1070 Mobile | Alienware 17 R4 i7-7820HK, GeForce GTX 1080 Mobile | Asus G752VS-XB78K 6820HK, GeForce GTX 1070 Mobile | |
|---|---|---|---|---|---|---|---|
| Power Consumption | 4% | -13% | 20% | -14% | -37% | -10% | |
| Idle Minimum * (Watt) | 21 | 20 5% | 15.7 25% | 12 43% | 23 -10% | 37.5 -79% | 24 -14% |
| Idle Average * (Watt) | 27 | 27 -0% | 23.4 13% | 17 37% | 33 -22% | 37.6 -39% | 31 -15% |
| Idle Maximum * (Watt) | 32 | 31 3% | 23.5 27% | 22 31% | 40 -25% | 37.6 -18% | 36 -13% |
| Load Average * (Watt) | 86 | 86 -0% | 184.6 -115% | 86 -0% | 94 -9% | 122.4 -42% | 94 -9% |
| Witcher 3 ultra * (Watt) | 165 | 177 -7% | 180.3 -9% | ||||
| Load Maximum * (Watt) | 206 | 184 11% | 233.1 -13% | 224 -9% | 228 -11% | 277.4 -35% | 204 1% |
* ... menor é melhor
| Asus G752VS-BA338T i7-7700HQ, GeForce GTX 1070 Mobile, 90 Wh | MSI GT72VR 7RE-433 i7-7700HQ, GeForce GTX 1070 Mobile, 83 Wh | Gigabyte P57X v7 i7-7700HQ, GeForce GTX 1070 Mobile, 75.81 Wh | Nexoc G734IV i7-7700HQ, GeForce GTX 1070 Mobile, 60 Wh | Acer Predator 17 G9-793-70PJ i7-7700HQ, GeForce GTX 1070 Mobile, 88 Wh | Alienware 17 R4 i7-7820HK, GeForce GTX 1080 Mobile, 99 Wh | Asus G752VS-XB78K 6820HK, GeForce GTX 1070 Mobile, 90 Wh | |
|---|---|---|---|---|---|---|---|
| Duração da bateria | -17% | -30% | -19% | -20% | -34% | -25% | |
| Reader / Idle (h) | 7.4 | 5.3 -28% | 4.3 -42% | 7.7 4% | 5.4 -27% | 4.6 -38% | 5.2 -30% |
| H.264 (h) | 4.3 | 3.8 -12% | 3.3 -23% | 3.1 -28% | |||
| WiFi v1.3 (h) | 4.9 | 3.8 -22% | 2.6 -47% | 3.4 -31% | 3.6 -27% | 3 -39% | 3.5 -29% |
| Load (h) | 1.6 | 1.5 -6% | 1.6 0% | 1.2 -25% | 1.5 -6% | 1.2 -25% | 1.4 -13% |
Pro
Contra
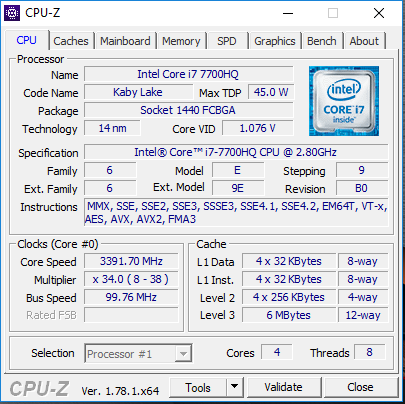
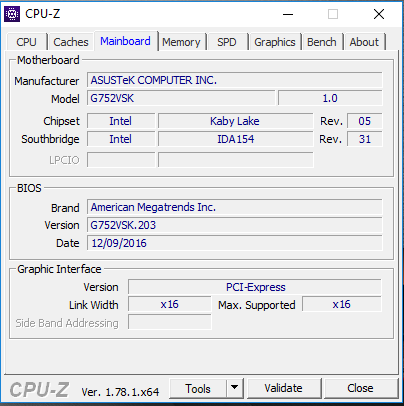
O G752VS-BA338T é o modelo Kaby Lake da série de portáteis de jogos de 17 polegadas da Asus. O novo processador Core i7-7700HQ não é muito mais veloz, em comparação com os modelo Skylake.
O processador Kaby Lake resulta em durações mais longas da bateria graças à eficiência melhorada.
A combinação CPU/GPU pode rodar todos os jogos modernos na resolução Full HD com detalhes altos a máximos. A tecnologia G-Sync da Nvidia garante imagens suaves na tela de 120 Hz e a placa de vídeo ainda possui espaço suficiente para resoluções mais altas. No entanto, isso requer um monitor externo.
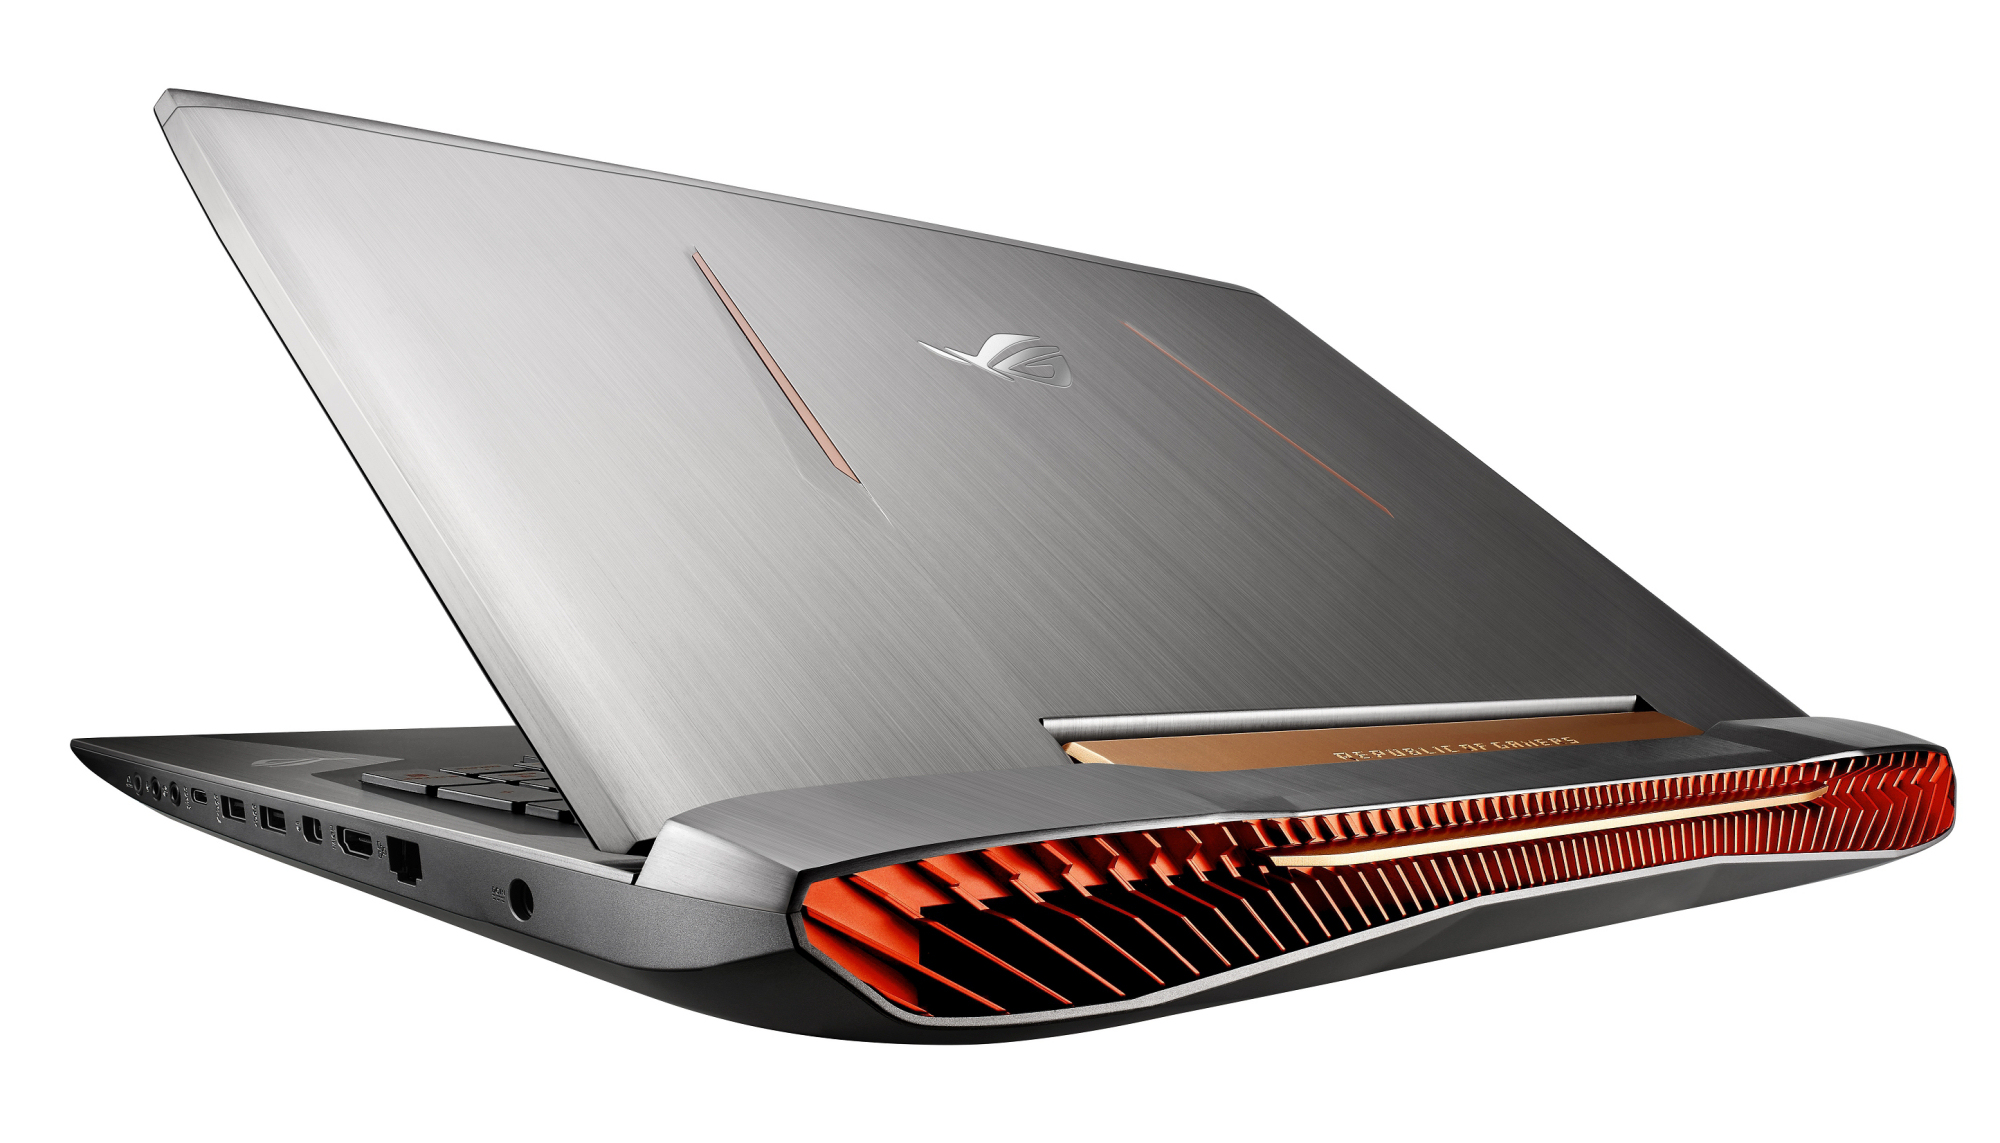
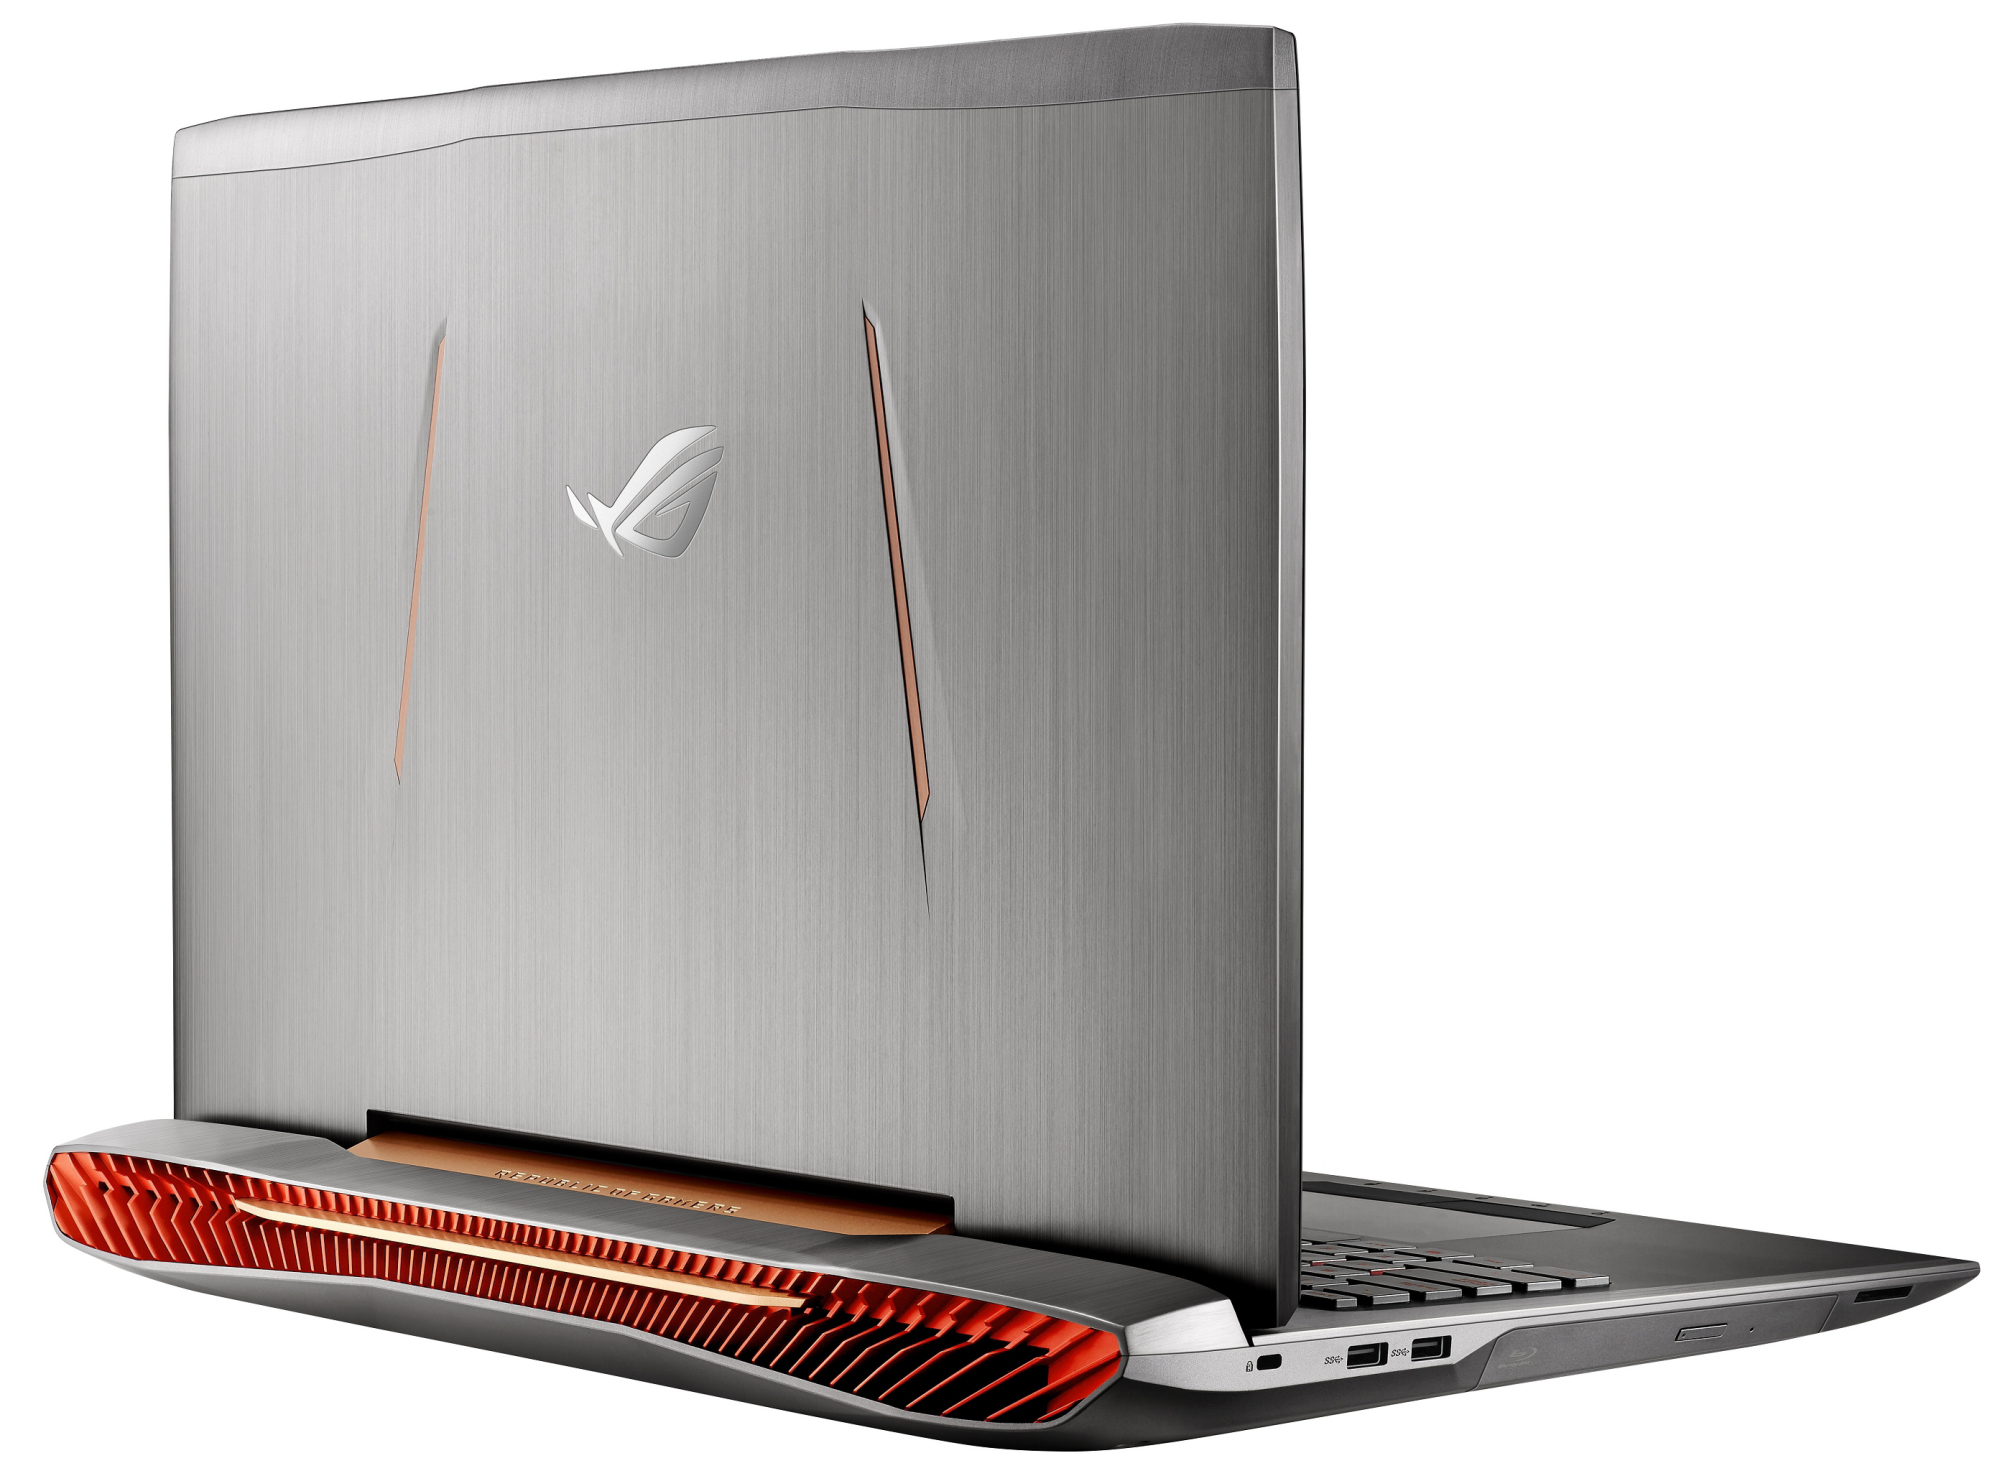
As emissões de ruído não são muito ruins apesar do poderoso hardware. Este também é o caso para a emissão de temperatura. A Asus equipa o portátil com um veloz SSD NVMe-SSD e inclusive há um slot livre para um segundo SSD NVMe. Um disco rígido convencional de 2,5-polegadas também está incluído. Não é problema substituir as unidades graças à escotilha de manutenção.
Asus G752VS-BA338T
- 05/30/2017 v6 (old)
Sascha Mölck
Price comparison
