Breve Análise do Portátil Alienware 17 R4 (7820HK, QHD, GTX 1080)
| Networking | |
| iperf3 transmit AX12 | |
| Alienware 17 R4 | |
| MSI GT62VR 7RE-223 | |
| Dell XPS 15 9560 (i7-7700HQ, UHD) | |
| iperf3 receive AX12 | |
| MSI GT62VR 7RE-223 | |
| Dell XPS 15 9560 (i7-7700HQ, UHD) | |
| Alienware 17 R4 | |
| |||||||||||||||||||||||||
iluminação: 86 %
iluminação com acumulador: 402.3 cd/m²
Contraste: 649:1 (Preto: 0.62 cd/m²)
ΔE ColorChecker Calman: 5.6 | ∀{0.5-29.43 Ø4.71}
ΔE Greyscale Calman: 4.7 | ∀{0.09-98 Ø4.96}
82.2% sRGB (Argyll 1.6.3 3D)
53.7% AdobeRGB 1998 (Argyll 1.6.3 3D)
60.5% AdobeRGB 1998 (Argyll 3D)
82.9% sRGB (Argyll 3D)
61.2% Display P3 (Argyll 3D)
Gamma: 2.14
CCT: 7519 K
| Alienware 17 R4 TN LED, 17.3", 2560x1440 | Alienware 17 R3 (A17-9935) CV69H_173WF4 (LGD0459), IPS, 17.3", 1920x1080 | MSI GT73VR 7RF-296 N173HHE-G32 (CMN1747), TN LED, 17.3", 1920x1080 | Acer Predator 17 X GX-792-76DL LP173WF4-SPF5 (LGD056D), IPS, 17.3", 1920x1080 | Aorus X7 DT v6 AUO1096, TN LED, 17.3", 2560x1440 | |
|---|---|---|---|---|---|
| Display | 4% | 36% | 3% | -1% | |
| Display P3 Coverage (%) | 61.2 | 66.9 9% | 90.6 48% | 66 8% | 59.6 -3% |
| sRGB Coverage (%) | 82.9 | 83.9 1% | 99.9 21% | 83.7 1% | 82.8 0% |
| AdobeRGB 1998 Coverage (%) | 60.5 | 61.4 1% | 84.7 40% | 61.2 1% | 60.1 -1% |
| Response Times | -45% | 29% | -85% | 13% | |
| Response Time Grey 50% / Grey 80% * (ms) | 30 ? | 33 ? -10% | 26 ? 13% | 45 ? -50% | 21.6 ? 28% |
| Response Time Black / White * (ms) | 12.8 ? | 23 ? -80% | 7 ? 45% | 28 ? -119% | 13.2 ? -3% |
| PWM Frequency (Hz) | 59.5 | ||||
| Screen | 7% | -9% | 16% | -6% | |
| Brightness middle (cd/m²) | 402.3 | 360 -11% | 307 -24% | 380 -6% | 339.5 -16% |
| Brightness (cd/m²) | 372 | 336 -10% | 284 -24% | 362 -3% | 309 -17% |
| Brightness Distribution (%) | 86 | 90 5% | 85 -1% | 91 6% | 80 -7% |
| Black Level * (cd/m²) | 0.62 | 0.44 29% | 0.25 60% | 0.37 40% | 0.45 27% |
| Contrast (:1) | 649 | 818 26% | 1228 89% | 1027 58% | 754 16% |
| Colorchecker dE 2000 * | 5.6 | 4.76 15% | 9.65 -72% | 4.12 26% | 6.88 -23% |
| Colorchecker dE 2000 max. * | 9.8 | 10.8 -10% | 16.36 -67% | 8.19 16% | 9.99 -2% |
| Greyscale dE 2000 * | 4.7 | 3.69 21% | 10.07 -114% | 3.95 16% | 6.57 -40% |
| Gamma | 2.14 103% | 2.24 98% | 2.12 104% | 2.47 89% | 2.04 108% |
| CCT | 7519 86% | 6091 107% | 12145 54% | 6539 99% | 8608 76% |
| Color Space (Percent of AdobeRGB 1998) (%) | 53.7 | 55 2% | 75 40% | 55 2% | 54 1% |
| Color Space (Percent of sRGB) (%) | 82.2 | 84 2% | 100 22% | 84 2% | 82 0% |
| Média Total (Programa/Configurações) | -11% /
-1% | 19% /
5% | -22% /
-0% | 2% /
-3% |
* ... menor é melhor
Exibir tempos de resposta
| ↔ Tempo de resposta preto para branco | ||
|---|---|---|
| 12.8 ms ... ascensão ↗ e queda ↘ combinadas | ↗ 10.8 ms ascensão | 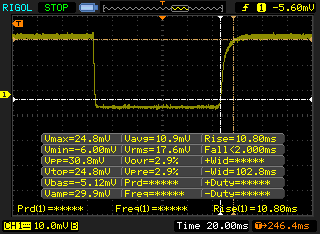 |
| ↘ 2 ms queda | ||
| A tela mostra boas taxas de resposta em nossos testes, mas pode ser muito lenta para jogadores competitivos. Em comparação, todos os dispositivos testados variam de 0.1 (mínimo) a 240 (máximo) ms. » 33 % de todos os dispositivos são melhores. Isso significa que o tempo de resposta medido é melhor que a média de todos os dispositivos testados (19.8 ms). | ||
| ↔ Tempo de resposta 50% cinza a 80% cinza | ||
| 30 ms ... ascensão ↗ e queda ↘ combinadas | ↗ 18.8 ms ascensão | 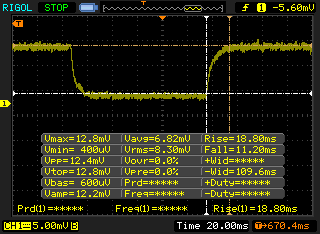 |
| ↘ 11.2 ms queda | ||
| A tela mostra taxas de resposta lentas em nossos testes e será insatisfatória para os jogadores. Em comparação, todos os dispositivos testados variam de 0.165 (mínimo) a 636 (máximo) ms. » 40 % de todos os dispositivos são melhores. Isso significa que o tempo de resposta medido é semelhante à média de todos os dispositivos testados (31 ms). | ||
Cintilação da tela / PWM (modulação por largura de pulso)
| Tela tremeluzindo / PWM não detectado |  | ||
[pwm_comparison] Em comparação: 52 % de todos os dispositivos testados não usam PWM para escurecer a tela. Se PWM foi detectado, uma média de 7754 (mínimo: 5 - máximo: 343500) Hz foi medida. | |||
| wPrime 2.10 - 1024m | |
| Apple MacBook Pro 15 2016 (2.7 GHz, 455) | |
| EVGA SC17 GTX 1070 | |
| Samsung Odyssey NP800G5M-X01US | |
| Eurocom Sky X7E2 | |
| Alienware 17 R4 | |
| Eurocom Tornado F5 | |
* ... menor é melhor
| PCMark 8 | |
| Home Score Accelerated v2 | |
| Aorus X7 DT v6 | |
| Alienware 17 R4 | |
| Eurocom Tornado F5 Killer Edition | |
| Work Score Accelerated v2 | |
| Aorus X7 DT v6 | |
| Alienware 17 R4 | |
| Eurocom Tornado F5 Killer Edition | |
| Creative Score Accelerated v2 | |
| Aorus X7 DT v6 | |
| Eurocom Tornado F5 Killer Edition | |
| Alienware 17 R4 | |
| PCMark 8 Home Score Accelerated v2 | 5064 pontos | |
| PCMark 8 Creative Score Accelerated v2 | 8272 pontos | |
| PCMark 8 Work Score Accelerated v2 | 5088 pontos | |
Ajuda | ||
| Alienware 17 R4 SK Hynix PC300 NVMe 512 GB | Alienware 17 R3 (A17-9935) Samsung PM951 NVMe 512 GB | MSI GT73VR 7RF-296 2x Samsung SM951 MZVPV256HDGL (RAID 0) | Acer Predator 17 X GX-792-76DL Toshiba NVMe THNSN5512GPU7 | Aorus X7 DT v6 Samsung SM951 MZVPV512HDGL m.2 PCI-e | |
|---|---|---|---|---|---|
| CrystalDiskMark 3.0 | -20% | 100% | 30% | 43% | |
| Read Seq (MB/s) | 1277 | 1263 -1% | 3219 152% | 1494 17% | 1829 43% |
| Write Seq (MB/s) | 786 | 587 -25% | 2572 227% | 1371 74% | 1588 102% |
| Read 512 (MB/s) | 894 | 569 -36% | 1776 99% | 898 0% | 1064 19% |
| Write 512 (MB/s) | 659 | 265.2 -60% | 2445 271% | 1273 93% | 1507 129% |
| Read 4k (MB/s) | 38.11 | 42.59 12% | 51.1 34% | 43.82 15% | 52.9 39% |
| Write 4k (MB/s) | 128.5 | 140.6 9% | 141.3 10% | 161.6 26% | 161.1 25% |
| Read 4k QD32 (MB/s) | 628 | 610 -3% | 658 5% | 669 7% | 676 8% |
| Write 4k QD32 (MB/s) | 531 | 232.8 -56% | 554 4% | 552 4% | 419.1 -21% |

| 3DMark | |
| 1920x1080 Fire Strike Graphics | |
| Nvidia GeForce GTX 1080 Ti Founders Edition | |
| MSI Gaming X GeForce GTX 1080 Desktop PC | |
| Alienware 17 R4 | |
| Eurocom Tornado F5 Killer Edition | |
| Asus Strix GL702VSK | |
| Asus Strix GTX 980 Ti Desktop PC | |
| Asus G701VO-CS74K | |
| MSI GS63VR 7RF-228US | |
| Fire Strike Extreme Graphics | |
| Alienware 17 R4 | |
| Eurocom Tornado F5 Killer Edition | |
| Asus Strix GL702VSK | |
| Asus Strix GTX 980 Ti Desktop PC | |
| Asus G701VO-CS74K | |
| MSI GS63VR 7RF-228US | |
| 3840x2160 Fire Strike Ultra Graphics | |
| Nvidia GeForce GTX 1080 Ti Founders Edition | |
| Alienware 17 R4 | |
| Eurocom Tornado F5 Killer Edition | |
| Asus Strix GTX 980 Ti Desktop PC | |
| Asus G701VO-CS74K | |
| MSI GS63VR 7RF-228US | |
| 3DMark 11 | |
| 1280x720 Performance GPU | |
| Nvidia GeForce GTX 1080 Ti Founders Edition | |
| MSI Gaming X GeForce GTX 1080 Desktop PC | |
| Eurocom Tornado F5 Killer Edition | |
| Alienware 17 R4 | |
| Asus Strix GTX 980 Ti Desktop PC | |
| Asus Strix GL702VSK | |
| Asus G701VO-CS74K | |
| MSI GS63VR 7RF-228US | |
| 1280x720 Performance Combined | |
| Nvidia GeForce GTX 1080 Ti Founders Edition | |
| Asus Strix GTX 980 Ti Desktop PC | |
| MSI Gaming X GeForce GTX 1080 Desktop PC | |
| Alienware 17 R4 | |
| Asus G701VO-CS74K | |
| MSI GS63VR 7RF-228US | |
| Eurocom Tornado F5 Killer Edition | |
| Asus Strix GL702VSK | |
| Rise of the Tomb Raider - 1920x1080 Very High Preset AA:FX AF:16x | |
| Nvidia GeForce GTX 1080 Ti Founders Edition | |
| Alienware 17 R4 | |
| Eurocom Tornado F5 Killer Edition | |
| Nvidia GeForce GTX 1080 Founders Edition | |
| Nvidia GeForce GTX 1080 Founders Edition | |
| Nvidia GeForce GTX 1080 Founders Edition | |
| Asus Strix GL702VSK | |
| Asus Strix GTX 980 Ti Desktop PC | |
| MSI GS63VR 7RF-228US | |
| Asus G701VO-CS74K | |
| BioShock Infinite - 1920x1080 Ultra Preset, DX11 (DDOF) | |
| Nvidia GeForce GTX 1080 Ti Founders Edition | |
| Nvidia GeForce GTX 1080 Founders Edition | |
| Alienware 17 R4 | |
| Asus Strix GTX 980 Ti Desktop PC | |
| Eurocom Tornado F5 Killer Edition | |
| Asus Strix GL702VSK | |
| Asus G701VO-CS74K | |
| MSI GS63VR 7RF-228US | |
| Metro: Last Light - 1920x1080 Very High (DX11) AF:16x | |
| Nvidia GeForce GTX 1080 Ti Founders Edition | |
| Nvidia GeForce GTX 1080 Founders Edition | |
| Alienware 17 R4 | |
| Asus Strix GTX 980 Ti Desktop PC | |
| Eurocom Tornado F5 Killer Edition | |
| Asus Strix GL702VSK | |
| Asus G701VO-CS74K | |
| MSI GS63VR 7RF-228US | |
| Thief - 1920x1080 Very High Preset AA:FXAA & High SS AF:8x | |
| Eurocom Tornado F5 Killer Edition | |
| Alienware 17 R4 | |
| Asus Strix GL702VSK | |
| MSI GS63VR 7RF-228US | |
| Asus G701VO-CS74K | |
| The Witcher 3 - 1920x1080 Ultra Graphics & Postprocessing (HBAO+) | |
| Nvidia GeForce GTX 1080 Ti Founders Edition | |
| Alienware 17 R4 | |
| Nvidia GeForce GTX 1080 Founders Edition | |
| Eurocom Tornado F5 Killer Edition | |
| Asus Strix GTX 980 Ti Desktop PC | |
| Asus Strix GL702VSK | |
| MSI GS63VR 7RF-228US | |
| Batman: Arkham Knight - 1920x1080 High / On AA:SM AF:16x | |
| Alienware 17 R4 | |
| Eurocom Tornado F5 Killer Edition | |
| Asus G701VO-CS74K | |
| MSI GS63VR 7RF-228US | |
| Fallout 4 - 1920x1080 Ultra Preset AA:T AF:16x | |
| Nvidia GeForce GTX 1080 Ti Founders Edition | |
| Nvidia GeForce GTX 1080 Founders Edition | |
| Alienware 17 R4 | |
| Asus Strix GTX 980 Ti Desktop PC | |
| Asus Strix GL702VSK | |
| Asus G701VO-CS74K | |
| MSI GS63VR 7RF-228US | |
| Ashes of the Singularity - 1920x1080 high | |
| Nvidia GeForce GTX 1080 Ti Founders Edition | |
| Asus Strix GTX 980 Ti Desktop PC | |
| Alienware 17 R4 | |
| Eurocom Tornado F5 Killer Edition | |
| Asus Strix GL702VSK | |
| Doom - 1920x1080 Ultra Preset AA:SM | |
| Nvidia GeForce GTX 1080 Ti Founders Edition | |
| Nvidia GeForce GTX 1080 Ti Founders Edition | |
| Alienware 17 R4 | |
| Nvidia GeForce GTX 1080 Founders Edition | |
| Asus Strix GTX 980 Ti Desktop PC | |
| Asus Strix GL702VSK | |
| MSI GS63VR 7RF-228US | |
| Asus G701VO-CS74K | |
| Overwatch - 1920x1080 Epic (Render Scale 100 %) AA:SM AF:16x | |
| Nvidia GeForce GTX 1080 Ti Founders Edition | |
| Nvidia GeForce GTX 1080 Founders Edition | |
| Alienware 17 R4 | |
| Asus Strix GTX 980 Ti Desktop PC | |
| Asus G701VO-CS74K | |
| MSI GS63VR 7RF-228US | |
| Mafia 3 - 1920x1080 High Preset | |
| Eurocom Tornado F5 Killer Edition | |
| Nvidia GeForce GTX 1080 Ti Founders Edition | |
| Alienware 17 R4 | |
| Nvidia GeForce GTX 1080 Founders Edition | |
| Asus Strix GL702VSK | |
| Asus Strix GTX 980 Ti Desktop PC | |
| MSI GS63VR 7RF-228US | |
| 3DMark 11 Performance | 19125 pontos | |
| 3DMark Ice Storm Standard Score | 171837 pontos | |
| 3DMark Cloud Gate Standard Score | 32871 pontos | |
| 3DMark Fire Strike Score | 16931 pontos | |
| 3DMark Fire Strike Extreme Score | 9422 pontos | |
Ajuda | ||
| baixo | média | alto | ultra | |
|---|---|---|---|---|
| BioShock Infinite (2013) | 162.9 | |||
| Metro: Last Light (2013) | 132.2 | |||
| Thief (2014) | 107.2 | |||
| The Witcher 3 (2015) | 78.1 | |||
| Batman: Arkham Knight (2015) | 93 | |||
| Metal Gear Solid V (2015) | 60 | |||
| Dota 2 Reborn (2015) | 119.9 | |||
| Fallout 4 (2015) | 120.7 | |||
| Rise of the Tomb Raider (2016) | 118.3 | |||
| Ashes of the Singularity (2016) | 66.5 | |||
| Doom (2016) | 140.1 | |||
| Overwatch (2016) | 188 | |||
| Mafia 3 (2016) | 72.5 |
Barulho
| Ocioso |
| 35.6 / 35.6 / 35.7 dB |
| HDD |
| 35.7 dB |
| Carga |
| 50.2 / 50.2 dB |
 | ||
30 dB silencioso 40 dB(A) audível 50 dB(A) ruidosamente alto |
||
min: | ||
| Alienware 17 R4 GeForce GTX 1080 Mobile, i7-7820HK, SK Hynix PC300 NVMe 512 GB | Alienware 17 R3 (A17-9935) GeForce GTX 980M, 6700HQ, Samsung PM951 NVMe 512 GB | MSI GT72VR 7RE-433 GeForce GTX 1070 Mobile, i7-7700HQ, Kingston RBU-SNS8152S3256GG5 | MSI GT73VR 7RF-296 GeForce GTX 1080 Mobile, i7-7820HK, 2x Samsung SM951 MZVPV256HDGL (RAID 0) | Acer Predator 17 X GX-792-76DL GeForce GTX 1080 Mobile, i7-7820HK, Toshiba NVMe THNSN5512GPU7 | Aorus X7 DT v6 GeForce GTX 1080 Mobile, 6820HK, Samsung SM951 MZVPV512HDGL m.2 PCI-e | |
|---|---|---|---|---|---|---|
| Noise | 8% | 5% | 1% | 3% | -1% | |
| desligado / ambiente * (dB) | 28.2 | 30 -6% | 31 -10% | 30 -6% | 30 -6% | 28.6 -1% |
| Idle Minimum * (dB) | 35.6 | 31 13% | 34 4% | 34 4% | 33 7% | 32.2 10% |
| Idle Average * (dB) | 35.6 | 32 10% | 35 2% | 35 2% | 35 2% | 35.2 1% |
| Idle Maximum * (dB) | 35.7 | 33 8% | 37 -4% | 37 -4% | 37 -4% | 35.2 1% |
| Load Average * (dB) | 50.2 | 38 24% | 37 26% | 39 22% | 40 20% | 51.7 -3% |
| Witcher 3 ultra * (dB) | 50.2 | |||||
| Load Maximum * (dB) | 50.2 | 50 -0% | 44 12% | 56 -12% | 50 -0% | 55.7 -11% |
* ... menor é melhor
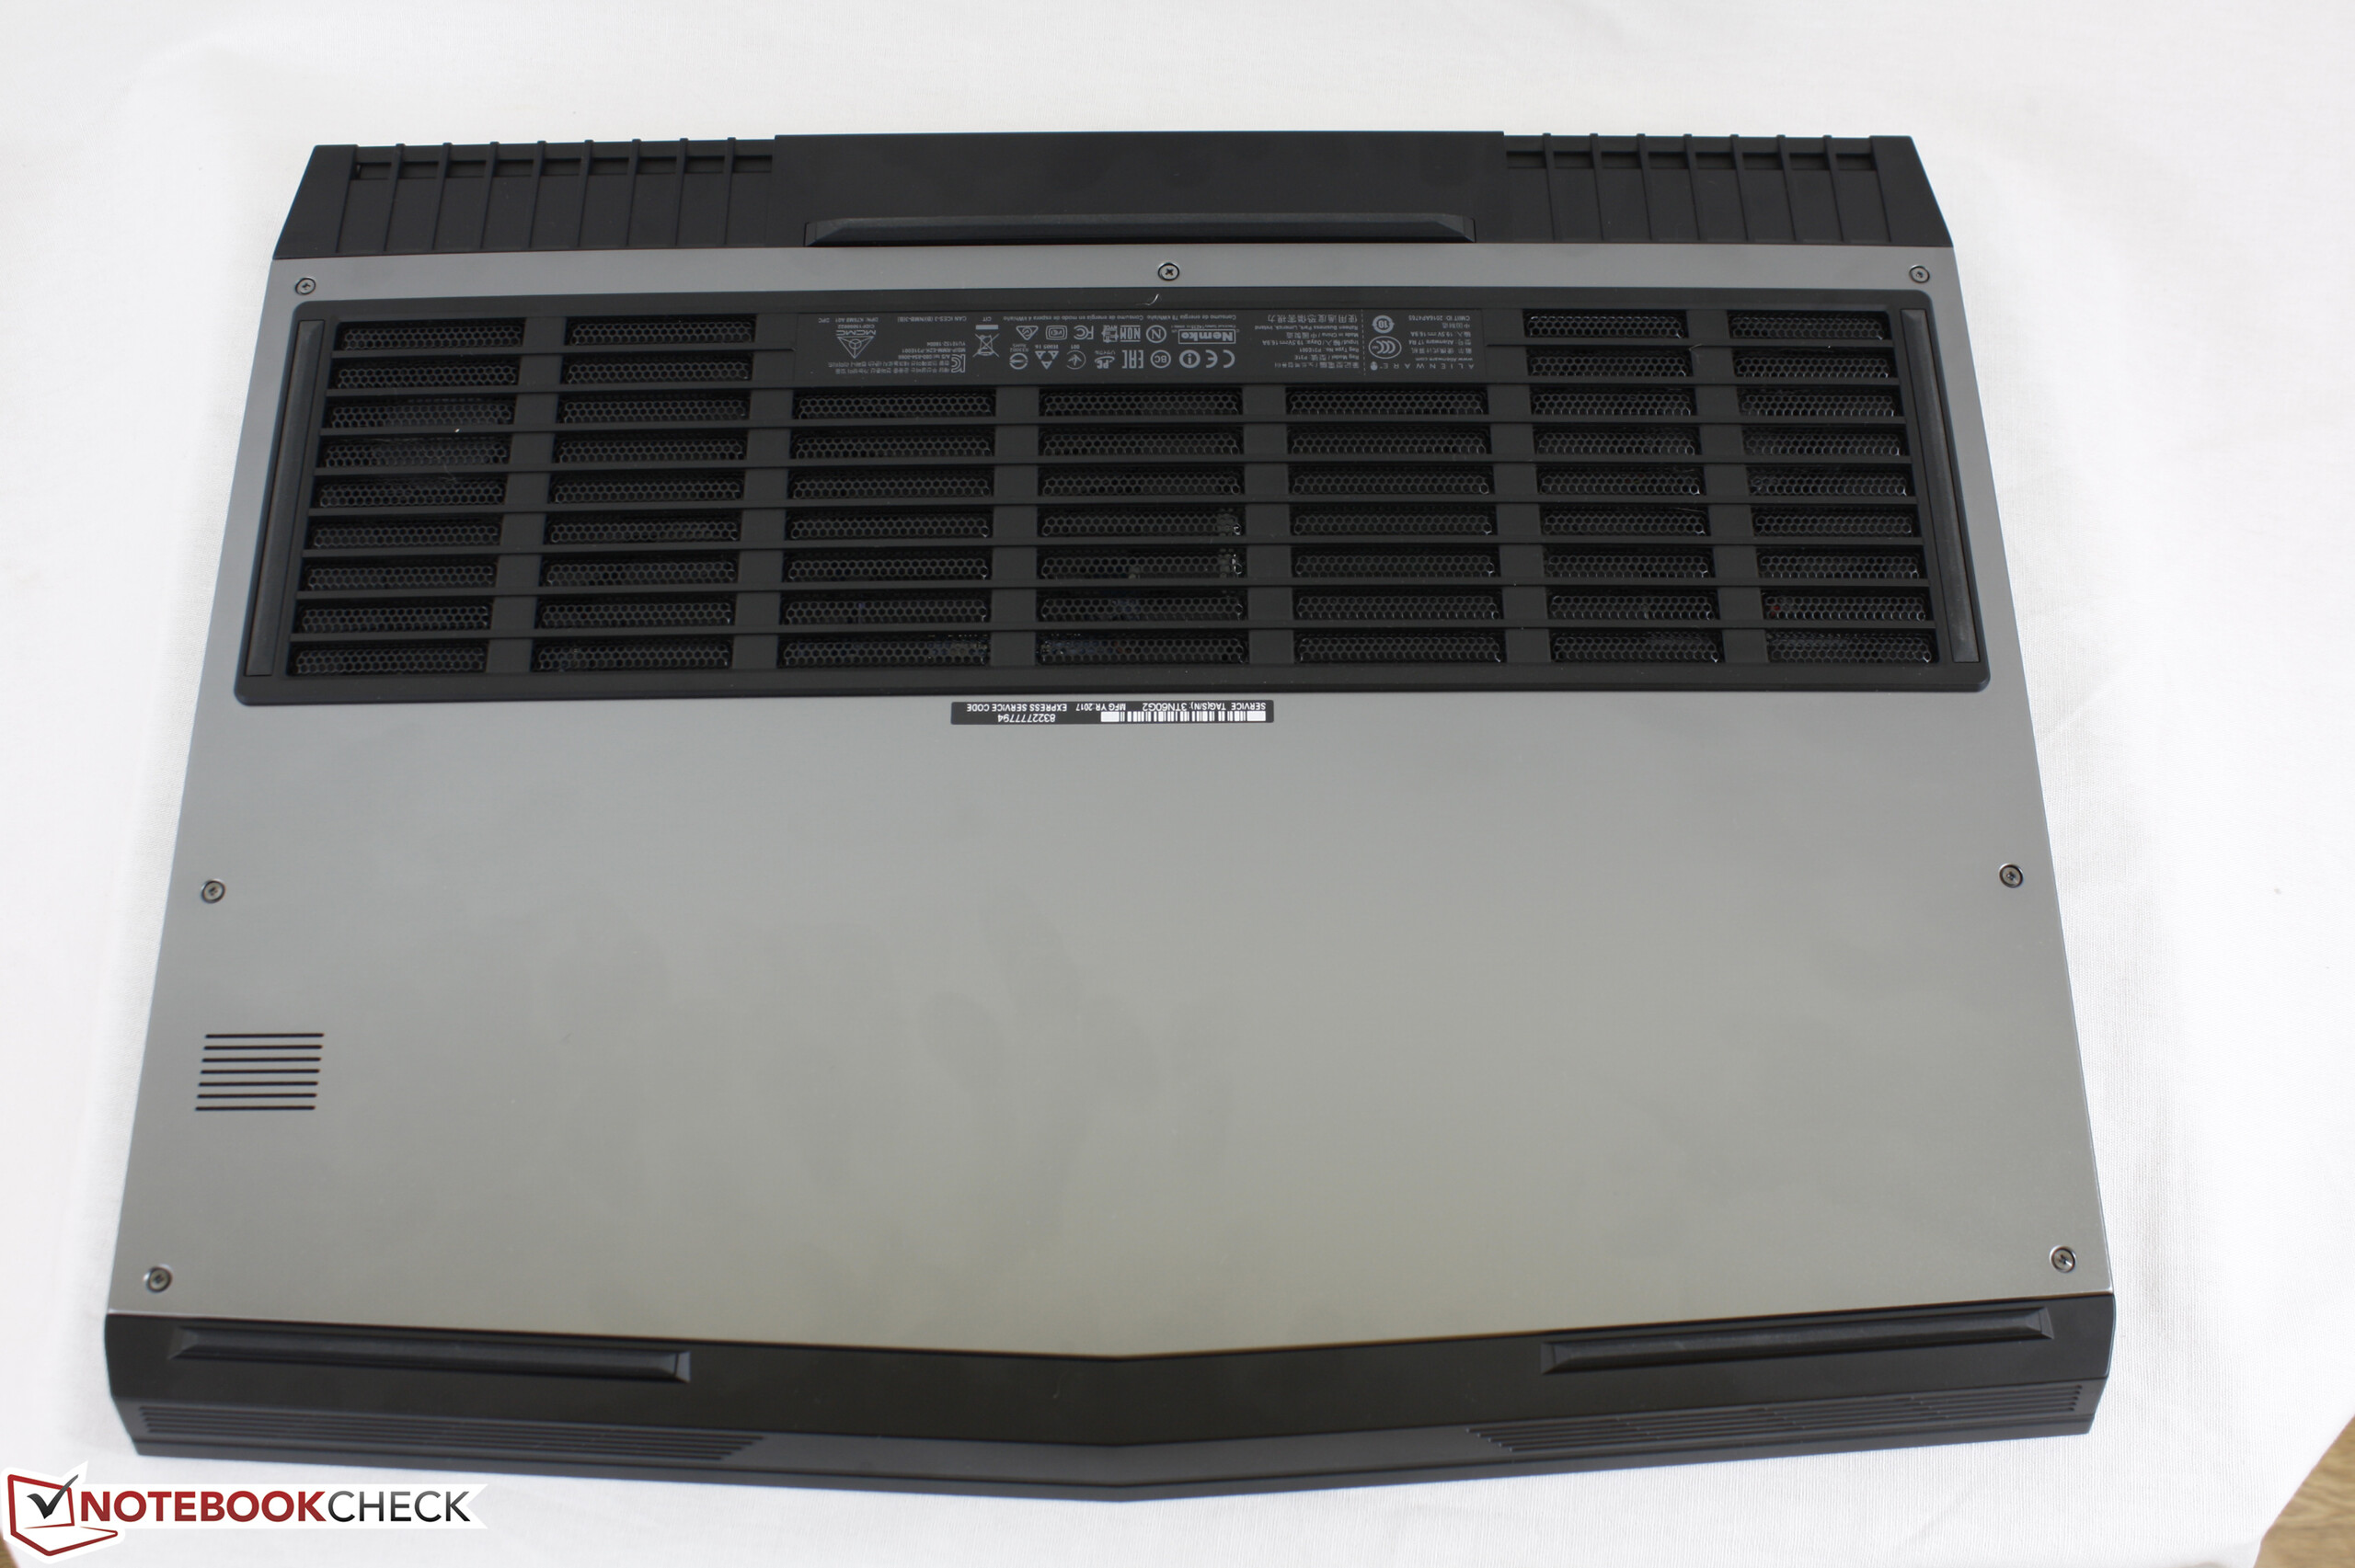
(-) A temperatura máxima no lado superior é 49.6 °C / 121 F, em comparação com a média de 40.4 °C / 105 F , variando de 21.2 a 68.8 °C para a classe Gaming.
(-) A parte inferior aquece até um máximo de 56 °C / 133 F, em comparação com a média de 43.2 °C / 110 F
(+) Em uso inativo, a temperatura média para o lado superior é 27.5 °C / 82 F, em comparação com a média do dispositivo de 33.9 °C / ### class_avg_f### F.
(±) Jogando The Witcher 3, a temperatura média para o lado superior é 37.2 °C / 99 F, em comparação com a média do dispositivo de 33.9 °C / ## #class_avg_f### F.
(+) Os apoios para as mãos e o touchpad são mais frios que a temperatura da pele, com um máximo de 27.4 °C / 81.3 F e, portanto, são frios ao toque.
(±) A temperatura média da área do apoio para as mãos de dispositivos semelhantes foi 28.8 °C / 83.8 F (+1.4 °C / 2.5 F).
Alienware 17 R4 análise de áudio
(±) | o volume do alto-falante é médio, mas bom (###valor### dB)
Graves 100 - 315Hz
(-) | quase nenhum baixo - em média 15.3% menor que a mediana
(±) | a linearidade dos graves é média (9.6% delta para a frequência anterior)
Médios 400 - 2.000 Hz
(±) | médios mais altos - em média 5.5% maior que a mediana
(±) | a linearidade dos médios é média (8.9% delta para frequência anterior)
Altos 2 - 16 kHz
(±) | máximos mais altos - em média 5.1% maior que a mediana
(±) | a linearidade dos máximos é média (9.7% delta para frequência anterior)
Geral 100 - 16.000 Hz
(±) | a linearidade do som geral é média (22.4% diferença em relação à mediana)
Comparado com a mesma classe
» 80% de todos os dispositivos testados nesta classe foram melhores, 6% semelhantes, 14% piores
» O melhor teve um delta de 6%, a média foi 18%, o pior foi 132%
Comparado com todos os dispositivos testados
» 66% de todos os dispositivos testados foram melhores, 6% semelhantes, 29% piores
» O melhor teve um delta de 4%, a média foi 23%, o pior foi 134%
Apple MacBook 12 (Early 2016) 1.1 GHz análise de áudio
(+) | os alto-falantes podem tocar relativamente alto (###valor### dB)
Graves 100 - 315Hz
(±) | graves reduzidos - em média 11.3% menor que a mediana
(±) | a linearidade dos graves é média (14.2% delta para a frequência anterior)
Médios 400 - 2.000 Hz
(+) | médios equilibrados - apenas 2.4% longe da mediana
(+) | médios são lineares (5.5% delta para frequência anterior)
Altos 2 - 16 kHz
(+) | agudos equilibrados - apenas 2% longe da mediana
(+) | os máximos são lineares (4.5% delta da frequência anterior)
Geral 100 - 16.000 Hz
(+) | o som geral é linear (10.2% diferença em relação à mediana)
Comparado com a mesma classe
» 7% de todos os dispositivos testados nesta classe foram melhores, 2% semelhantes, 90% piores
» O melhor teve um delta de 5%, a média foi 18%, o pior foi 53%
Comparado com todos os dispositivos testados
» 5% de todos os dispositivos testados foram melhores, 1% semelhantes, 94% piores
» O melhor teve um delta de 4%, a média foi 23%, o pior foi 134%
| desligado | |
| Ocioso | |
| Carga |
|
Key:
min: | |
| Alienware 17 R4 i7-7820HK, GeForce GTX 1080 Mobile, SK Hynix PC300 NVMe 512 GB, TN LED, 2560x1440, 17.3" | Alienware 17 R3 (A17-9935) 6700HQ, GeForce GTX 980M, Samsung PM951 NVMe 512 GB, IPS, 1920x1080, 17.3" | MSI GT73VR 7RF-296 i7-7820HK, GeForce GTX 1080 Mobile, 2x Samsung SM951 MZVPV256HDGL (RAID 0), TN LED, 1920x1080, 17.3" | Acer Predator 17 X GX-792-76DL i7-7820HK, GeForce GTX 1080 Mobile, Toshiba NVMe THNSN5512GPU7, IPS, 1920x1080, 17.3" | Aorus X7 DT v6 6820HK, GeForce GTX 1080 Mobile, Samsung SM951 MZVPV512HDGL m.2 PCI-e, TN LED, 2560x1440, 17.3" | |
|---|---|---|---|---|---|
| Power Consumption | 41% | 7% | 12% | -5% | |
| Idle Minimum * (Watt) | 37.5 | 12 68% | 29 23% | 27 28% | 31.5 16% |
| Idle Average * (Watt) | 37.6 | 18 52% | 35 7% | 32 15% | 33.9 10% |
| Idle Maximum * (Watt) | 37.6 | 26 31% | 40 -6% | 41 -9% | 34.6 8% |
| Load Average * (Watt) | 122.4 | 95 22% | 94 23% | 102 17% | 205.6 -68% |
| Witcher 3 ultra * (Watt) | 180.3 | ||||
| Load Maximum * (Watt) | 277.4 | 188 32% | 315 -14% | 248 11% | 250.8 10% |
* ... menor é melhor
| Alienware 17 R4 i7-7820HK, GeForce GTX 1080 Mobile, 99 Wh | Alienware 17 R3 (A17-9935) 6700HQ, GeForce GTX 980M, 92 Wh | MSI GT73VR 7RF-296 i7-7820HK, GeForce GTX 1080 Mobile, 75.2 Wh | Acer Predator 17 X GX-792-76DL i7-7820HK, GeForce GTX 1080 Mobile, 88.8 Wh | Aorus X7 DT v6 6820HK, GeForce GTX 1080 Mobile, 94 Wh | |
|---|---|---|---|---|---|
| Duração da bateria | 124% | -10% | 26% | -7% | |
| Reader / Idle (h) | 4.6 | 12.6 174% | 5.2 13% | 3 -35% | |
| WiFi v1.3 (h) | 3 | 7.4 147% | 2.7 -10% | 4.2 40% | 2.4 -20% |
| Load (h) | 1.2 | 1.8 50% | 1.5 25% | 1.6 33% |
Pro
Contra
Verdict
Nós veneramos a série Alienware 17 por seus altos padrões de qualidade que, felizmente, permanecem impassíveis nesta última iteração. Um portátil é muito mais do que apenas a configuração de CPU e GPU, também o esqueleto e o design que fortalecem o hardware principal. Neste nível, torna-se mais fácil recomendar o Alienware mais recente sobre um Aorus de 17 polegadas ou um MSI GT72 mais antigo.
Começamos a ver alguns problemas no nível de configuração mais alto. Nossa unidade de teste particular está equipada com a CPU e a GPU mais rápidas disponíveis no atual 17 R4 e o chassi apenas pode aguentar esses processadores de forma confiável nas velocidades Boost. Sim, a CPU e a GPU não sofrerão de afogamentos quando sob cargas extremas, mas as temperaturas do núcleo podem atingir 90 C ou mais, durante os jogos, apesar de que as ventoinhas funcionam o tempo todo com até 50 dB(A). Este é o lugar onde os sistemas de jogos mais grossos, com soluções de resfriamento mais desenvolvidas como o MSI GT73VR ou o Acer Predator 17 X são superiores lidando com temperaturas e/ou ruído.
As descobertas anteriores, e o fato de que uma porta amplificadora de gráficos esteja presente, dão um motivo mais atraente para comprar um SKU 17 R4 SKU de gama baixa, com gráficos GTX 1050 Ti ou GTX 1060. Há uma grande chance de que os requerimentos de TDP significantemente mais baixos destas GPUs resultarão em ventoinhas mais silenciosas, temperaturas mais baixas, durações de bateria mais longas, ou, possivelmente, as três coisas. Então, os usuários que posam demandar um poder gráfico mais veloz, podem simplesmente usar a porta Amplificadora de Gráficos para títulos futuros. Este é um truque que a série Alienware tem na manga, contra a maioria dos concorrentes e estes SKUs de gama inferior definitivamente merecem o nosso teste de desempenho pleno para entender todo o alcance da série 17 R4.
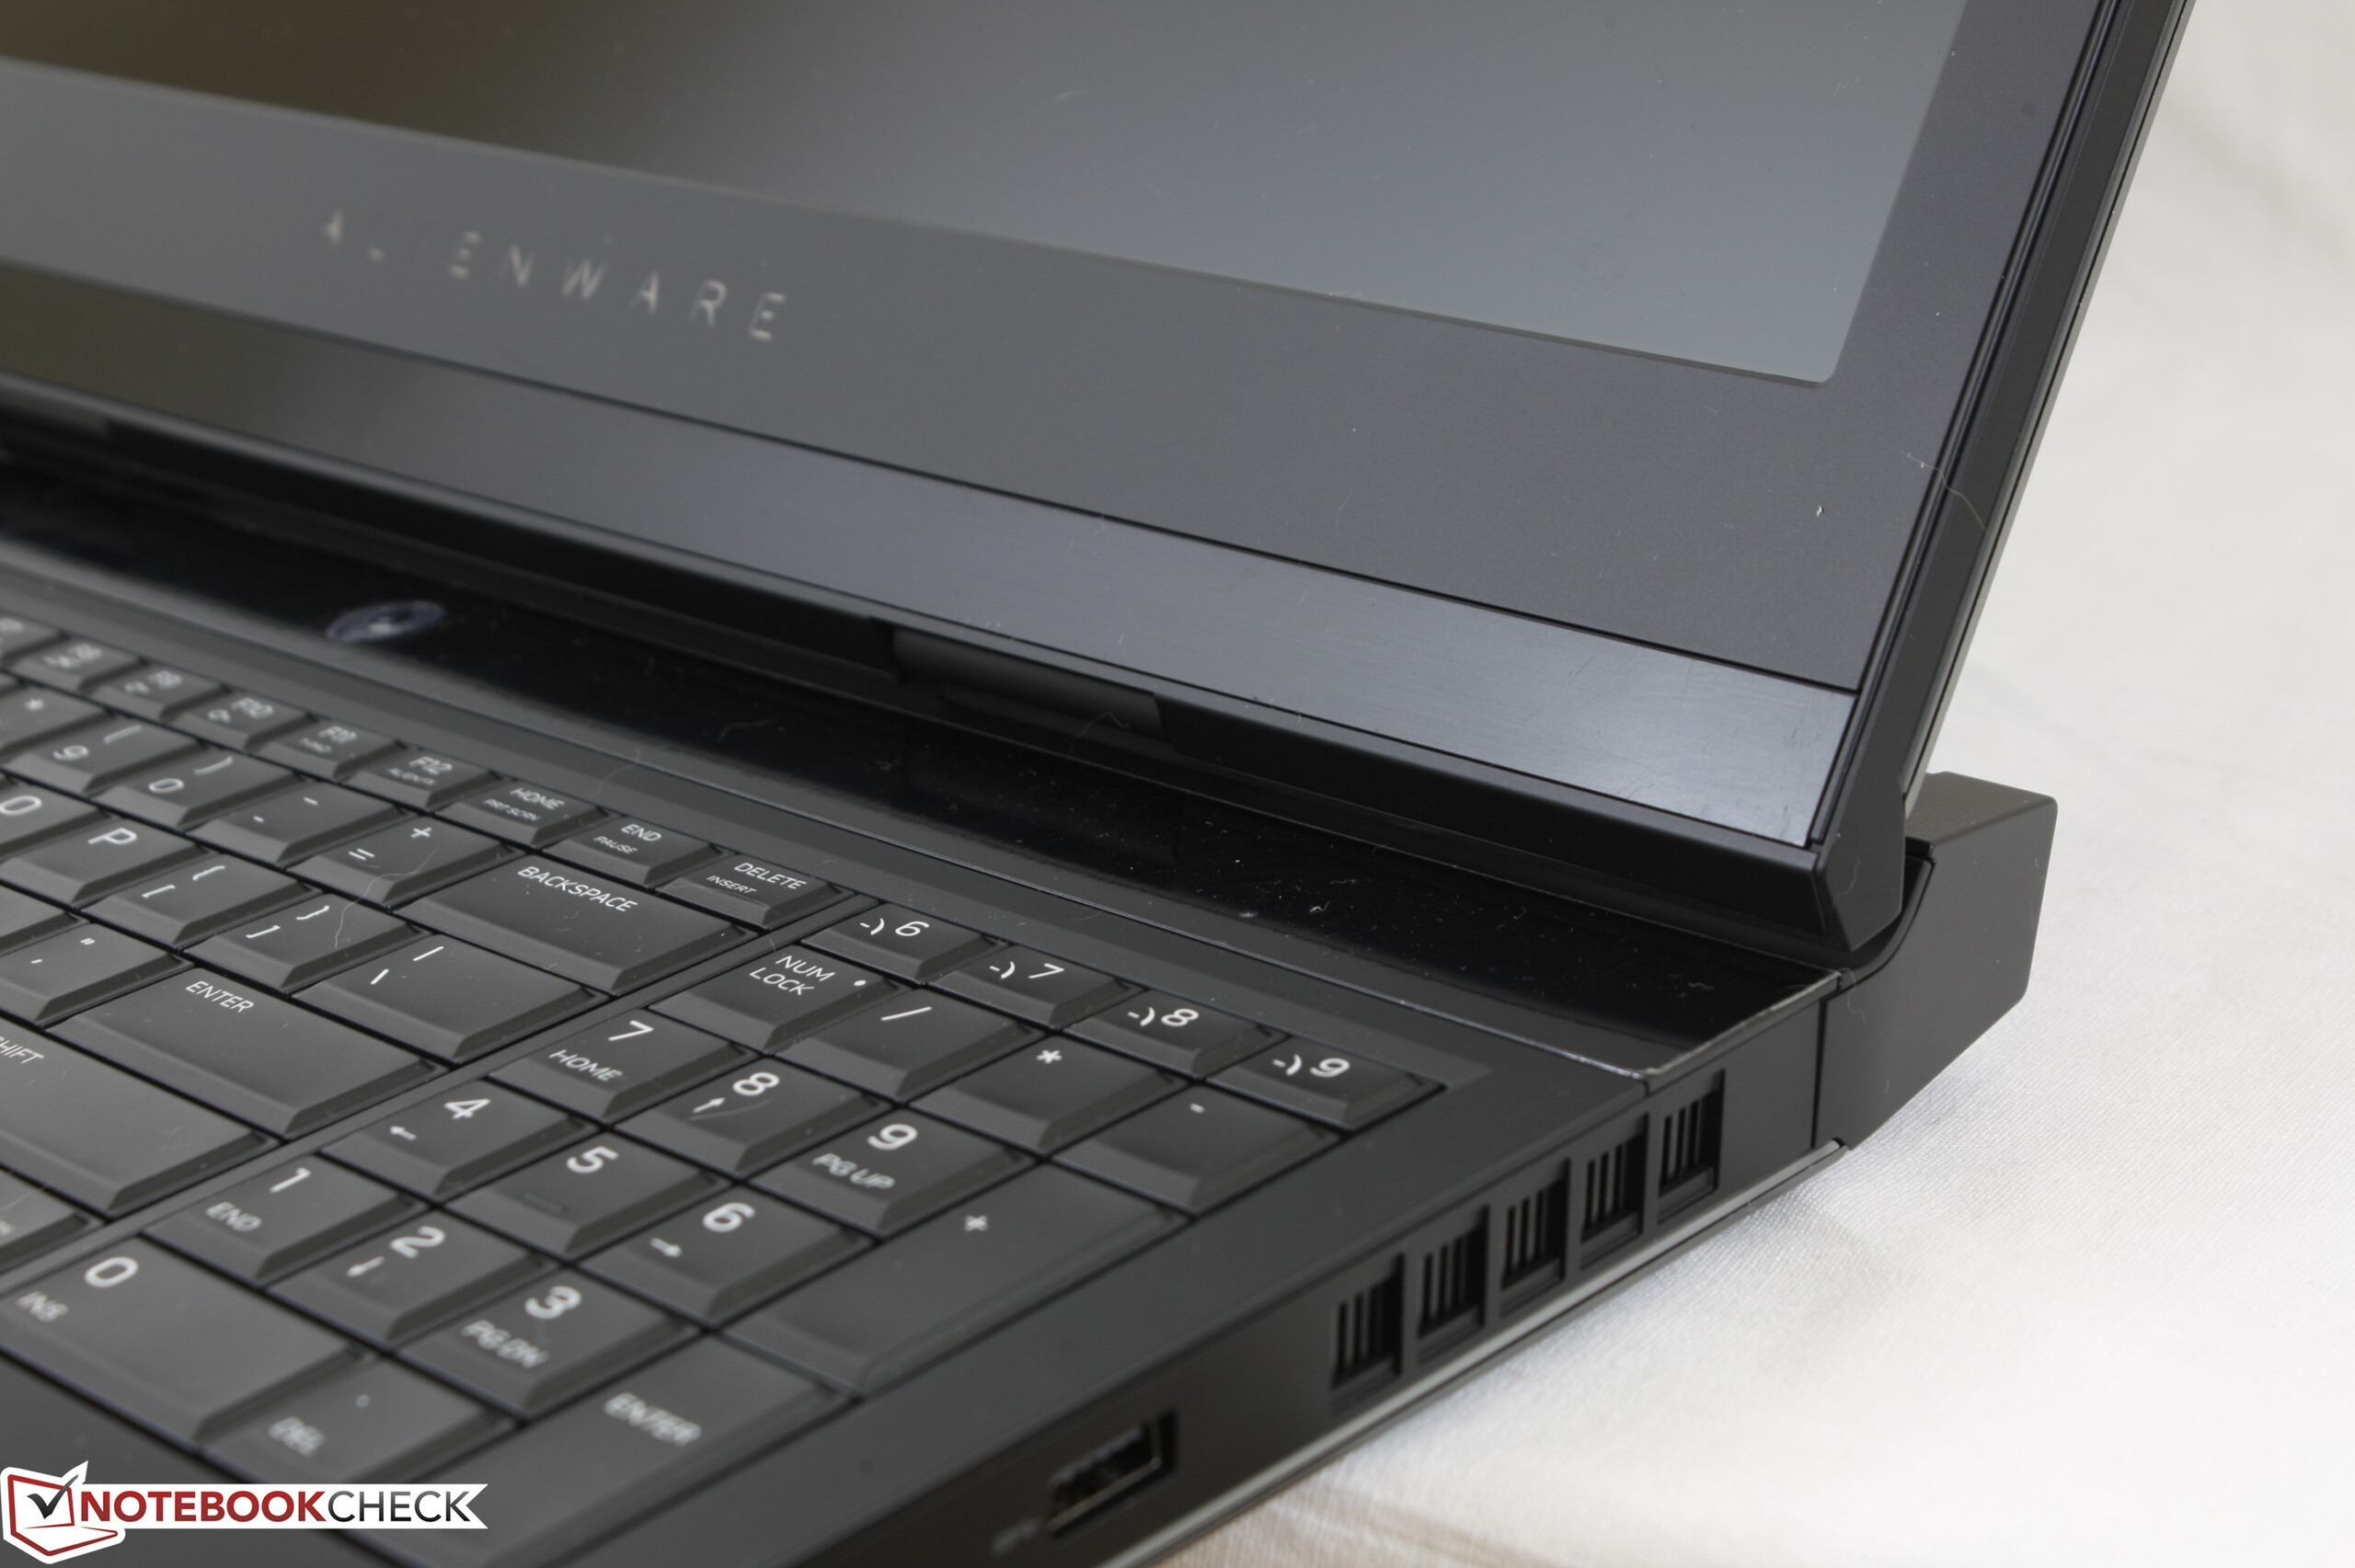
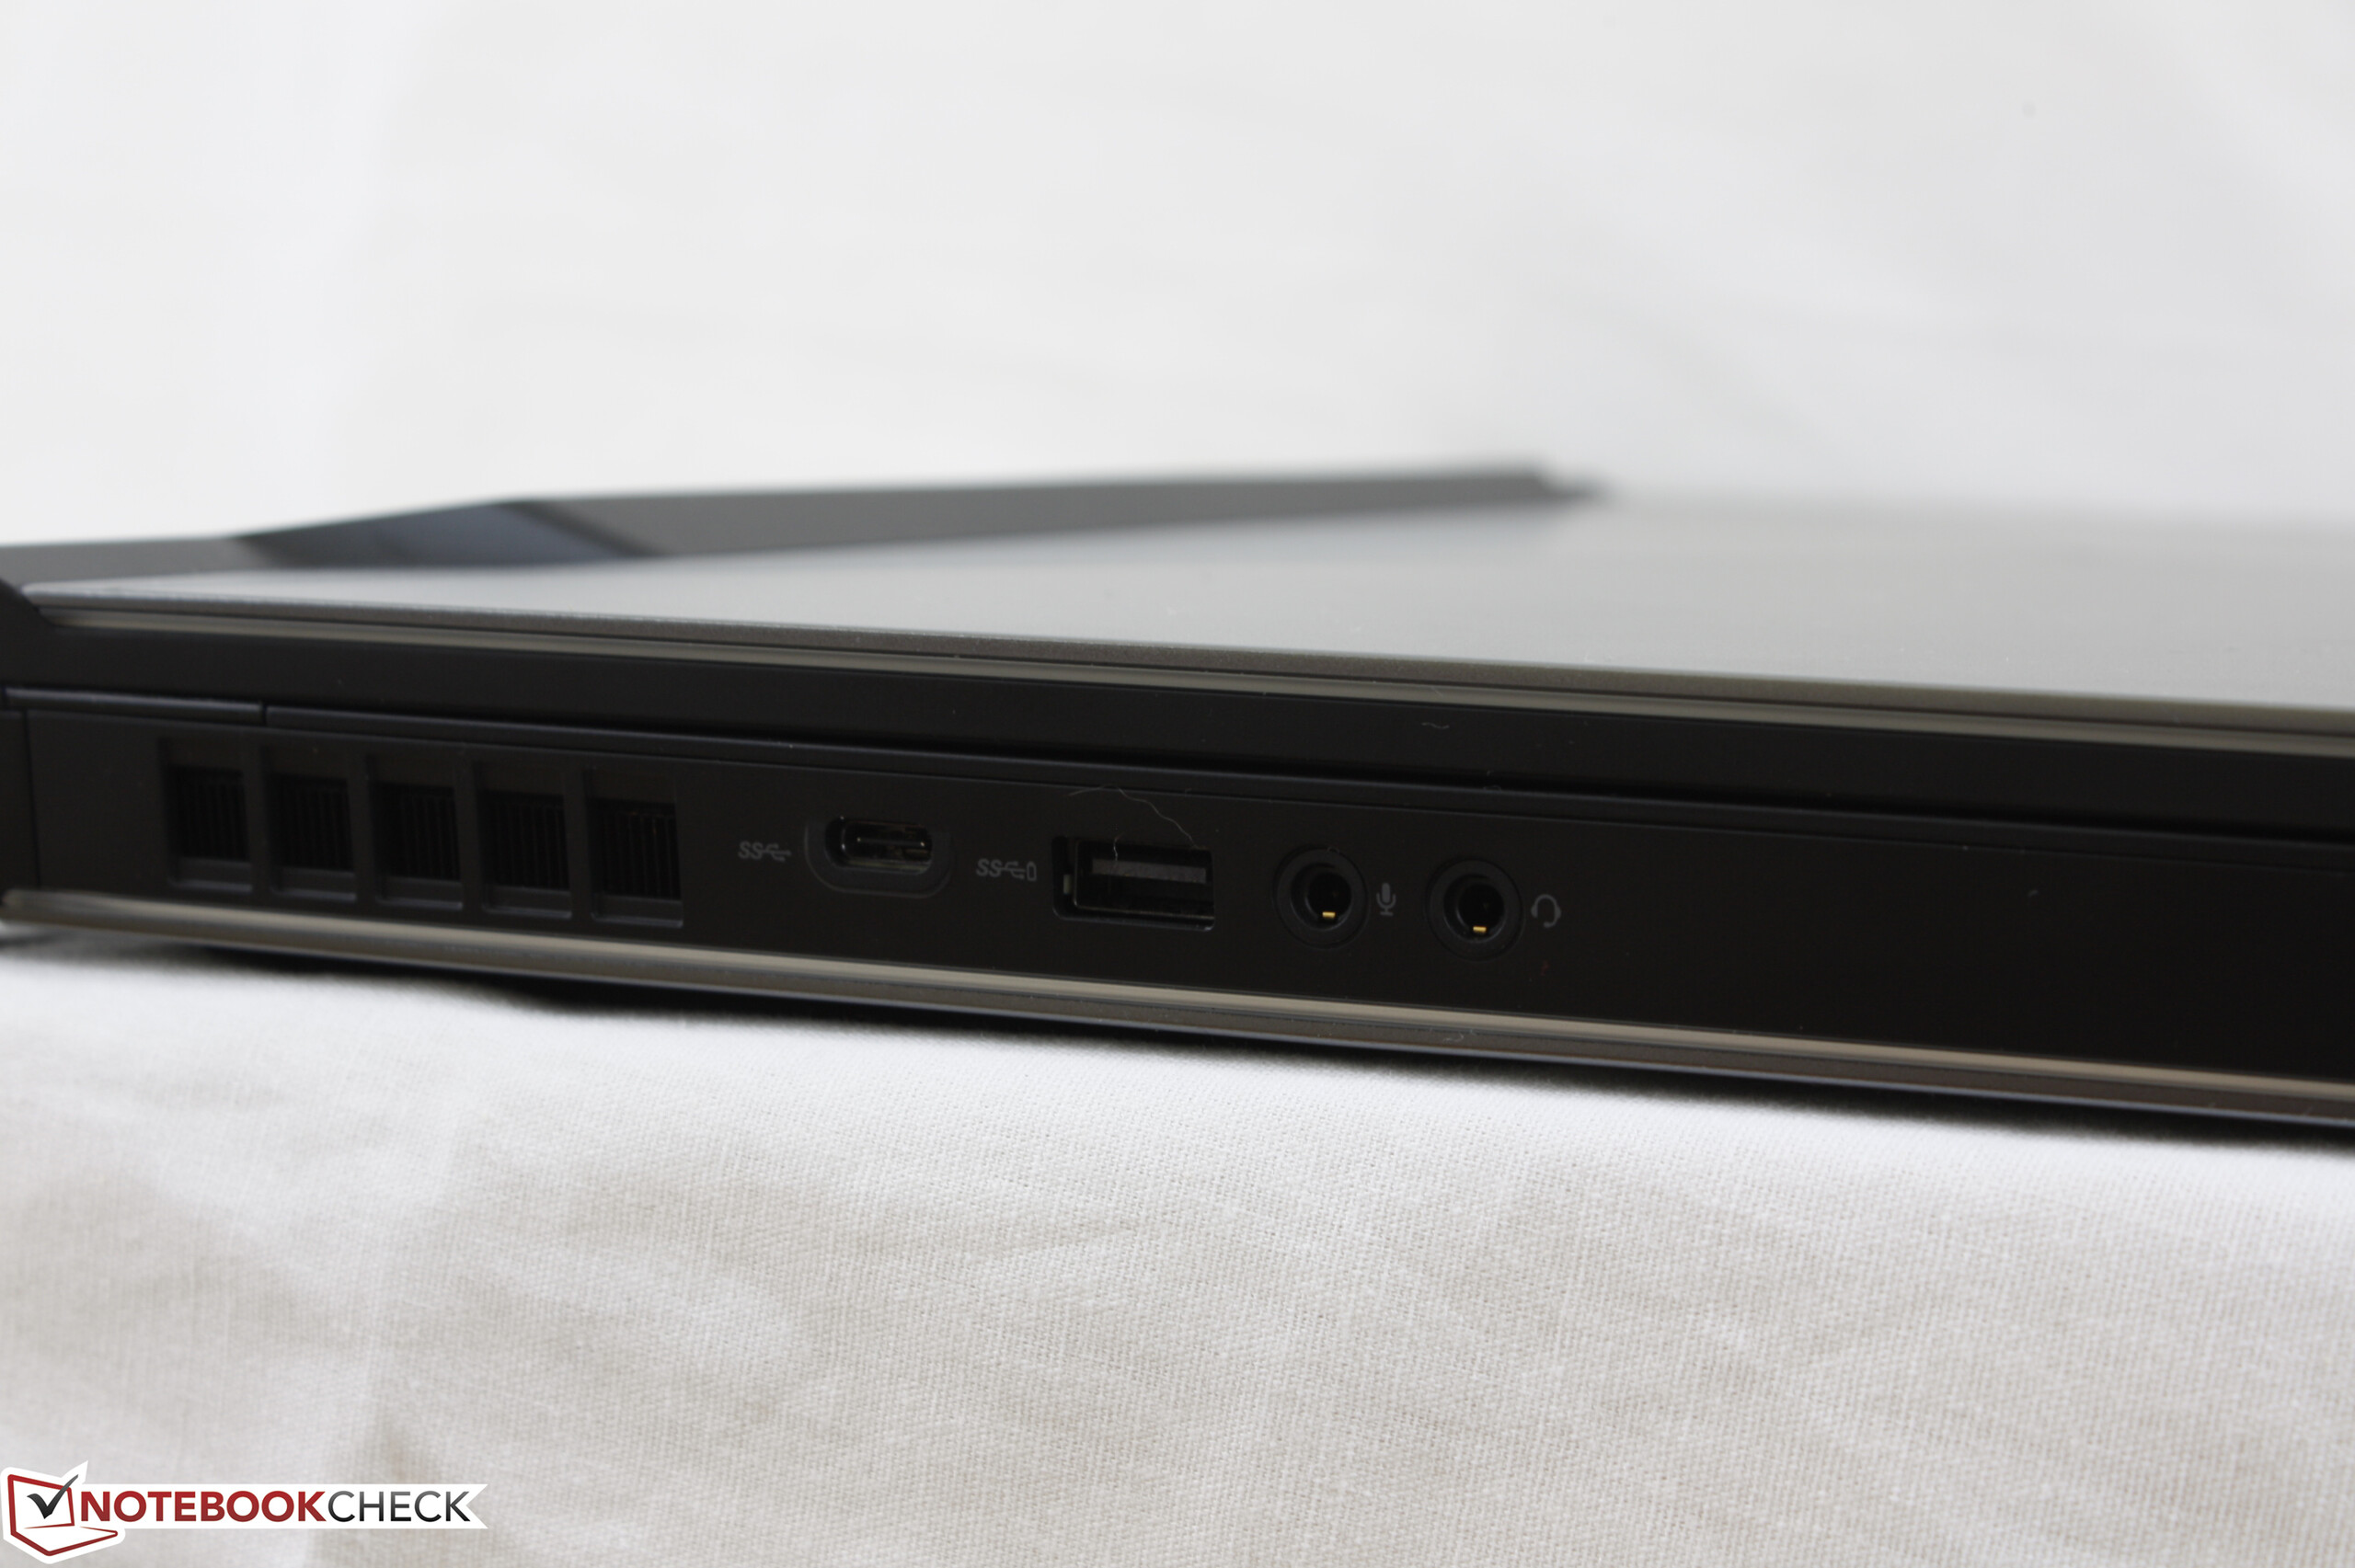
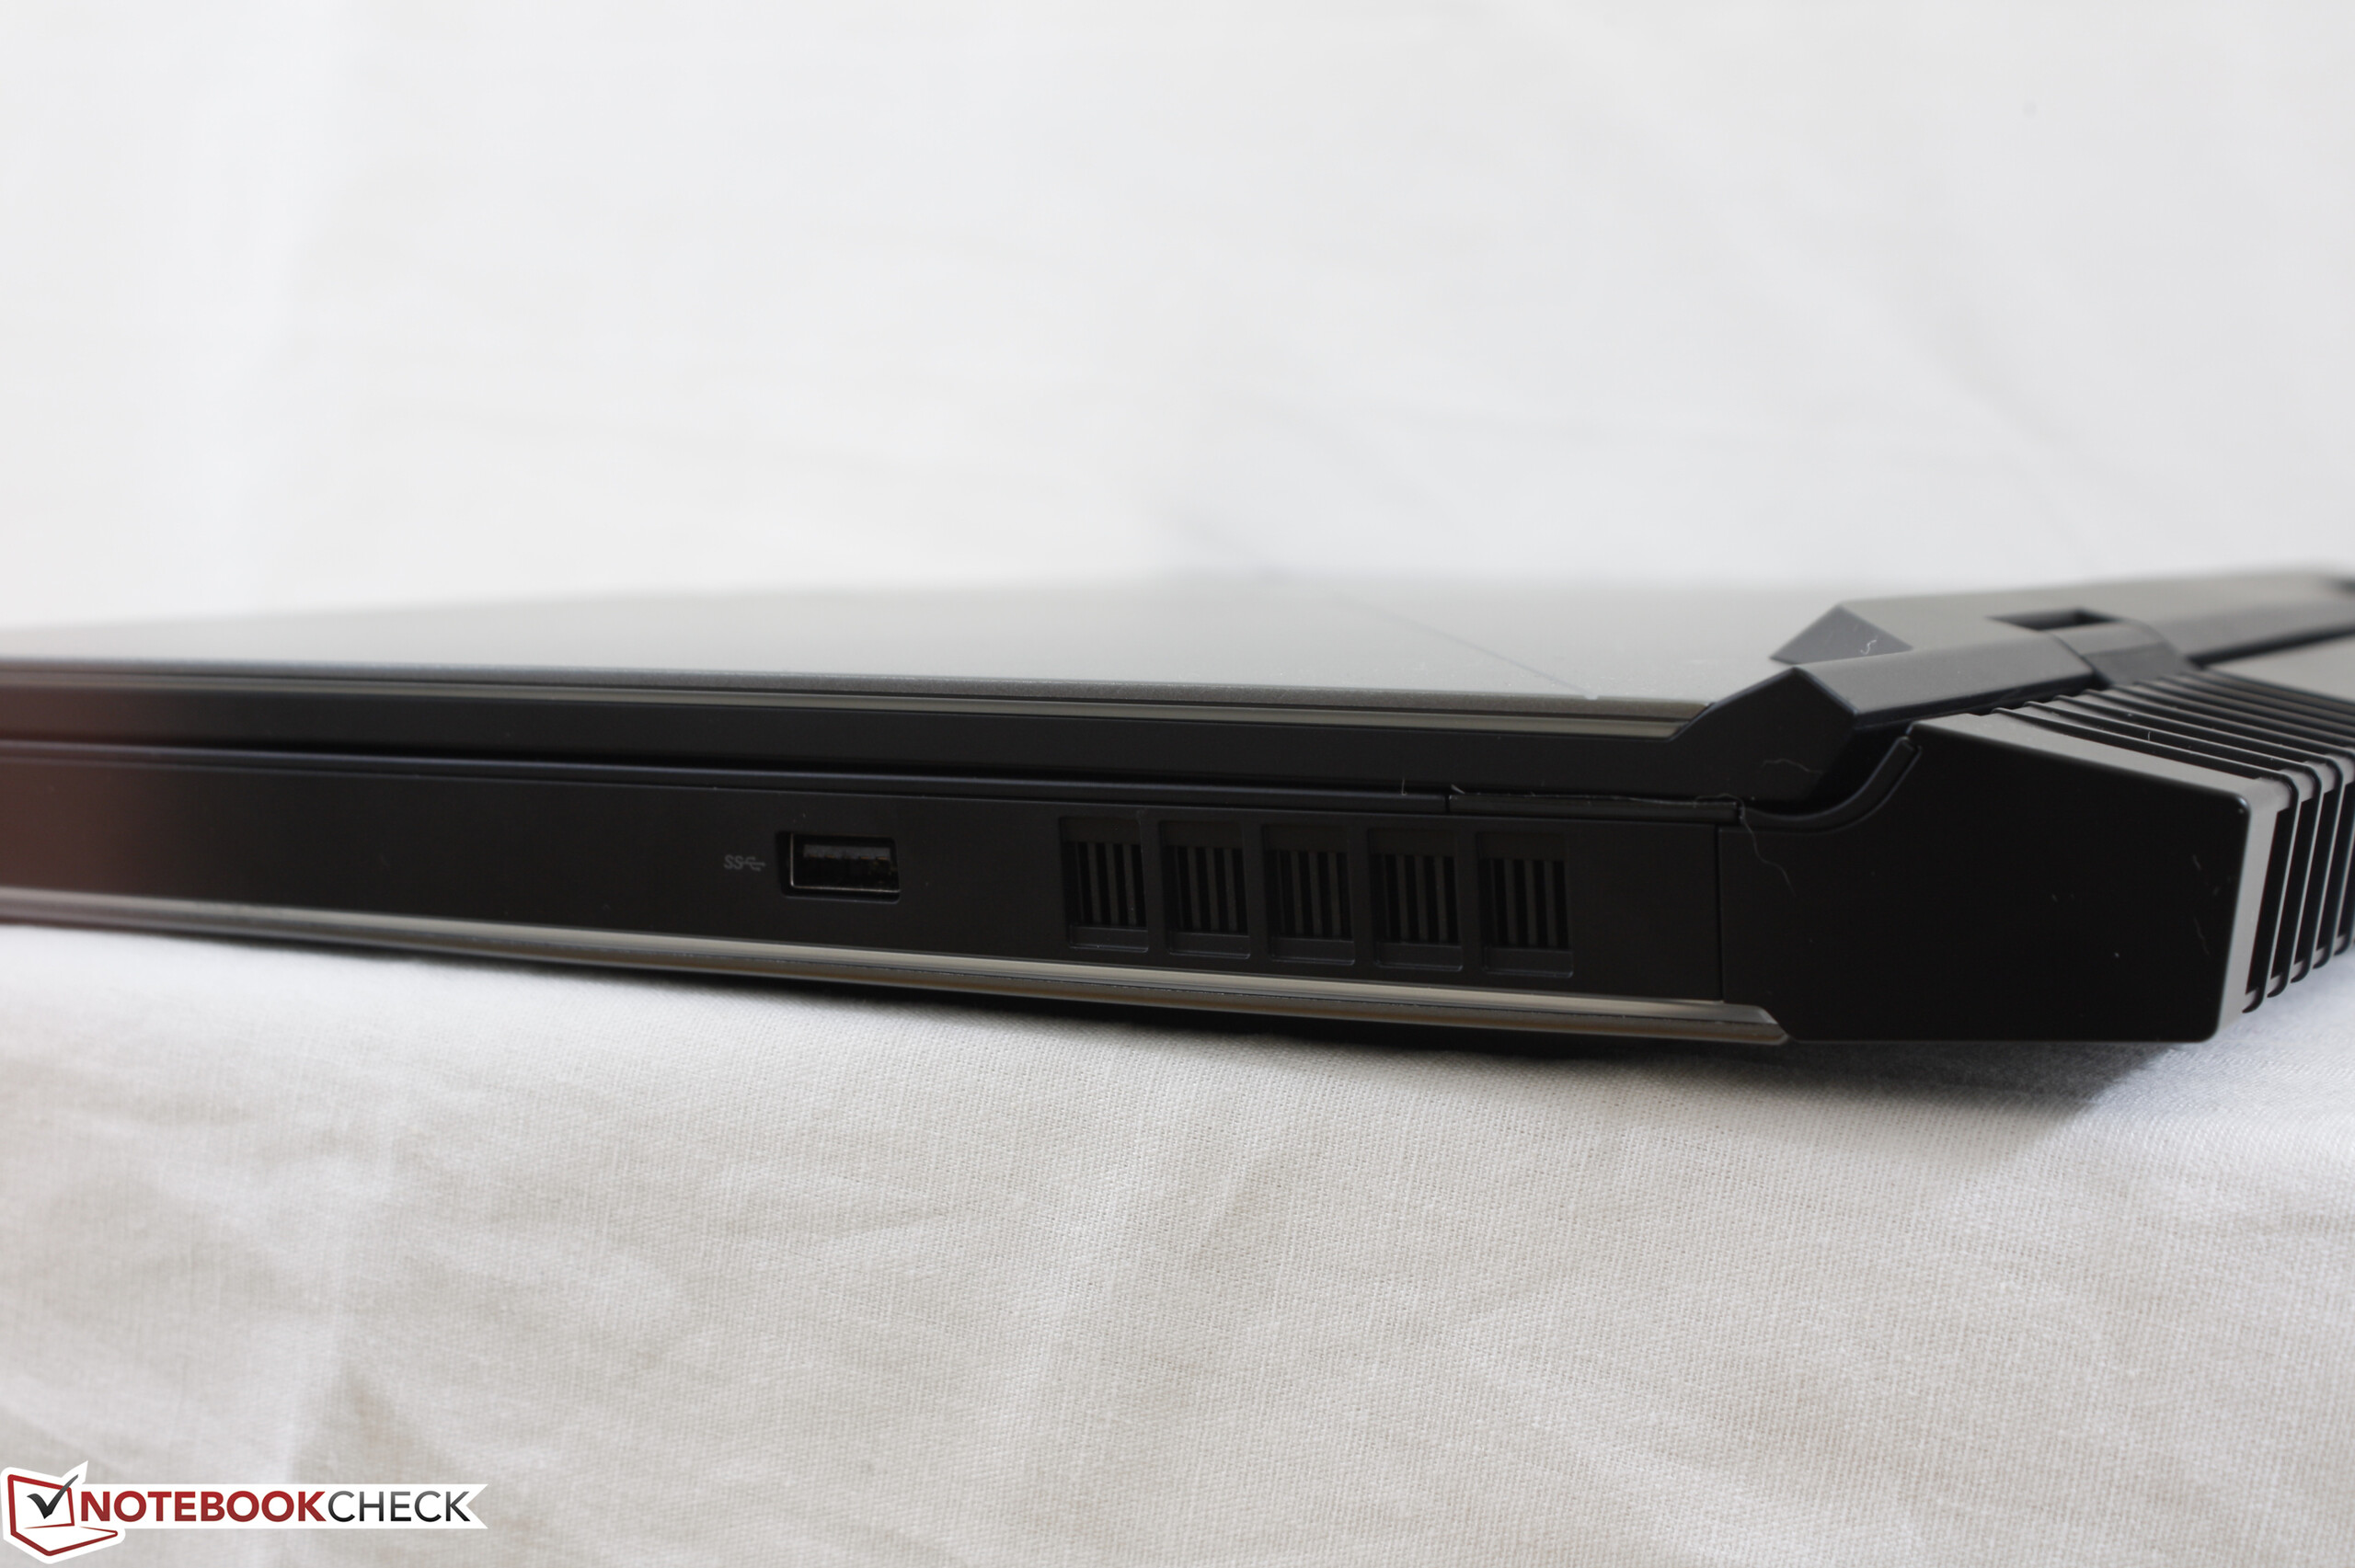
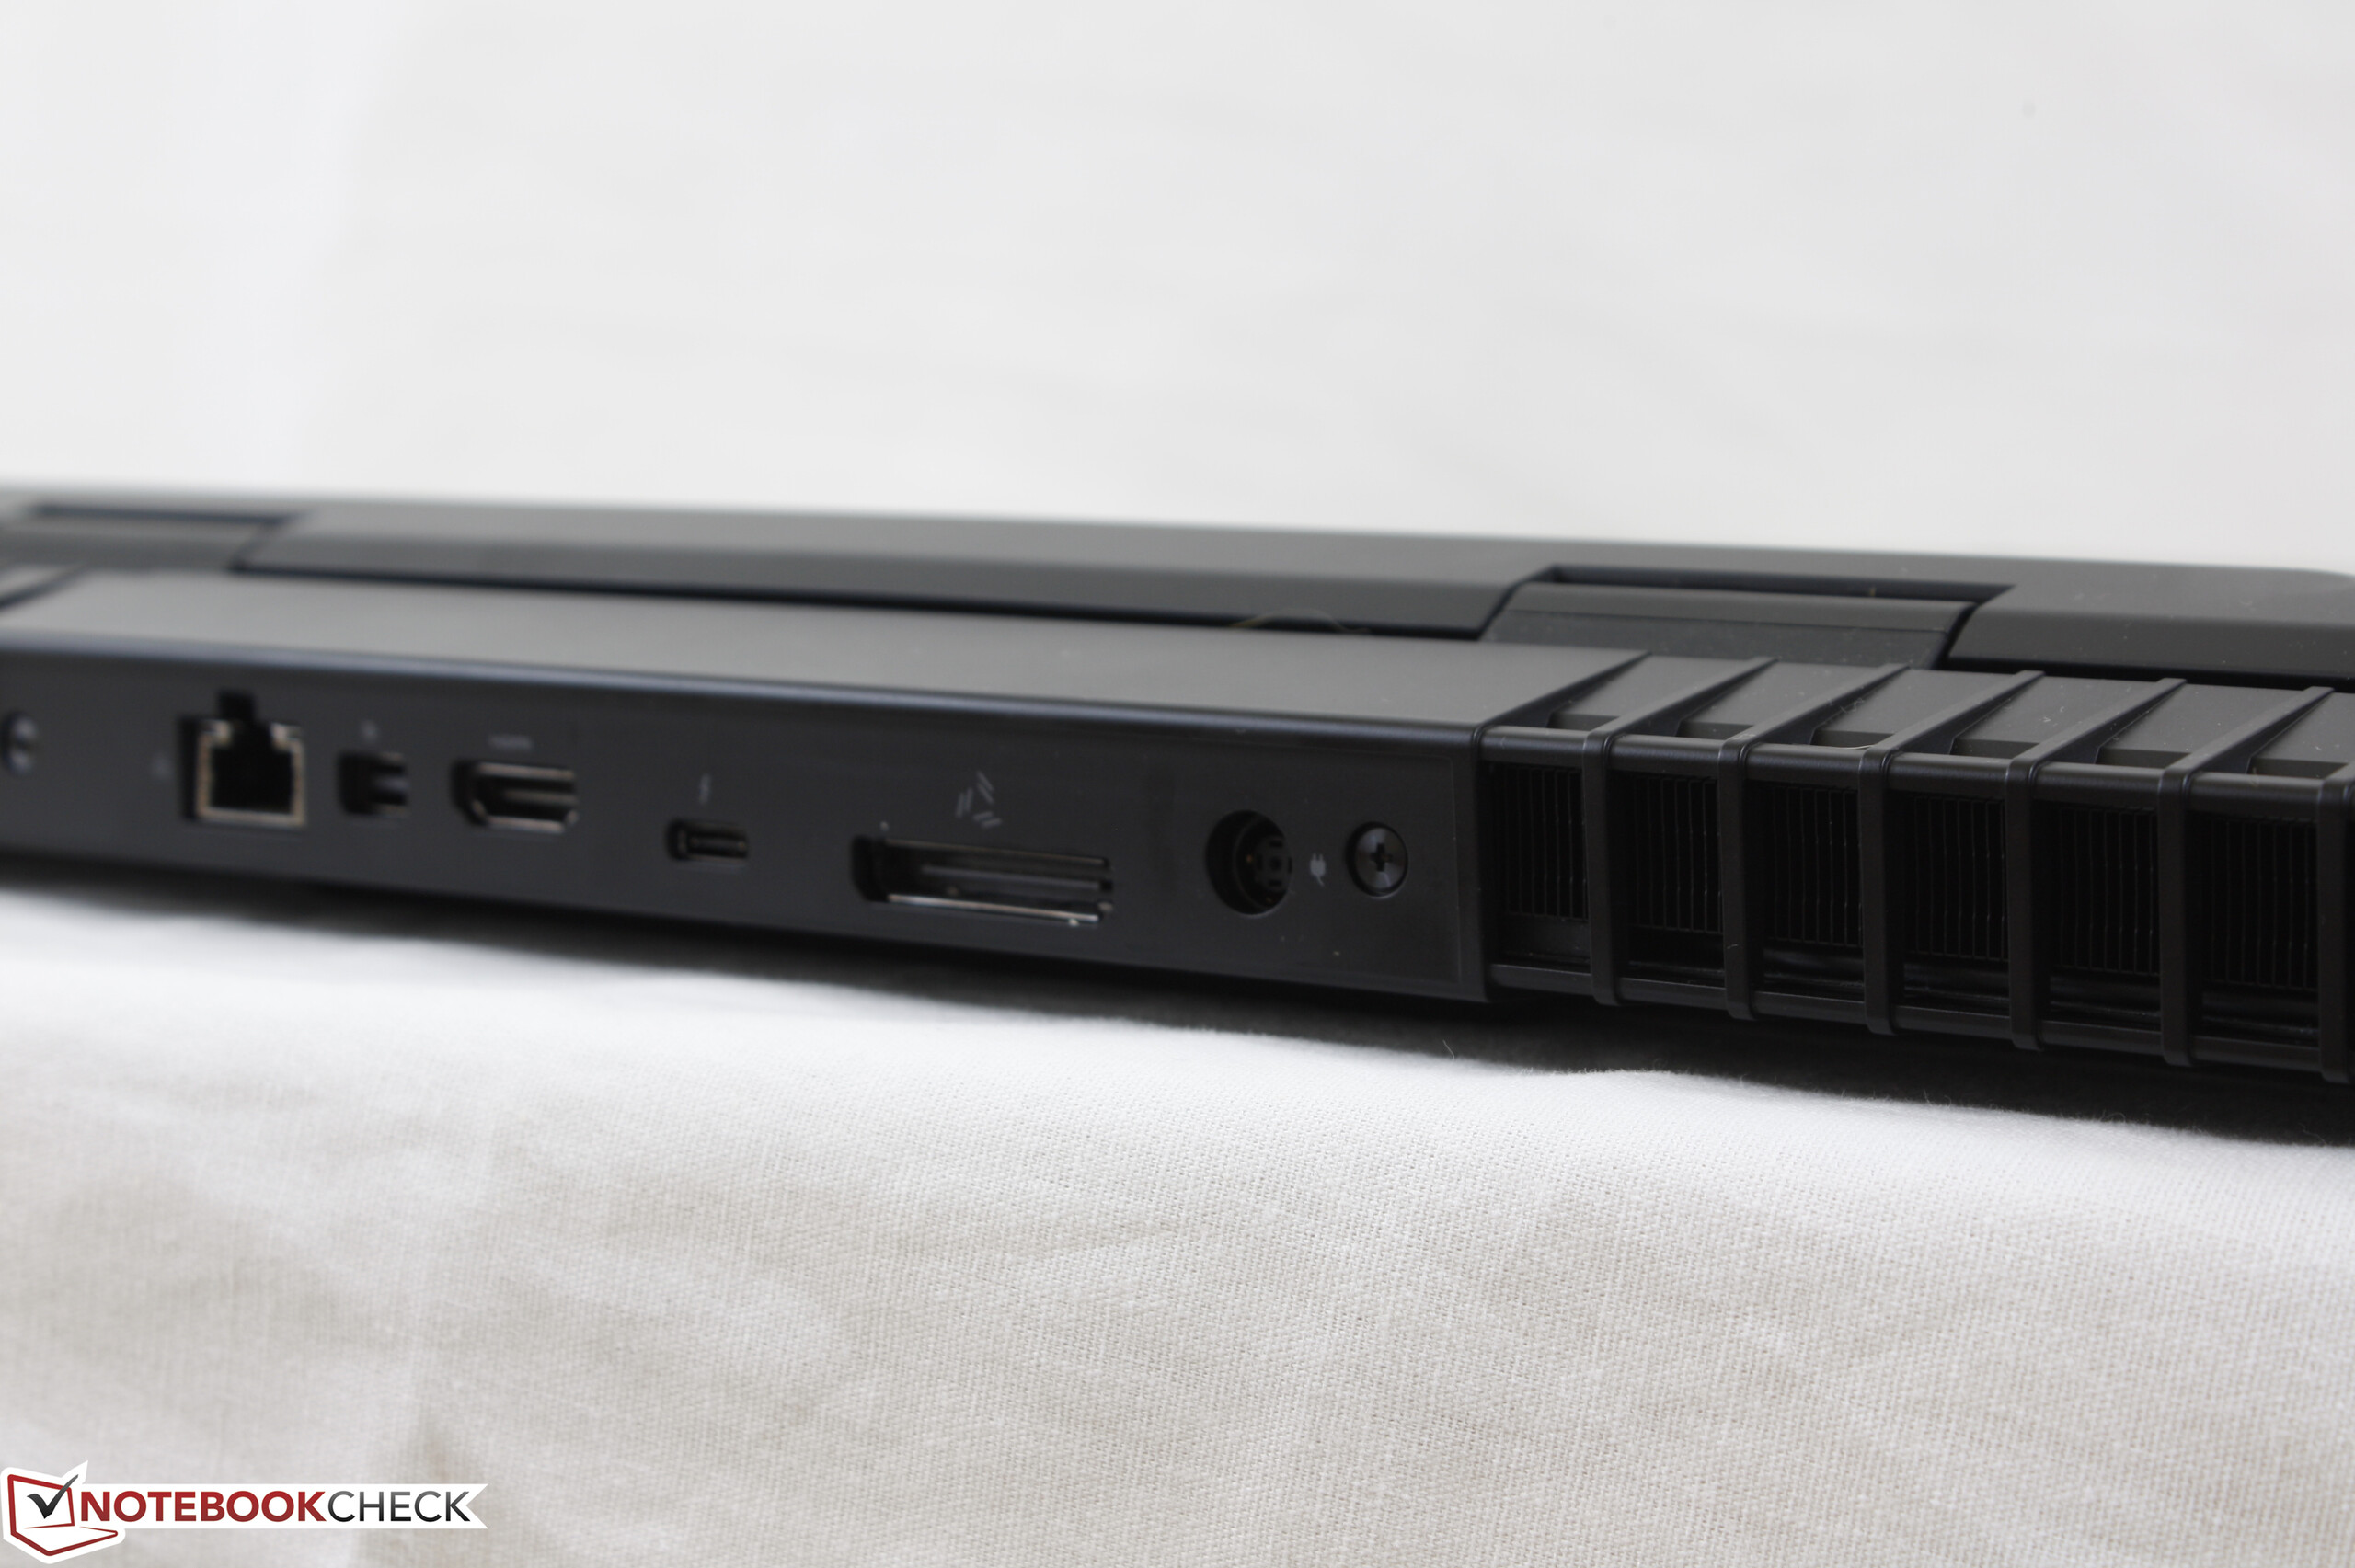
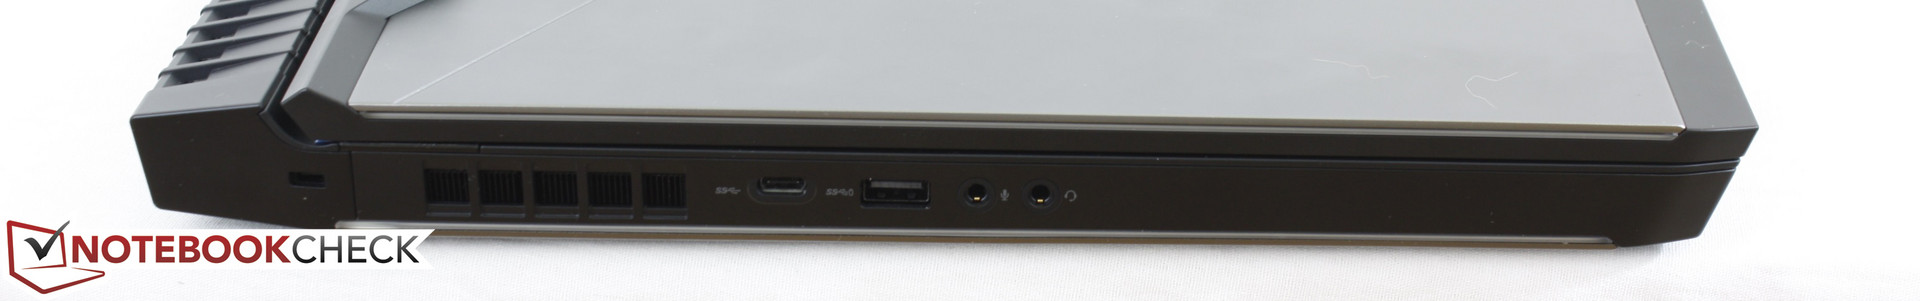
Além destas bandeiras vermelhas no desempenho, não há muito do que reclamar sobre o resto do portátil. Uma gama de recursos mais ampla, assim como teclas iluminadas individualmente, não fariam mal. Mais portas USB Type-A, e um leitor de cartões SD integrado, no entanto, sua omissão não é o fim do mundo. Os gamers interessados na porta Amplificadora de Gráficos e no forte design do chassi descobrirão que os SKUs de nível de entrada são uma opção que vale a pena considerar. De outra forma, existem sistemas mais silenciosos (e mais grossos) para usuários que desejam uma configuração com a GPU GTX 1080.
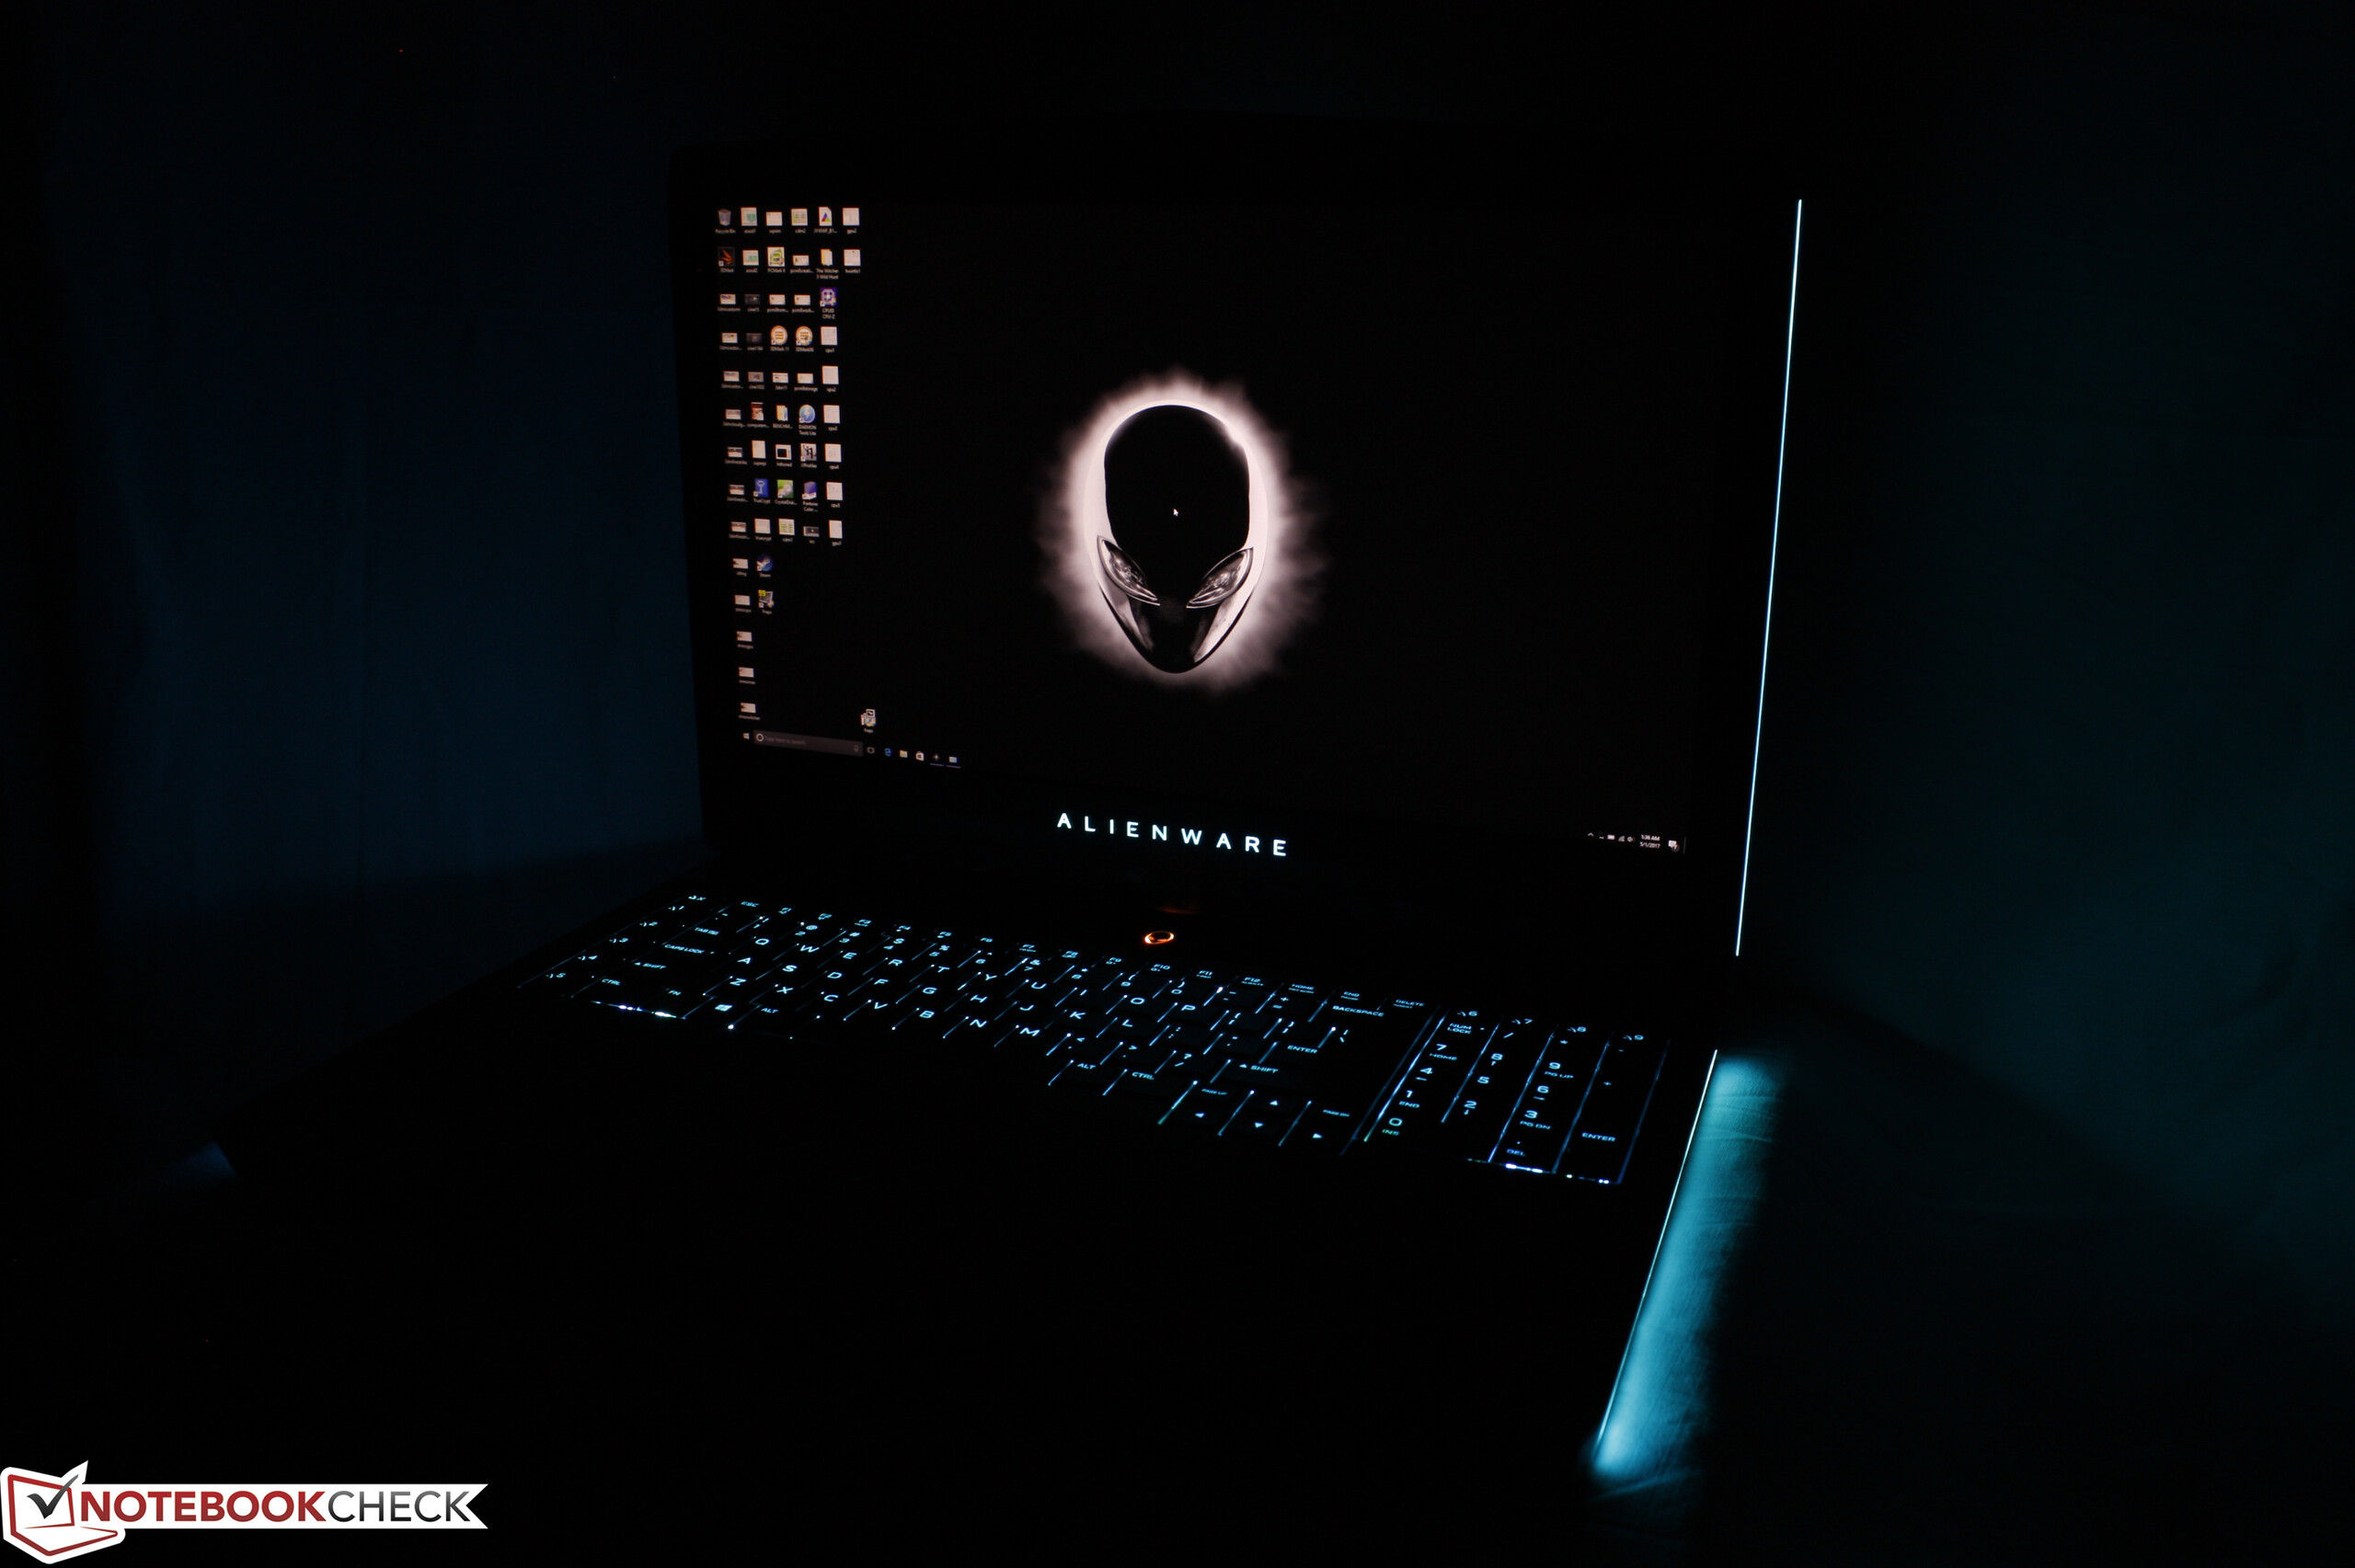
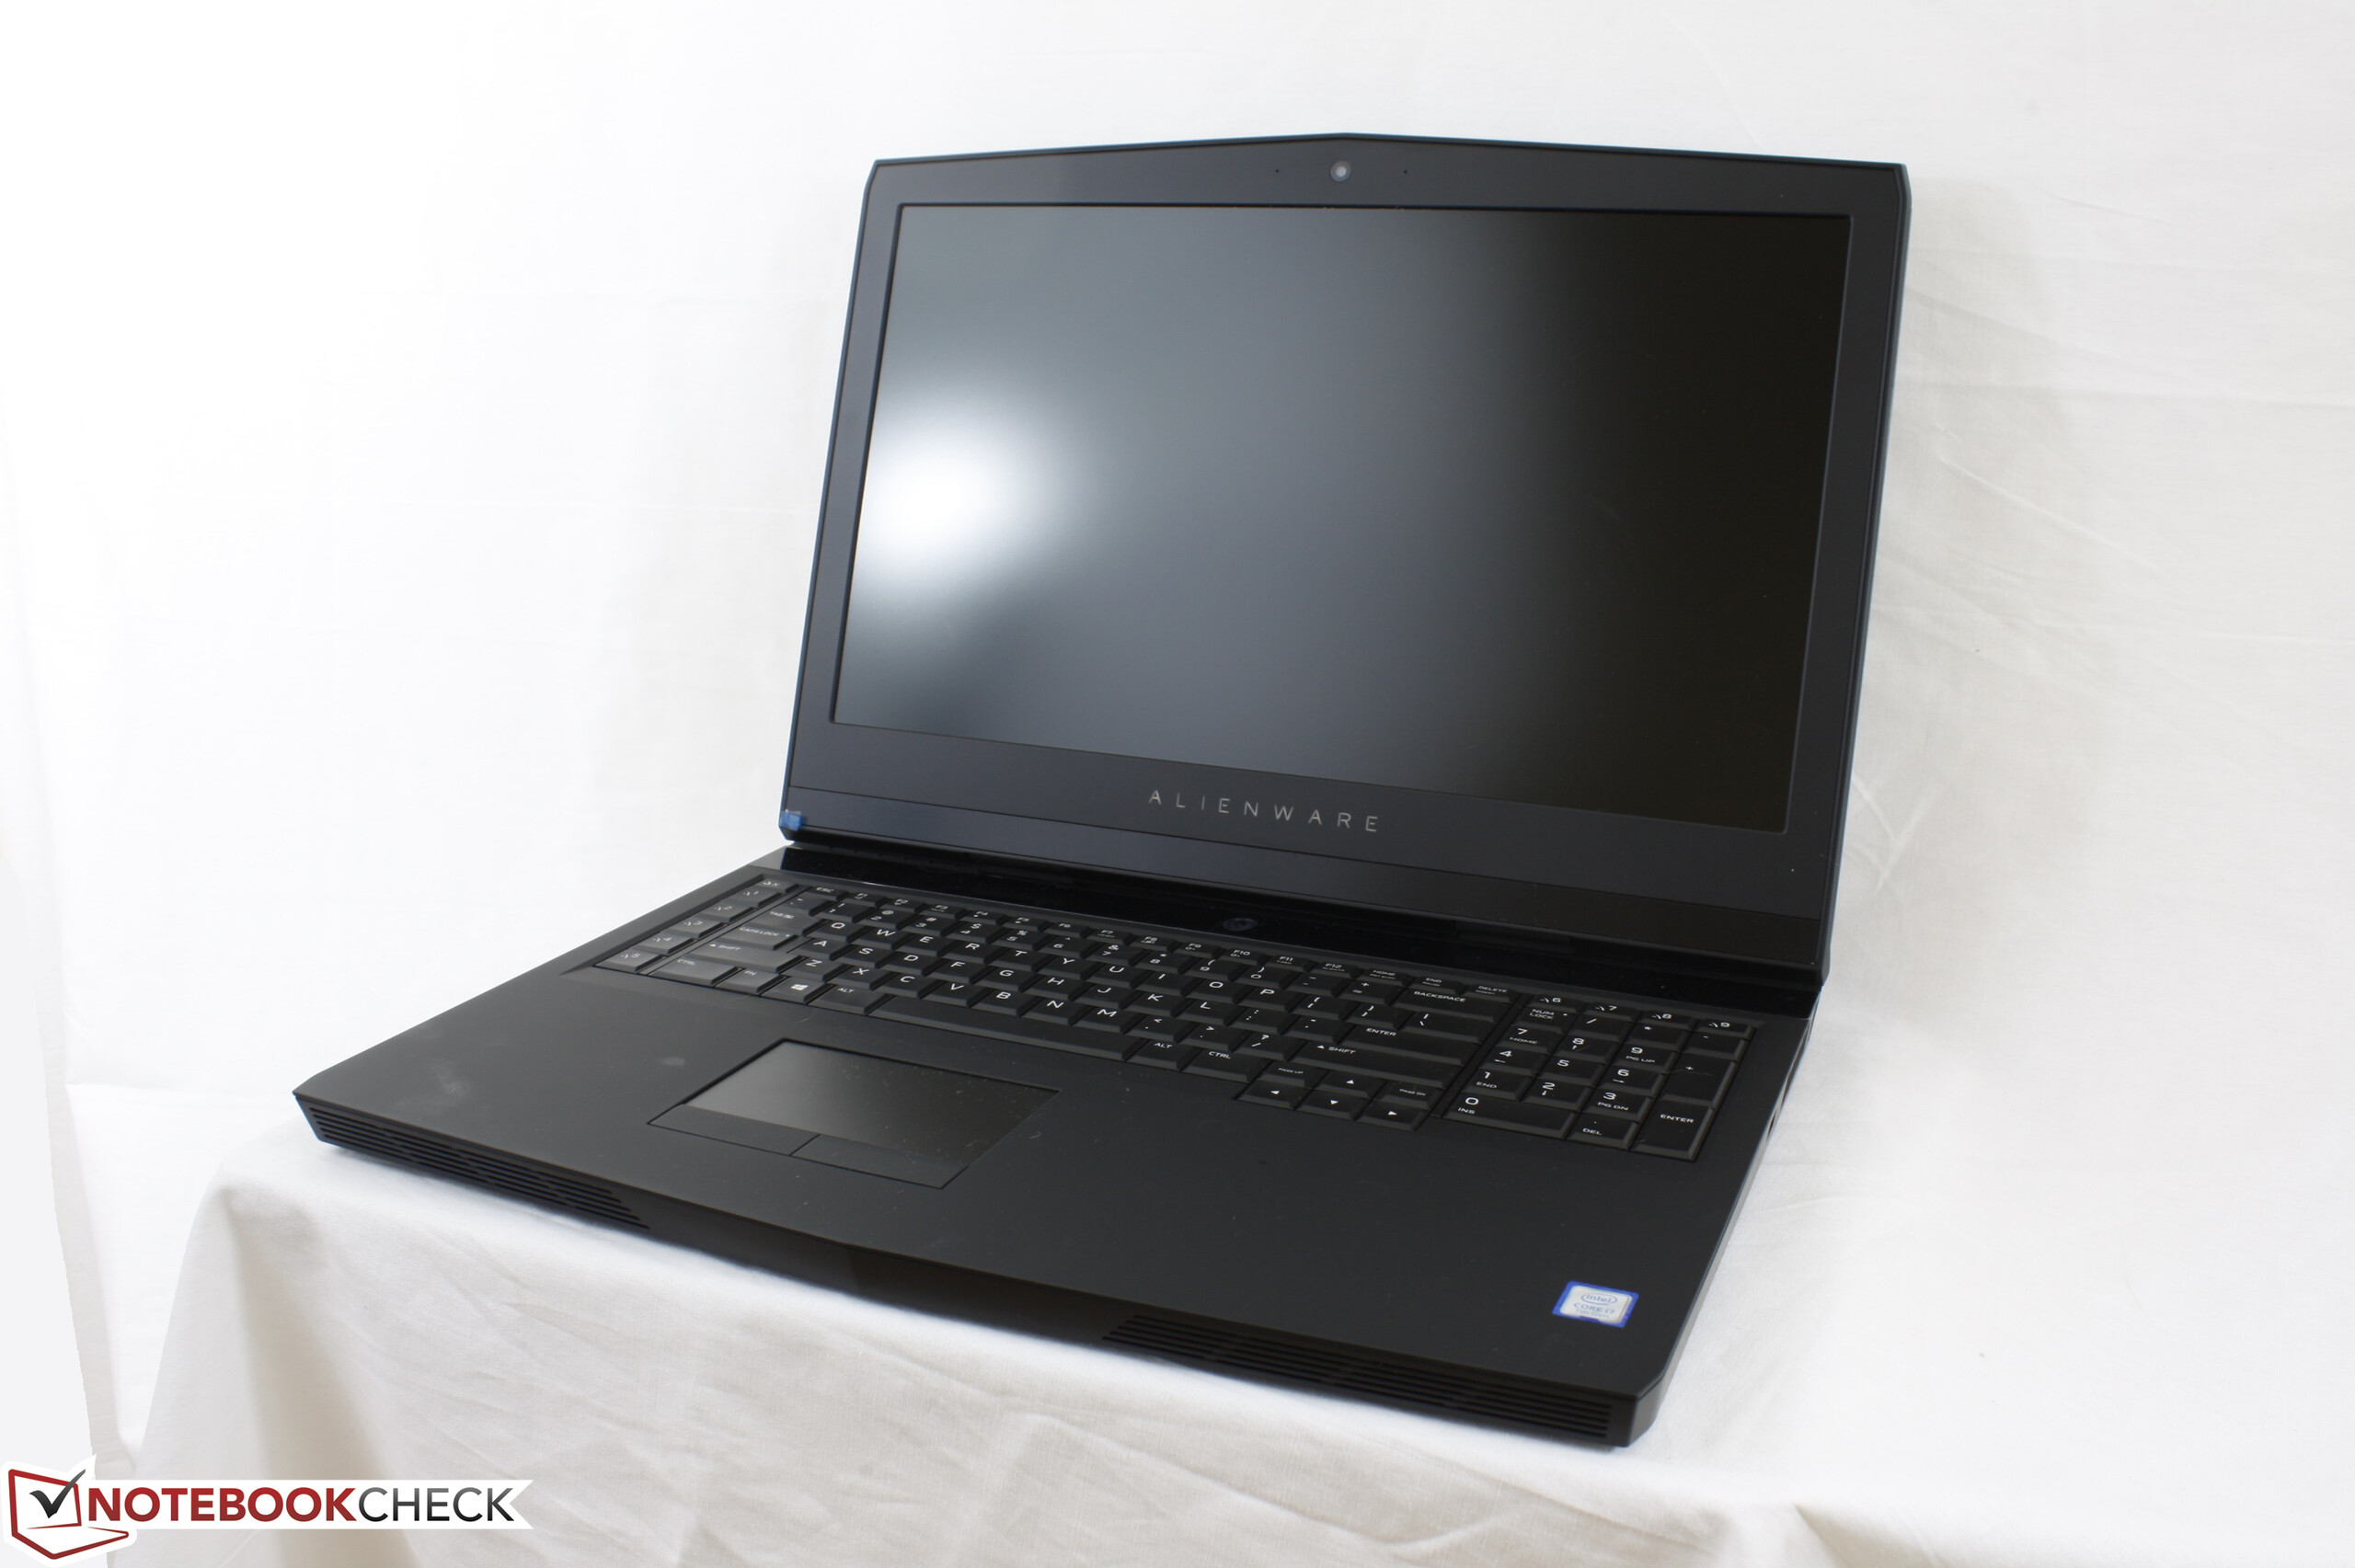
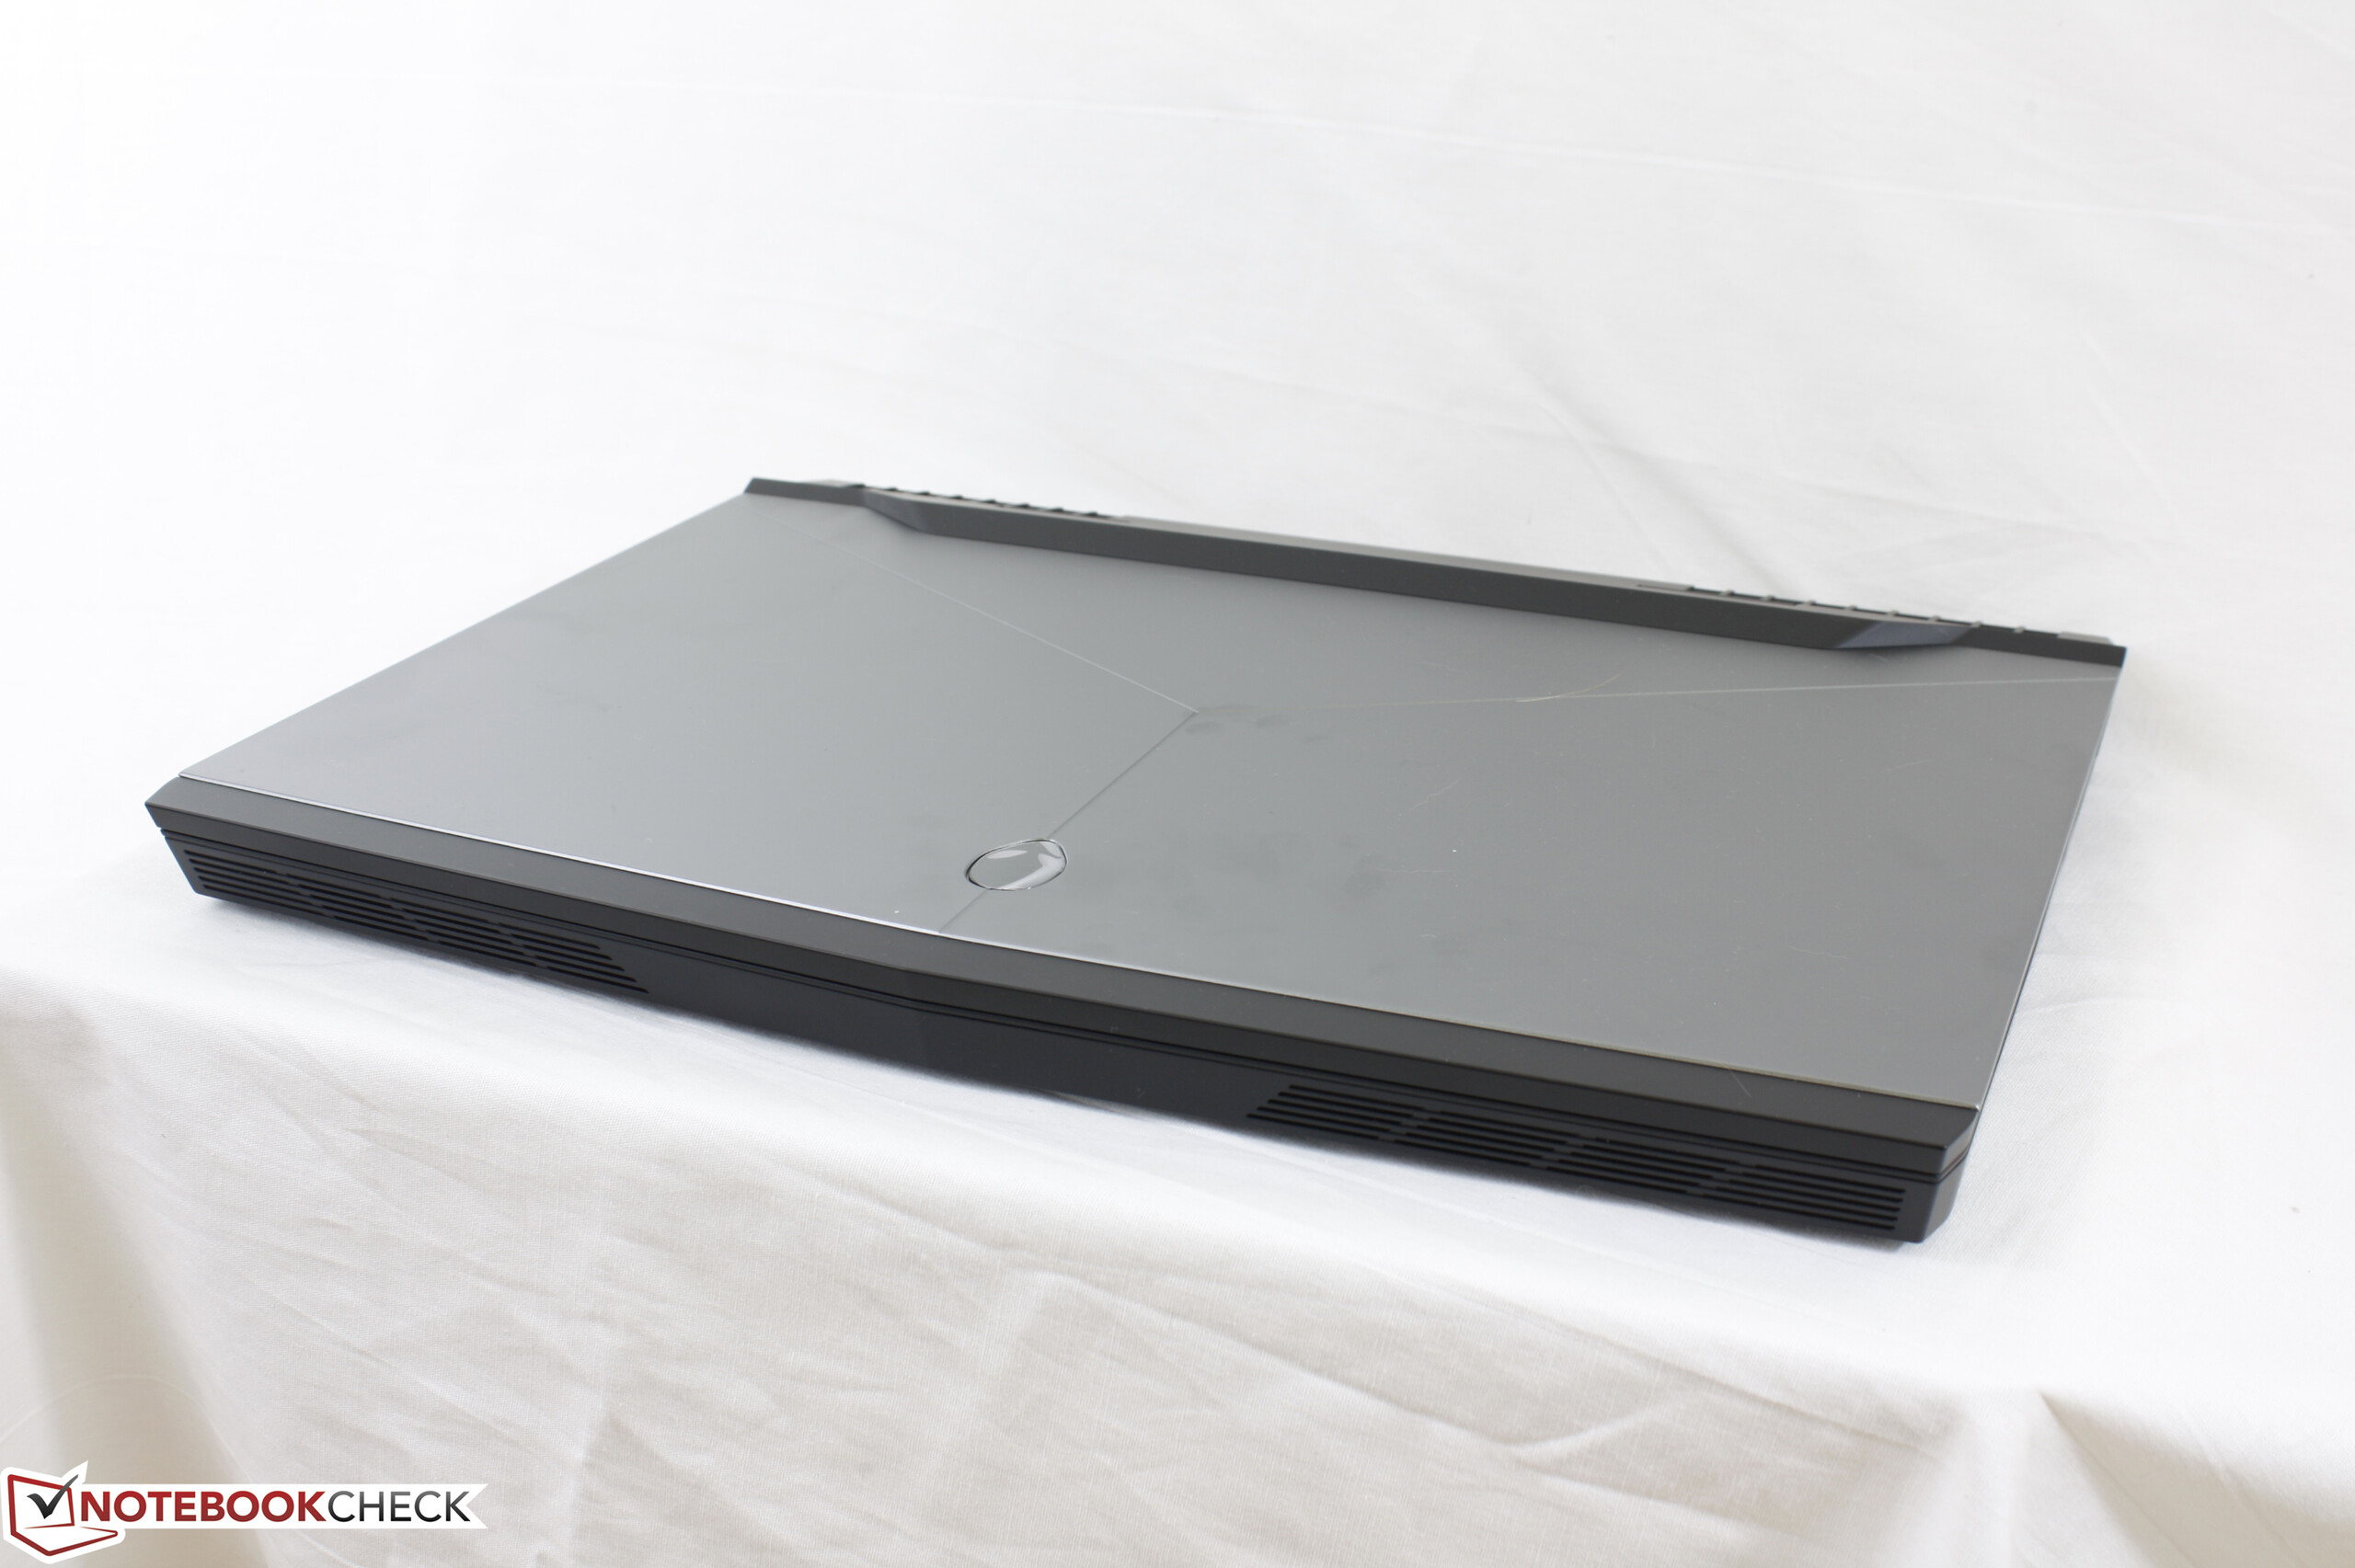
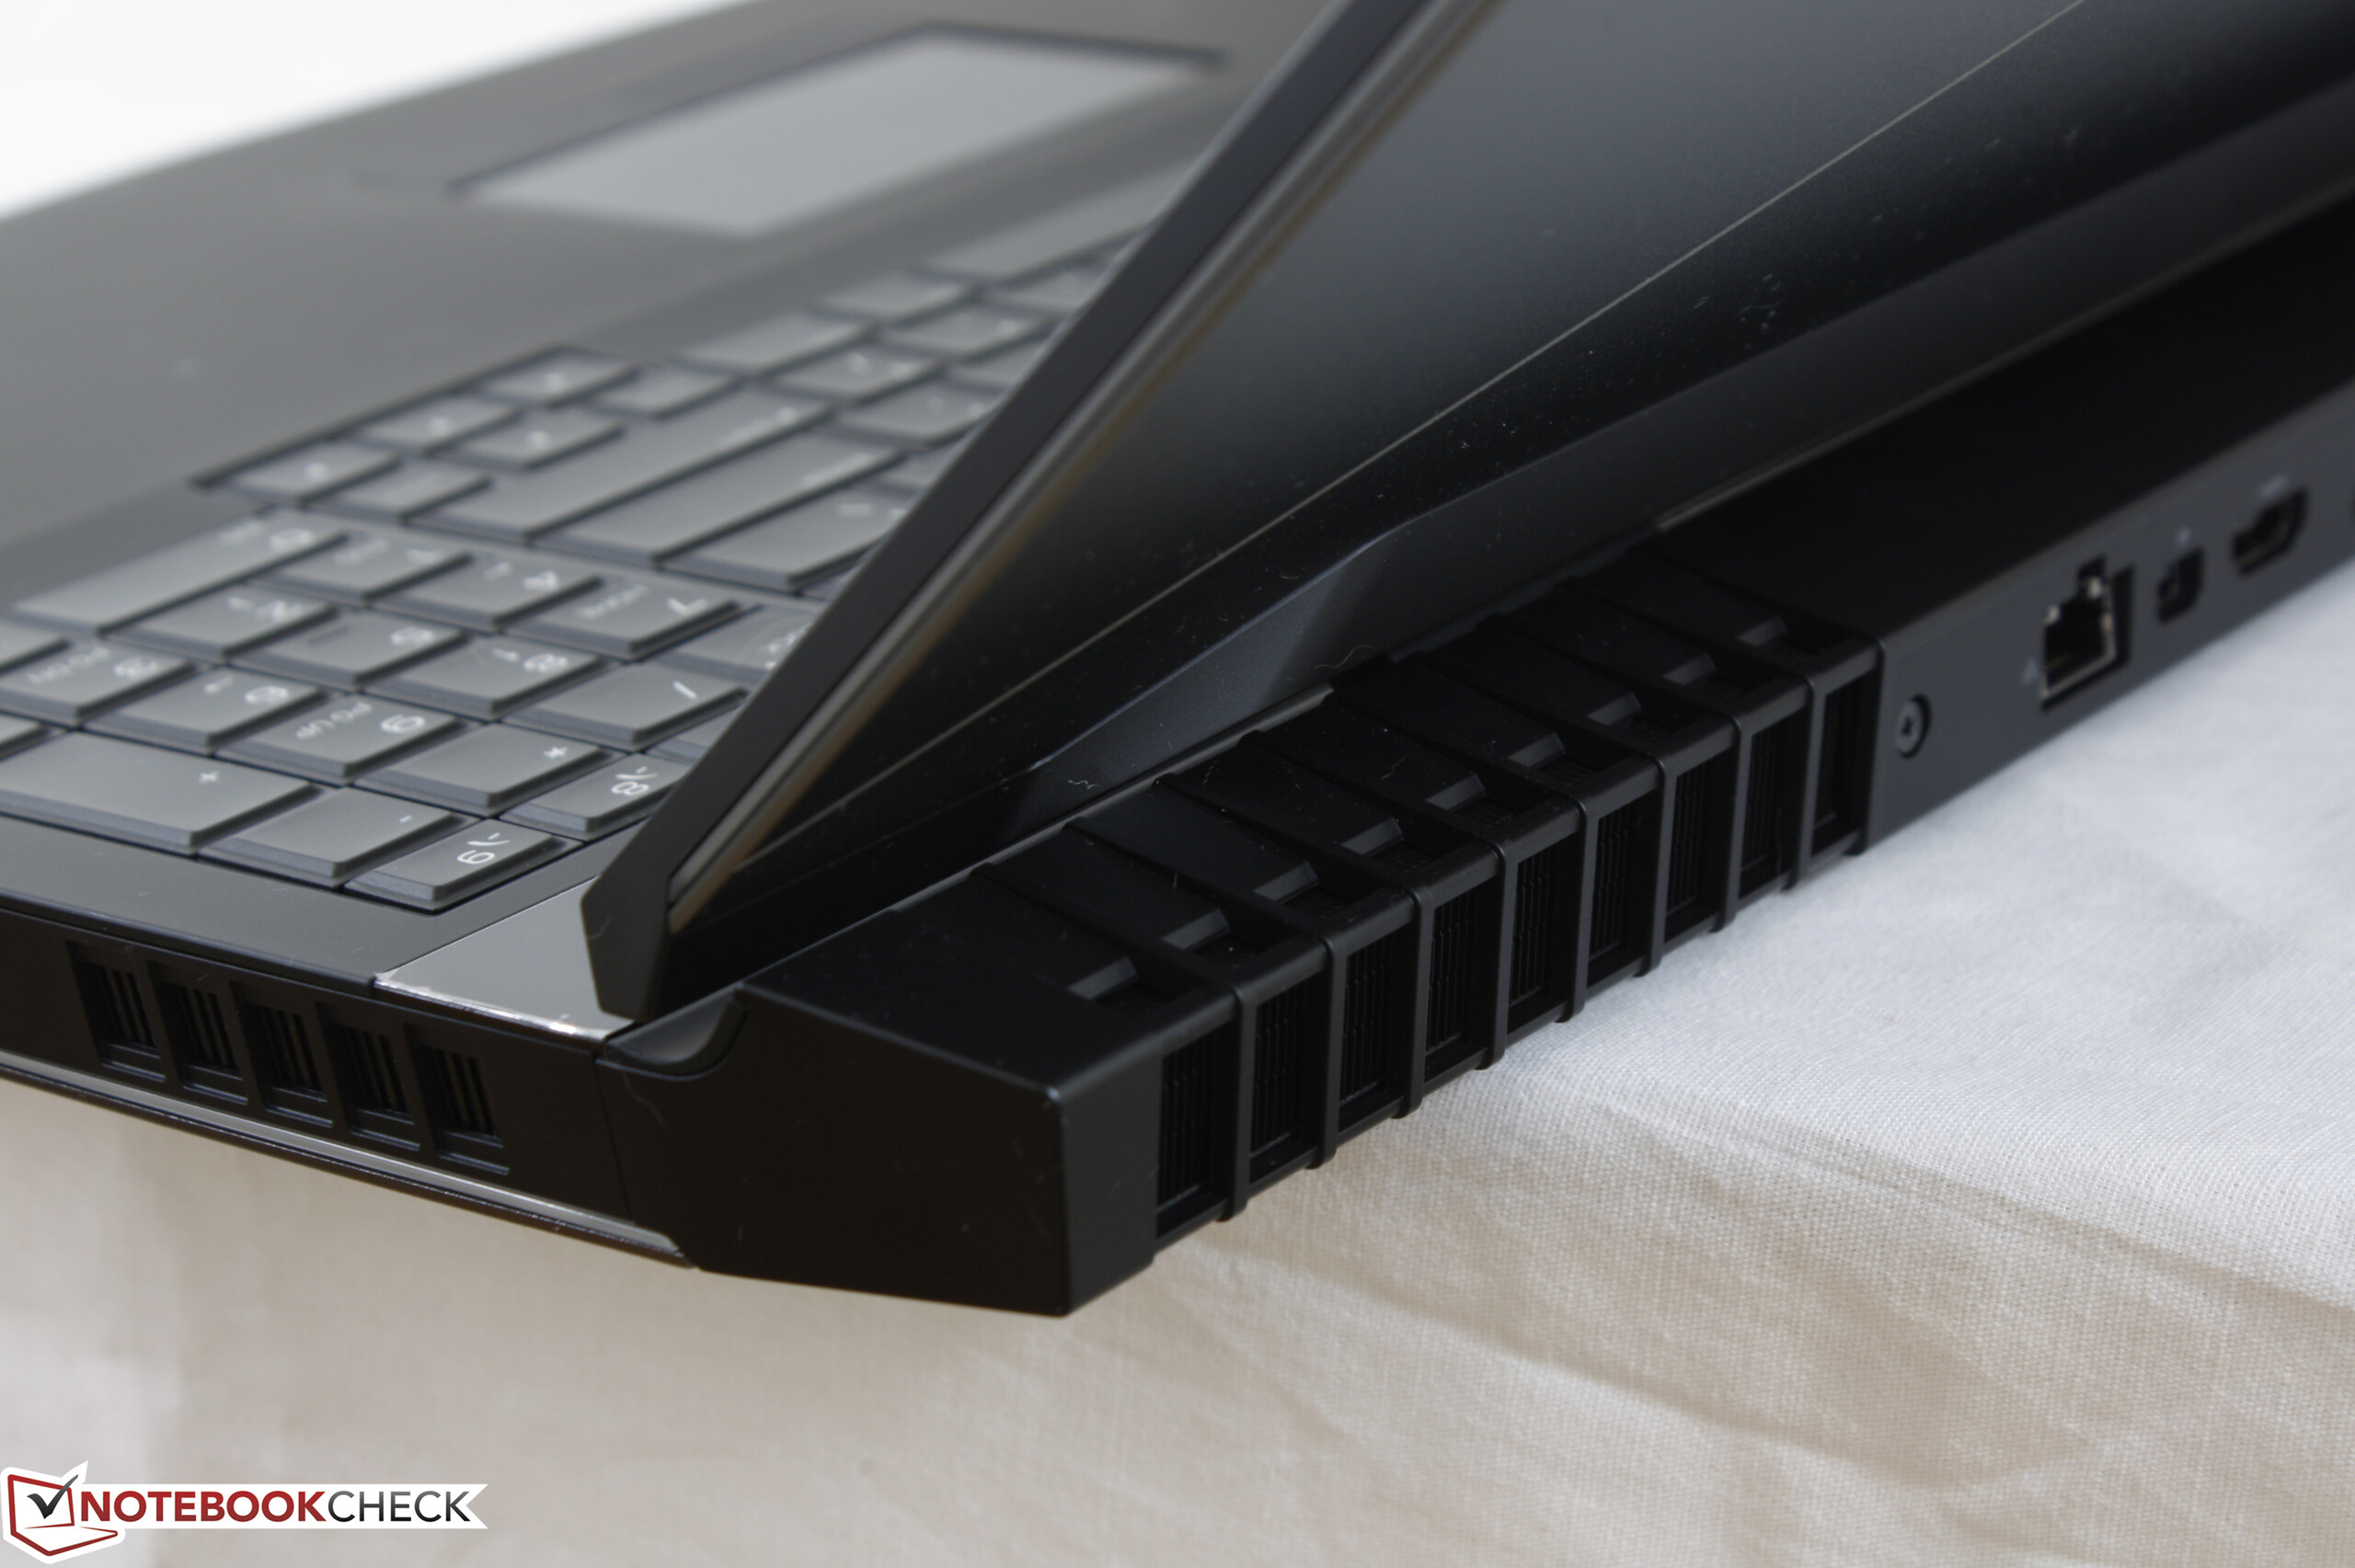
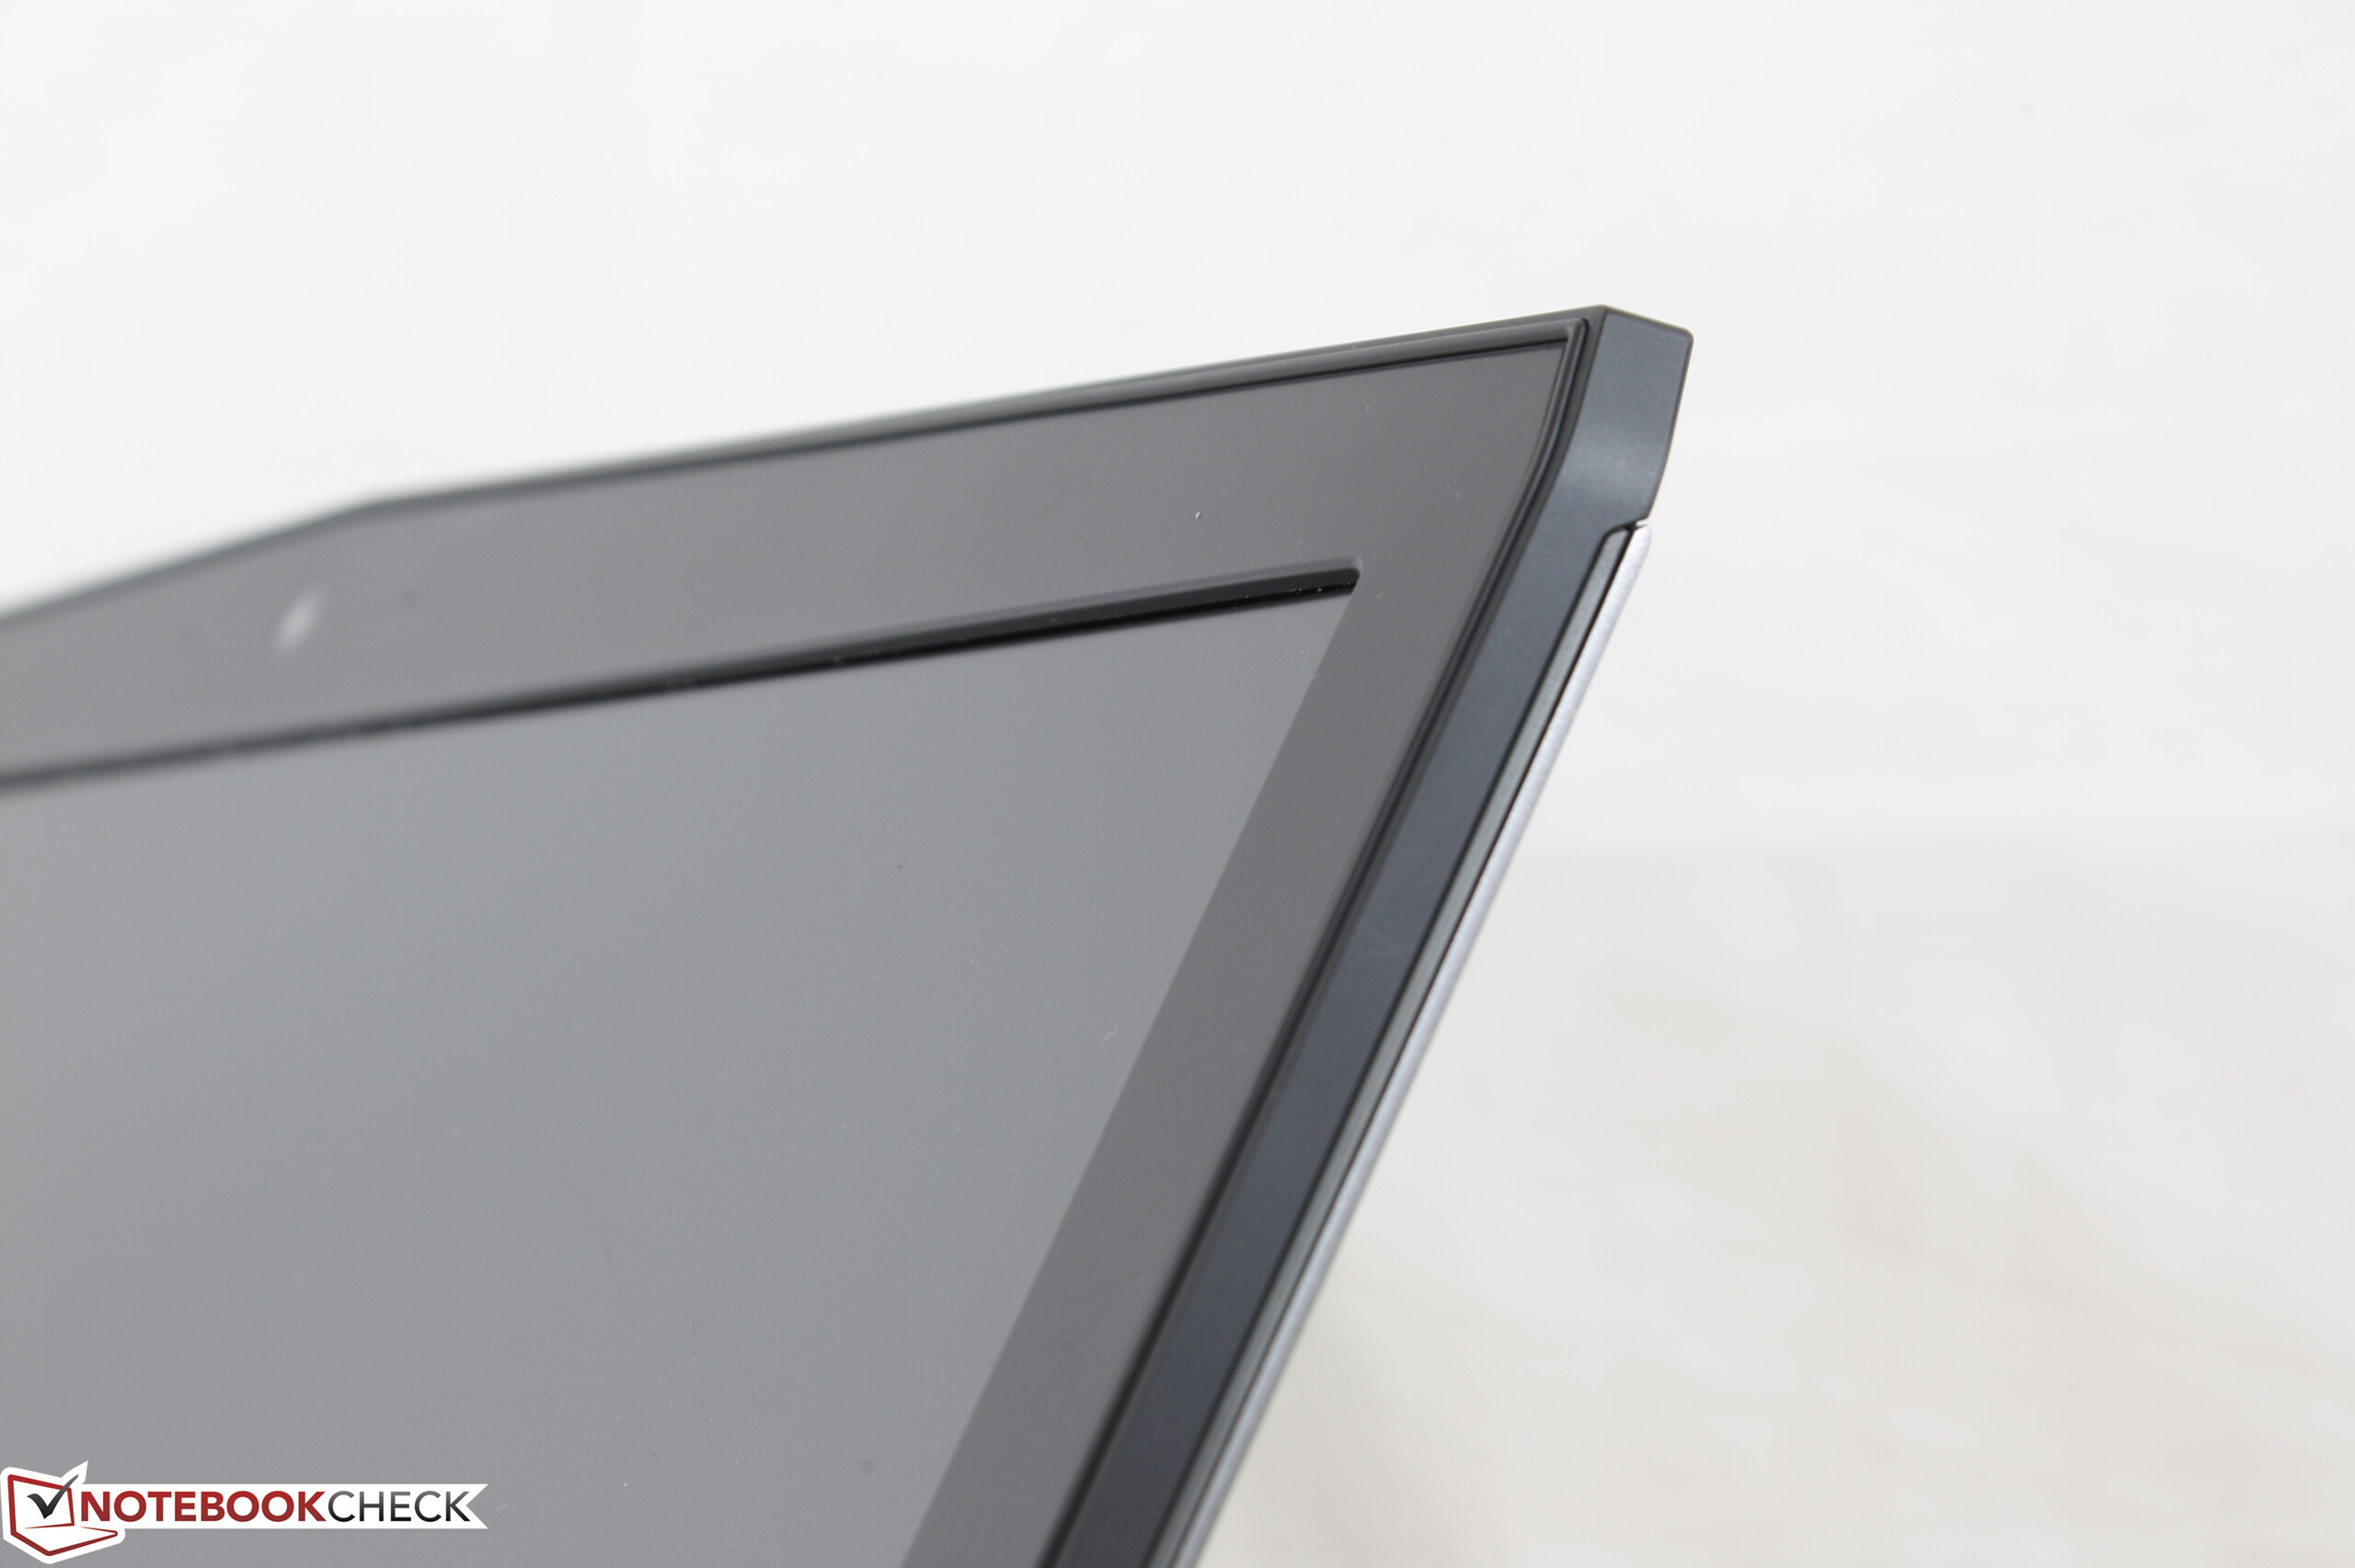
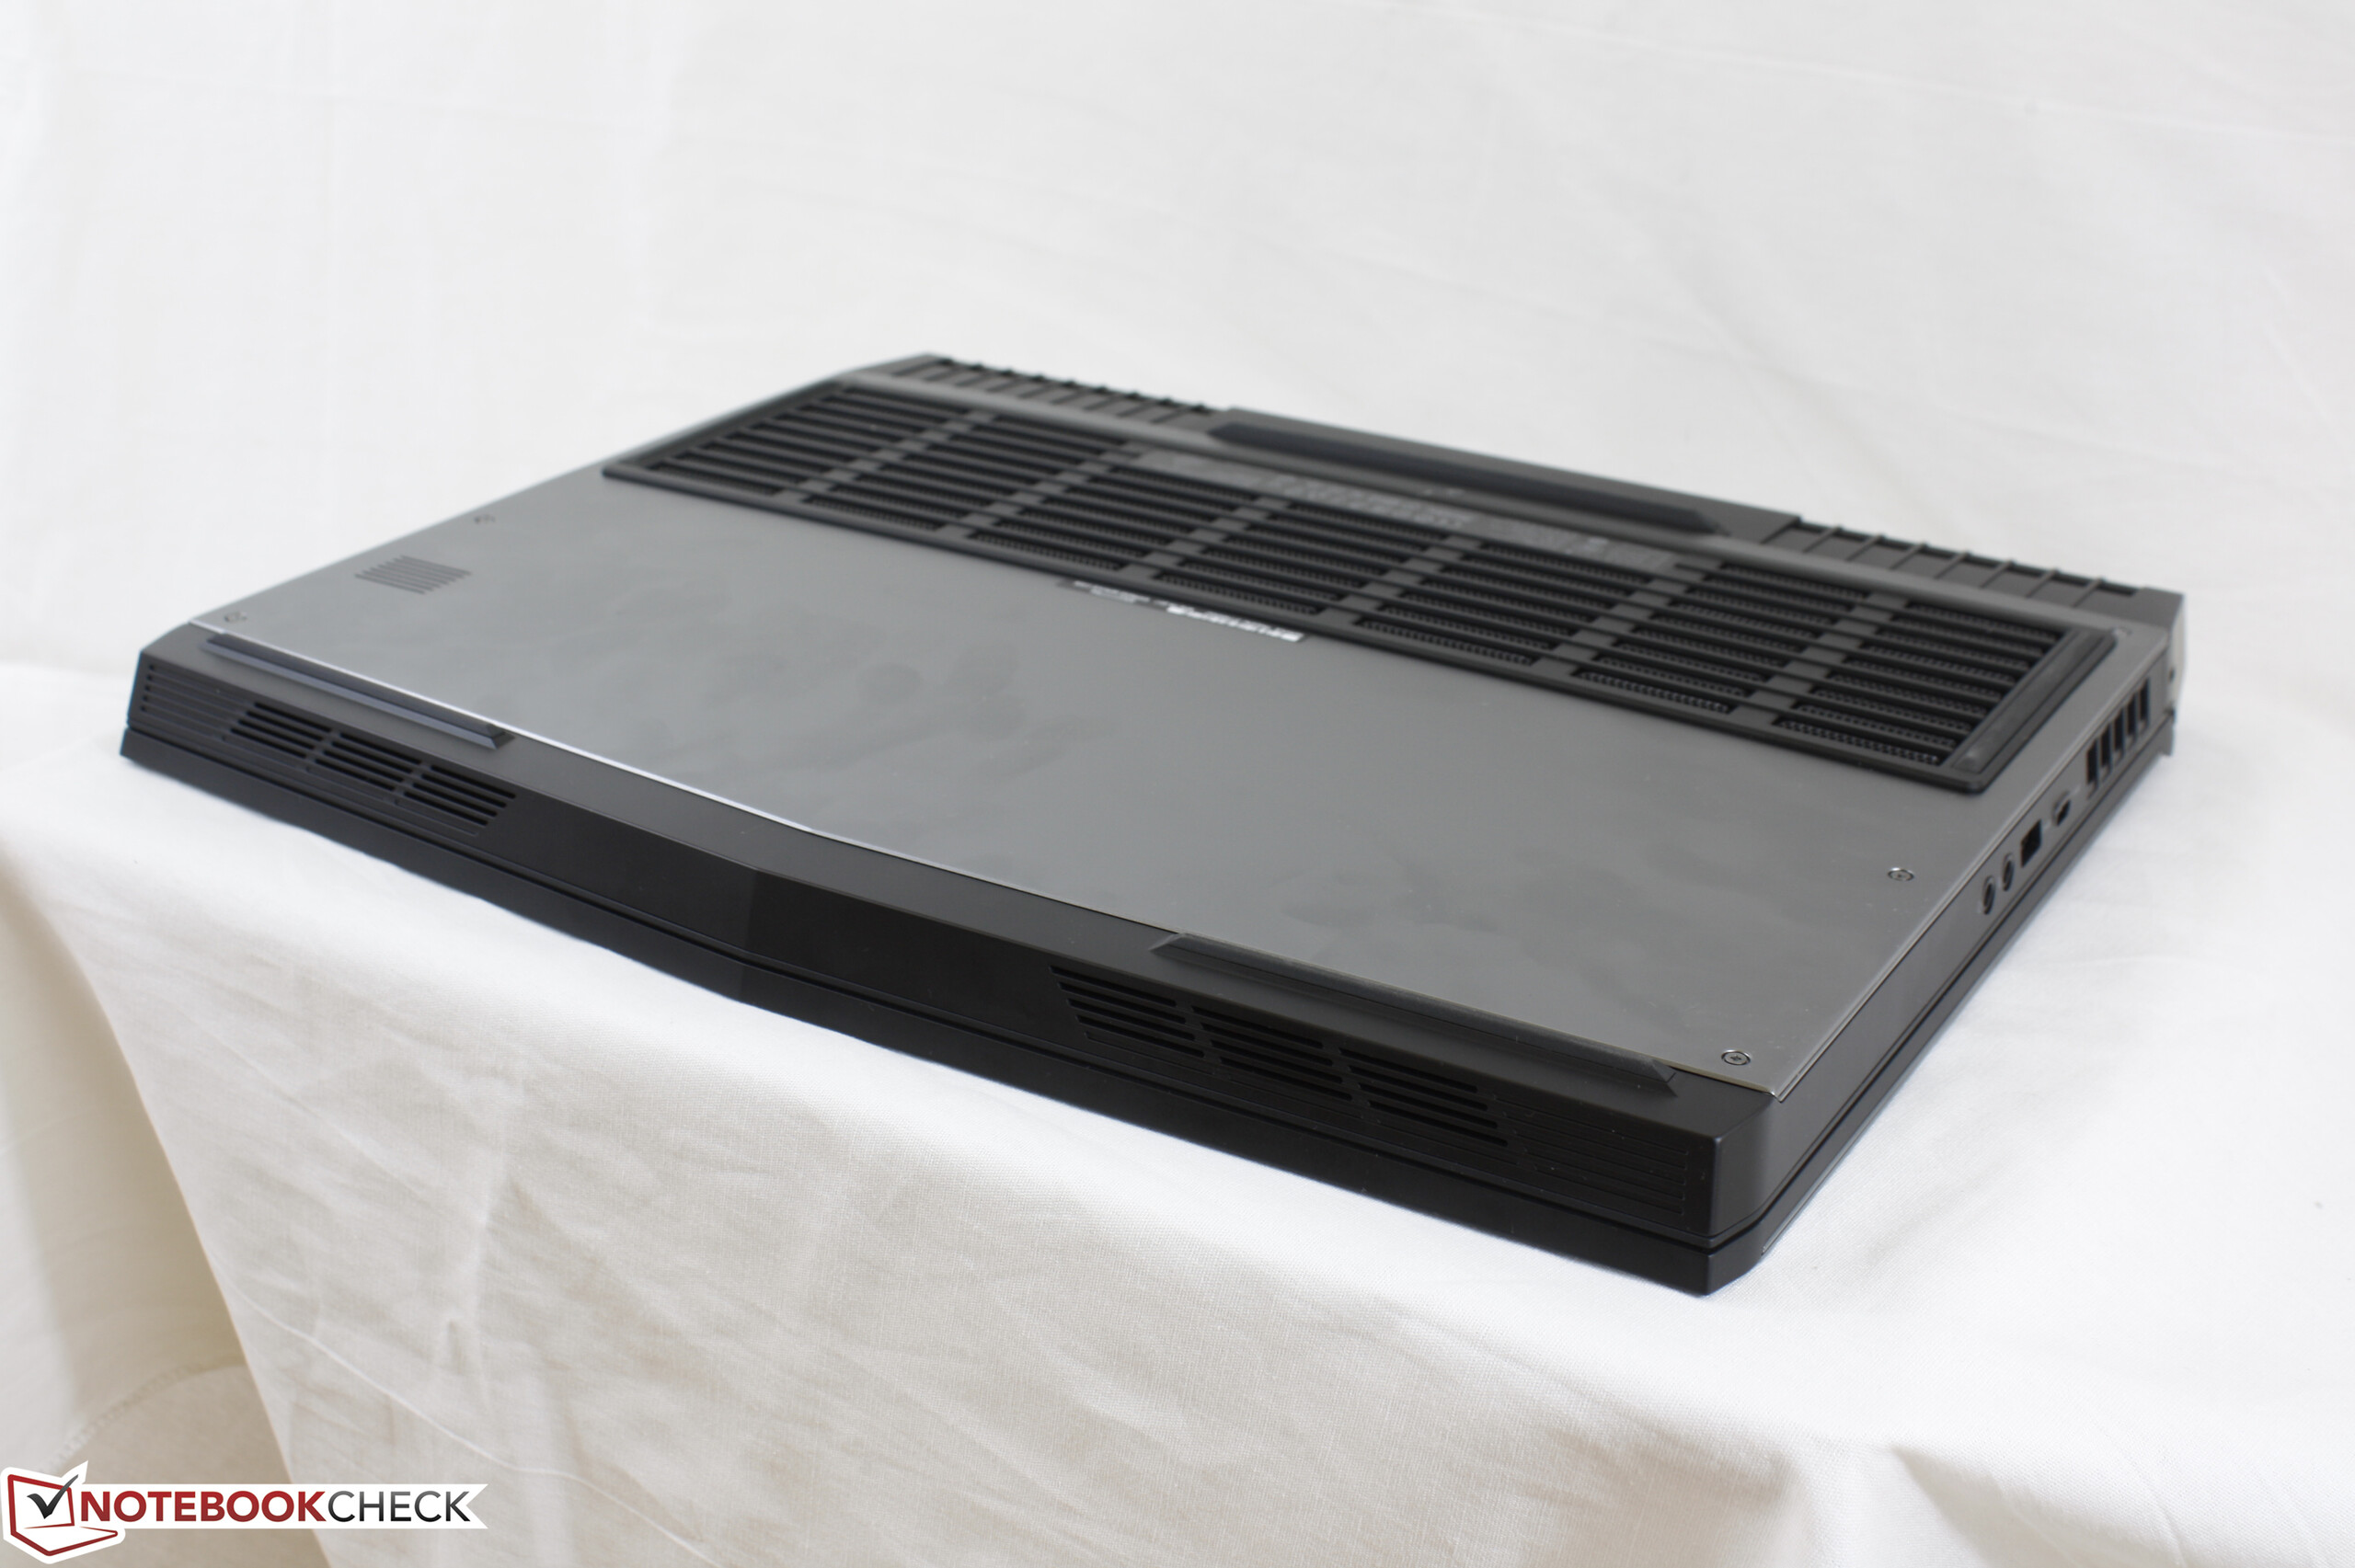
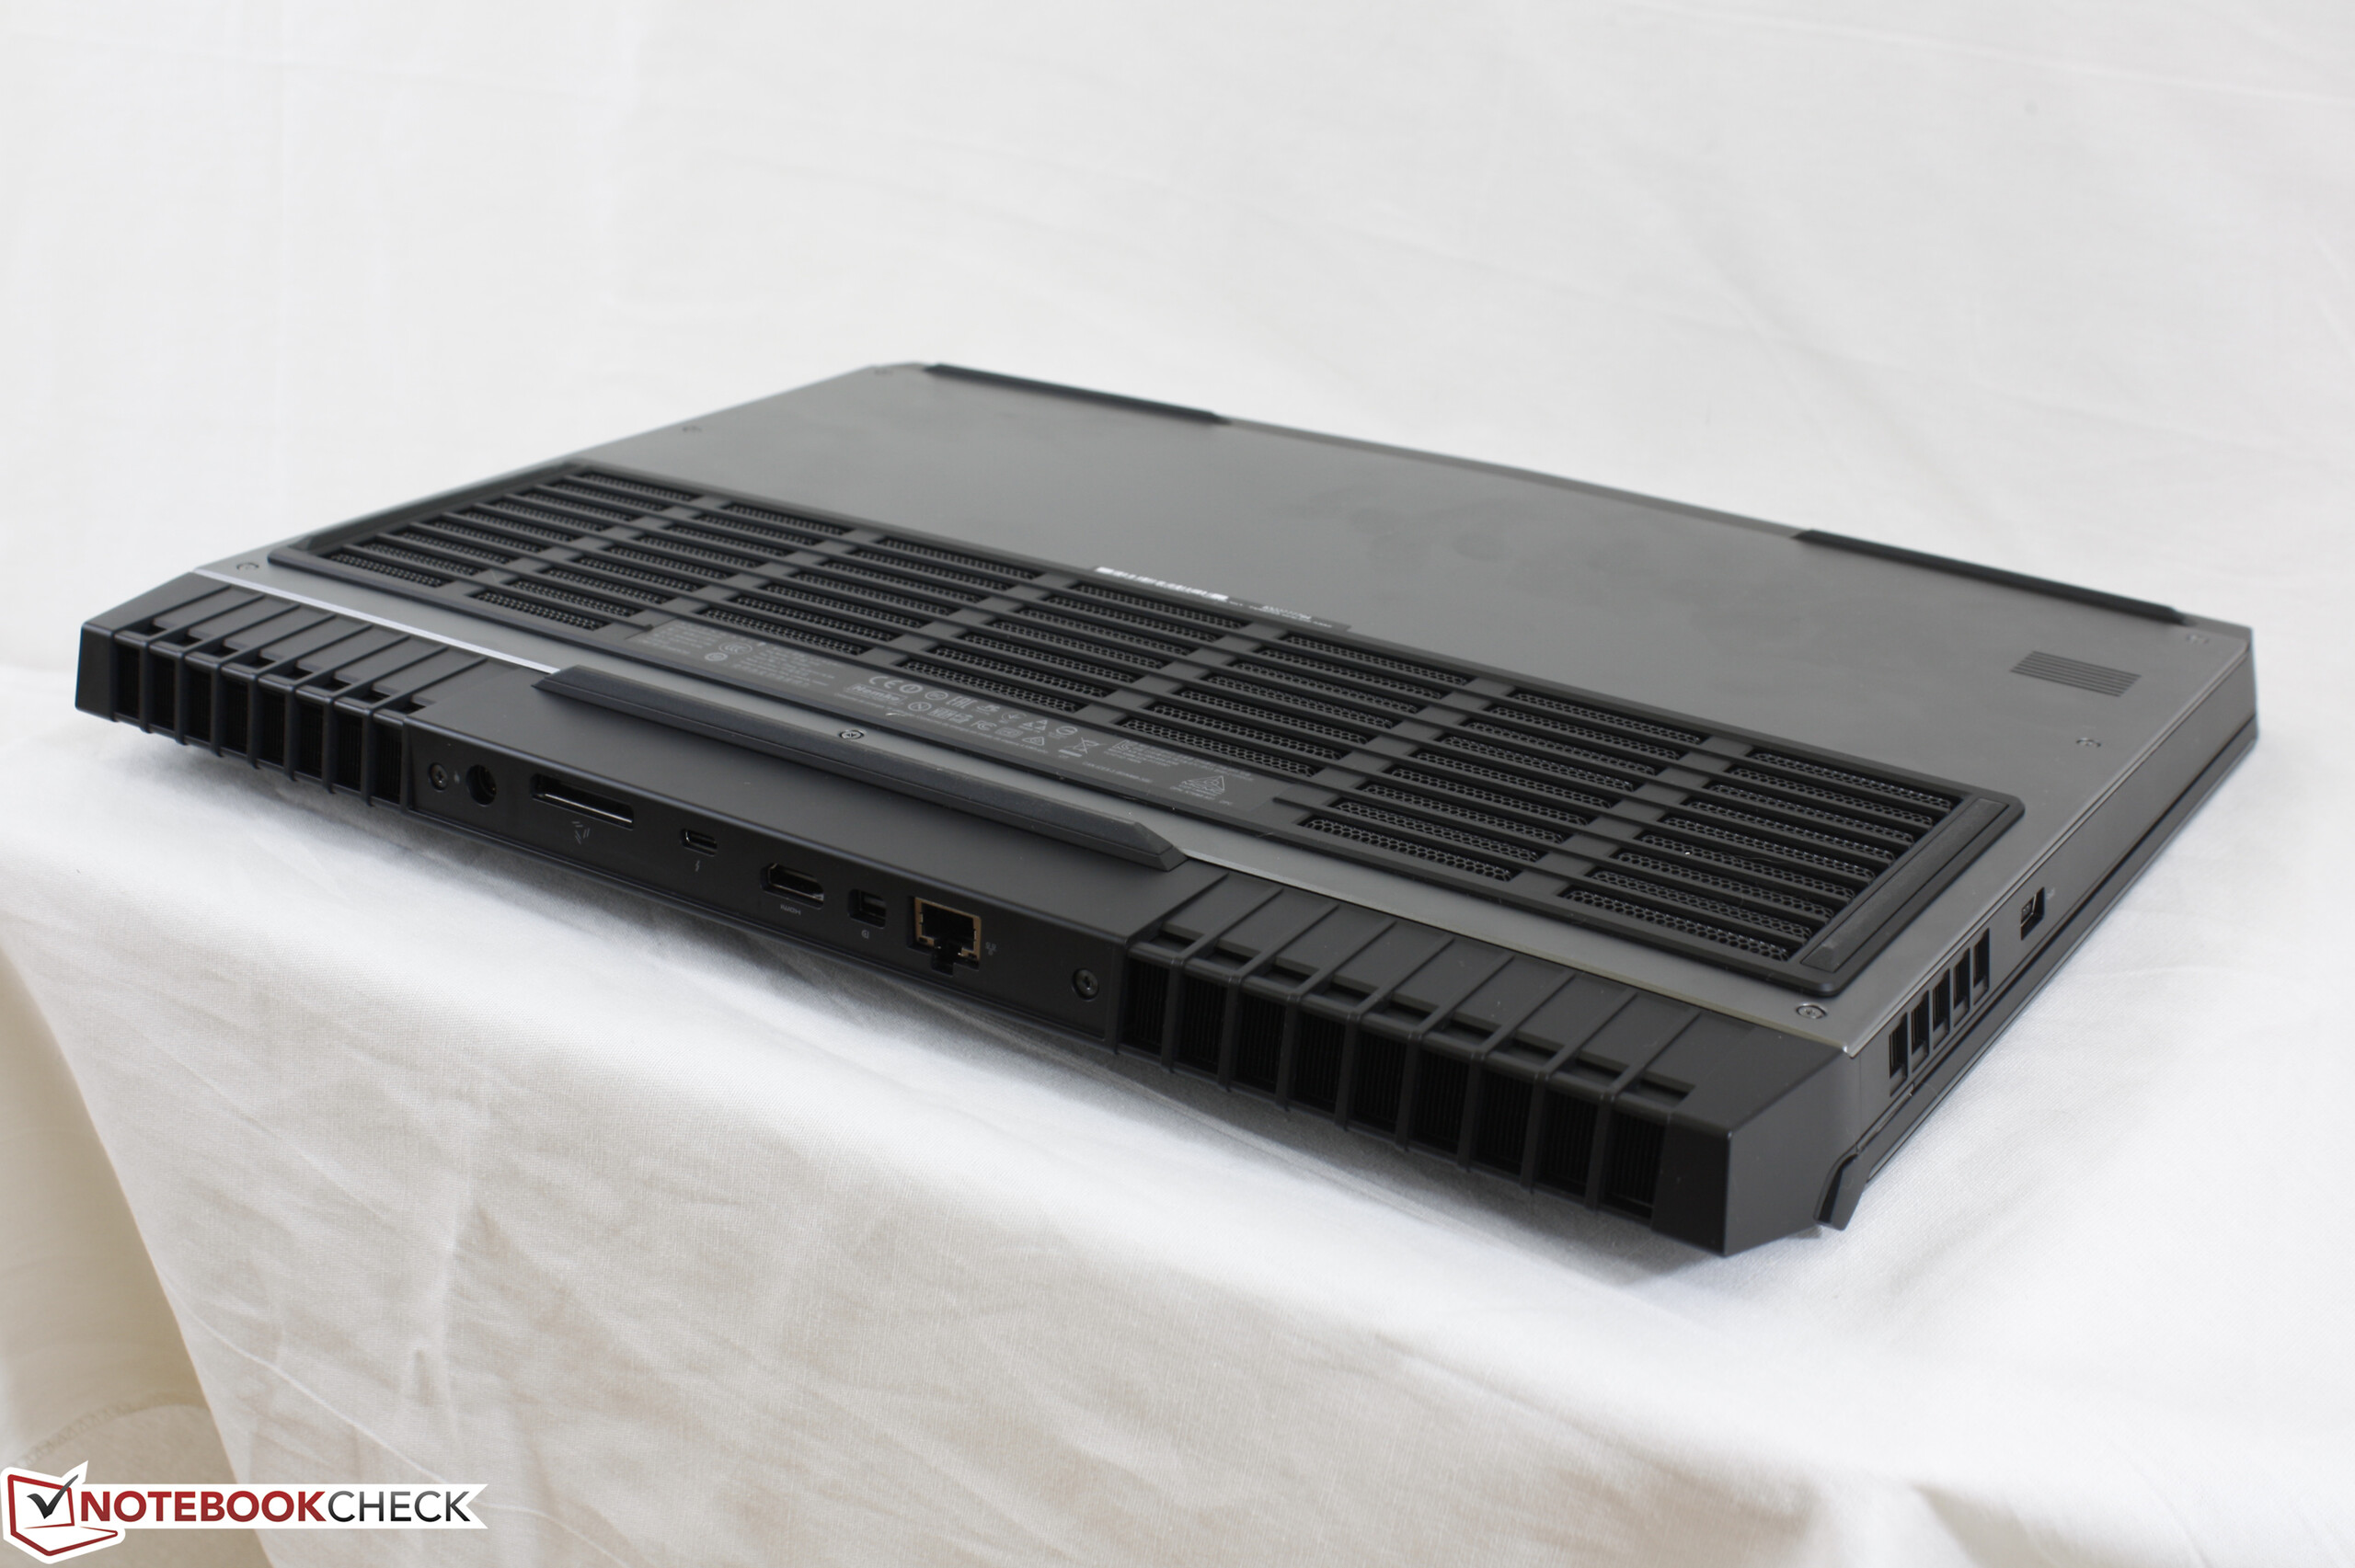
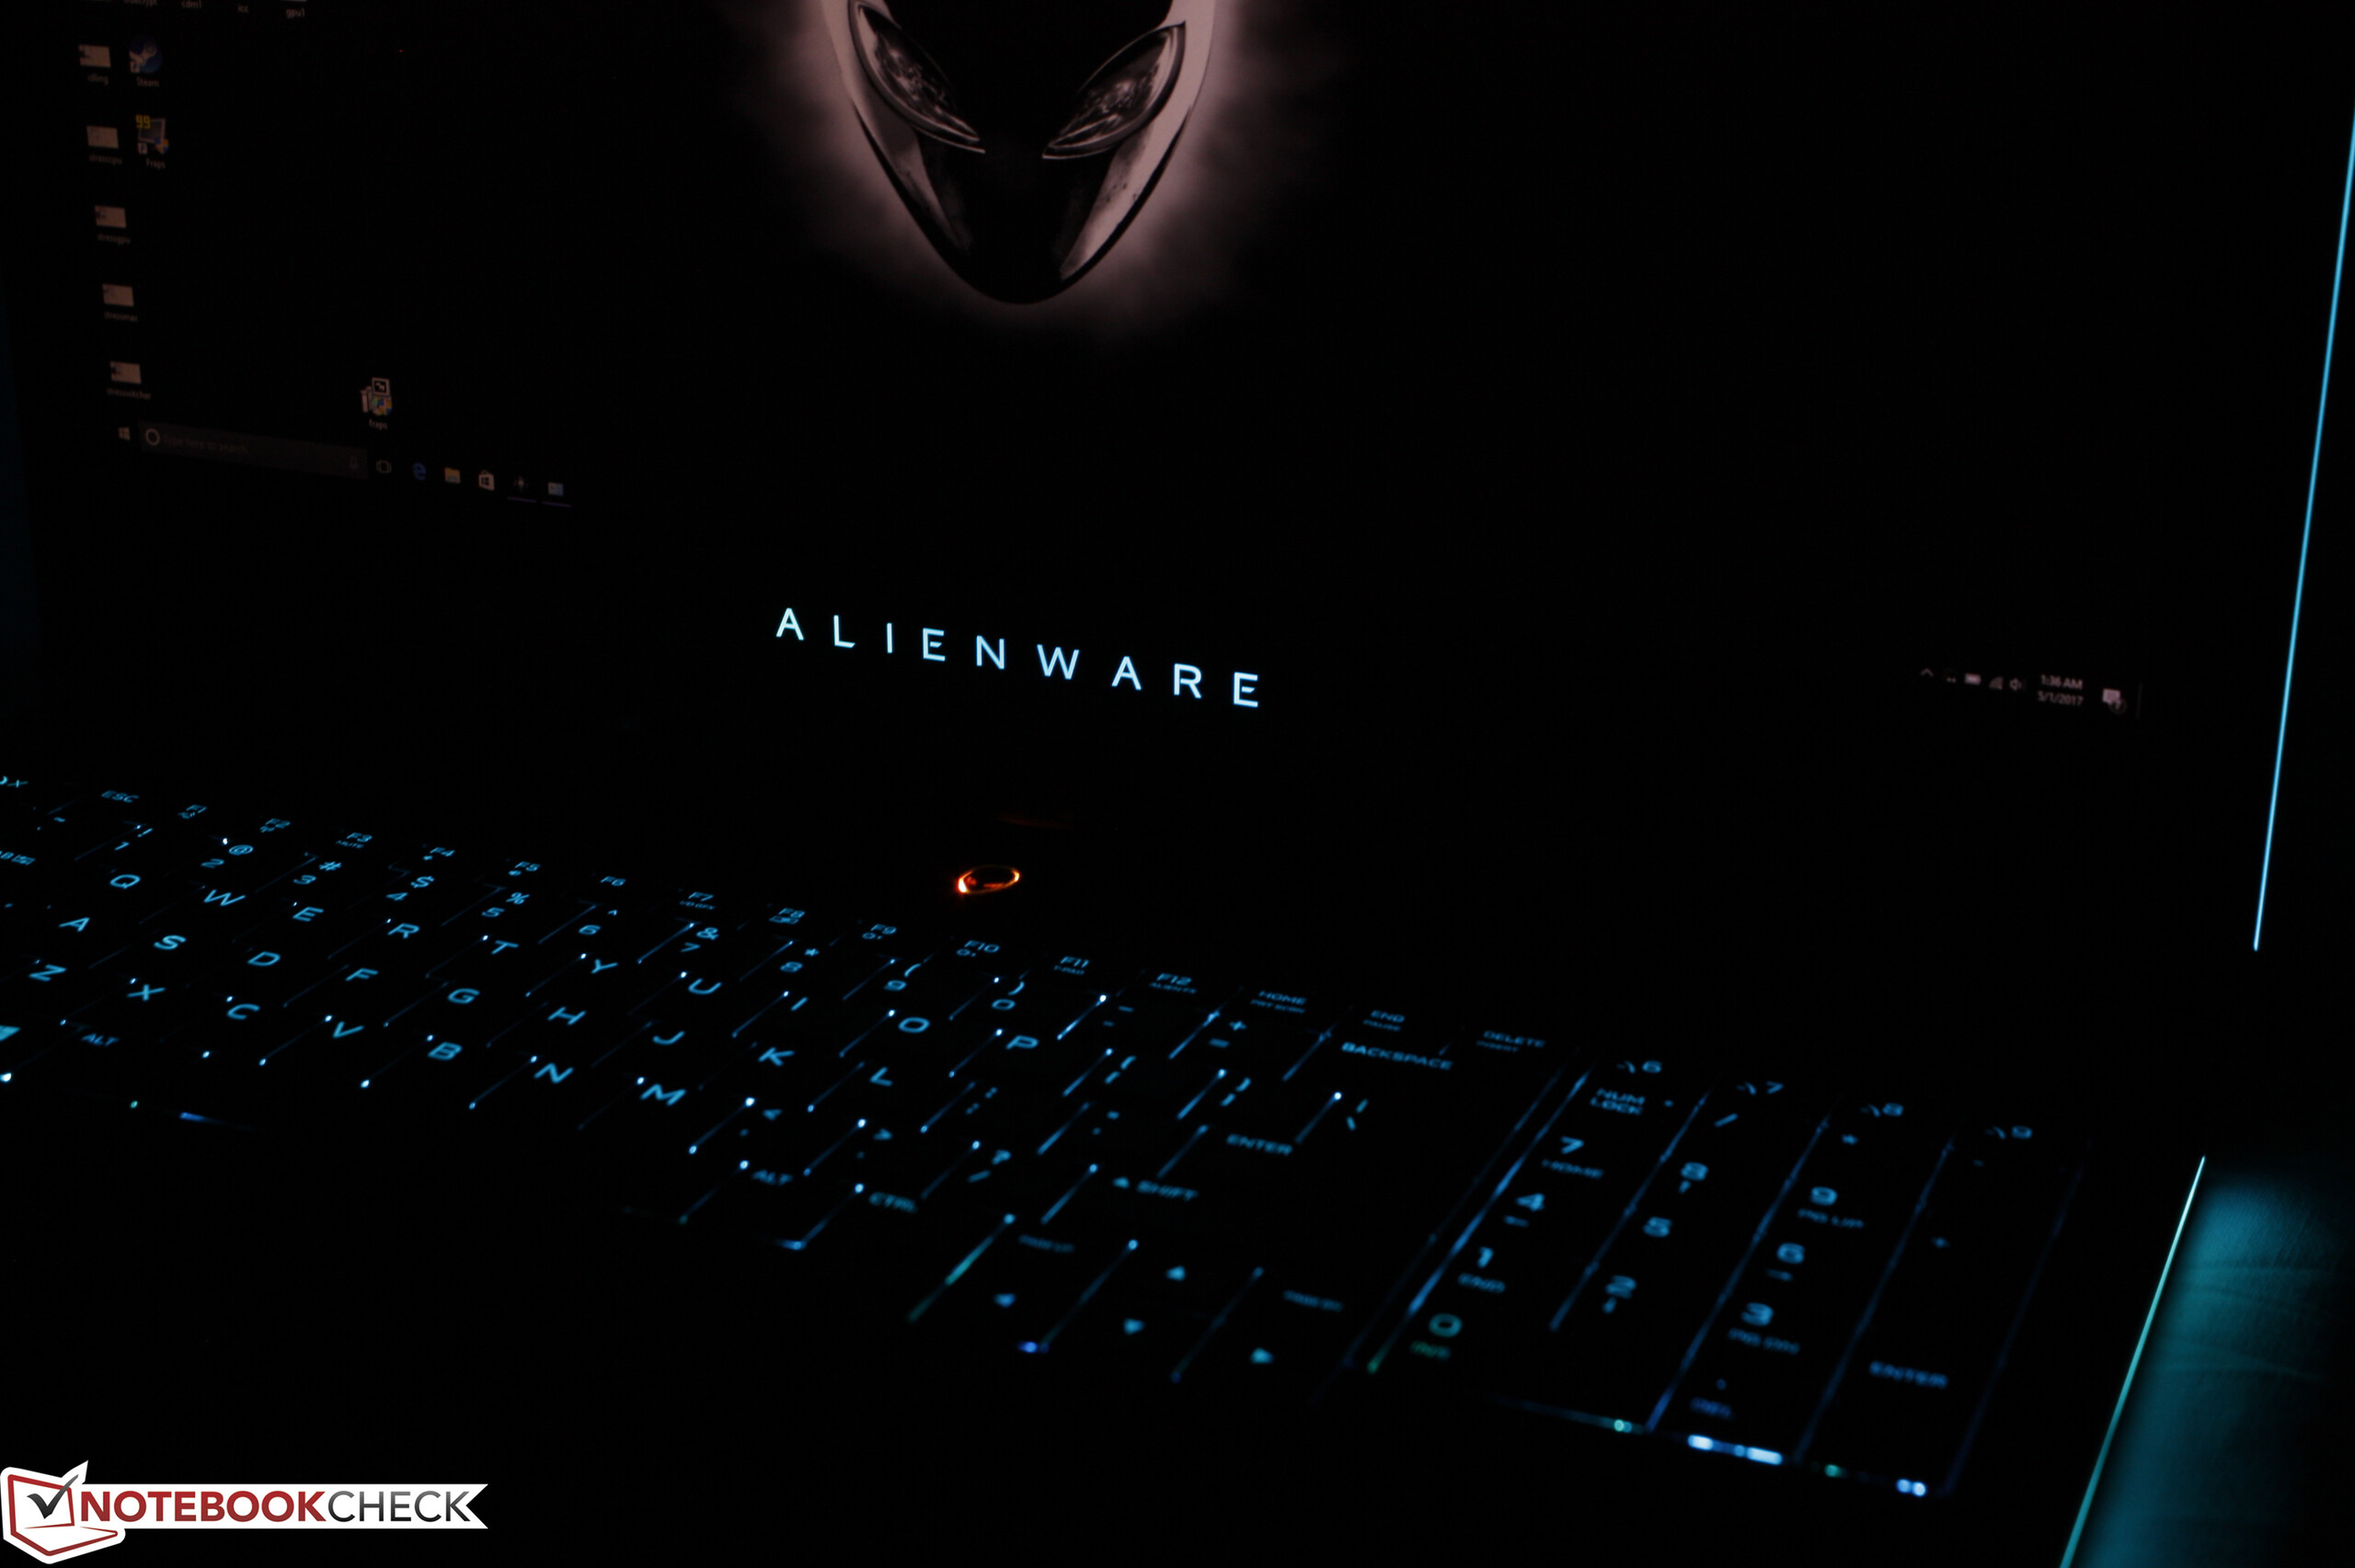
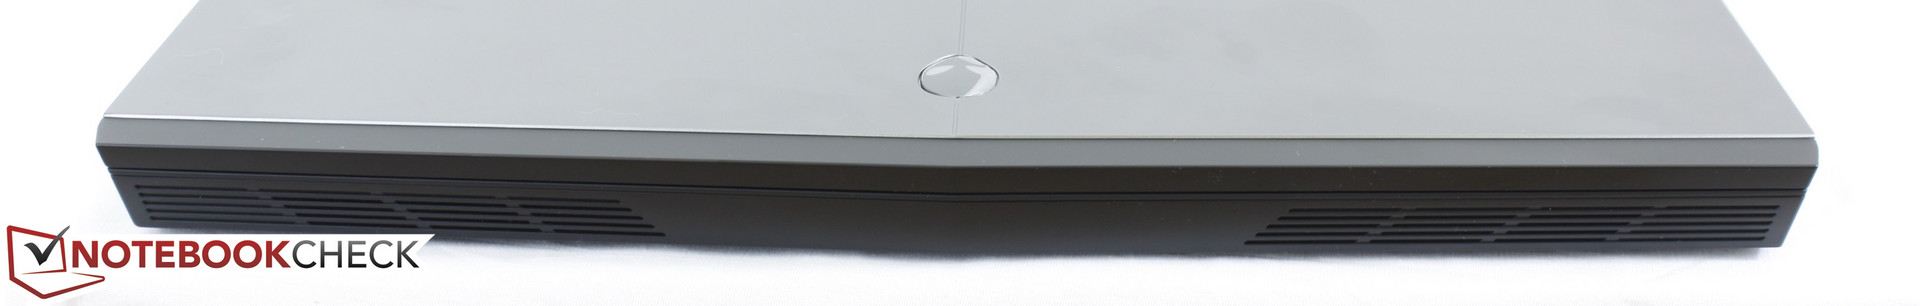
O novo chassis é incrivelmente bem projetado e se sente premium ao toque. Apenas note que a GTX 1080 está chegando no limite do que a solução de resfriamento pode lidar efetivamente.
Alienware 17 R4
- 05/03/2017 v6 (old)
Allen Ngo
Price comparison
