Breve Análise do Portátil Asus ROG Strix GL703VD-DB74 (7700HQ, GTX 1050, FHD)
| SD Card Reader | |
| average JPG Copy Test (av. of 3 runs) | |
| Acer Predator Helios 300 | |
| HP Omen 17-w206ng | |
| Asus ROG Strix GL703VD-DB74 | |
| MSI GS73VR 7RF | |
| MSI GL72 7RDX-602 | |
| Acer Aspire V17 Nitro BE VN7-793G-52XN | |
| maximum AS SSD Seq Read Test (1GB) | |
| HP Omen 17-w206ng | |
| Asus ROG Strix GL703VD-DB74 | |
| Acer Predator Helios 300 | |
| MSI GS73VR 7RF | |
| Acer Aspire V17 Nitro BE VN7-793G-52XN | |
| MSI GL72 7RDX-602 | |
| |||||||||||||||||||||||||
iluminação: 85 %
iluminação com acumulador: 421.2 cd/m²
Contraste: 957:1 (Preto: 0.44 cd/m²)
ΔE ColorChecker Calman: 5 | ∀{0.5-29.43 Ø4.71}
ΔE Greyscale Calman: 5 | ∀{0.09-98 Ø4.96}
86.1% sRGB (Argyll 1.6.3 3D)
62.94% AdobeRGB 1998 (Argyll 1.6.3 3D)
62.9% AdobeRGB 1998 (Argyll 3D)
86.1% sRGB (Argyll 3D)
67.6% Display P3 (Argyll 3D)
Gamma: 2.18
CCT: 6882 K
| Asus ROG Strix GL703VD-DB74 LG Philips LP173WF4-SPF5, IPS, 17.3", 1920x1080 | Acer Predator Helios 300 LG LP173WF4-SPF5 (LGD056D), AH-IPS, WLED, 17.3", 1920x1080 | Acer Aspire V17 Nitro BE VN7-793G-52XN AUO B173HAN01.0, a-Si TFT-LCD, WLED, 17.3", 1920x1080 | HP Omen 17-w206ng Chi Mei CMN1738, IPS, 17.3", 1920x1080 | MSI GL72 7RDX-602 Chi Mei CMN1735 N173HGE-E11, TN LED, 17.3", 1920x1080 | MSI GS73VR 7RF AU Optronics AUO109B, IPS, 17.3", 3840x2160 | Acer Aspire V17 Nitro BE VN7-793-738J AU Optronics B173ZAN01.0, IPS, 17.3", 3840x2160 | |
|---|---|---|---|---|---|---|---|
| Display | -0% | 1% | 5% | 3% | 4% | 32% | |
| Display P3 Coverage (%) | 67.6 | 66.8 -1% | 64 -5% | 67.2 -1% | 65.2 -4% | 64.2 -5% | 85.4 26% |
| sRGB Coverage (%) | 86.1 | 85.8 0% | 90.2 5% | 93.1 8% | 94.3 10% | 96.8 12% | 100 16% |
| AdobeRGB 1998 Coverage (%) | 62.9 | 62.8 0% | 65.4 4% | 67.4 7% | 65.6 4% | 66.4 6% | 97.8 55% |
| Response Times | -8% | -22% | -25% | -11% | -25% | -13% | |
| Response Time Grey 50% / Grey 80% * (ms) | 30.8 ? | 36 ? -17% | 36 ? -17% | 38 ? -23% | 29 ? 6% | 38 ? -23% | 29 ? 6% |
| Response Time Black / White * (ms) | 20.4 ? | 20 ? 2% | 26 ? -27% | 26 ? -27% | 26 ? -27% | 26 ? -27% | 27 ? -32% |
| PWM Frequency (Hz) | 119000 ? | 119000 ? | 200 ? | 961 | |||
| Screen | 2% | 5% | 3% | -44% | 2% | 9% | |
| Brightness middle (cd/m²) | 421.2 | 384 -9% | 346 -18% | 318 -25% | 299 -29% | 371.1 -12% | 380 -10% |
| Brightness (cd/m²) | 393 | 373 -5% | 307 -22% | 295 -25% | 274 -30% | 343 -13% | 336 -15% |
| Brightness Distribution (%) | 85 | 93 9% | 84 -1% | 79 -7% | 80 -6% | 86 1% | 81 -5% |
| Black Level * (cd/m²) | 0.44 | 0.35 20% | 0.26 41% | 0.25 43% | 0.25 43% | 0.42 5% | 0.32 27% |
| Contrast (:1) | 957 | 1097 15% | 1331 39% | 1272 33% | 1196 25% | 884 -8% | 1188 24% |
| Colorchecker dE 2000 * | 5 | 4.81 4% | 4.32 14% | 4.7 6% | 12.92 -158% | 4.5 10% | 5.32 -6% |
| Colorchecker dE 2000 max. * | 8.8 | 8.69 1% | 8.05 9% | 8.8 -0% | 19.91 -126% | 9.7 -10% | 7.63 13% |
| Greyscale dE 2000 * | 5 | 5.33 -7% | 5.76 -15% | 5 -0% | 13.16 -163% | 3.1 38% | 4.9 2% |
| Gamma | 2.18 101% | 2.45 90% | 2.35 94% | 2.28 96% | 2.36 93% | 2.17 101% | 2.61 84% |
| CCT | 6882 94% | 7137 91% | 6447 101% | 7374 88% | 15046 43% | 7120 91% | 6558 99% |
| Color Space (Percent of AdobeRGB 1998) (%) | 62.94 | 56 -11% | 59 -6% | 61 -3% | 60 -5% | 61 -3% | 87.2 39% |
| Color Space (Percent of sRGB) (%) | 86.1 | 86 0% | 90 5% | 93 8% | 94 9% | 97 13% | 100 16% |
| Média Total (Programa/Configurações) | -2% /
0% | -5% /
0% | -6% /
-0% | -17% /
-30% | -6% /
-1% | 9% /
10% |
* ... menor é melhor
Exibir tempos de resposta
| ↔ Tempo de resposta preto para branco | ||
|---|---|---|
| 20.4 ms ... ascensão ↗ e queda ↘ combinadas | ↗ 12 ms ascensão | 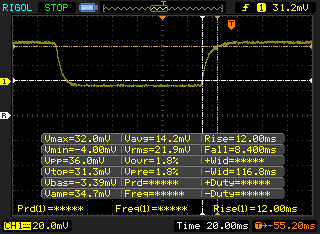 |
| ↘ 8.4 ms queda | ||
| A tela mostra boas taxas de resposta em nossos testes, mas pode ser muito lenta para jogadores competitivos. Em comparação, todos os dispositivos testados variam de 0.1 (mínimo) a 240 (máximo) ms. » 46 % de todos os dispositivos são melhores. Isso significa que o tempo de resposta medido é semelhante à média de todos os dispositivos testados (19.8 ms). | ||
| ↔ Tempo de resposta 50% cinza a 80% cinza | ||
| 30.8 ms ... ascensão ↗ e queda ↘ combinadas | ↗ 18 ms ascensão | 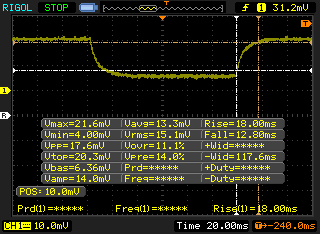 |
| ↘ 12.8 ms queda | ||
| A tela mostra taxas de resposta lentas em nossos testes e será insatisfatória para os jogadores. Em comparação, todos os dispositivos testados variam de 0.165 (mínimo) a 636 (máximo) ms. » 41 % de todos os dispositivos são melhores. Isso significa que o tempo de resposta medido é semelhante à média de todos os dispositivos testados (31 ms). | ||
Cintilação da tela / PWM (modulação por largura de pulso)
| Tela tremeluzindo/PWM detectado | 119000 Hz | ≤ 99 % configuração de brilho | 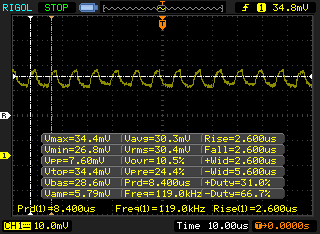 |
A luz de fundo da tela pisca em 119000 Hz (pior caso, por exemplo, utilizando PWM) Cintilação detectada em uma configuração de brilho de 99 % e abaixo. Não deve haver cintilação ou PWM acima desta configuração de brilho. A frequência de 119000 Hz é bastante alta, então a maioria dos usuários sensíveis ao PWM não deve notar nenhuma oscilação. [pwm_comparison] Em comparação: 52 % de todos os dispositivos testados não usam PWM para escurecer a tela. Se PWM foi detectado, uma média de 7757 (mínimo: 5 - máximo: 343500) Hz foi medida. | |||
| Cinebench R10 | |
| Rendering Multiple CPUs 32Bit | |
| Acer Aspire V17 Nitro BE VN7-793-738J | |
| Acer Predator Helios 300 | |
| Asus ROG Strix GL703VD-DB74 | |
| Acer Aspire V17 Nitro BE VN7-793G-52XN | |
| Rendering Single 32Bit | |
| Acer Aspire V17 Nitro BE VN7-793-738J | |
| Acer Predator Helios 300 | |
| Asus ROG Strix GL703VD-DB74 | |
| Acer Aspire V17 Nitro BE VN7-793G-52XN | |
| wPrime 2.10 - 1024m | |
| Asus ROG Strix GL703VD-DB74 | |
| MSI GS73VR 7RF | |
* ... menor é melhor
| PCMark 8 Home Score Accelerated v2 | 3868 pontos | |
| PCMark 8 Creative Score Accelerated v2 | 4967 pontos | |
| PCMark 8 Work Score Accelerated v2 | 4998 pontos | |
| PCMark 10 Score | 4309 pontos | |
Ajuda | ||
| Asus ROG Strix GL703VD-DB74 SanDisk SD8SN8U256G1002 | Acer Predator Helios 300 Intel SSD 600p SSDPEKKW512G7 | Acer Aspire V17 Nitro BE VN7-793G-52XN SK Hynix HFS256G39TND-N210A | HP Omen 17-w206ng Samsung PM961 MZVLW256HEHP | MSI GL72 7RDX-602 HGST Travelstar 7K1000 HTS721010A9E630 | MSI GS73VR 7RF Samsung SM961 MZVKW512HMJP m.2 PCI-e | |
|---|---|---|---|---|---|---|
| CrystalDiskMark 3.0 | 67% | 5% | 157% | -88% | 149% | |
| Write 4k QD32 (MB/s) | 214.2 | 404.5 89% | 267 25% | 505 136% | 1.102 -99% | 355.3 66% |
| Read 4k QD32 (MB/s) | 327.3 | 457.7 40% | 344.6 5% | 588 80% | 1.068 -100% | 454.1 39% |
| Write 4k (MB/s) | 49.93 | 125.5 151% | 76.2 53% | 155.6 212% | 1.022 -98% | 131.5 163% |
| Read 4k (MB/s) | 26.18 | 34.29 31% | 28.4 8% | 59.9 129% | 0.582 -98% | 48.5 85% |
| Write 512 (MB/s) | 339 | 425.9 26% | 267.8 -21% | 805 137% | 58.3 -83% | 748 121% |
| Read 512 (MB/s) | 321.5 | 580 80% | 325.8 1% | 846 163% | 45.57 -86% | 445.2 38% |
| Write Seq (MB/s) | 444.4 | 569 28% | 270.2 -39% | 1176 165% | 127 -71% | 1609 262% |
| Read Seq (MB/s) | 476 | 899 89% | 493.1 4% | 1606 237% | 135.3 -72% | 2459 417% |

| 3DMark | |
| 1280x720 Cloud Gate Standard Graphics | |
| Acer Predator Helios 300 | |
| Acer Aspire V17 Nitro BE VN7-793G-52XN | |
| MSI GS73VR 7RF | |
| Asus ROG Strix GL703VD-DB74 | |
| MSI GL72 7RDX-602 | |
| 1920x1080 Fire Strike Graphics | |
| Acer Predator Helios 300 | |
| Acer Aspire V17 Nitro BE VN7-793-738J | |
| MSI GS73VR 7RF | |
| Acer Aspire V17 Nitro BE VN7-793G-52XN | |
| Asus ROG Strix GL703VD-DB74 | |
| MSI GL72 7RDX-602 | |
| 3DMark 11 Performance | 7751 pontos | |
| 3DMark Cloud Gate Standard Score | 20414 pontos | |
| 3DMark Fire Strike Score | 5642 pontos | |
| 3DMark Fire Strike Extreme Score | 2765 pontos | |
Ajuda | ||
| Rise of the Tomb Raider | |
| 1920x1080 Very High Preset AA:FX AF:16x (classificar por valor) | |
| Asus ROG Strix GL703VD-DB74 | |
| Acer Predator Helios 300 | |
| Acer Aspire V17 Nitro BE VN7-793G-52XN | |
| MSI GL72 7RDX-602 | |
| MSI GS73VR 7RF | |
| 1920x1080 High Preset AA:FX AF:4x (classificar por valor) | |
| Asus ROG Strix GL703VD-DB74 | |
| Acer Predator Helios 300 | |
| Acer Aspire V17 Nitro BE VN7-793G-52XN | |
| MSI GL72 7RDX-602 | |
| 1366x768 Medium Preset AF:2x (classificar por valor) | |
| Asus ROG Strix GL703VD-DB74 | |
| Acer Predator Helios 300 | |
| Acer Aspire V17 Nitro BE VN7-793G-52XN | |
| MSI GL72 7RDX-602 | |
| 1024x768 Lowest Preset (classificar por valor) | |
| Asus ROG Strix GL703VD-DB74 | |
| Acer Predator Helios 300 | |
| Acer Aspire V17 Nitro BE VN7-793G-52XN | |
| MSI GL72 7RDX-602 | |
| baixo | média | alto | ultra | |
|---|---|---|---|---|
| Dirt 3 (2011) | 208.6 | 178.2 | 168 | 110.8 |
| Sleeping Dogs (2012) | 186.4 | 159.1 | 154.1 | 69 |
| Hitman: Absolution (2012) | 100.7 | 92.4 | 81.4 | 41.5 |
| Tomb Raider (2013) | 358 | 257.7 | 169 | 77.7 |
| BioShock Infinite (2013) | 237.6 | 178.3 | 158.8 | 64.8 |
| Metro: Last Light (2013) | 103.7 | 95.1 | 60.4 | 50 |
| GRID 2 (2013) | 150 | 111.8 | 101.4 | 74.4 |
| Company of Heroes 2 (2013) | 52.2 | 48 | 45.8 | 25.1 |
| Thief (2014) | 77.3 | 71.2 | 69.2 | 44.1 |
| The Witcher 3 (2015) | 119.2 | 73 | 41.2 | 23 |
| Rise of the Tomb Raider (2016) | 117 | 73 | 43 | 35 |
| Ashes of the Singularity (2016) | 46.4 | 37.9 | 34.3 |
Barulho
| Ocioso |
| 30.4 / 30.4 / 30.4 dB |
| Carga |
| 36.4 / 53 dB |
 | ||
30 dB silencioso 40 dB(A) audível 50 dB(A) ruidosamente alto |
||
min: | ||
| Asus ROG Strix GL703VD-DB74 GeForce GTX 1050 Mobile, i7-7700HQ, SanDisk SD8SN8U256G1002 | Acer Predator Helios 300 GeForce GTX 1060 Mobile, i7-7700HQ, Intel SSD 600p SSDPEKKW512G7 | Acer Aspire V17 Nitro BE VN7-793G-52XN GeForce GTX 1060 Mobile, i5-7300HQ, SK Hynix HFS256G39TND-N210A | HP Omen 17-w206ng GeForce GTX 1050 Ti Mobile, i7-7700HQ, Samsung PM961 MZVLW256HEHP | MSI GL72 7RDX-602 GeForce GTX 1050 Mobile, i7-7700HQ, HGST Travelstar 7K1000 HTS721010A9E630 | MSI GS73VR 7RF GeForce GTX 1060 Mobile, i7-7700HQ, Samsung SM961 MZVKW512HMJP m.2 PCI-e | |
|---|---|---|---|---|---|---|
| Noise | -6% | 3% | -12% | -4% | -1% | |
| desligado / ambiente * (dB) | 27.9 | 31 -11% | 30.7 -10% | 30 -8% | 30.8 -10% | 28.1 -1% |
| Idle Minimum * (dB) | 30.4 | 31 -2% | 30.7 -1% | 34 -12% | 32.4 -7% | 30.8 -1% |
| Idle Average * (dB) | 30.4 | 32 -5% | 30.7 -1% | 35 -15% | 32.4 -7% | 30.8 -1% |
| Idle Maximum * (dB) | 30.4 | 33 -9% | 31.4 -3% | 36 -18% | 32.8 -8% | 30.9 -2% |
| Load Average * (dB) | 36.4 | 44 -21% | 32.1 12% | 47 -29% | 40.9 -12% | 42.2 -16% |
| Witcher 3 ultra * (dB) | 46 | 46 -0% | 42.8 7% | 48 -4% | 44.4 3% | |
| Load Maximum * (dB) | 53 | 50 6% | 42.8 19% | 52 2% | 43.6 18% | 48.6 8% |
* ... menor é melhor
(-) A temperatura máxima no lado superior é 68.8 °C / 156 F, em comparação com a média de 40.4 °C / 105 F , variando de 21.2 a 68.8 °C para a classe Gaming.
(-) A parte inferior aquece até um máximo de 62 °C / 144 F, em comparação com a média de 43.2 °C / 110 F
(+) Em uso inativo, a temperatura média para o lado superior é 28.8 °C / 84 F, em comparação com a média do dispositivo de 33.9 °C / ### class_avg_f### F.
(-) Jogando The Witcher 3, a temperatura média para o lado superior é 39 °C / 102 F, em comparação com a média do dispositivo de 33.9 °C / ## #class_avg_f### F.
(+) Os apoios para as mãos e o touchpad são mais frios que a temperatura da pele, com um máximo de 31.4 °C / 88.5 F e, portanto, são frios ao toque.
(-) A temperatura média da área do apoio para as mãos de dispositivos semelhantes foi 28.8 °C / 83.8 F (-2.6 °C / -4.7 F).
Asus ROG Strix GL703VD-DB74 análise de áudio
(-) | alto-falantes não muito altos (###valor### dB)
Graves 100 - 315Hz
(±) | graves reduzidos - em média 11% menor que a mediana
(±) | a linearidade dos graves é média (14.5% delta para a frequência anterior)
Médios 400 - 2.000 Hz
(+) | médios equilibrados - apenas 3.5% longe da mediana
(±) | a linearidade dos médios é média (7.1% delta para frequência anterior)
Altos 2 - 16 kHz
(+) | agudos equilibrados - apenas 3.3% longe da mediana
(±) | a linearidade dos máximos é média (9% delta para frequência anterior)
Geral 100 - 16.000 Hz
(±) | a linearidade do som geral é média (19.7% diferença em relação à mediana)
Comparado com a mesma classe
» 69% de todos os dispositivos testados nesta classe foram melhores, 6% semelhantes, 25% piores
» O melhor teve um delta de 6%, a média foi 18%, o pior foi 132%
Comparado com todos os dispositivos testados
» 50% de todos os dispositivos testados foram melhores, 7% semelhantes, 43% piores
» O melhor teve um delta de 4%, a média foi 23%, o pior foi 134%
Apple MacBook 12 (Early 2016) 1.1 GHz análise de áudio
(+) | os alto-falantes podem tocar relativamente alto (###valor### dB)
Graves 100 - 315Hz
(±) | graves reduzidos - em média 11.3% menor que a mediana
(±) | a linearidade dos graves é média (14.2% delta para a frequência anterior)
Médios 400 - 2.000 Hz
(+) | médios equilibrados - apenas 2.4% longe da mediana
(+) | médios são lineares (5.5% delta para frequência anterior)
Altos 2 - 16 kHz
(+) | agudos equilibrados - apenas 2% longe da mediana
(+) | os máximos são lineares (4.5% delta da frequência anterior)
Geral 100 - 16.000 Hz
(+) | o som geral é linear (10.2% diferença em relação à mediana)
Comparado com a mesma classe
» 7% de todos os dispositivos testados nesta classe foram melhores, 2% semelhantes, 90% piores
» O melhor teve um delta de 5%, a média foi 18%, o pior foi 53%
Comparado com todos os dispositivos testados
» 5% de todos os dispositivos testados foram melhores, 1% semelhantes, 94% piores
» O melhor teve um delta de 4%, a média foi 23%, o pior foi 134%
| desligado | |
| Ocioso | |
| Carga |
|
Key:
min: | |
| Asus ROG Strix GL703VD-DB74 i7-7700HQ, GeForce GTX 1050 Mobile, SanDisk SD8SN8U256G1002, IPS, 1920x1080, 17.3" | Acer Predator Helios 300 i7-7700HQ, GeForce GTX 1060 Mobile, Intel SSD 600p SSDPEKKW512G7, AH-IPS, WLED, 1920x1080, 17.3" | Acer Aspire V17 Nitro BE VN7-793G-52XN i5-7300HQ, GeForce GTX 1060 Mobile, SK Hynix HFS256G39TND-N210A, a-Si TFT-LCD, WLED, 1920x1080, 17.3" | HP Omen 17-w206ng i7-7700HQ, GeForce GTX 1050 Ti Mobile, Samsung PM961 MZVLW256HEHP, IPS, 1920x1080, 17.3" | MSI GL72 7RDX-602 i7-7700HQ, GeForce GTX 1050 Mobile, HGST Travelstar 7K1000 HTS721010A9E630, TN LED, 1920x1080, 17.3" | MSI GS73VR 7RF i7-7700HQ, GeForce GTX 1060 Mobile, Samsung SM961 MZVKW512HMJP m.2 PCI-e, IPS, 3840x2160, 17.3" | Acer Aspire V17 Nitro BE VN7-793-738J i7-7700HQ, GeForce GTX 1060 Mobile, Intel SSD 600p SSDPEKKW512G7, IPS, 3840x2160, 17.3" | |
|---|---|---|---|---|---|---|---|
| Power Consumption | -24% | -16% | -42% | -30% | -66% | -52% | |
| Idle Minimum * (Watt) | 5.8 | 7 -21% | 7.8 -34% | 11 -90% | 9.6 -66% | 14.2 -145% | 10.5 -81% |
| Idle Average * (Watt) | 11.6 | 13 -12% | 13.3 -15% | 18 -55% | 15 -29% | 23.5 -103% | 20.5 -77% |
| Idle Maximum * (Watt) | 12.3 | 20 -63% | 16.6 -35% | 24 -95% | 16.5 -34% | 23.8 -93% | 22 -79% |
| Load Average * (Watt) | 82.4 | 81 2% | 73 11% | 84 -2% | 104 -26% | 90.9 -10% | 91 -10% |
| Witcher 3 ultra * (Watt) | 97 | 127 -31% | 118 -22% | 101 -4% | 116 -20% | ||
| Load Maximum * (Watt) | 135.5 | 162 -20% | 140 -3% | 146 -8% | 129 5% | 171.6 -27% | 155 -14% |
* ... menor é melhor
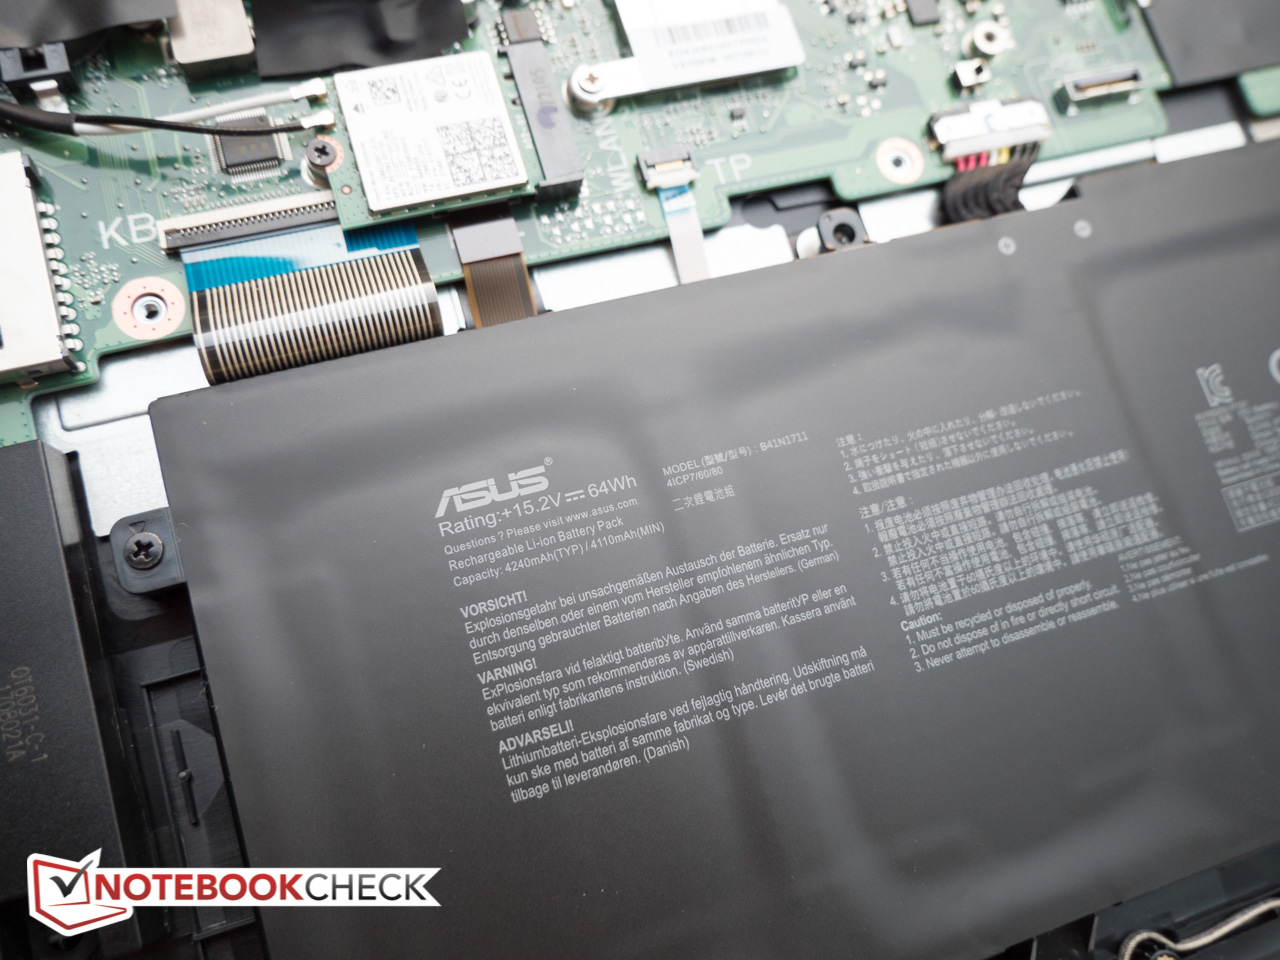
| Asus ROG Strix GL703VD-DB74 i7-7700HQ, GeForce GTX 1050 Mobile, 64 Wh | Acer Predator Helios 300 i7-7700HQ, GeForce GTX 1060 Mobile, 48 Wh | Acer Aspire V17 Nitro BE VN7-793G-52XN i5-7300HQ, GeForce GTX 1060 Mobile, 69 Wh | HP Omen 17-w206ng i7-7700HQ, GeForce GTX 1050 Ti Mobile, 62 Wh | MSI GL72 7RDX-602 i7-7700HQ, GeForce GTX 1050 Mobile, 43.2 Wh | MSI GS73VR 7RF i7-7700HQ, GeForce GTX 1060 Mobile, 65 Wh | |
|---|---|---|---|---|---|---|
| Duração da bateria | -28% | 15% | 7% | -51% | -50% | |
| Reader / Idle (h) | 13.4 | 10.2 -24% | 10.3 -23% | 13.3 -1% | 5.5 -59% | 5 -63% |
| WiFi v1.3 (h) | 7.2 | 4.7 -35% | 6.2 -14% | 6.3 -12% | 3.4 -53% | 2.7 -62% |
| Load (h) | 1.2 | 0.9 -25% | 2.2 83% | 1.6 33% | 0.7 -42% | 0.9 -25% |
Pro
Contra
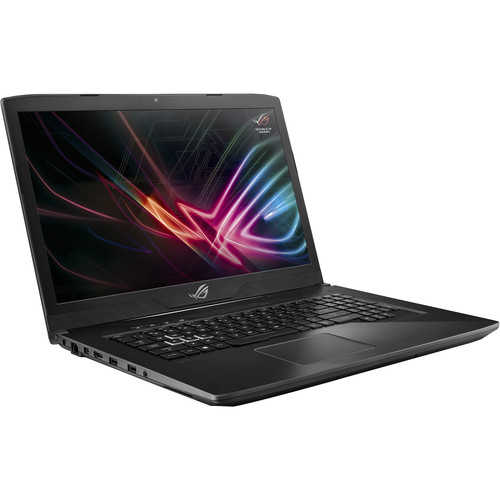

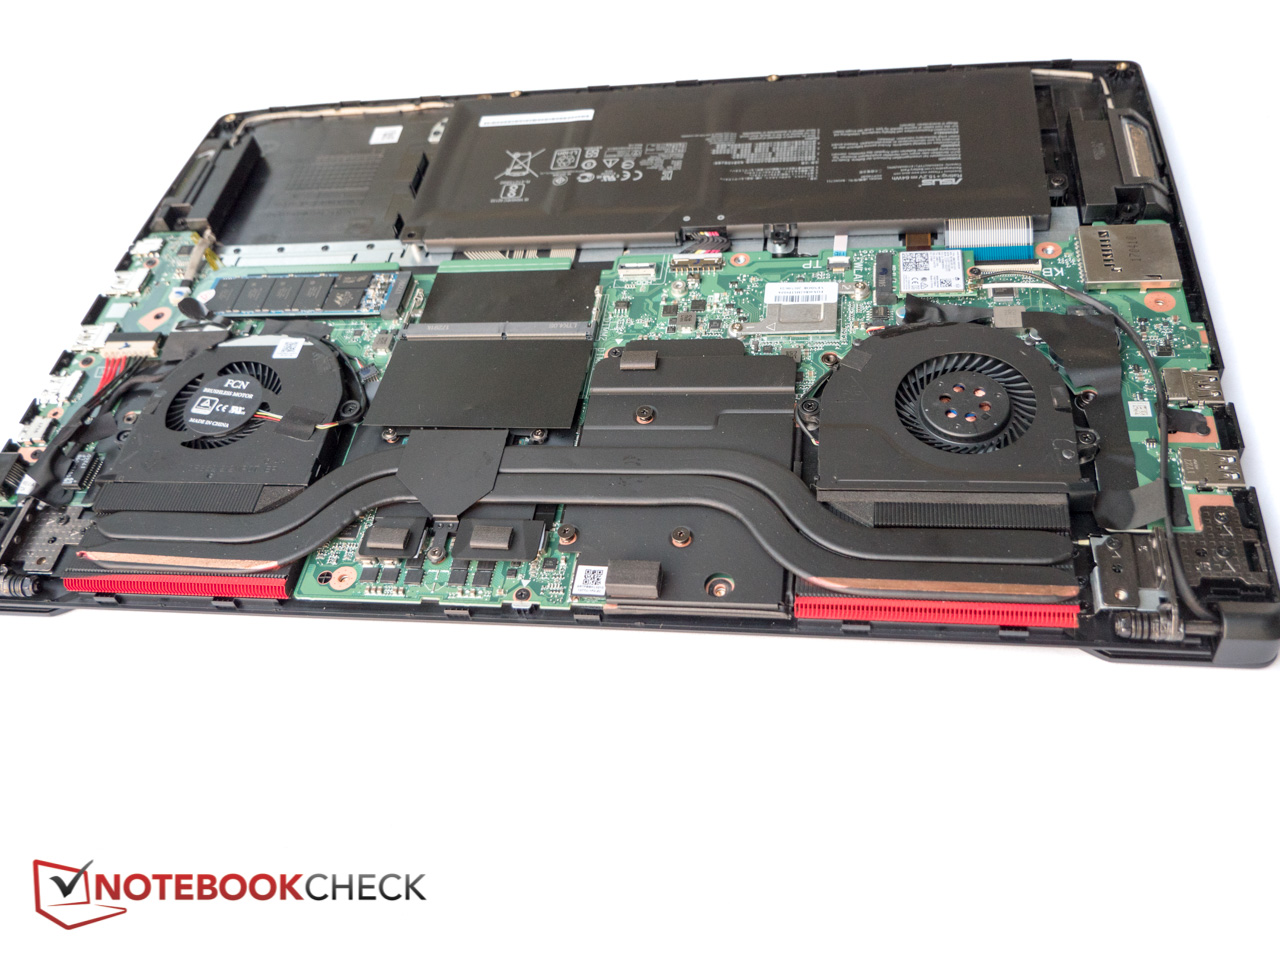
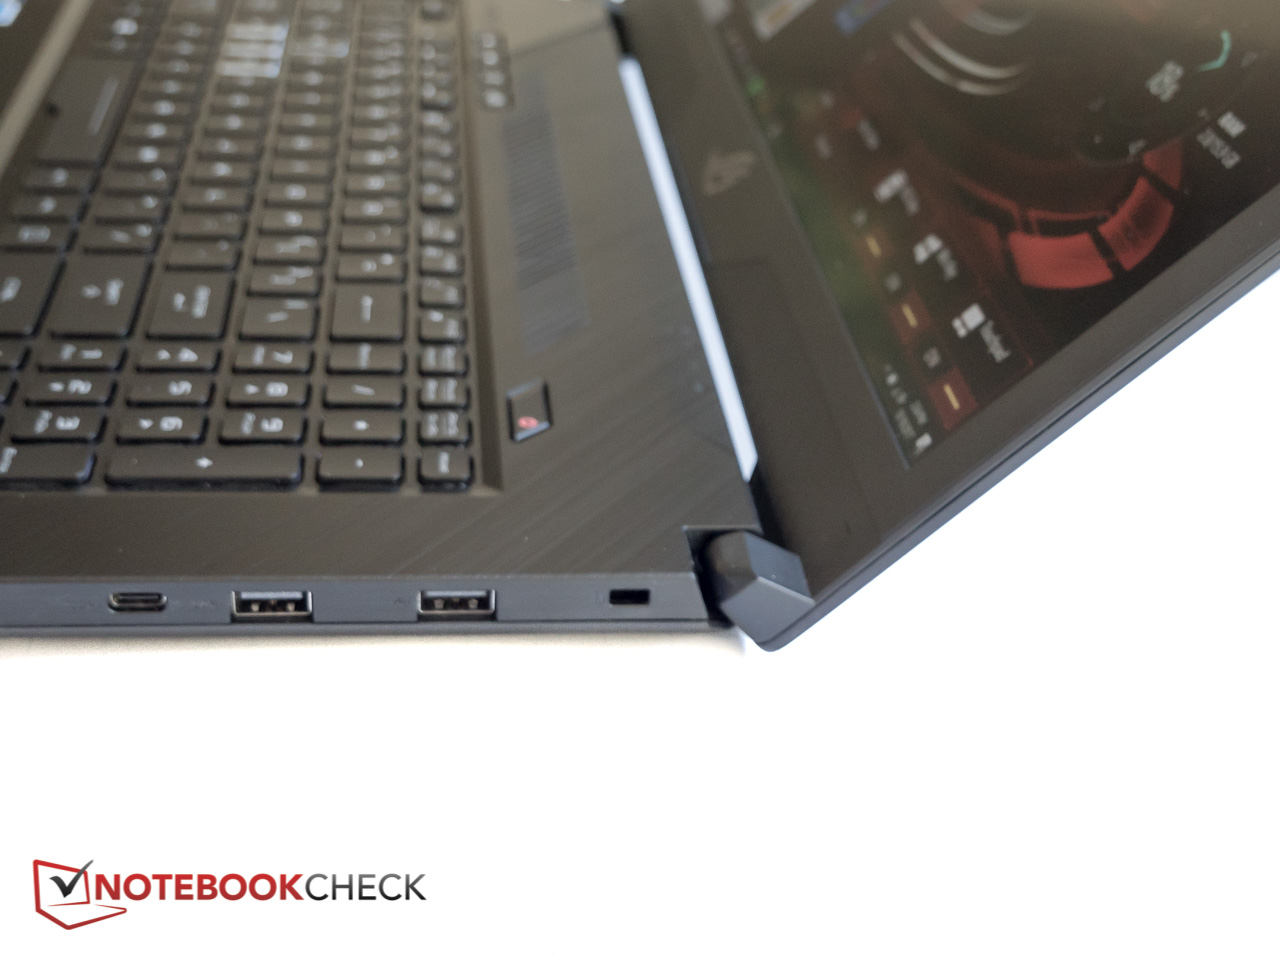
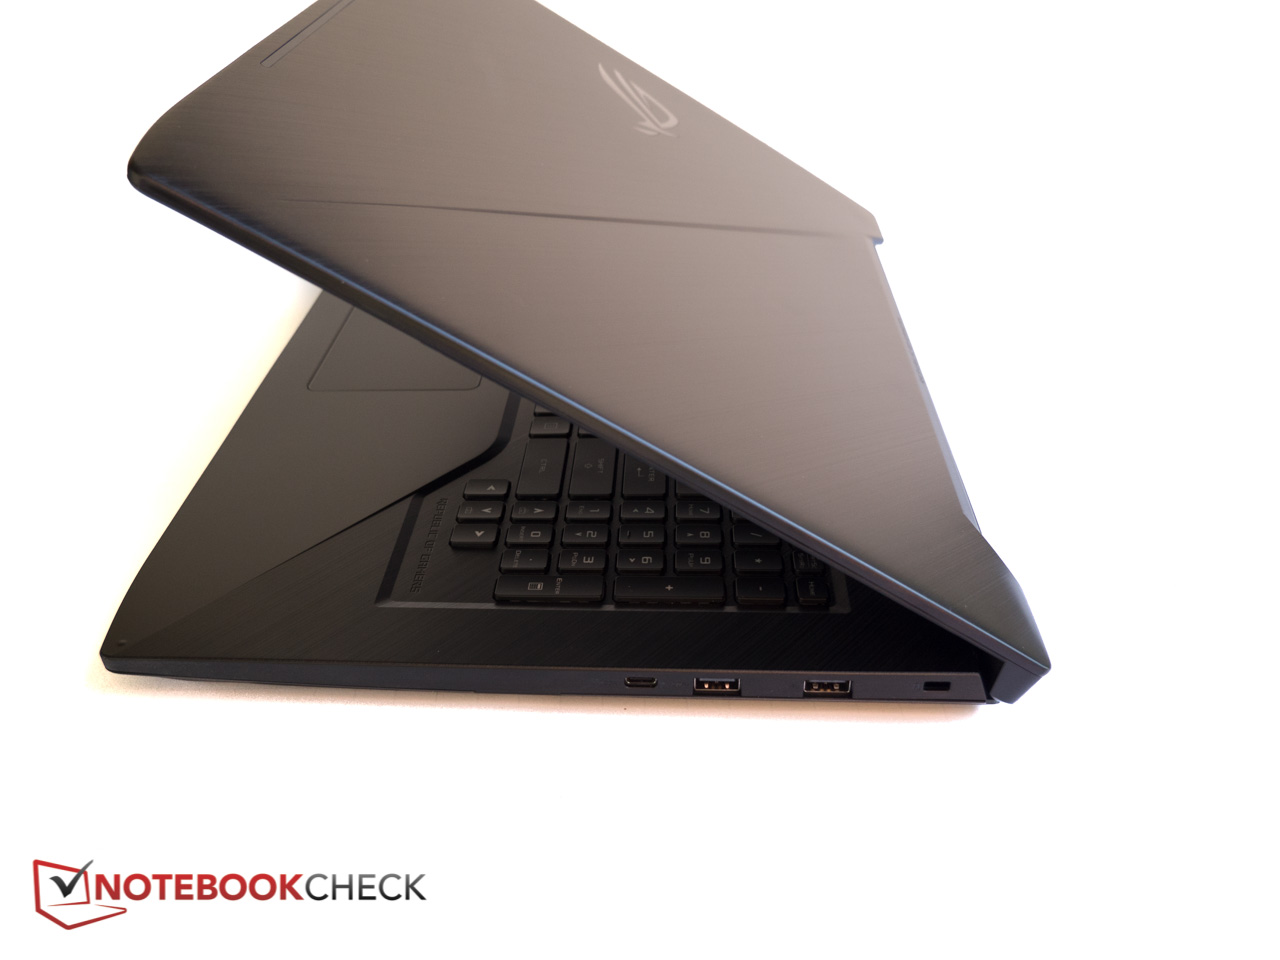
Ficamos com uma impressão mista: por um lado, o Asus ROG Strix GL703VD é um portátil de jogo bem construído e extremamente fino de 17 polegadas que funciona bem, apresenta uma ergonomia decente e vem com uma tela Full HD brilhante e razoavelmente precisa. A combinação do SSD primário e da unidade de armazenamento em disco melhora o desempenho percebido e o portátil rivaliza com alguns Ultrabooks quando se trata dos tempos de duração da bateria.
Há também algumas desvantagens significativas: para um portátil com uma GPU de nível de entrada ou mais, o GL703VD é simplesmente muito barulhento, e também esquenta - pelo menos sob cargas extremas, pois a temperatura da superfície será muito mais fria durante os jogos. Com um máximo de 53 dB e com temperaturas próximas de 70 °C, o portátil pode se tornar tão barulhento e quente quanto alguns gigantes de jogos com CPUs de desktop e placas gráficas topo de linha. Neste ponto, só podemos esperar que a Asus retrabalhe no sistema de resfriamento para as próximas edições do SCAR e do Hero com gráficos GTX 1060 mais poderosos.
Como está agora, infelizmente, não vemos nenhum motivo convincente para escolher o Strix GL703VD sobre muitos outros portáteis de jogos GTX 1050 disponíveis.
Os usuários que procuram um portátil e um portátil de 17,3 polegadas leve e de alto desempenho podem considerar a série Strix GL702. Mesmo quando equipado com uma GTX 1070, o GL702 permanece substancialmente mais frio e não é tão ruidoso. Uma versão com GeForce GTX 1070, i7-7700HQ, 12GB de RAM e SSD de 128GB + HD de 1TB é vendido por apenas $200 a mais do que o portátil da análise no momento da redação.
Asus ROG Strix GL703VD-DB74
- 10/31/2017 v6 (old)
Bernie Pechlaner
Price comparison
