Breve Análise do Portátil Asus GL703GE (Core i7-8750H, GTX 1050 Ti)
| SD Card Reader | |
| average JPG Copy Test (av. of 3 runs) | |
| Média da turma Gaming (20.9 - 210, n=54, últimos 2 anos) | |
| Asus GL703GE-ES73 (Toshiba Exceria Pro SDXC 64 GB UHS-II) | |
| HP Omen 17-w206ng (Toshiba Exceria Pro SDXC 64 GB UHS-II) | |
| Asus Strix GL703VM-DB74 (Toshiba Exceria Pro SDXC 64 GB UHS-II) | |
| MSI GE72 7RE-046 (Toshiba Exceria Pro SDXC 64 GB UHS-II) | |
| maximum AS SSD Seq Read Test (1GB) | |
| Média da turma Gaming (25.5 - 261, n=51, últimos 2 anos) | |
| Asus Strix GL703VM-DB74 (Toshiba Exceria Pro SDXC 64 GB UHS-II) | |
| Asus GL703GE-ES73 (Toshiba Exceria Pro SDXC 64 GB UHS-II) | |
| HP Omen 17-w206ng (Toshiba Exceria Pro SDXC 64 GB UHS-II) | |
| MSI GE72 7RE-046 (Toshiba Exceria Pro SDXC 64 GB UHS-II) | |
| Networking | |
| iperf3 transmit AX12 | |
| Asus GL703GE-ES73 | |
| HP Omen 17-w206ng | |
| Asus Strix GL703VM-DB74 | |
| MSI GE72 7RE-046 | |
| iperf3 receive AX12 | |
| HP Omen 17-w206ng | |
| Asus GL703GE-ES73 | |
| Asus Strix GL703VM-DB74 | |
| MSI GE72 7RE-046 | |
| |||||||||||||||||||||||||
iluminação: 86 %
iluminação com acumulador: 331.1 cd/m²
Contraste: 1068:1 (Preto: 0.31 cd/m²)
ΔE ColorChecker Calman: 2.86 | ∀{0.5-29.43 Ø4.71}
calibrated: 2.66
ΔE Greyscale Calman: 4.3 | ∀{0.09-98 Ø4.96}
100% sRGB (Argyll 1.6.3 3D)
75% AdobeRGB 1998 (Argyll 1.6.3 3D)
83.1% AdobeRGB 1998 (Argyll 3D)
99.8% sRGB (Argyll 3D)
90.1% Display P3 (Argyll 3D)
Gamma: 2.268
CCT: 7034 K
| Asus GL703GE-ES73 Chi Mei CMN1747, TN, 17.3", 1920x1080 | Asus Strix GL703VM-DB74 AU Optronics B173HAN01.1, IPS, 17.3", 1920x1080 | HP Omen 17-w206ng Chi Mei CMN1738, IPS, 17.3", 1920x1080 | MSI GE72 7RE-046 N173HHE-G32 (CMN1747), TN LED, 17.3", 1920x1080 | |
|---|---|---|---|---|
| Display | -23% | -17% | 1% | |
| Display P3 Coverage (%) | 90.1 | 61.5 -32% | 67.2 -25% | 90.7 1% |
| sRGB Coverage (%) | 99.8 | 87.2 -13% | 93.1 -7% | 99.9 0% |
| AdobeRGB 1998 Coverage (%) | 83.1 | 62.7 -25% | 67.4 -19% | 85.2 3% |
| Response Times | -172% | -212% | -68% | |
| Response Time Grey 50% / Grey 80% * (ms) | 11.6 ? | 30.8 ? -166% | 38 ? -228% | 27 ? -133% |
| Response Time Black / White * (ms) | 8.8 ? | 24.4 ? -177% | 26 ? -195% | 9 ? -2% |
| PWM Frequency (Hz) | 26040 ? | 200 ? | ||
| Screen | -17% | -12% | -24% | |
| Brightness middle (cd/m²) | 331.1 | 319.5 -4% | 318 -4% | 253 -24% |
| Brightness (cd/m²) | 312 | 293 -6% | 295 -5% | 230 -26% |
| Brightness Distribution (%) | 86 | 67 -22% | 79 -8% | 86 0% |
| Black Level * (cd/m²) | 0.31 | 0.65 -110% | 0.25 19% | 0.24 23% |
| Contrast (:1) | 1068 | 492 -54% | 1272 19% | 1054 -1% |
| Colorchecker dE 2000 * | 2.86 | 3.17 -11% | 4.7 -64% | 5.01 -75% |
| Colorchecker dE 2000 max. * | 6.35 | 5.32 16% | 8.8 -39% | 10.4 -64% |
| Colorchecker dE 2000 calibrated * | 2.66 | |||
| Greyscale dE 2000 * | 4.3 | 1.6 63% | 5 -16% | 7.26 -69% |
| Gamma | 2.268 97% | 2.22 99% | 2.28 96% | 2.09 105% |
| CCT | 7034 92% | 6668 97% | 7374 88% | 6329 103% |
| Color Space (Percent of AdobeRGB 1998) (%) | 75 | 56 -25% | 61 -19% | 76 1% |
| Color Space (Percent of sRGB) (%) | 100 | 87 -13% | 93 -7% | 100 0% |
| Média Total (Programa/Configurações) | -71% /
-39% | -80% /
-40% | -30% /
-24% |
* ... menor é melhor
Exibir tempos de resposta
| ↔ Tempo de resposta preto para branco | ||
|---|---|---|
| 8.8 ms ... ascensão ↗ e queda ↘ combinadas | ↗ 6 ms ascensão | 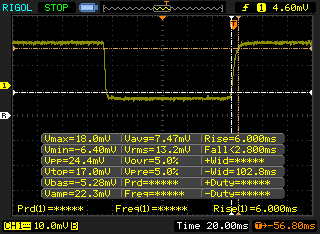 |
| ↘ 2.8 ms queda | ||
| A tela mostra taxas de resposta rápidas em nossos testes e deve ser adequada para jogos. Em comparação, todos os dispositivos testados variam de 0.1 (mínimo) a 240 (máximo) ms. » 25 % de todos os dispositivos são melhores. Isso significa que o tempo de resposta medido é melhor que a média de todos os dispositivos testados (19.8 ms). | ||
| ↔ Tempo de resposta 50% cinza a 80% cinza | ||
| 11.6 ms ... ascensão ↗ e queda ↘ combinadas | ↗ 6 ms ascensão | 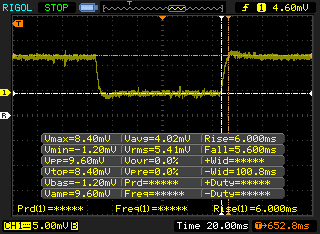 |
| ↘ 5.6 ms queda | ||
| A tela mostra boas taxas de resposta em nossos testes, mas pode ser muito lenta para jogadores competitivos. Em comparação, todos os dispositivos testados variam de 0.165 (mínimo) a 636 (máximo) ms. » 25 % de todos os dispositivos são melhores. Isso significa que o tempo de resposta medido é melhor que a média de todos os dispositivos testados (30.9 ms). | ||
Cintilação da tela / PWM (modulação por largura de pulso)
| Tela tremeluzindo/PWM detectado | 26040 Hz | ≤ 25 % configuração de brilho | 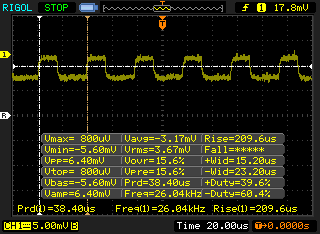 |
A luz de fundo da tela pisca em 26040 Hz (pior caso, por exemplo, utilizando PWM) Cintilação detectada em uma configuração de brilho de 25 % e abaixo. Não deve haver cintilação ou PWM acima desta configuração de brilho. A frequência de 26040 Hz é bastante alta, então a maioria dos usuários sensíveis ao PWM não deve notar nenhuma oscilação. [pwm_comparison] Em comparação: 52 % de todos os dispositivos testados não usam PWM para escurecer a tela. Se PWM foi detectado, uma média de 7741 (mínimo: 5 - máximo: 343500) Hz foi medida. | |||
* ... menor é melhor
| PCMark 8 Home Score Accelerated v2 | 4148 pontos | |
| PCMark 8 Creative Score Accelerated v2 | 5254 pontos | |
| PCMark 8 Work Score Accelerated v2 | 5288 pontos | |
| PCMark 10 Score | 4532 pontos | |
Ajuda | ||
| Asus GL703GE-ES73 Kingston RBUSNS8154P3128GJ | HP Omen 17-w206ng Samsung PM961 MZVLW256HEHP | MSI GE72 7RE-046 Toshiba HG6 THNSNJ256G8NY | Gigabyte Aero 15X v8 Toshiba NVMe THNSN5512GPU7 | Dell XPS 15 9575 i5-8305G Toshiba XG5 KXG50ZNV256G | |
|---|---|---|---|---|---|
| AS SSD | |||||
| Copy Game MB/s (MB/s) | 343.5 | 250.5 -27% | |||
| Copy Program MB/s (MB/s) | 101.8 | 174.9 72% | |||
| Copy ISO MB/s (MB/s) | 443.6 | 392.7 -11% | |||
| Score Total (Points) | 634 | 2172 243% | 969 53% | 2536 300% | 1113 76% |
| Score Write (Points) | 196 | 165 -16% | 324 65% | 939 379% | 307 57% |
| Score Read (Points) | 311 | 1390 347% | 424 36% | 1092 251% | 595 91% |
| Access Time Write * (ms) | 0.07 | 1.881 -2587% | 0.032 54% | 0.046 34% | 0.056 20% |
| Access Time Read * (ms) | 0.27 | 0.056 79% | 0.119 56% | 0.119 56% | 0.146 46% |
| 4K-64 Write (MB/s) | 116 | 129.5 12% | 175.3 51% | 742 540% | 181.2 56% |
| 4K-64 Read (MB/s) | 193.1 | 1101 470% | 351.1 82% | 847 339% | 337.1 75% |
| 4K Write (MB/s) | 59.1 | 1.31 -98% | 101.5 72% | 80.4 36% | 92.7 57% |
| 4K Read (MB/s) | 18.93 | 48.92 158% | 21.41 13% | 23.36 23% | 24.78 31% |
| Seq Write (MB/s) | 212.8 | 346.2 63% | 475.5 123% | 1163 447% | 334.3 57% |
| Seq Read (MB/s) | 993 | 2399 142% | 515 -48% | 2213 123% | 2335 135% |
* ... menor é melhor

| 3DMark 06 Standard Score | 32246 pontos | |
| 3DMark 11 Performance | 9097 pontos | |
| 3DMark Ice Storm Standard Score | 131234 pontos | |
| 3DMark Cloud Gate Standard Score | 25678 pontos | |
| 3DMark Fire Strike Score | 7074 pontos | |
| 3DMark Fire Strike Extreme Score | 3602 pontos | |
Ajuda | ||
| Counter-Strike: GO - 1920x1080 (Very) High, FXAA AA:4x MS AF:8x (classificar por valor) | |
| Asus GL703GE-ES73 | |
| Média NVIDIA GeForce GTX 1050 Ti Mobile (n=1) | |
| The Witcher 3 - 1920x1080 Ultra Graphics & Postprocessing (HBAO+) (classificar por valor) | |
| Asus GL703GE-ES73 | |
| Média NVIDIA GeForce GTX 1050 Ti Mobile (14 - 38, n=31) | |
| Média da turma Gaming (104.7 - 240, n=7, últimos 2 anos) | |
| Rocket League - 1920x1080 High Quality AA:High FX (classificar por valor) | |
| Asus GL703GE-ES73 | |
| Média NVIDIA GeForce GTX 1050 Ti Mobile (106 - 158, n=4) | |
| baixo | média | alto | ultra | |
|---|---|---|---|---|
| Counter-Strike: GO (2012) | 124 | |||
| Dota 2 (2013) | 65 | |||
| The Witcher 3 (2015) | 26 | |||
| Hitman 2016 (2016) | 42 | 41 | ||
| Deus Ex Mankind Divided (2016) | 38 | 19 | ||
| Rocket League (2017) | 108 | |||
| Dirt 4 (2017) | 41 | |||
| Middle-earth: Shadow of War (2017) | 60 | 44 | 37 |
Barulho
| Ocioso |
| 28.2 / 30 / 32 dB |
| Carga |
| 36 / 48.8 dB |
 | ||
30 dB silencioso 40 dB(A) audível 50 dB(A) ruidosamente alto |
||
min: | ||
| Asus GL703GE-ES73 GeForce GTX 1050 Ti Mobile, i7-8750H, Kingston RBUSNS8154P3128GJ | Asus Strix GL703VM-DB74 GeForce GTX 1060 Mobile, i7-7700HQ, Seagate Mobile HDD 1TB ST1000LX015-1U7172 | HP Omen 17-w206ng GeForce GTX 1050 Ti Mobile, i7-7700HQ, Samsung PM961 MZVLW256HEHP | MSI GE72 7RE-046 GeForce GTX 1050 Ti Mobile, i7-7700HQ, Toshiba HG6 THNSNJ256G8NY | MSI GS65 8RF-019DE Stealth Thin GeForce GTX 1070 Max-Q, i7-8750H, Samsung SSD PM981 MZVLB512HAJQ | Gigabyte Aero 15X v8 GeForce GTX 1070 Max-Q, i7-8750H, Toshiba NVMe THNSN5512GPU7 | MSI GV72 7RD-1048XPL GeForce GTX 1050 Mobile, i5-7300HQ, ADATA SX7000NP 128 GB | Dell XPS 15 9575 i5-8305G Vega M GL / 870, i5-8305G, Toshiba XG5 KXG50ZNV256G | Acer Nitro 5 AN515-52 GeForce GTX 1050 Ti Mobile, i5-8300H | |
|---|---|---|---|---|---|---|---|---|---|
| Noise | -3% | -13% | -12% | -2% | -10% | -1% | 6% | ||
| desligado / ambiente * (dB) | 28.2 | 28.4 -1% | 30 -6% | 30 -6% | 30 -6% | 29 -3% | 27.8 1% | ||
| Idle Minimum * (dB) | 28.2 | 30.2 -7% | 34 -21% | 34 -21% | 30 -6% | 30 -6% | 31.1 -10% | 27.8 1% | |
| Idle Average * (dB) | 30 | 30.2 -1% | 35 -17% | 35 -17% | 31 -3% | 31 -3% | 31.1 -4% | 27.8 7% | |
| Idle Maximum * (dB) | 32 | 30.2 6% | 36 -13% | 36 -13% | 34 -6% | 35 -9% | 31.1 3% | 27.8 13% | |
| Load Average * (dB) | 36 | 38.4 -7% | 47 -31% | 41 -14% | 43 -19% | 49 -36% | 38.7 -8% | 35 3% | |
| Witcher 3 ultra * (dB) | 48.8 | 49.7 -2% | 48 2% | 42 14% | 51 -5% | 44.2 9% | |||
| Load Maximum * (dB) | 48.8 | 54.5 -12% | 52 -7% | 49 -0% | 44 10% | 54 -11% | 42.5 13% | 44.2 9% |
* ... menor é melhor
(-) A temperatura máxima no lado superior é 58.6 °C / 137 F, em comparação com a média de 40.4 °C / 105 F , variando de 21.2 a 68.8 °C para a classe Gaming.
(-) A parte inferior aquece até um máximo de 59.4 °C / 139 F, em comparação com a média de 43.2 °C / 110 F
(+) Em uso inativo, a temperatura média para o lado superior é 27.3 °C / 81 F, em comparação com a média do dispositivo de 33.9 °C / ### class_avg_f### F.
(±) Jogando The Witcher 3, a temperatura média para o lado superior é 35.6 °C / 96 F, em comparação com a média do dispositivo de 33.9 °C / ## #class_avg_f### F.
(+) Os apoios para as mãos e o touchpad são mais frios que a temperatura da pele, com um máximo de 25.8 °C / 78.4 F e, portanto, são frios ao toque.
(+) A temperatura média da área do apoio para as mãos de dispositivos semelhantes foi 28.8 °C / 83.8 F (+3 °C / 5.4 F).
| Asus GL703GE-ES73 GeForce GTX 1050 Ti Mobile, i7-8750H, Kingston RBUSNS8154P3128GJ | Asus Strix GL703VM-DB74 GeForce GTX 1060 Mobile, i7-7700HQ, Seagate Mobile HDD 1TB ST1000LX015-1U7172 | HP Omen 17-w206ng GeForce GTX 1050 Ti Mobile, i7-7700HQ, Samsung PM961 MZVLW256HEHP | MSI GE72 7RE-046 GeForce GTX 1050 Ti Mobile, i7-7700HQ, Toshiba HG6 THNSNJ256G8NY | MSI GS65 8RF-019DE Stealth Thin GeForce GTX 1070 Max-Q, i7-8750H, Samsung SSD PM981 MZVLB512HAJQ | Gigabyte Aero 15X v8 GeForce GTX 1070 Max-Q, i7-8750H, Toshiba NVMe THNSN5512GPU7 | MSI GV72 7RD-1048XPL GeForce GTX 1050 Mobile, i5-7300HQ, ADATA SX7000NP 128 GB | Dell XPS 15 9575 i5-8305G Vega M GL / 870, i5-8305G, Toshiba XG5 KXG50ZNV256G | |
|---|---|---|---|---|---|---|---|---|
| Heat | -7% | 11% | 19% | 18% | 12% | 32% | 25% | |
| Maximum Upper Side * (°C) | 58.6 | 64.6 -10% | 55.6 5% | 45.8 22% | 49 16% | 53 10% | 42.7 27% | 44.8 24% |
| Maximum Bottom * (°C) | 59.4 | 57.2 4% | 57.7 3% | 45.2 24% | 63 -6% | 65 -9% | 38.8 35% | 40 33% |
| Idle Upper Side * (°C) | 35 | 37.6 -7% | 32.2 8% | 31.7 9% | 24 31% | 26 26% | 24.4 30% | 28 20% |
| Idle Bottom * (°C) | 37 | 43 -16% | 27.2 26% | 29.9 19% | 25 32% | 30 19% | 23.2 37% | 29.4 21% |
* ... menor é melhor
Asus GL703GE-ES73 análise de áudio
(-) | alto-falantes não muito altos (###valor### dB)
Graves 100 - 315Hz
(±) | graves reduzidos - em média 6.9% menor que a mediana
(±) | a linearidade dos graves é média (11.6% delta para a frequência anterior)
Médios 400 - 2.000 Hz
(+) | médios equilibrados - apenas 3% longe da mediana
(+) | médios são lineares (4.9% delta para frequência anterior)
Altos 2 - 16 kHz
(+) | agudos equilibrados - apenas 1.4% longe da mediana
(+) | os máximos são lineares (5.5% delta da frequência anterior)
Geral 100 - 16.000 Hz
(+) | o som geral é linear (13.2% diferença em relação à mediana)
Comparado com a mesma classe
» 19% de todos os dispositivos testados nesta classe foram melhores, 4% semelhantes, 77% piores
» O melhor teve um delta de 6%, a média foi 18%, o pior foi 132%
Comparado com todos os dispositivos testados
» 14% de todos os dispositivos testados foram melhores, 3% semelhantes, 84% piores
» O melhor teve um delta de 4%, a média foi 23%, o pior foi 134%
MSI GE72 7RE-046 análise de áudio
(+) | os alto-falantes podem tocar relativamente alto (###valor### dB)
Graves 100 - 315Hz
(-) | quase nenhum baixo - em média 17.2% menor que a mediana
(±) | a linearidade dos graves é média (9.2% delta para a frequência anterior)
Médios 400 - 2.000 Hz
(+) | médios equilibrados - apenas 3.3% longe da mediana
(+) | médios são lineares (4.7% delta para frequência anterior)
Altos 2 - 16 kHz
(+) | agudos equilibrados - apenas 3.3% longe da mediana
(+) | os máximos são lineares (4% delta da frequência anterior)
Geral 100 - 16.000 Hz
(+) | o som geral é linear (13.7% diferença em relação à mediana)
Comparado com a mesma classe
» 21% de todos os dispositivos testados nesta classe foram melhores, 7% semelhantes, 72% piores
» O melhor teve um delta de 6%, a média foi 18%, o pior foi 132%
Comparado com todos os dispositivos testados
» 15% de todos os dispositivos testados foram melhores, 4% semelhantes, 81% piores
» O melhor teve um delta de 4%, a média foi 23%, o pior foi 134%
| desligado | |
| Ocioso | |
| Carga |
|
Key:
min: | |
| Asus GL703GE-ES73 i7-8750H, GeForce GTX 1050 Ti Mobile, Kingston RBUSNS8154P3128GJ, TN, 1920x1080, 17.3" | Asus Strix GL703VM-DB74 i7-7700HQ, GeForce GTX 1060 Mobile, Seagate Mobile HDD 1TB ST1000LX015-1U7172, IPS, 1920x1080, 17.3" | HP Omen 17-w206ng i7-7700HQ, GeForce GTX 1050 Ti Mobile, Samsung PM961 MZVLW256HEHP, IPS, 1920x1080, 17.3" | MSI GE72 7RE-046 i7-7700HQ, GeForce GTX 1050 Ti Mobile, Toshiba HG6 THNSNJ256G8NY, TN LED, 1920x1080, 17.3" | Gigabyte Aero 15X v8 i7-8750H, GeForce GTX 1070 Max-Q, Toshiba NVMe THNSN5512GPU7, IPS, 1920x1080, 15.6" | |
|---|---|---|---|---|---|
| Power Consumption | -13% | 4% | -4% | -9% | |
| Idle Minimum * (Watt) | 12.8 | 17.3 -35% | 11 14% | 14 -9% | 14 -9% |
| Idle Average * (Watt) | 18.1 | 21.8 -20% | 18 1% | 20 -10% | 18 1% |
| Idle Maximum * (Watt) | 24.7 | 23 7% | 24 3% | 25 -1% | 22 11% |
| Load Average * (Watt) | 98.4 | 79.2 20% | 84 15% | 82 17% | 91 8% |
| Witcher 3 ultra * (Watt) | 122.5 | 101 18% | 142 -16% | ||
| Load Maximum * (Watt) | 114.6 | 158.2 -38% | 146 -27% | 135 -18% | 173 -51% |
* ... menor é melhor
| Asus GL703GE-ES73 i7-8750H, GeForce GTX 1050 Ti Mobile, 64 Wh | Asus Strix GL703VM-DB74 i7-7700HQ, GeForce GTX 1060 Mobile, 64 Wh | HP Omen 17-w206ng i7-7700HQ, GeForce GTX 1050 Ti Mobile, 62 Wh | MSI GE72 7RE-046 i7-7700HQ, GeForce GTX 1050 Ti Mobile, 51.4 Wh | Gigabyte Aero 15X v8 i7-8750H, GeForce GTX 1070 Max-Q, 94.24 Wh | MSI GV72 7RD-1048XPL i5-7300HQ, GeForce GTX 1050 Mobile, 41.4 Wh | Dell XPS 15 9575 i5-8305G i5-8305G, Vega M GL / 870, 75 Wh | |
|---|---|---|---|---|---|---|---|
| Duração da bateria | -17% | 87% | -35% | 141% | 0% | 83% | |
| Reader / Idle (h) | 5.8 | 4 -31% | 13.3 129% | 12.7 119% | 5.8 0% | 11.1 91% | |
| WiFi v1.3 (h) | 4.8 | 3.2 -33% | 6.3 31% | 3.1 -35% | 8.6 79% | 9.4 96% | |
| Load (h) | 0.8 | 0.9 13% | 1.6 100% | 2.6 225% | 1.3 63% | ||
| WiFi (h) | 3.3 |
Pro
Contra

O Asus GL703GE é, em essência, um refinamento da linha ROG Strix de 17 polegadas da Asus. A variante GTX 1050 Ti marca muitas caixas de verificação sem deixar muitas coisas de lado. A estrela do show é, sem dúvida, o Intel Core i7-8750H. O novo processador hexa-core certamente chegará para a maioria dos portáteis de jogos este ano, e embora o GL703GE seja uma exibição decente das capacidades do novo processador, pode não ser o melhor. Há uma melhora substancial em relação ao i7-7700HQ de quatro núcleos, mas o GL703GE fica um pouco atrás de outras máquinas 8750H. Ainda assim, a Coffee Lake traz a atualização que os processadores Intel de 45 Watt precisaram por anos e com certeza será aclamada por jogadores e outros usuários avançados.
Embora a GeForce GTX 1050 Ti não seja totalmente capaz de aproveitar o 8750H, ela consegue um bom equilíbrio entre desempenho e eficiência. A tela de 120 Hz torna o dispositivo atraente para os jogadores competitivos. Os jogos parecem nítidos e fluentes, e alguns títulos competitivos podem passar de 100 FPS para aproveitar totalmente a maior taxa de atualização. Uma GTX 1060 ofereceria melhores resultados à custa de mais calor e maior consumo de energia. O resto do dispositivo continua sendo um excelente pacote.
Em resumo, o novo Coffee Lake Core i7-8750H da Intel é um benefício para tarefas que exigem muito do processador. No entanto, apesar da que a nova CPU se posiciona como o ponto de venda, a GTX 1050 Ti não é exatamente a GPU que o 8750H merece. A menos que você precise da CPU atualizada para o trabalho pesado do processador, há poucas razões para atualizar. Com o seu preço de rua recomendado de $1.250 USD, o GL703GE é um valor insatisfatório pelo que oferece; a GPU parece ser uma má combinação para o processador. O GL703VM, que combina uma GTX 1060 e um Core i7-7700HQ, pode ser um valor melhor por apenas $100 adicionais.
Asus GL703GE-ES73
- 05/12/2018 v6 (old)
Sam Medley
Price comparison
