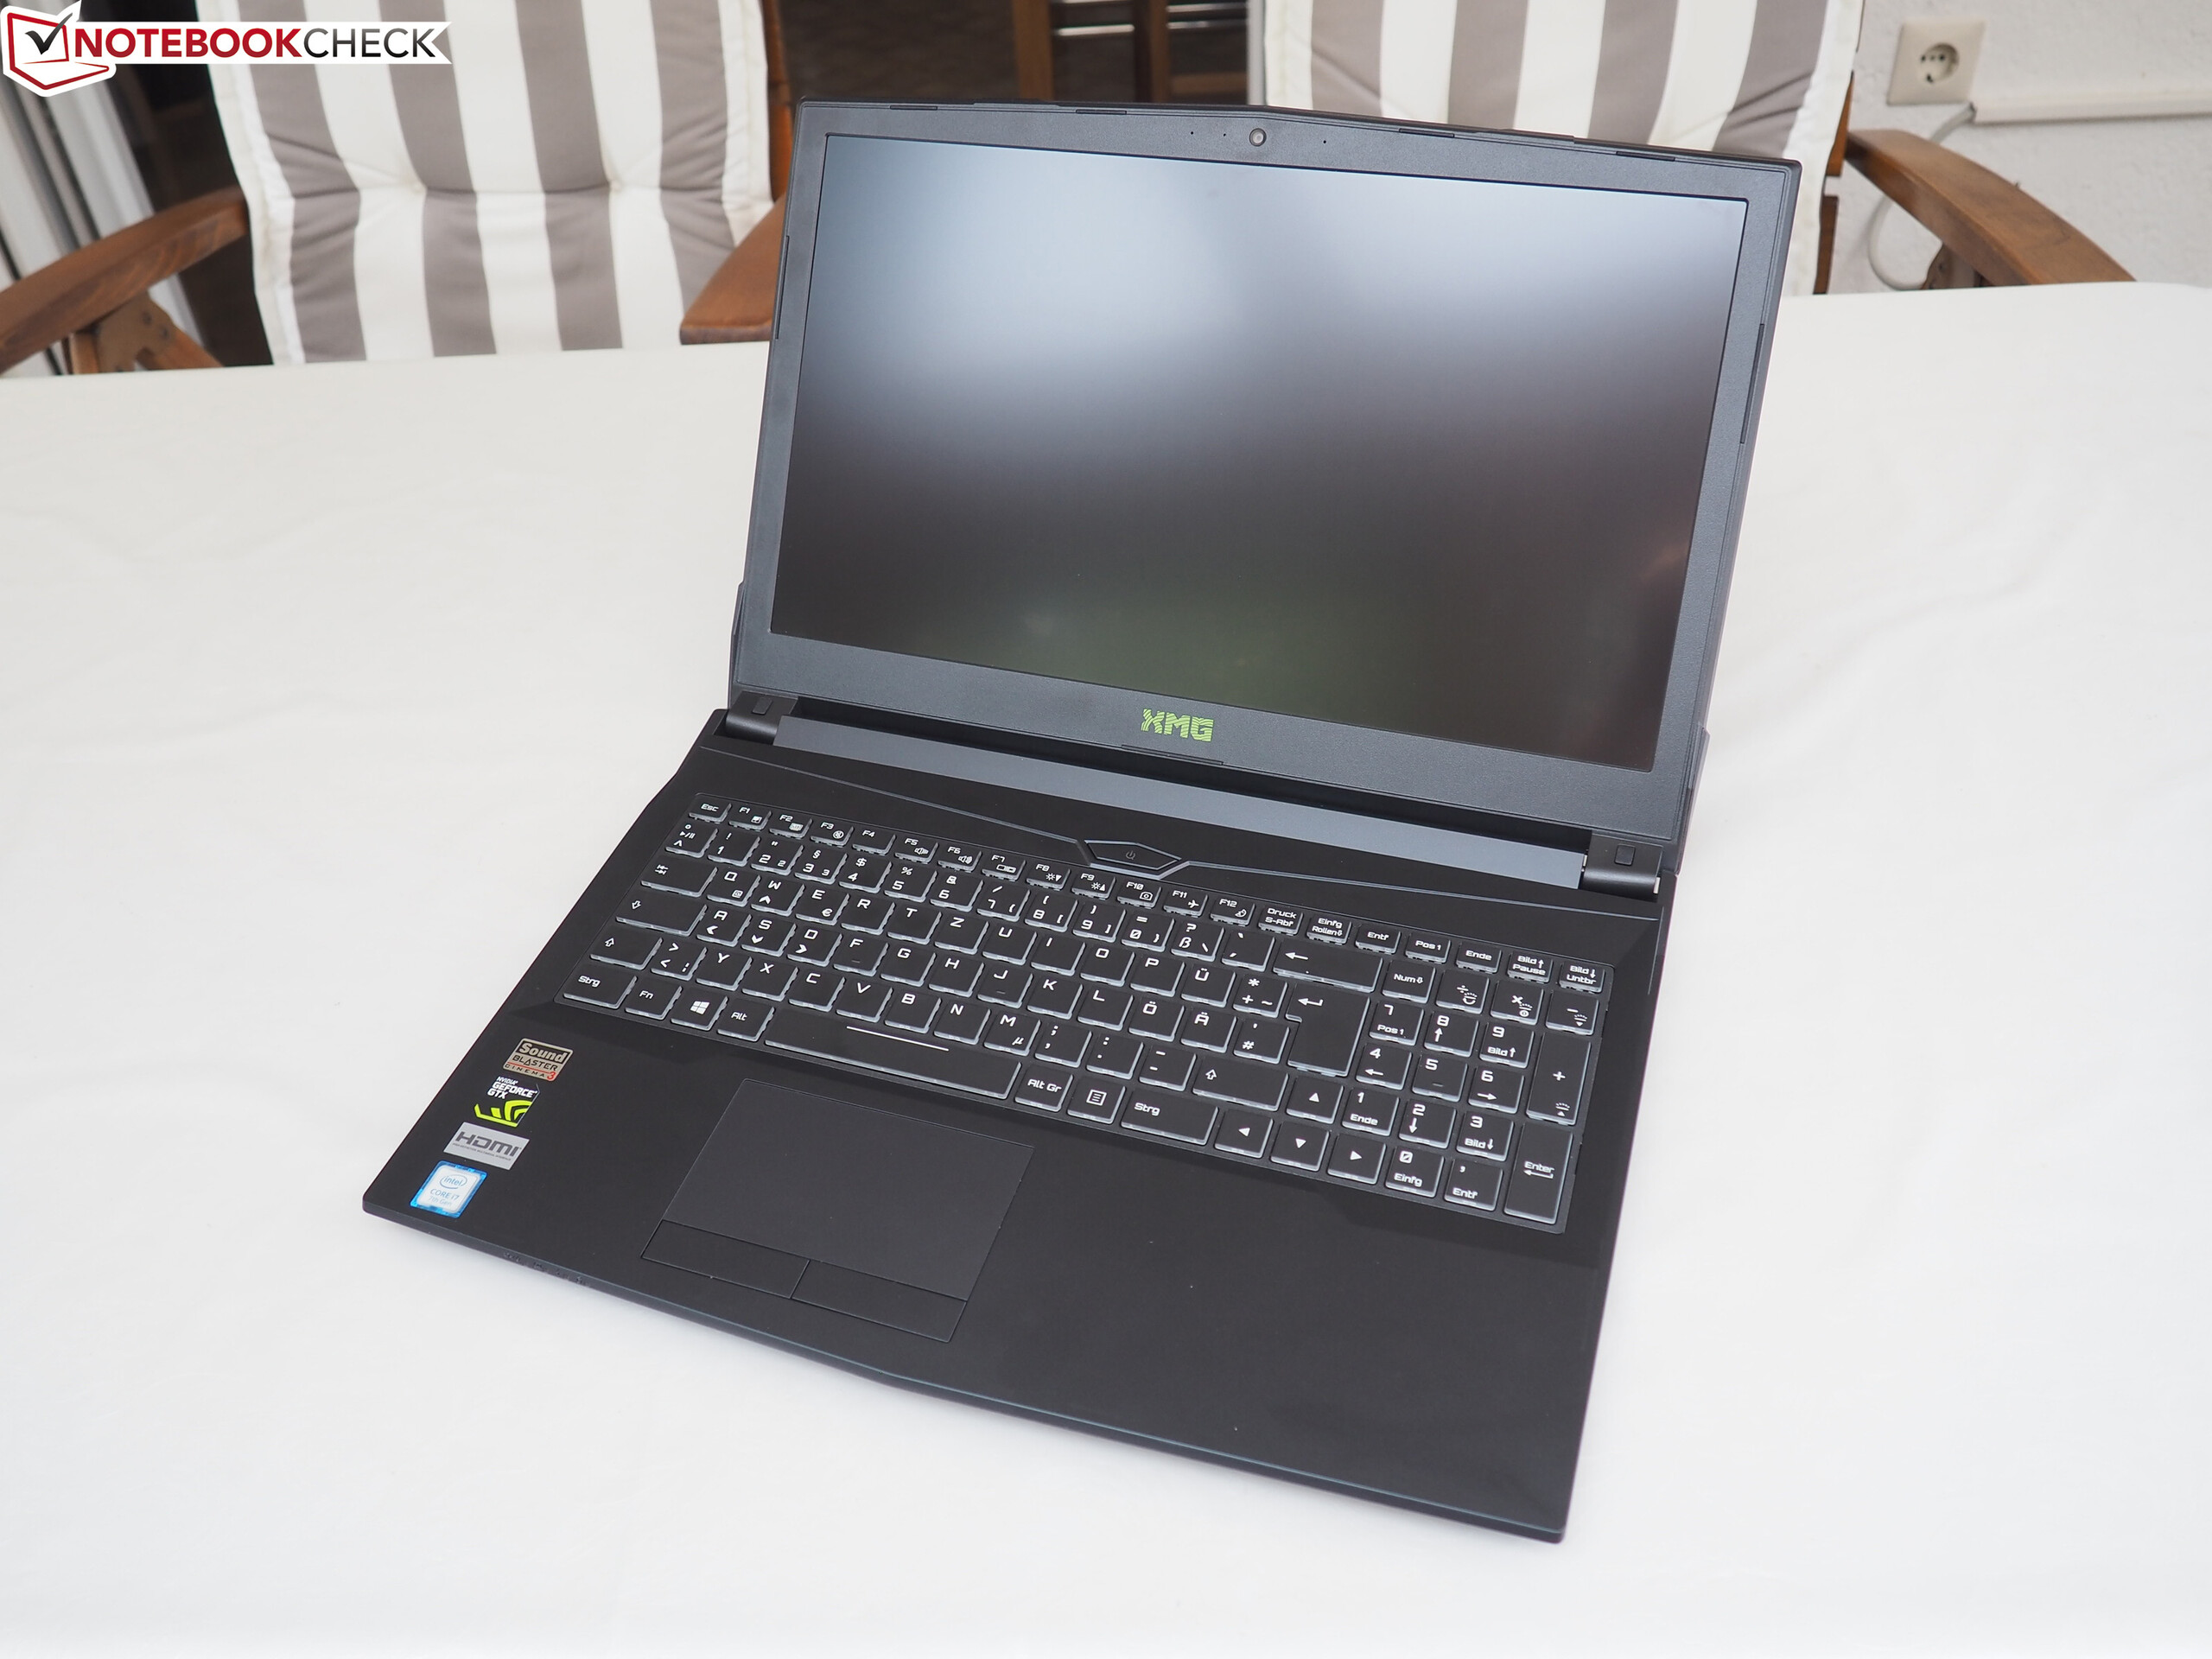
Breve Análise do Portátil Schenker Technologies XMG A517 (Clevo N850HP6)
| SD Card Reader | |
| average JPG Copy Test (av. of 3 runs) | |
| MSI GT62VR 7RE-223 (Toshiba Exceria Pro SDXC 64 GB UHS-II) | |
| Gigabyte Aero 15 (Toshiba Exceria Pro SDXC 64 GB UHS-II) | |
| Schenker XMG A517 (Toshiba Exceria Pro SDXC 64 GB UHS-II) | |
| Acer Aspire VX5-591G-75C4 VX15 | |
| maximum AS SSD Seq Read Test (1GB) | |
| MSI GT62VR 7RE-223 (Toshiba Exceria Pro SDXC 64 GB UHS-II) | |
| Gigabyte Aero 15 (Toshiba Exceria Pro SDXC 64 GB UHS-II) | |
| Schenker XMG A517 (Toshiba Exceria Pro SDXC 64 GB UHS-II) | |
| Acer Aspire VX5-591G-75C4 VX15 | |
| Networking | |
| iperf3 transmit AX12 | |
| Acer Aspire VX5-591G-75C4 VX15 | |
| Schenker XMG A517 | |
| MSI GT62VR 7RE-223 | |
| Alienware 15 R3 | |
| Gigabyte Aero 15 | |
| iperf3 receive AX12 | |
| Schenker XMG A517 | |
| Alienware 15 R3 | |
| Gigabyte Aero 15 | |
| MSI GT62VR 7RE-223 | |
| Acer Aspire VX5-591G-75C4 VX15 | |
| |||||||||||||||||||||||||
iluminação: 90 %
iluminação com acumulador: 320 cd/m²
Contraste: 889:1 (Preto: 0.36 cd/m²)
ΔE ColorChecker Calman: 5.08 | ∀{0.5-29.43 Ø4.71}
ΔE Greyscale Calman: 4.04 | ∀{0.09-98 Ø4.96}
85% sRGB (Argyll 1.6.3 3D)
56% AdobeRGB 1998 (Argyll 1.6.3 3D)
62.2% AdobeRGB 1998 (Argyll 3D)
85.1% sRGB (Argyll 3D)
65% Display P3 (Argyll 3D)
Gamma: 2.34
CCT: 7029 K
| Schenker XMG A517 LG Philips LP156WF6 (LGD046F), 1920x1080 | Alienware 15 R3 HPJGK_B156HTN (AUO51ED), 1920x1080 | MSI GT62VR 7RE-223 LG Philips LP156WF6 (LGD046F), 1920x1080 | Gigabyte Aero 15 N156HCA-EA1 (CMN15D7), 1920x1080 | Acer Aspire VX5-591G-75C4 VX15 LG Philips LGD0550 / LP156WF6-SPK4, 1920x1080 | |
|---|---|---|---|---|---|
| Display | 5% | -2% | 5% | -36% | |
| Display P3 Coverage (%) | 65 | 66 2% | 63.9 -2% | 65.2 0% | 38.88 -40% |
| sRGB Coverage (%) | 85.1 | 90.5 6% | 83.1 -2% | 92.5 9% | 58.2 -32% |
| AdobeRGB 1998 Coverage (%) | 62.2 | 66.2 6% | 60.8 -2% | 66.5 7% | 40.2 -35% |
| Response Times | 41% | -4% | -26% | 22% | |
| Response Time Grey 50% / Grey 80% * (ms) | 36 ? | 25 ? 31% | 37 ? -3% | 42.8 ? -19% | 22 ? 39% |
| Response Time Black / White * (ms) | 24 ? | 12 ? 50% | 25 ? -4% | 32 ? -33% | 23 ? 4% |
| PWM Frequency (Hz) | 21000 ? | 26000 ? | |||
| Screen | -27% | 3% | -1% | -9% | |
| Brightness middle (cd/m²) | 320 | 386 21% | 310 -3% | 320 0% | 281 -12% |
| Brightness (cd/m²) | 311 | 382 23% | 311 0% | 316 2% | 257 -17% |
| Brightness Distribution (%) | 90 | 93 3% | 85 -6% | 90 0% | 85 -6% |
| Black Level * (cd/m²) | 0.36 | 0.39 -8% | 0.3 17% | 0.36 -0% | 0.32 11% |
| Contrast (:1) | 889 | 990 11% | 1033 16% | 889 0% | 878 -1% |
| Colorchecker dE 2000 * | 5.08 | 10.2 -101% | 4.82 5% | 4.62 9% | 5.16 -2% |
| Colorchecker dE 2000 max. * | 10.73 | 15.81 -47% | 10.14 5% | 9.75 9% | 9.09 15% |
| Greyscale dE 2000 * | 4.04 | 11.28 -179% | 3.94 2% | 6 -49% | 4.57 -13% |
| Gamma | 2.34 94% | 2.23 99% | 2.45 90% | 2.46 89% | 2.59 85% |
| CCT | 7029 92% | 11383 57% | 6877 95% | 6761 96% | 6931 94% |
| Color Space (Percent of AdobeRGB 1998) (%) | 56 | 59 5% | 54 -4% | 60 7% | 37 -34% |
| Color Space (Percent of sRGB) (%) | 85 | 90 6% | 83 -2% | 92 8% | 58 -32% |
| Média Total (Programa/Configurações) | 6% /
-11% | -1% /
1% | -7% /
-3% | -8% /
-10% |
* ... menor é melhor
Exibir tempos de resposta
| ↔ Tempo de resposta preto para branco | ||
|---|---|---|
| 24 ms ... ascensão ↗ e queda ↘ combinadas | ↗ 12.4 ms ascensão | 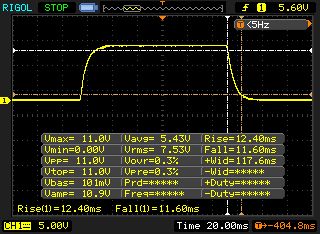 |
| ↘ 11.6 ms queda | ||
| A tela mostra boas taxas de resposta em nossos testes, mas pode ser muito lenta para jogadores competitivos. Em comparação, todos os dispositivos testados variam de 0.1 (mínimo) a 240 (máximo) ms. » 54 % de todos os dispositivos são melhores. Isso significa que o tempo de resposta medido é pior que a média de todos os dispositivos testados (19.8 ms). | ||
| ↔ Tempo de resposta 50% cinza a 80% cinza | ||
| 36 ms ... ascensão ↗ e queda ↘ combinadas | ↗ 18 ms ascensão | 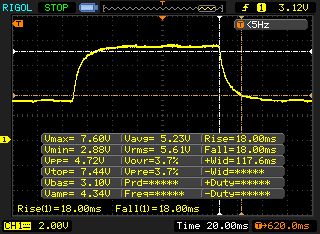 |
| ↘ 18 ms queda | ||
| A tela mostra taxas de resposta lentas em nossos testes e será insatisfatória para os jogadores. Em comparação, todos os dispositivos testados variam de 0.165 (mínimo) a 636 (máximo) ms. » 51 % de todos os dispositivos são melhores. Isso significa que o tempo de resposta medido é pior que a média de todos os dispositivos testados (30.9 ms). | ||
Cintilação da tela / PWM (modulação por largura de pulso)
| Tela tremeluzindo/PWM detectado | 21000 Hz | ≤ 95 % configuração de brilho | 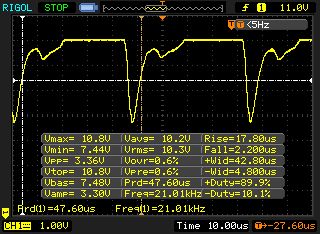 |
A luz de fundo da tela pisca em 21000 Hz (pior caso, por exemplo, utilizando PWM) Cintilação detectada em uma configuração de brilho de 95 % e abaixo. Não deve haver cintilação ou PWM acima desta configuração de brilho. A frequência de 21000 Hz é bastante alta, então a maioria dos usuários sensíveis ao PWM não deve notar nenhuma oscilação. [pwm_comparison] Em comparação: 52 % de todos os dispositivos testados não usam PWM para escurecer a tela. Se PWM foi detectado, uma média de 7748 (mínimo: 5 - máximo: 343500) Hz foi medida. | |||
| Cinebench R11.5 | |
| CPU Single 64Bit | |
| Gigabyte Aero 15 | |
| Alienware 15 R3 | |
| MSI GT62VR 7RE-223 | |
| Schenker XMG A517 | |
| CPU Multi 64Bit | |
| Gigabyte Aero 15 | |
| Alienware 15 R3 | |
| MSI GT62VR 7RE-223 | |
| Schenker XMG A517 | |
| PCMark 8 | |
| Home Score Accelerated v2 | |
| MSI GT62VR 7RE-223 | |
| Alienware 15 R3 | |
| Gigabyte Aero 15 | |
| Schenker XMG A517 | |
| Acer Aspire VX5-591G-75C4 VX15 | |
| Work Score Accelerated v2 | |
| MSI GT62VR 7RE-223 | |
| Alienware 15 R3 | |
| Gigabyte Aero 15 | |
| Schenker XMG A517 | |
| Acer Aspire VX5-591G-75C4 VX15 | |
| PCMark 10 - Score | |
| Schenker XMG A517 | |
| PCMark 8 Home Score Accelerated v2 | 4187 pontos | |
| PCMark 8 Work Score Accelerated v2 | 5198 pontos | |
| PCMark 10 Score | 4866 pontos | |
Ajuda | ||
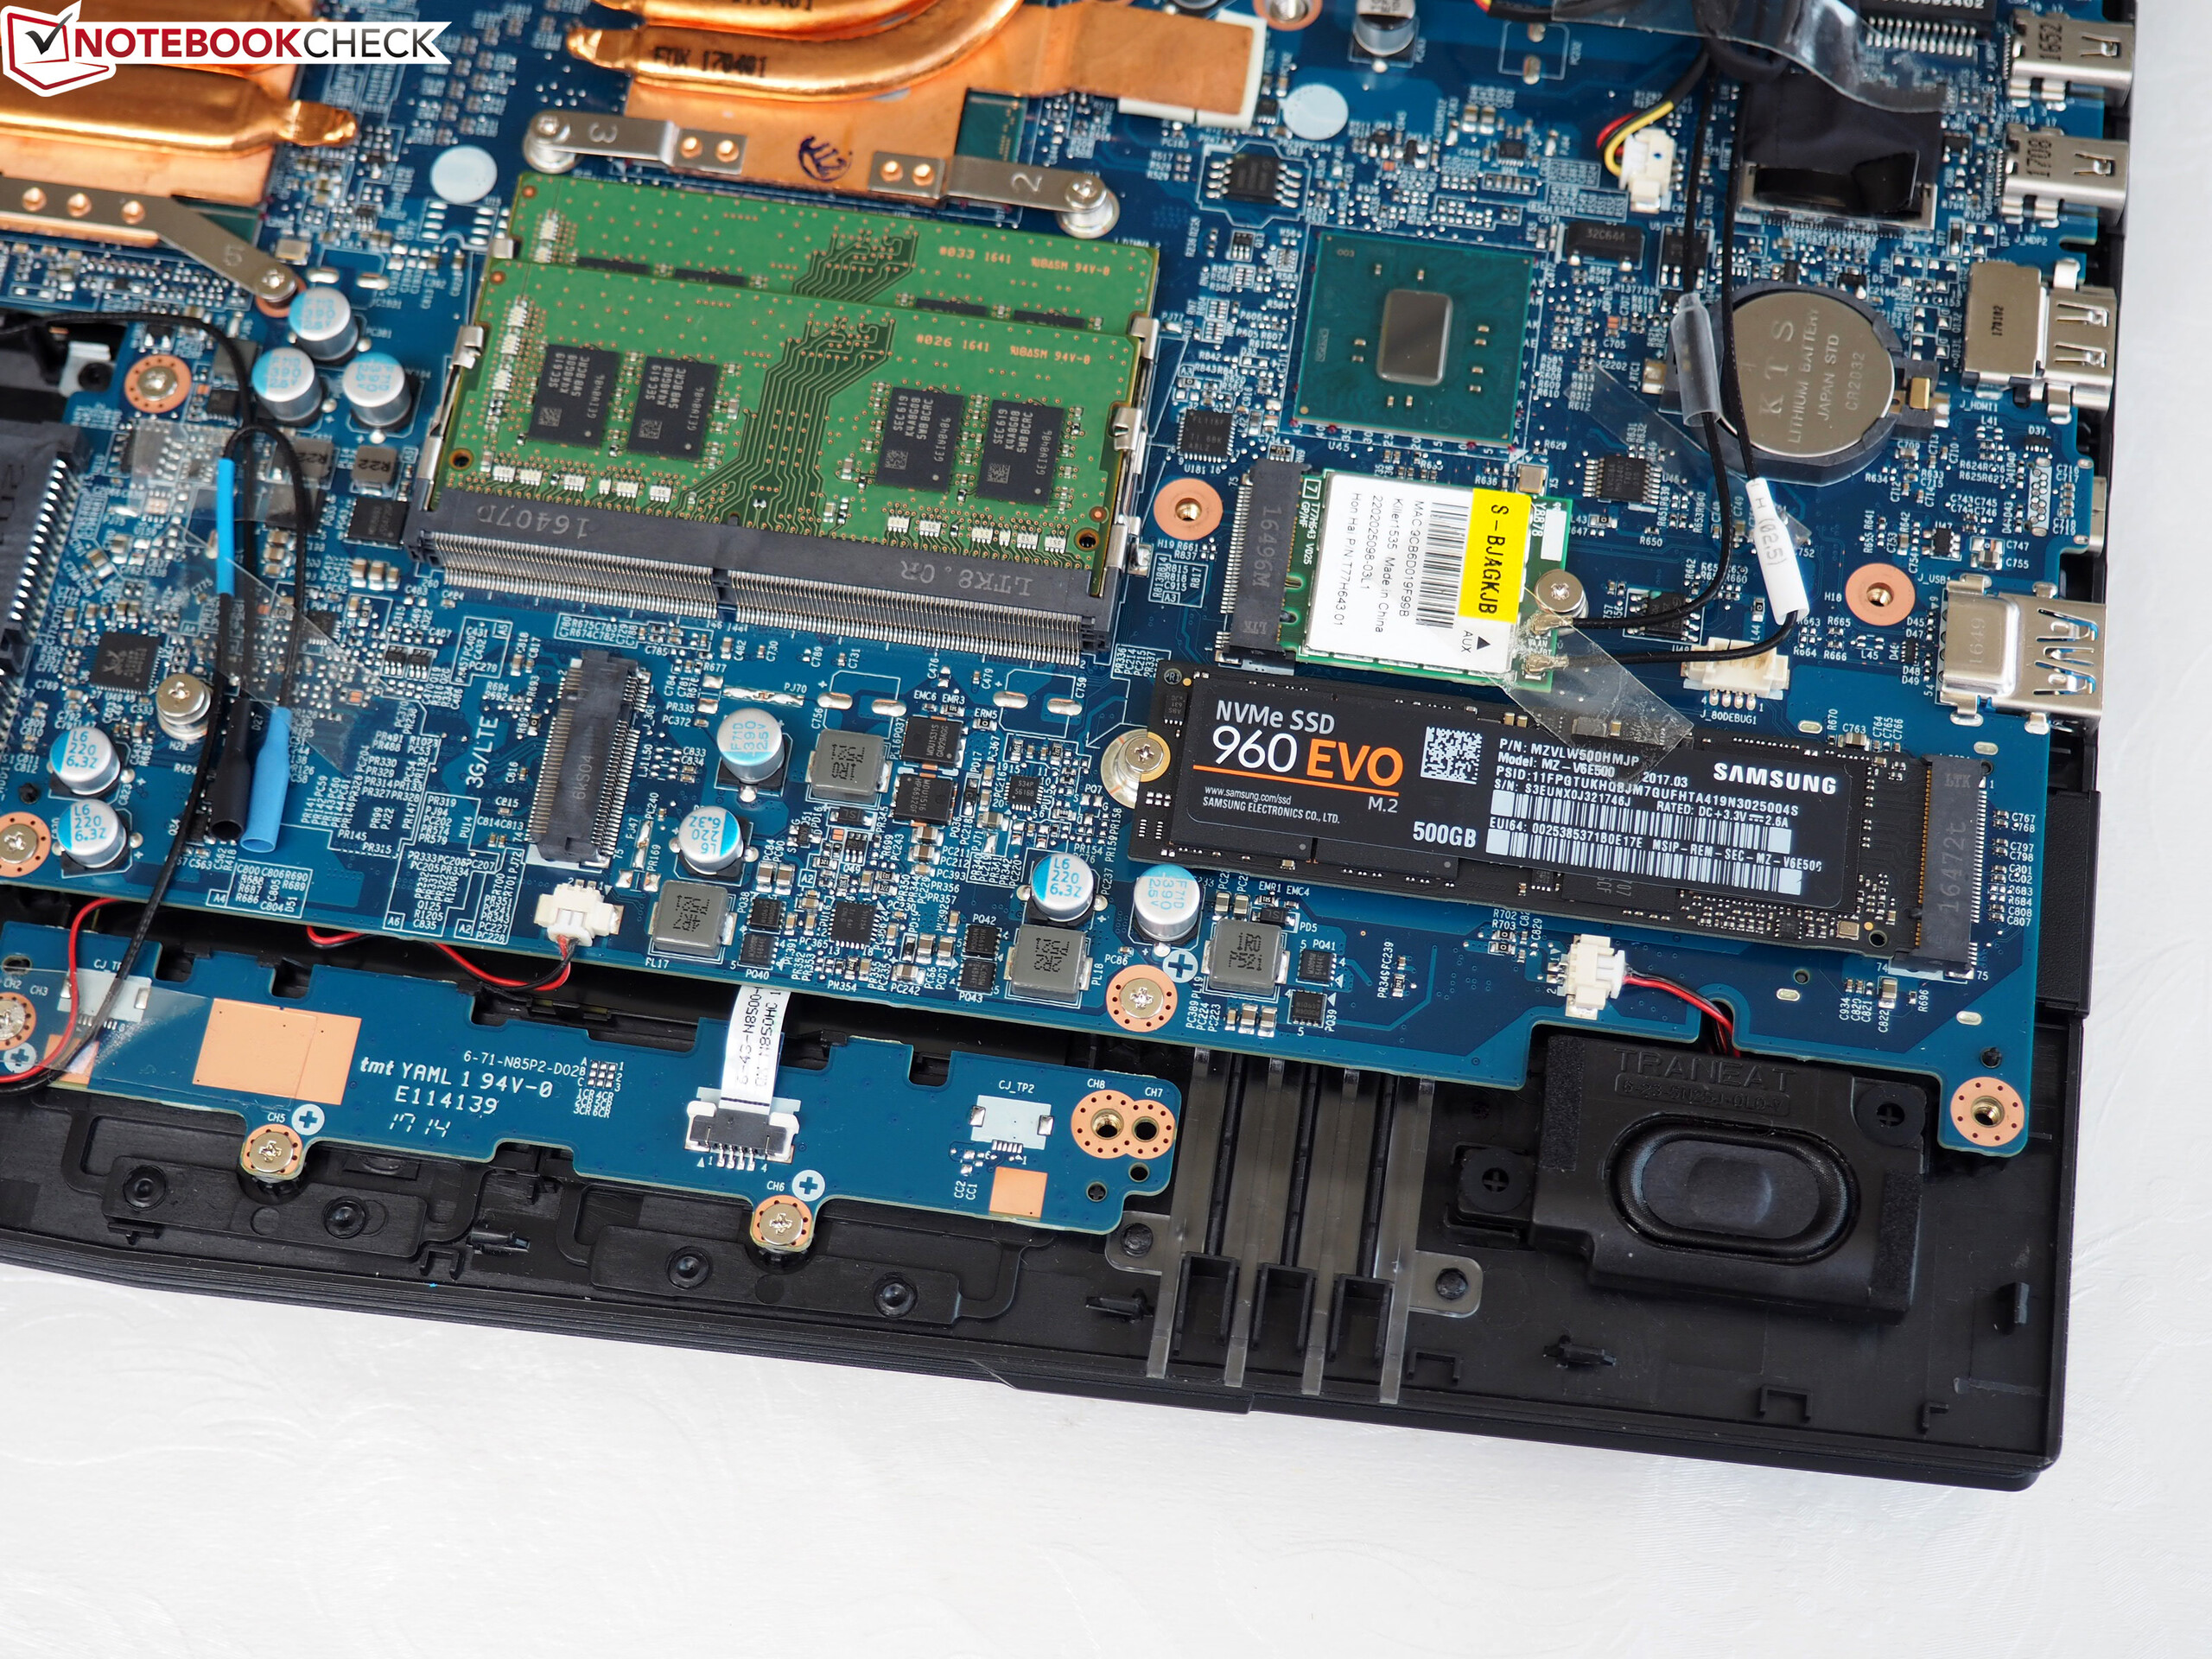
| Schenker XMG A517 Samsung SSD 960 Evo 500GB m.2 NVMe | Alienware 15 R3 | MSI GT62VR 7RE-223 Samsung SSD PM871a MZNLN256HMHQ | Gigabyte Aero 15 Lite-On CX2-8B512-Q11 | Acer Aspire VX5-591G-75C4 VX15 Toshiba MQ01ABD100 | |
|---|---|---|---|---|---|
| AS SSD | -58% | ||||
| Seq Read (MB/s) | 2694 | 510 -81% | |||
| Seq Write (MB/s) | 1662 | 288.2 -83% | |||
| 4K Read (MB/s) | 48 | 37.2 -22% | |||
| 4K Write (MB/s) | 147 | 104 -29% | |||
| Score Total (Points) | 4063 | 1019 -75% |

| 3DMark - 1920x1080 Fire Strike Graphics | |
| Alienware 15 R3 | |
| MSI GT62VR 7RE-223 | |
| Schenker XMG A517 | |
| Gigabyte Aero 15 | |
| Acer Aspire VX5-591G-75C4 VX15 | |
| 3DMark 11 - 1280x720 Performance GPU | |
| Alienware 15 R3 | |
| MSI GT62VR 7RE-223 | |
| Schenker XMG A517 | |
| Gigabyte Aero 15 | |
| Acer Aspire VX5-591G-75C4 VX15 | |
| 3DMark 11 Performance | 12575 pontos | |
| 3DMark Ice Storm Standard Score | 128763 pontos | |
| 3DMark Cloud Gate Standard Score | 25679 pontos | |
| 3DMark Fire Strike Score | 9727 pontos | |
Ajuda | ||
| baixo | média | alto | ultra | |
|---|---|---|---|---|
| The Witcher 3 (2015) | 70.9 | 39.2 | ||
| Mass Effect Andromeda (2017) | 52.4 | 47.4 | ||
| Warhammer 40.000: Dawn of War III (2017) | 73.3 | 68.3 | ||
| Prey (2017) | 115 | 97.1 | ||
| Rocket League (2017) | 168 | |||
| Dirt 4 (2017) | 90.1 | 55.3 |
Barulho
| Ocioso |
| 30 / 35 / 40 dB |
| Carga |
| 43 / 49 dB |
 | ||
30 dB silencioso 40 dB(A) audível 50 dB(A) ruidosamente alto |
||
min: | ||
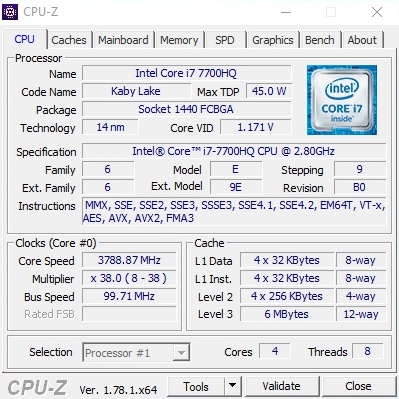
| Schenker XMG A517 i7-7700HQ, GeForce GTX 1060 Mobile | Alienware 15 R3 i7-7700HQ, GeForce GTX 1070 Mobile | MSI GT62VR 7RE-223 i7-7700HQ, GeForce GTX 1070 Mobile | Gigabyte Aero 15 i7-7700HQ, GeForce GTX 1060 Mobile | Acer Aspire VX5-591G-75C4 VX15 i7-7700HQ, GeForce GTX 1050 Ti Mobile | |
|---|---|---|---|---|---|
| Noise | -3% | 2% | 3% | 9% | |
| desligado / ambiente * (dB) | 30 | 30 -0% | 30 -0% | 31 -3% | 30.4 -1% |
| Idle Minimum * (dB) | 30 | 31 -3% | 34 -13% | 32 -7% | 31.4 -5% |
| Idle Average * (dB) | 35 | 32 9% | 35 -0% | 33 6% | 31.4 10% |
| Idle Maximum * (dB) | 40 | 42 -5% | 36 10% | 34 15% | 31.4 22% |
| Load Average * (dB) | 43 | 49 -14% | 40 7% | 39 9% | 36.8 14% |
| Witcher 3 ultra * (dB) | 43 | 43 -0% | |||
| Load Maximum * (dB) | 49 | 50 -2% | 46 6% | 50 -2% | 41.3 16% |
* ... menor é melhor
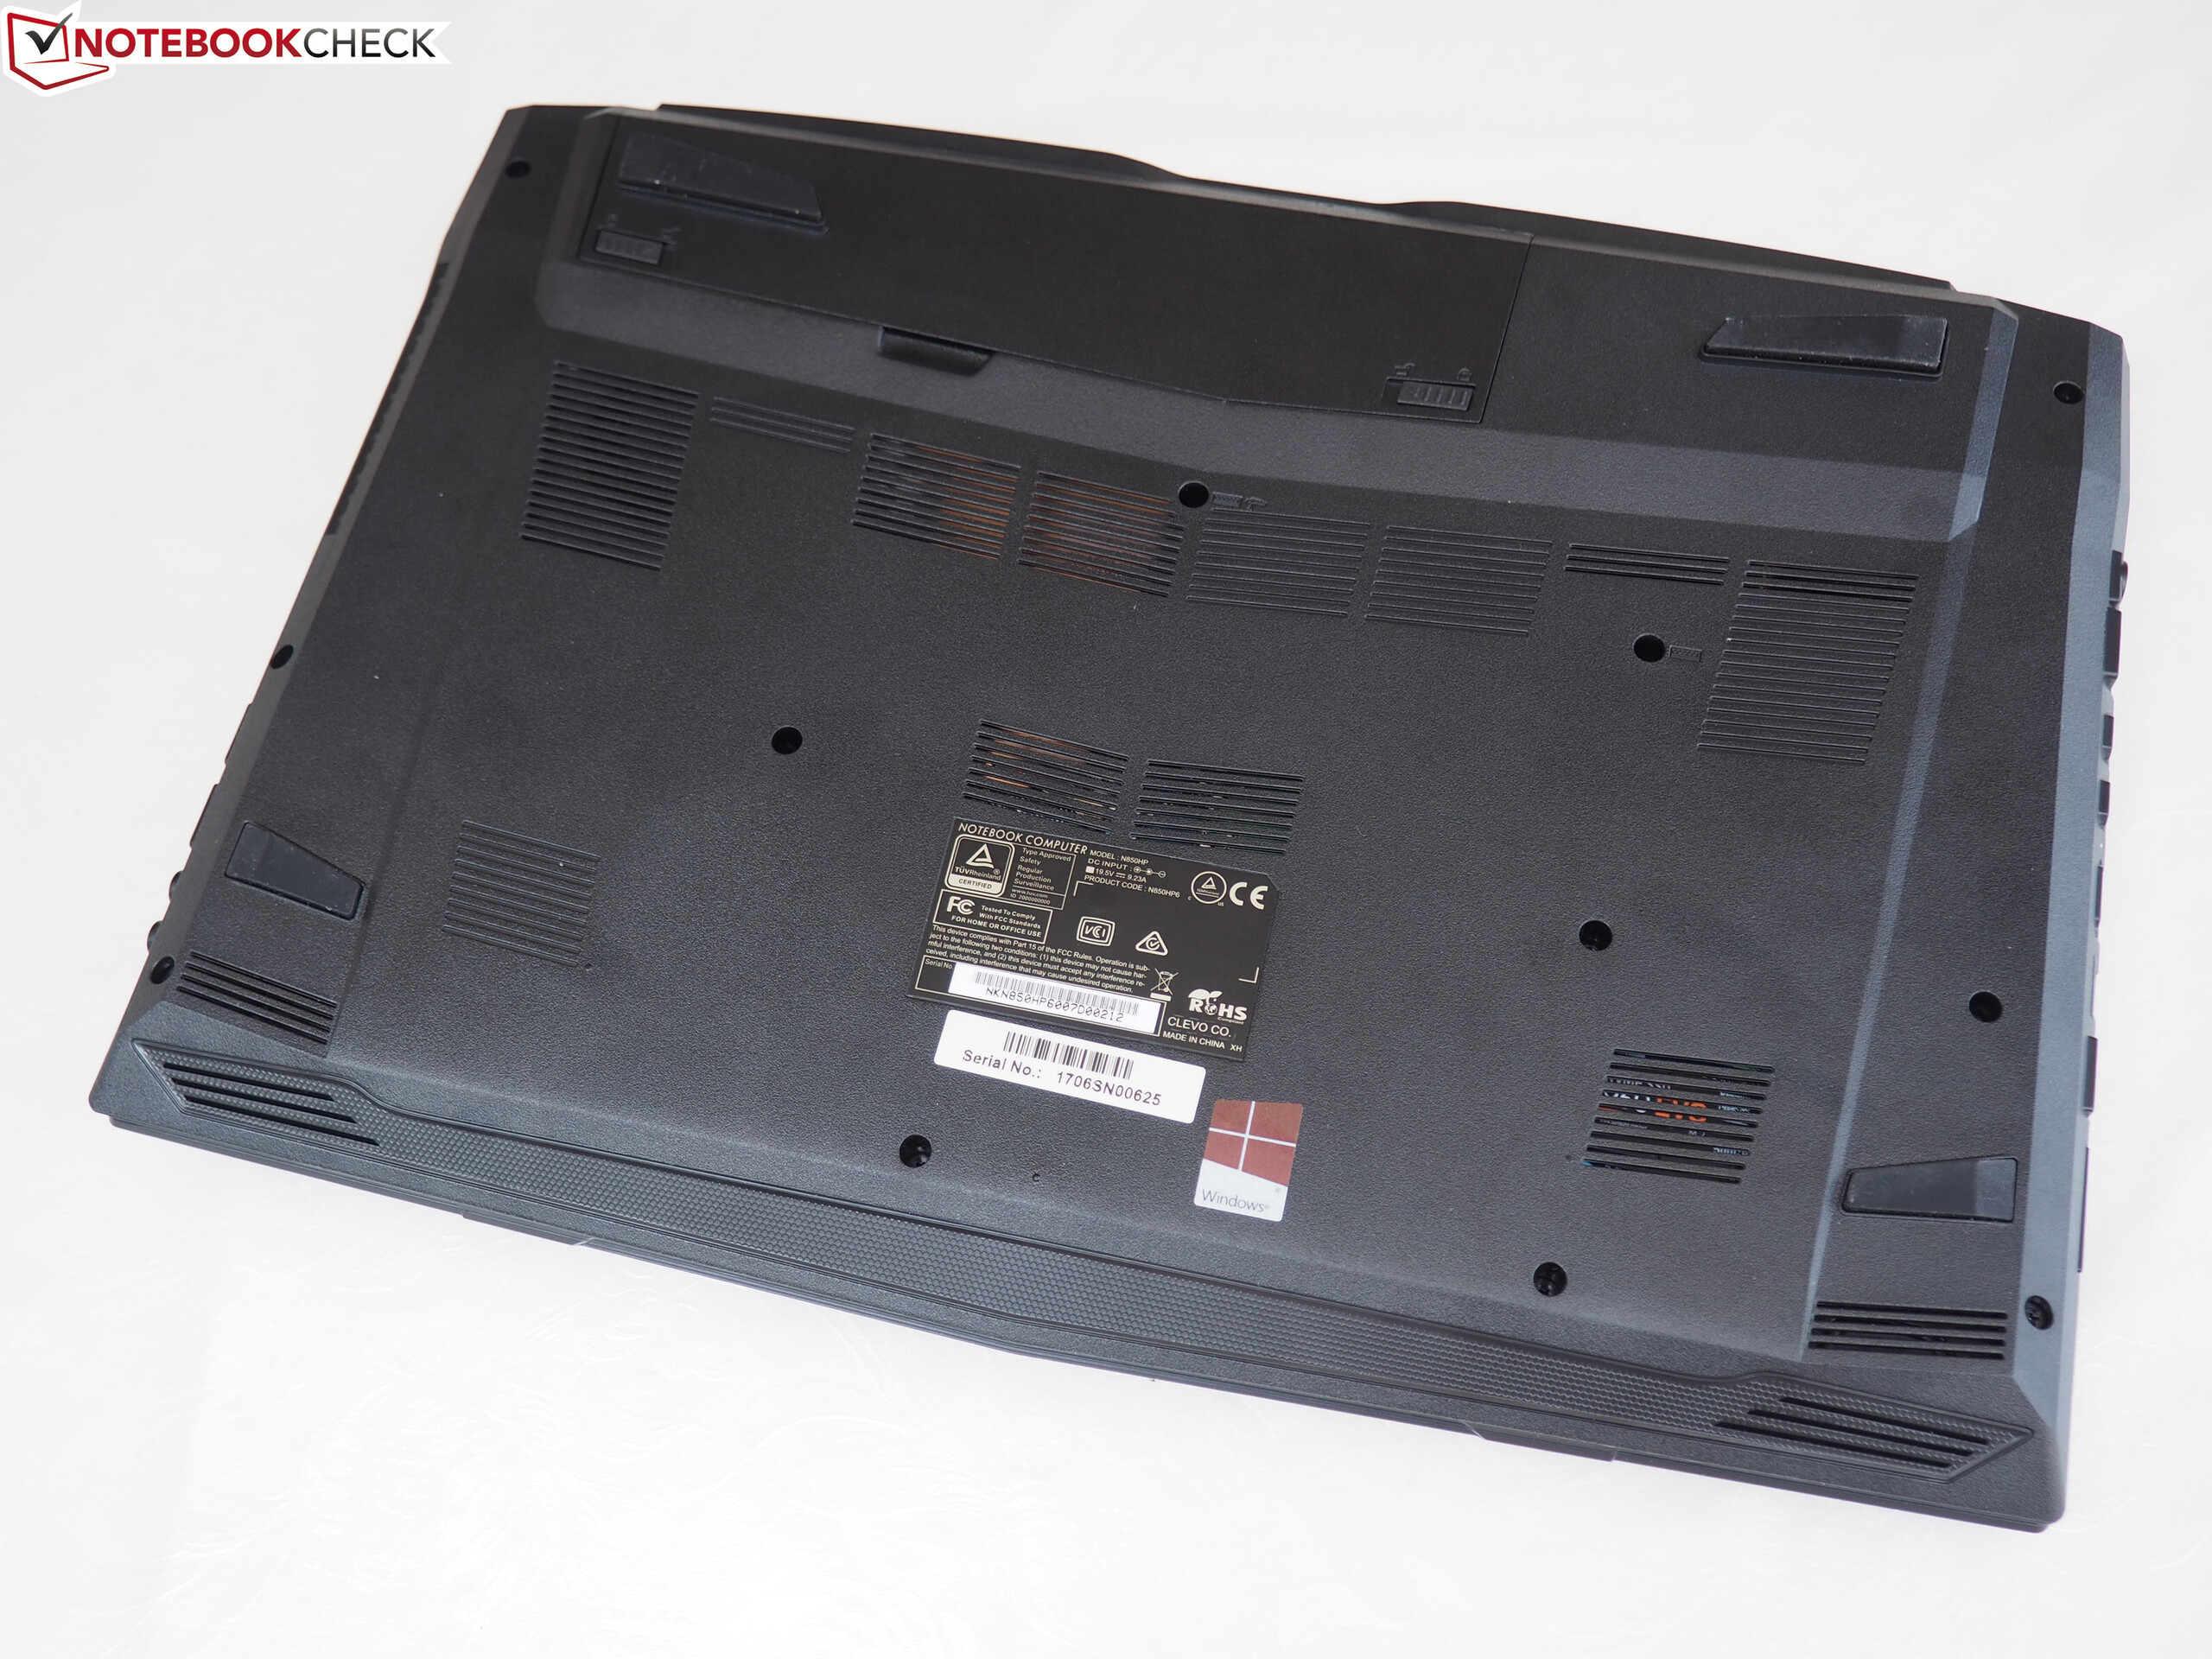
(-) A temperatura máxima no lado superior é 53 °C / 127 F, em comparação com a média de 40.4 °C / 105 F , variando de 21.2 a 68.8 °C para a classe Gaming.
(-) A parte inferior aquece até um máximo de 49 °C / 120 F, em comparação com a média de 43.2 °C / 110 F
(+) Em uso inativo, a temperatura média para o lado superior é 29.6 °C / 85 F, em comparação com a média do dispositivo de 33.9 °C / ### class_avg_f### F.
(-) Jogando The Witcher 3, a temperatura média para o lado superior é 45.4 °C / 114 F, em comparação com a média do dispositivo de 33.9 °C / ## #class_avg_f### F.
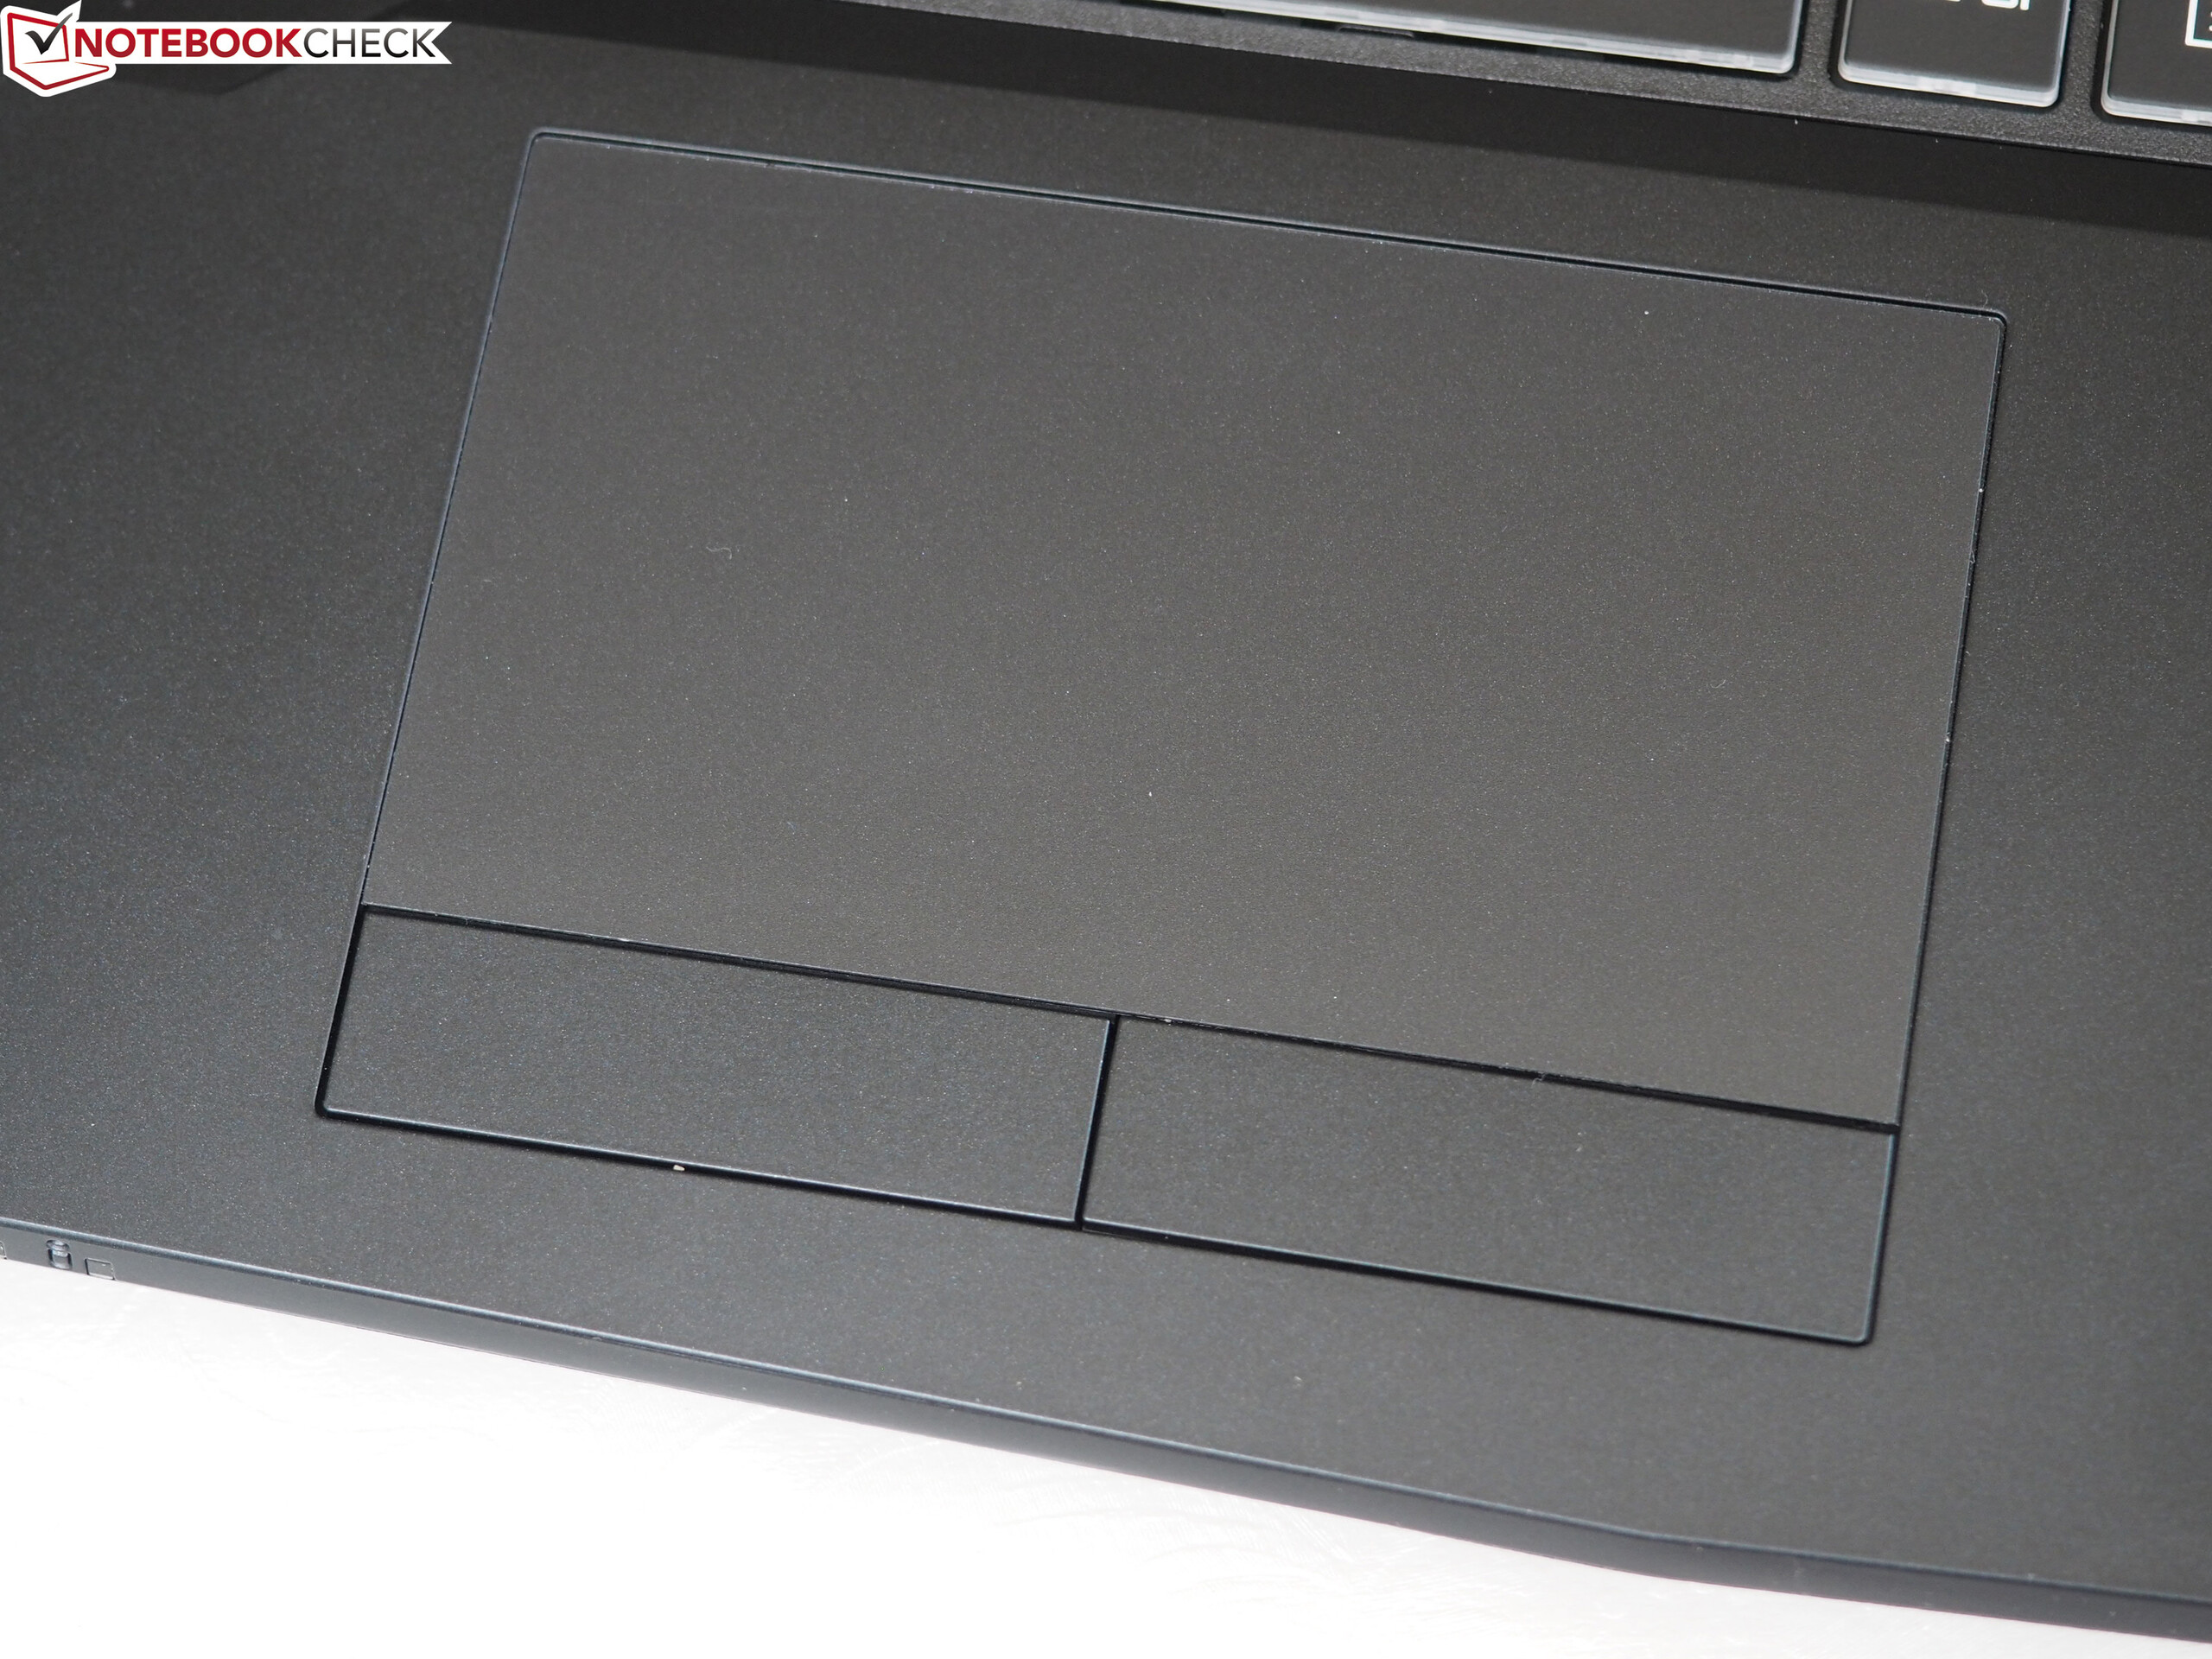
(-) Os apoios para as mãos e o touchpad podem ficar muito quentes ao toque, com um máximo de 49 °C / 120.2 F.
(-) A temperatura média da área do apoio para as mãos de dispositivos semelhantes foi 28.8 °C / 83.8 F (-20.2 °C / -36.4 F).
| Schenker XMG A517 i7-7700HQ, GeForce GTX 1060 Mobile | Alienware 15 R3 i7-7700HQ, GeForce GTX 1070 Mobile | MSI GT62VR 7RE-223 i7-7700HQ, GeForce GTX 1070 Mobile | Gigabyte Aero 15 i7-7700HQ, GeForce GTX 1060 Mobile | Acer Aspire VX5-591G-75C4 VX15 i7-7700HQ, GeForce GTX 1050 Ti Mobile | |
|---|---|---|---|---|---|
| Heat | -8% | 14% | 4% | 10% | |
| Maximum Upper Side * (°C) | 53 | 46 13% | 40.6 23% | 56 -6% | 47 11% |
| Maximum Bottom * (°C) | 49 | 51.8 -6% | 48.4 1% | 61 -24% | 47 4% |
| Idle Upper Side * (°C) | 33 | 36.5 -11% | 26.8 19% | 25 24% | 28.4 14% |
| Idle Bottom * (°C) | 30 | 38.2 -27% | 26.4 12% | 24 20% | 27.1 10% |
* ... menor é melhor
Schenker XMG A517 análise de áudio
(±) | o volume do alto-falante é médio, mas bom (###valor### dB)
Graves 100 - 315Hz
(-) | quase nenhum baixo - em média 24.1% menor que a mediana
(±) | a linearidade dos graves é média (12.1% delta para a frequência anterior)
Médios 400 - 2.000 Hz
(±) | médios mais altos - em média 7.3% maior que a mediana
(±) | a linearidade dos médios é média (9.4% delta para frequência anterior)
Altos 2 - 16 kHz
(±) | máximos mais altos - em média 7.7% maior que a mediana
(±) | a linearidade dos máximos é média (10.1% delta para frequência anterior)
Geral 100 - 16.000 Hz
(±) | a linearidade do som geral é média (29.4% diferença em relação à mediana)
Comparado com a mesma classe
» 95% de todos os dispositivos testados nesta classe foram melhores, 2% semelhantes, 3% piores
» O melhor teve um delta de 6%, a média foi 18%, o pior foi 132%
Comparado com todos os dispositivos testados
» 87% de todos os dispositivos testados foram melhores, 2% semelhantes, 10% piores
» O melhor teve um delta de 4%, a média foi 23%, o pior foi 134%
Gigabyte Aero 15 análise de áudio
(±) | o volume do alto-falante é médio, mas bom (###valor### dB)
Graves 100 - 315Hz
(-) | quase nenhum baixo - em média 23.3% menor que a mediana
(±) | a linearidade dos graves é média (10.7% delta para a frequência anterior)
Médios 400 - 2.000 Hz
(+) | médios equilibrados - apenas 1.8% longe da mediana
(+) | médios são lineares (4.1% delta para frequência anterior)
Altos 2 - 16 kHz
(+) | agudos equilibrados - apenas 2.6% longe da mediana
(+) | os máximos são lineares (5.1% delta da frequência anterior)
Geral 100 - 16.000 Hz
(±) | a linearidade do som geral é média (18.3% diferença em relação à mediana)
Comparado com a mesma classe
» 56% de todos os dispositivos testados nesta classe foram melhores, 7% semelhantes, 38% piores
» O melhor teve um delta de 5%, a média foi 17%, o pior foi 45%
Comparado com todos os dispositivos testados
» 40% de todos os dispositivos testados foram melhores, 8% semelhantes, 52% piores
» O melhor teve um delta de 4%, a média foi 23%, o pior foi 134%
| desligado | |
| Ocioso | |
| Carga |
|
Key:
min: | |
| Schenker XMG A517 i7-7700HQ, GeForce GTX 1060 Mobile | Alienware 15 R3 i7-7700HQ, GeForce GTX 1070 Mobile | MSI GT62VR 7RE-223 i7-7700HQ, GeForce GTX 1070 Mobile | Gigabyte Aero 15 i7-7700HQ, GeForce GTX 1060 Mobile | Acer Aspire VX5-591G-75C4 VX15 i7-7700HQ, GeForce GTX 1050 Ti Mobile | |
|---|---|---|---|---|---|
| Power Consumption | -51% | -54% | -7% | 22% | |
| Idle Minimum * (Watt) | 8 | 19 -138% | 20 -150% | 12 -50% | 7 12% |
| Idle Average * (Watt) | 12 | 23 -92% | 24 -100% | 15 -25% | 10.2 15% |
| Idle Maximum * (Watt) | 25 | 29 -16% | 29 -16% | 20 20% | 14 44% |
| Load Average * (Watt) | 85 | 85 -0% | 82 4% | 82 4% | 78 8% |
| Witcher 3 ultra * (Watt) | 110 | 111 -1% | |||
| Load Maximum * (Watt) | 180 | 192 -7% | 193 -7% | 161 11% | 127 29% |
* ... menor é melhor
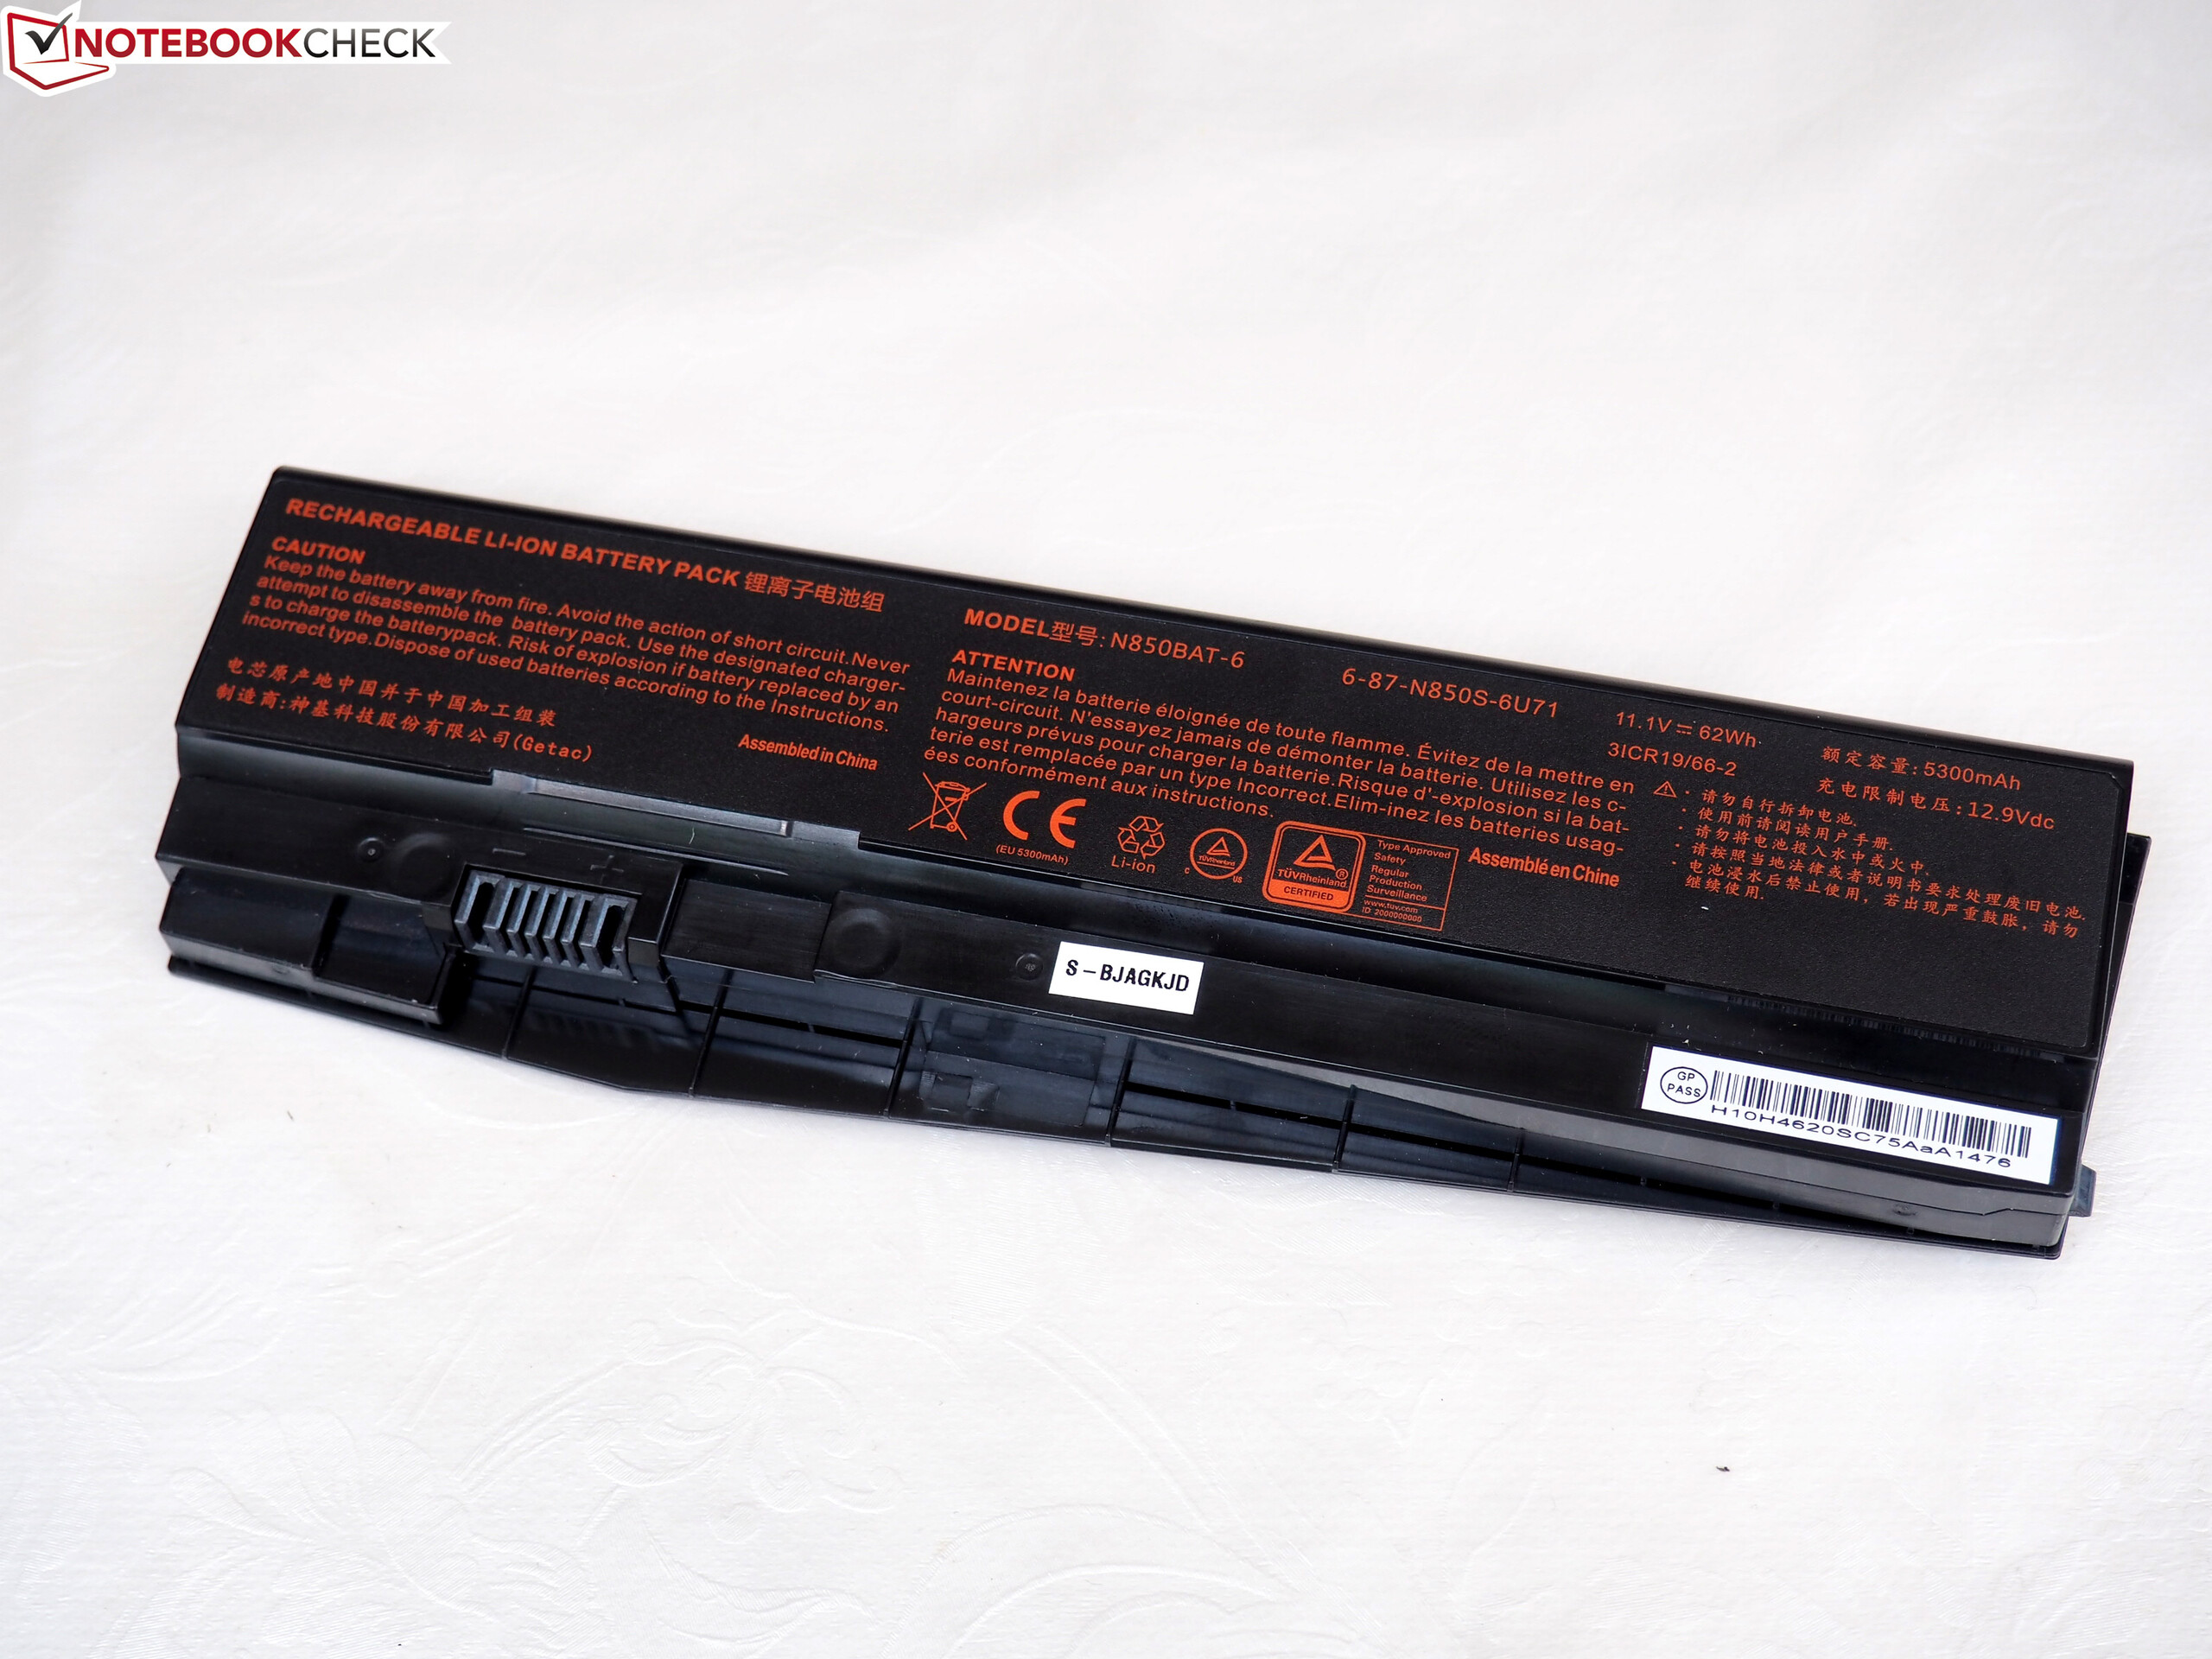
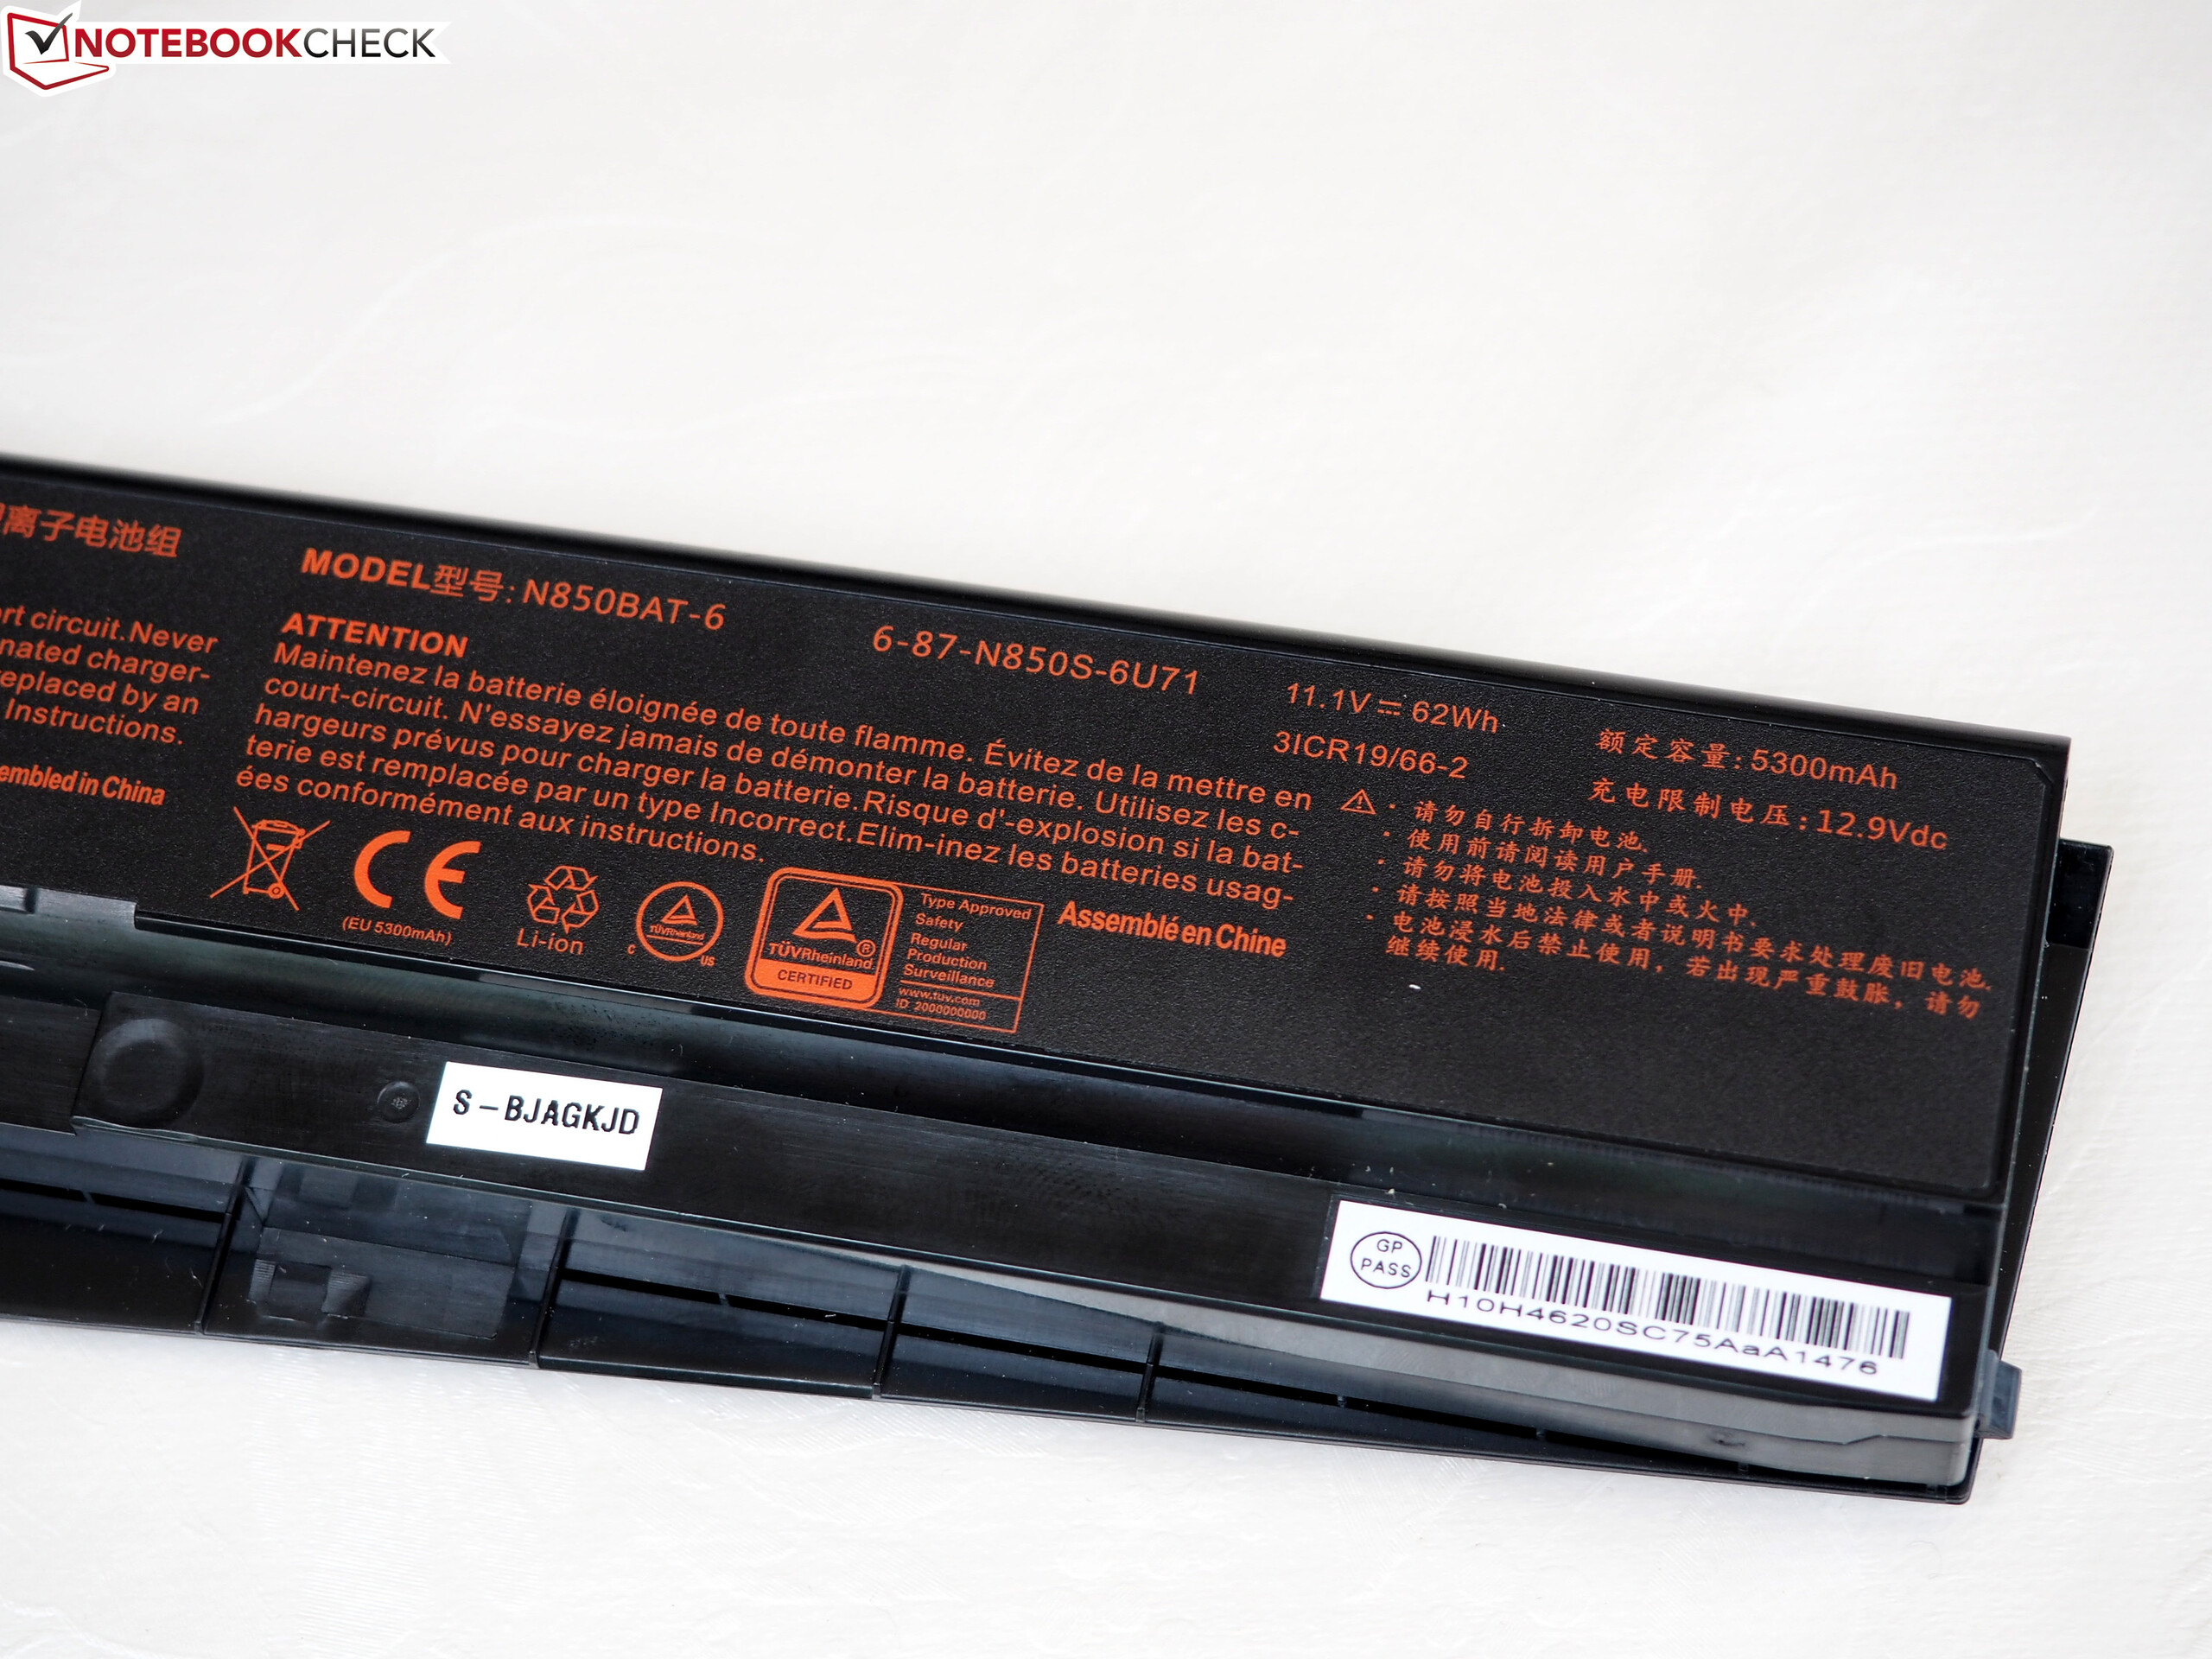
| Schenker XMG A517 i7-7700HQ, GeForce GTX 1060 Mobile, 62 Wh | Alienware 15 R3 i7-7700HQ, GeForce GTX 1070 Mobile, 99 Wh | MSI GT62VR 7RE-223 i7-7700HQ, GeForce GTX 1070 Mobile, 75 Wh | Gigabyte Aero 15 i7-7700HQ, GeForce GTX 1060 Mobile, 94.24 Wh | Acer Aspire VX5-591G-75C4 VX15 i7-7700HQ, GeForce GTX 1050 Ti Mobile, 52.5 Wh | |
|---|---|---|---|---|---|
| Duração da bateria | -11% | -15% | 35% | -15% | |
| Reader / Idle (h) | 7.5 | 6.4 -15% | 6.3 -16% | 10.6 41% | 5.4 -28% |
| H.264 (h) | 5.2 | 4.4 -15% | 4.2 -19% | 7.7 48% | |
| WiFi v1.3 (h) | 5 | 4.4 -12% | 4.1 -18% | 7 40% | 5 0% |
| Load (h) | 1.7 | 1.7 0% | 1.6 -6% | 1.9 12% | 1.4 -18% |
Pro
Contra
O XMG A517 tem algumas dificuldades tentando competir com os atuais portáteis de jogos da Acer, Alienware, Asus, Gigabyte e MSI. A qualidade da carcaça, os alto-falantes e as emissões (temperatura, ruído do sistema) não justificam seu preço de 1200 € (~ $ 1378 para a configuração mais básica). Muitos outros portáteis de jogos se desempenham melhor.
No entanto, não há nada a criticar sobre o desempenho do aparelho. Enquanto o Turbo da CPU poderia ser utilizado um pouco melhor sob carga de múltiplos núcleos, o portátil de 15 polegadas oferece um excelente desempenho geral que pode facilmente acompanhar os jogos modernos na resolução nativa de 1920x1080.
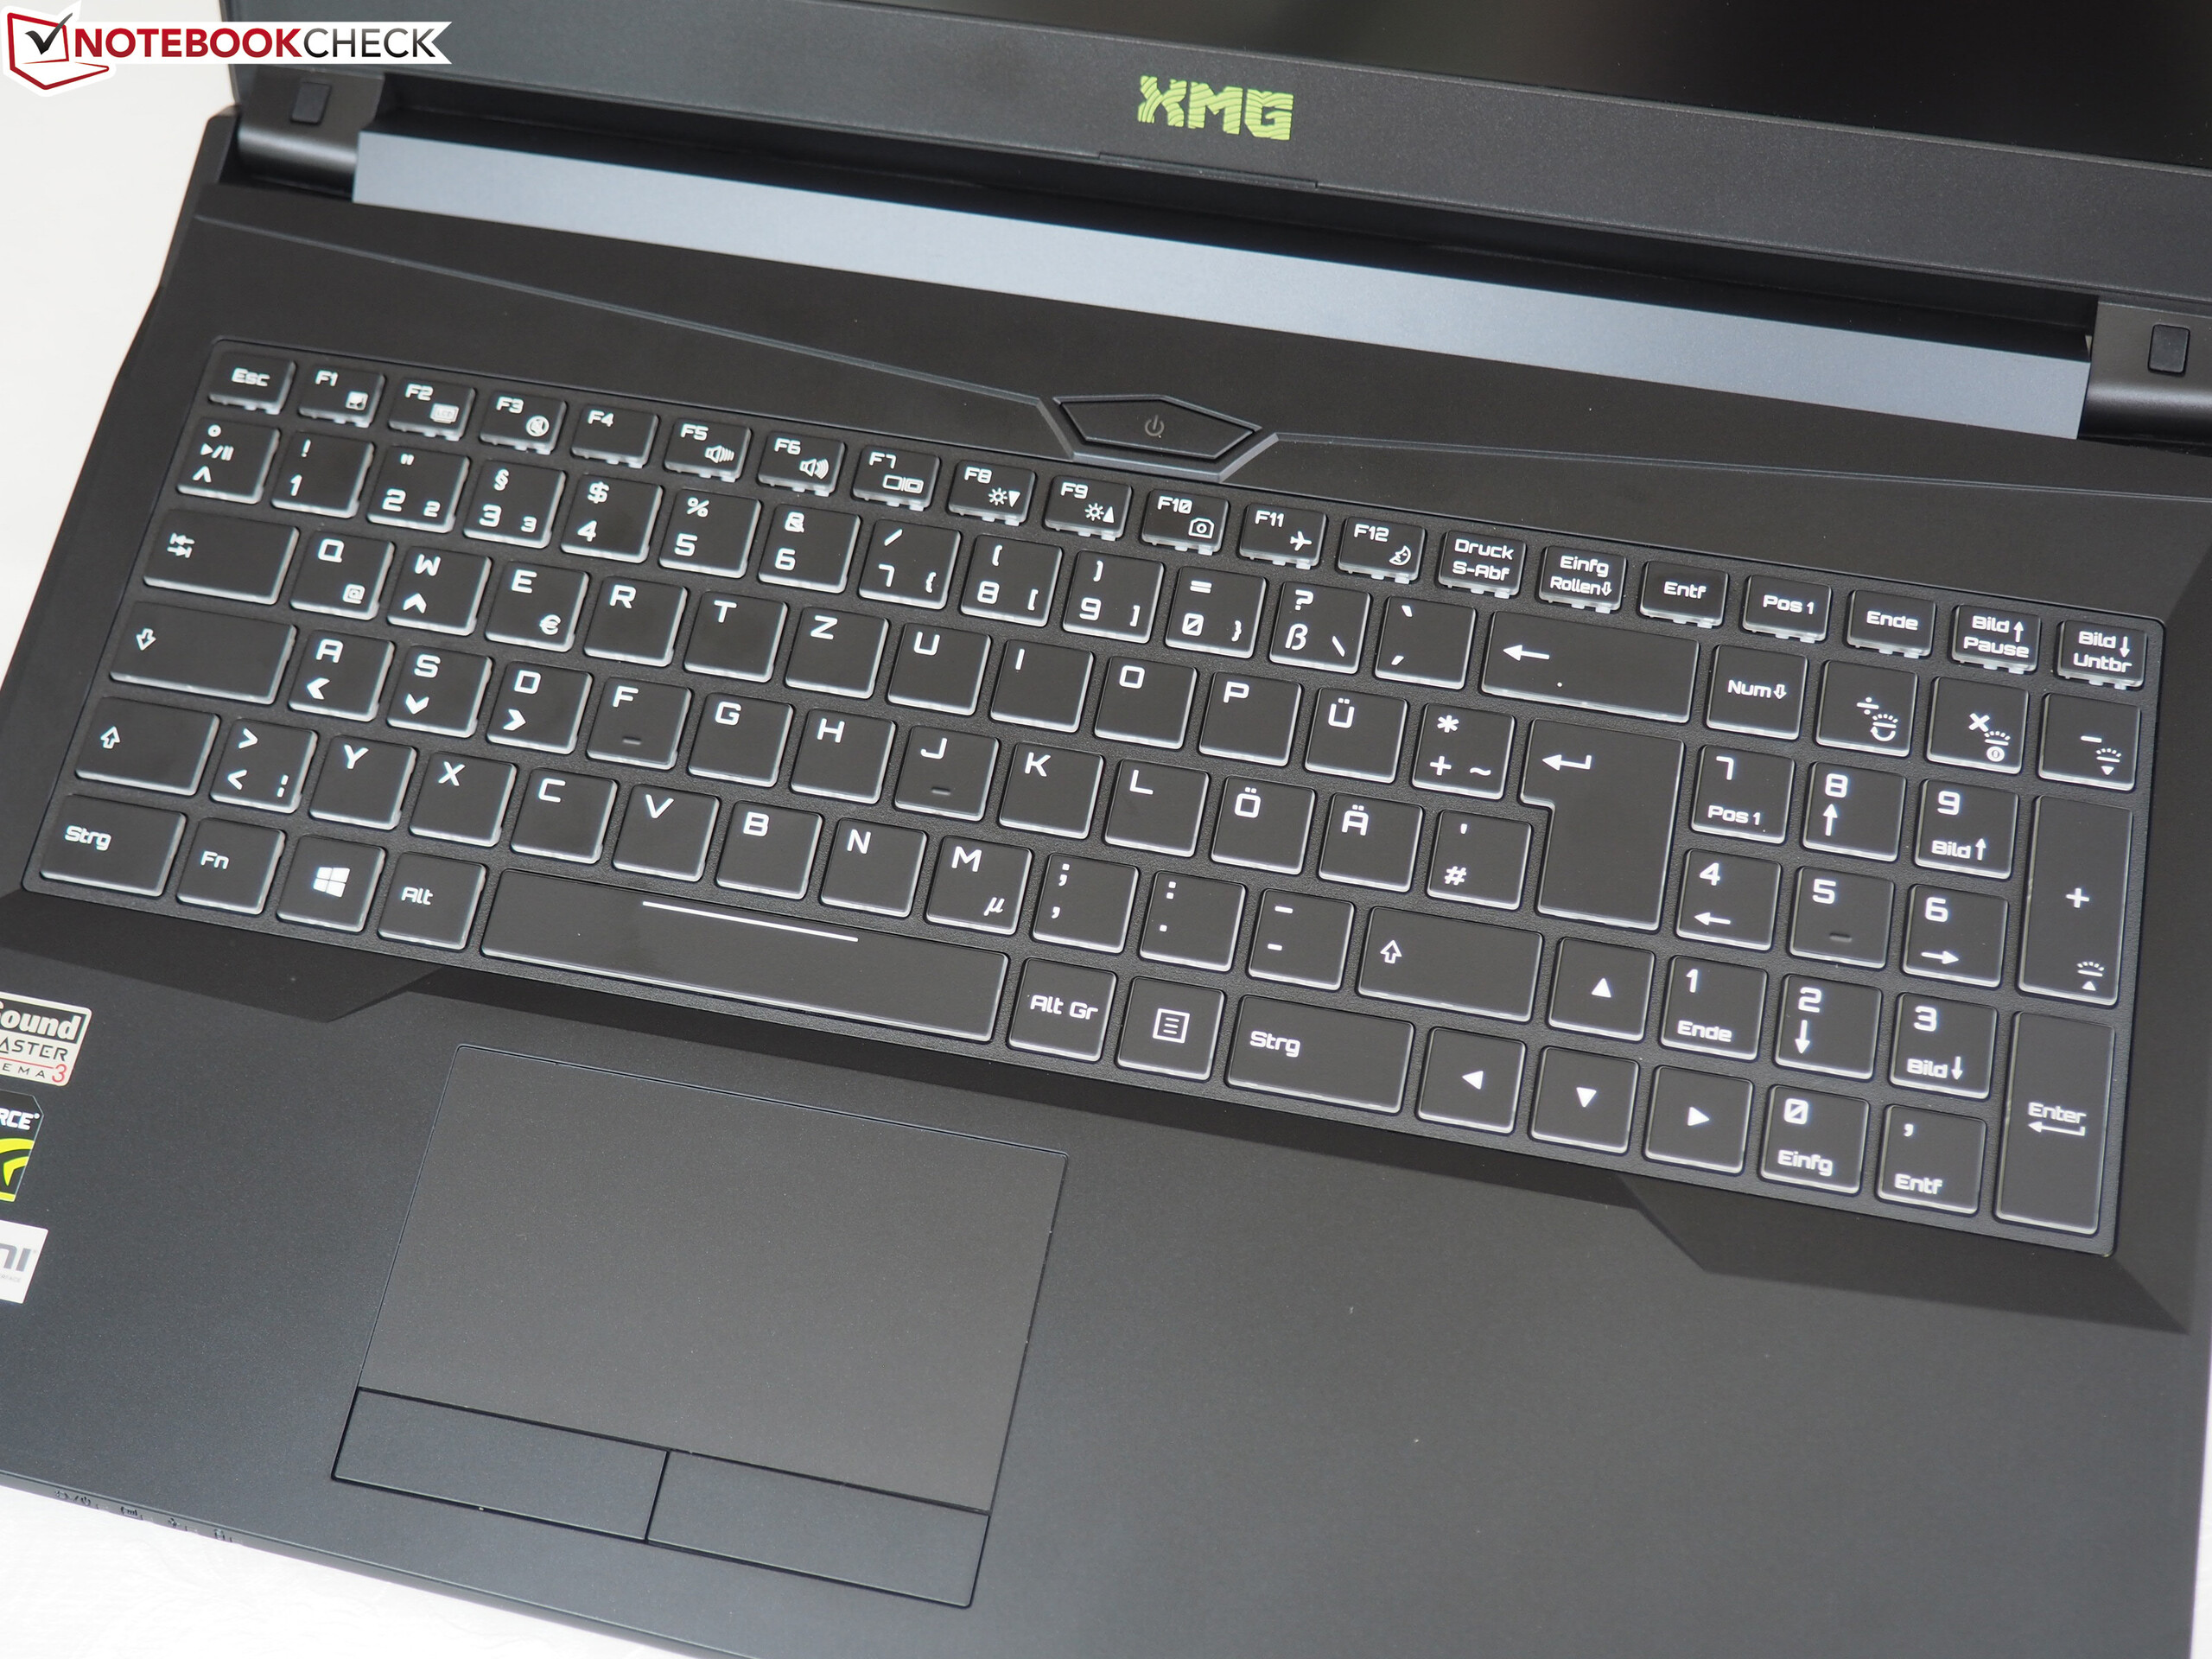
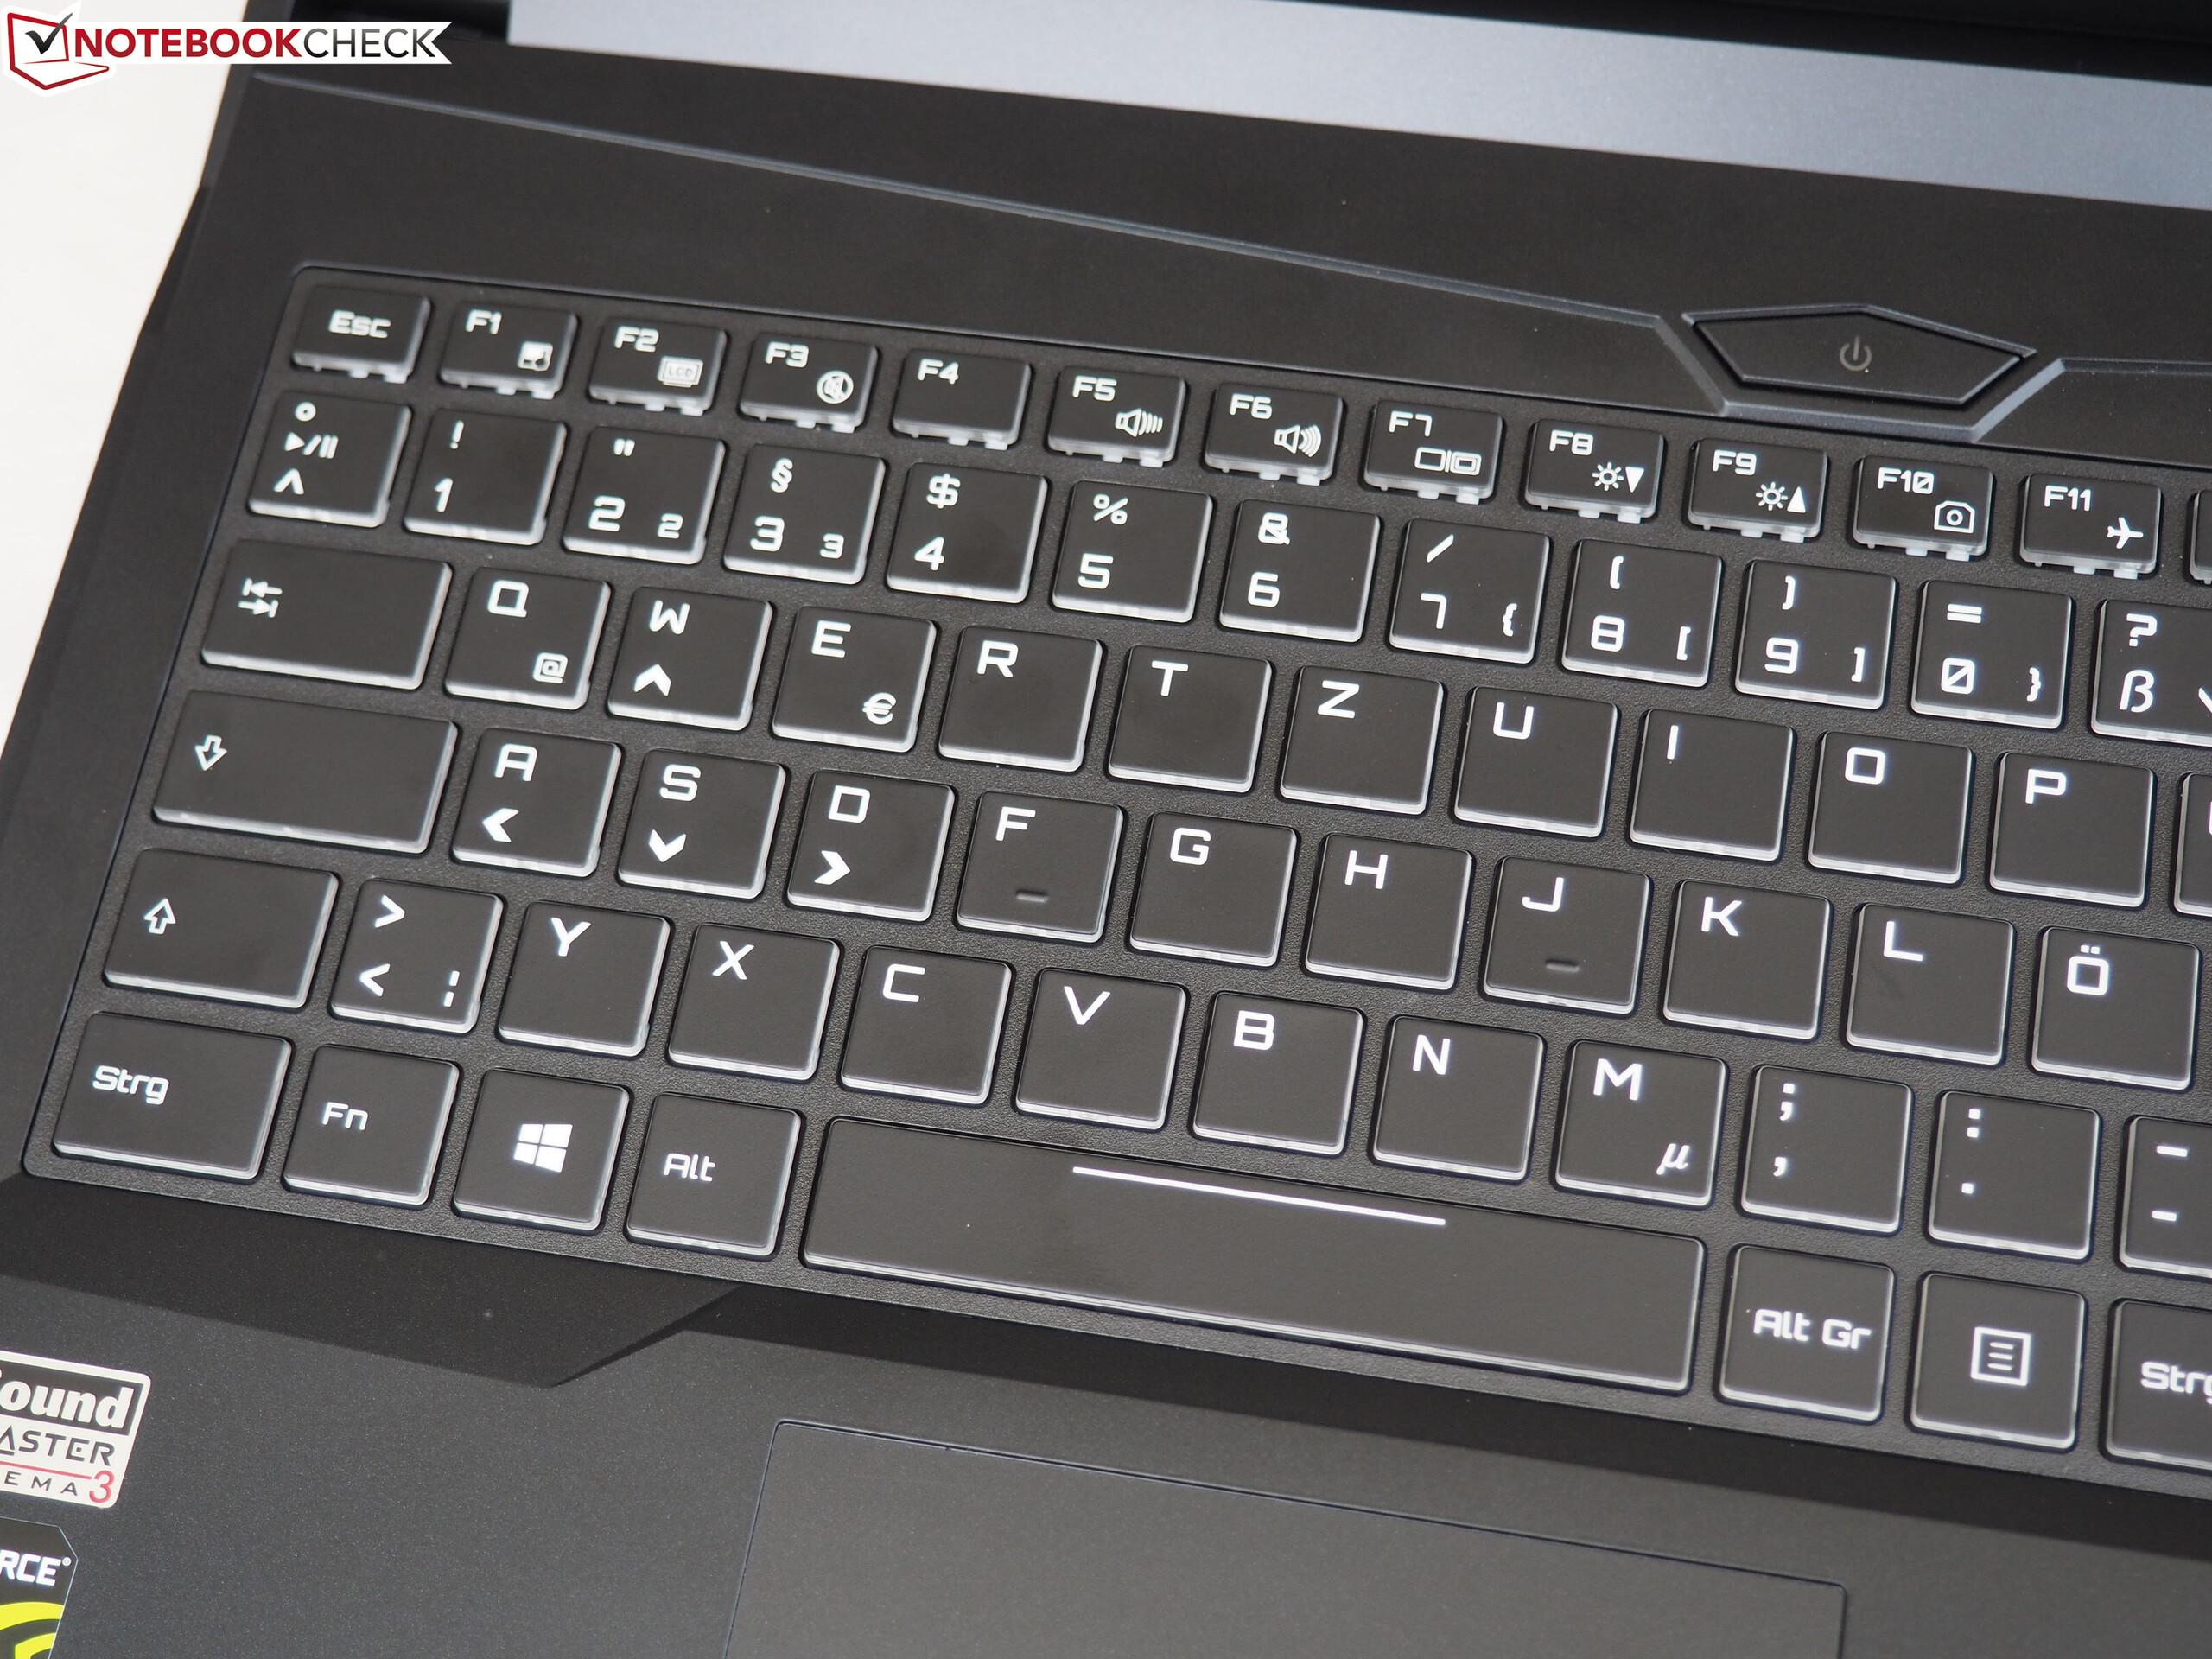
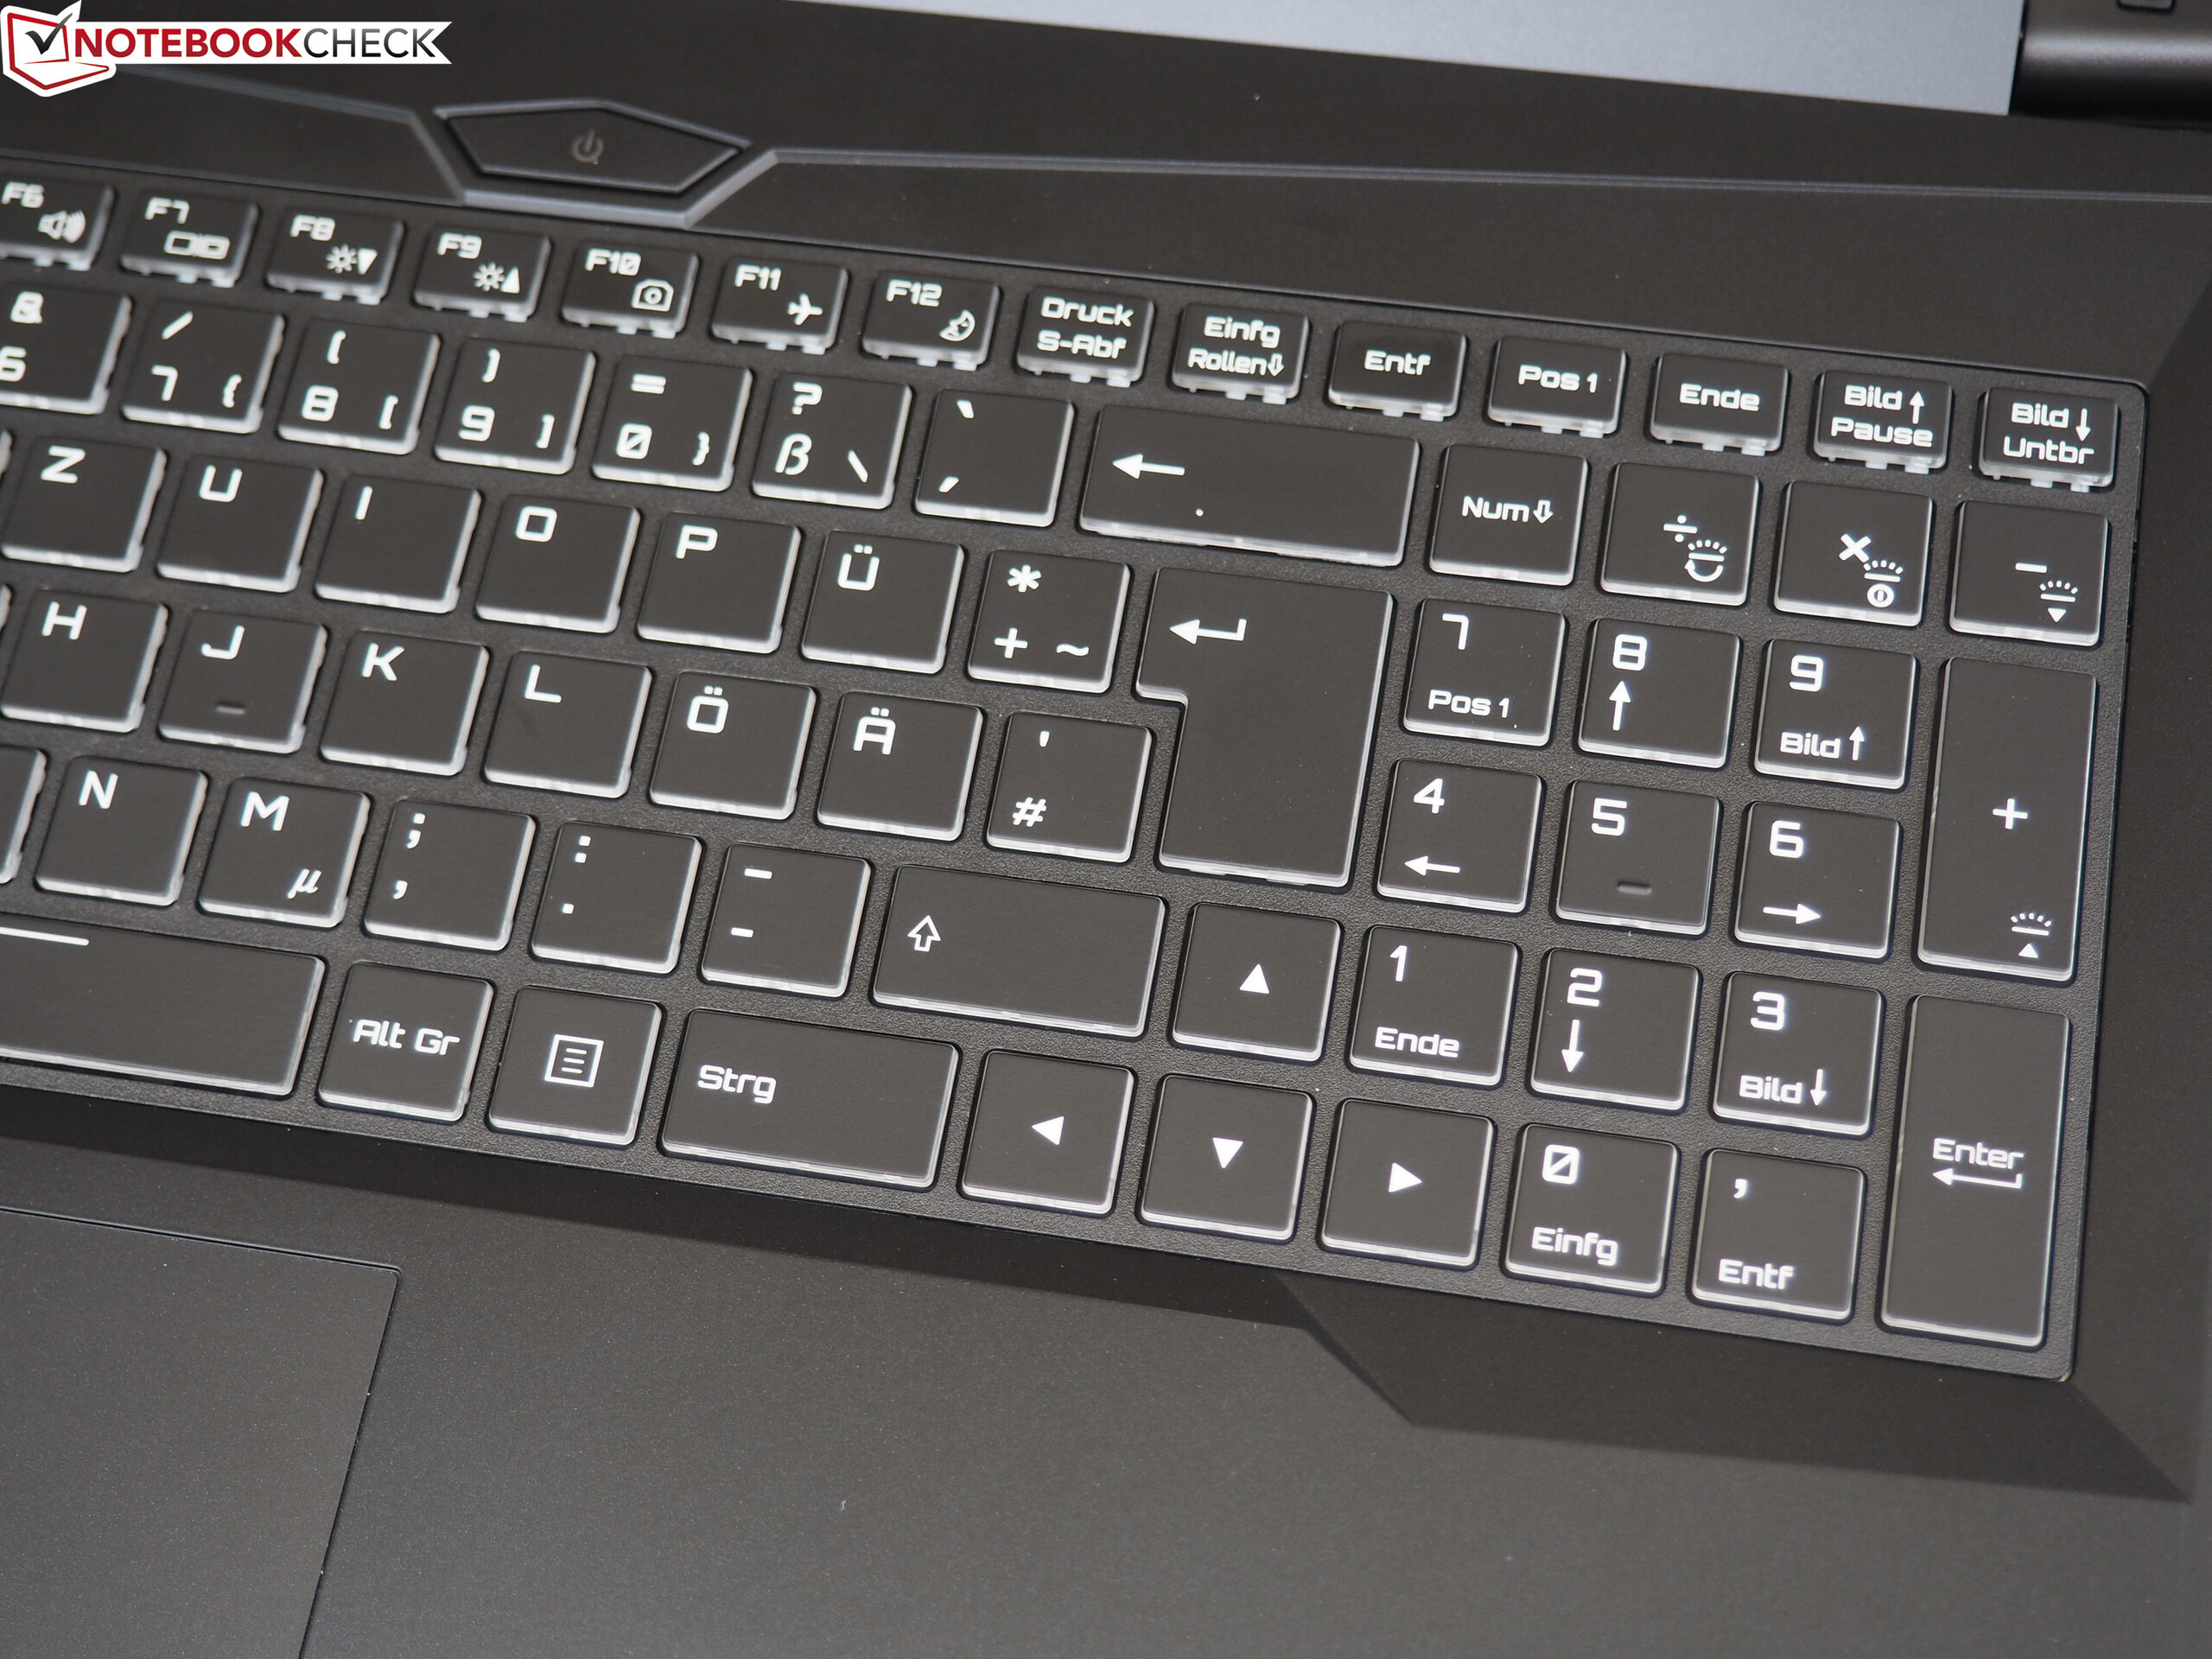
Se você puder viver sem 120 Hz e G-Sync, também ficará feliz com a tela IPS. Outros destaques são o teclado firme com retro iluminação RGB, uma duração de bateria surpreendentemente longa e um peso tolerável de 2,4 kg.
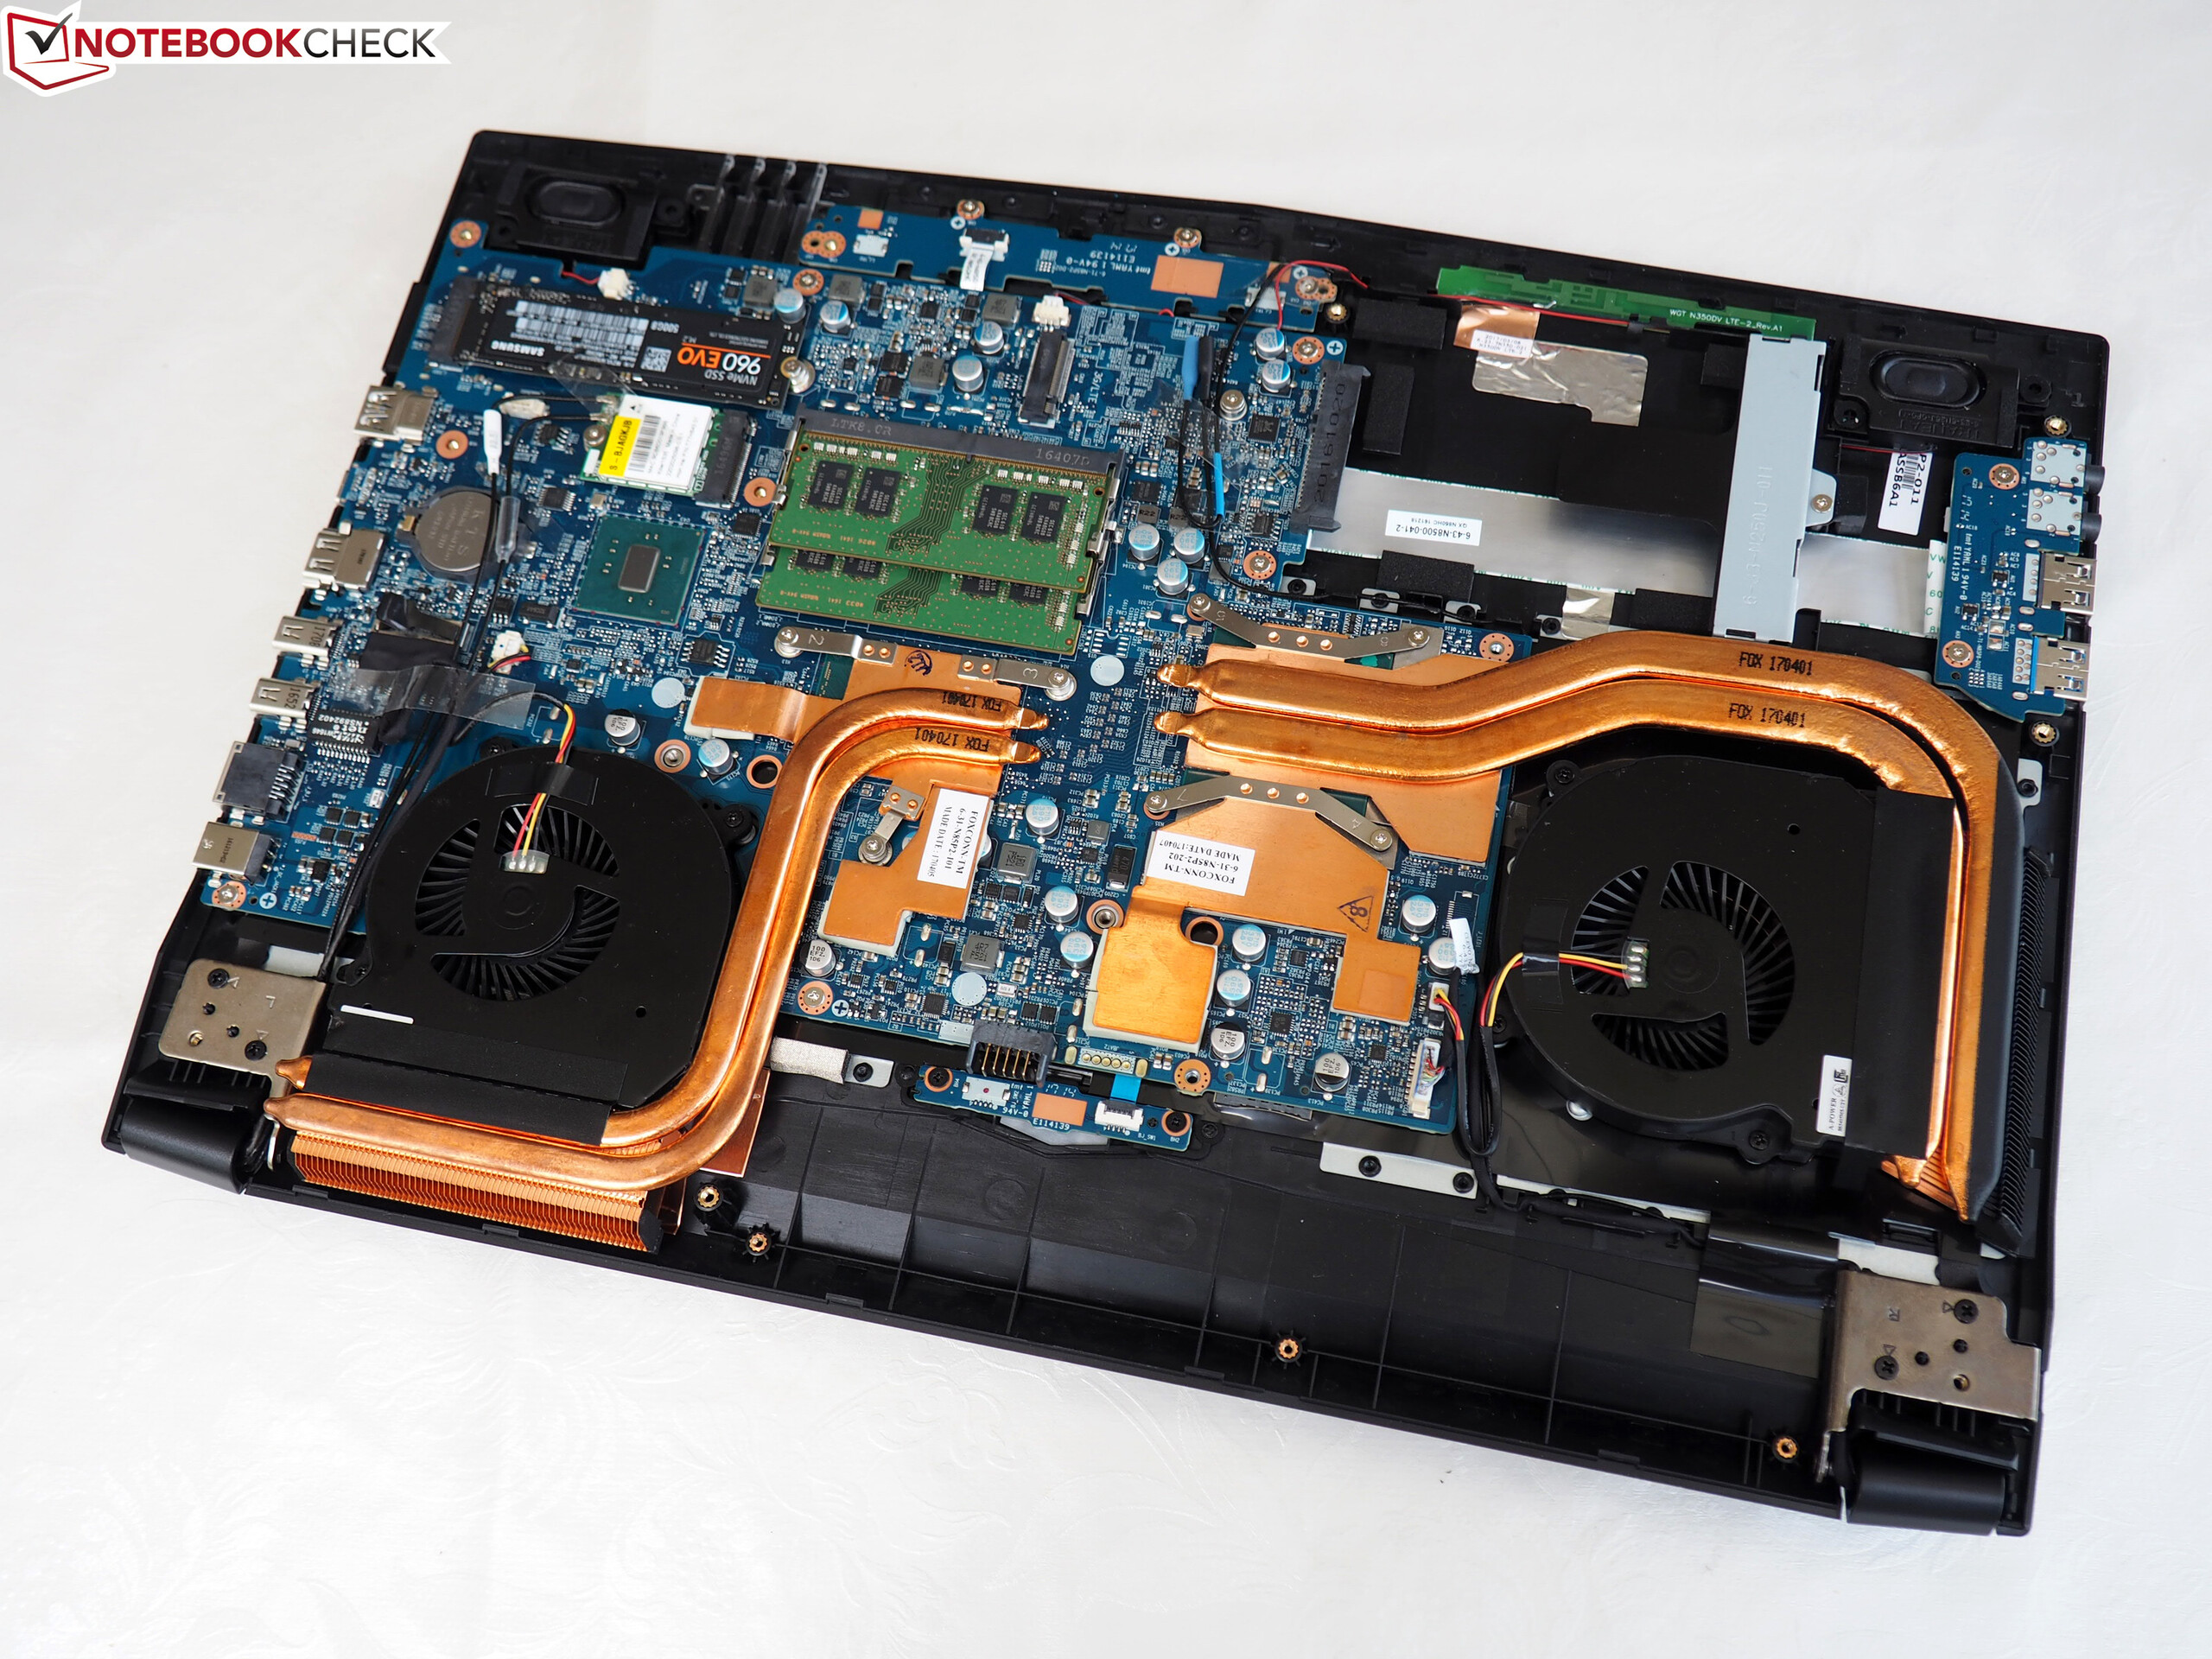
Graças ao configurador interno, o XMG A517 pode ser facilmente adaptado para suas necessidades pessoais. (Tamanho da RAM, dispositivos de armazenamento, sistema operacional, etc.).
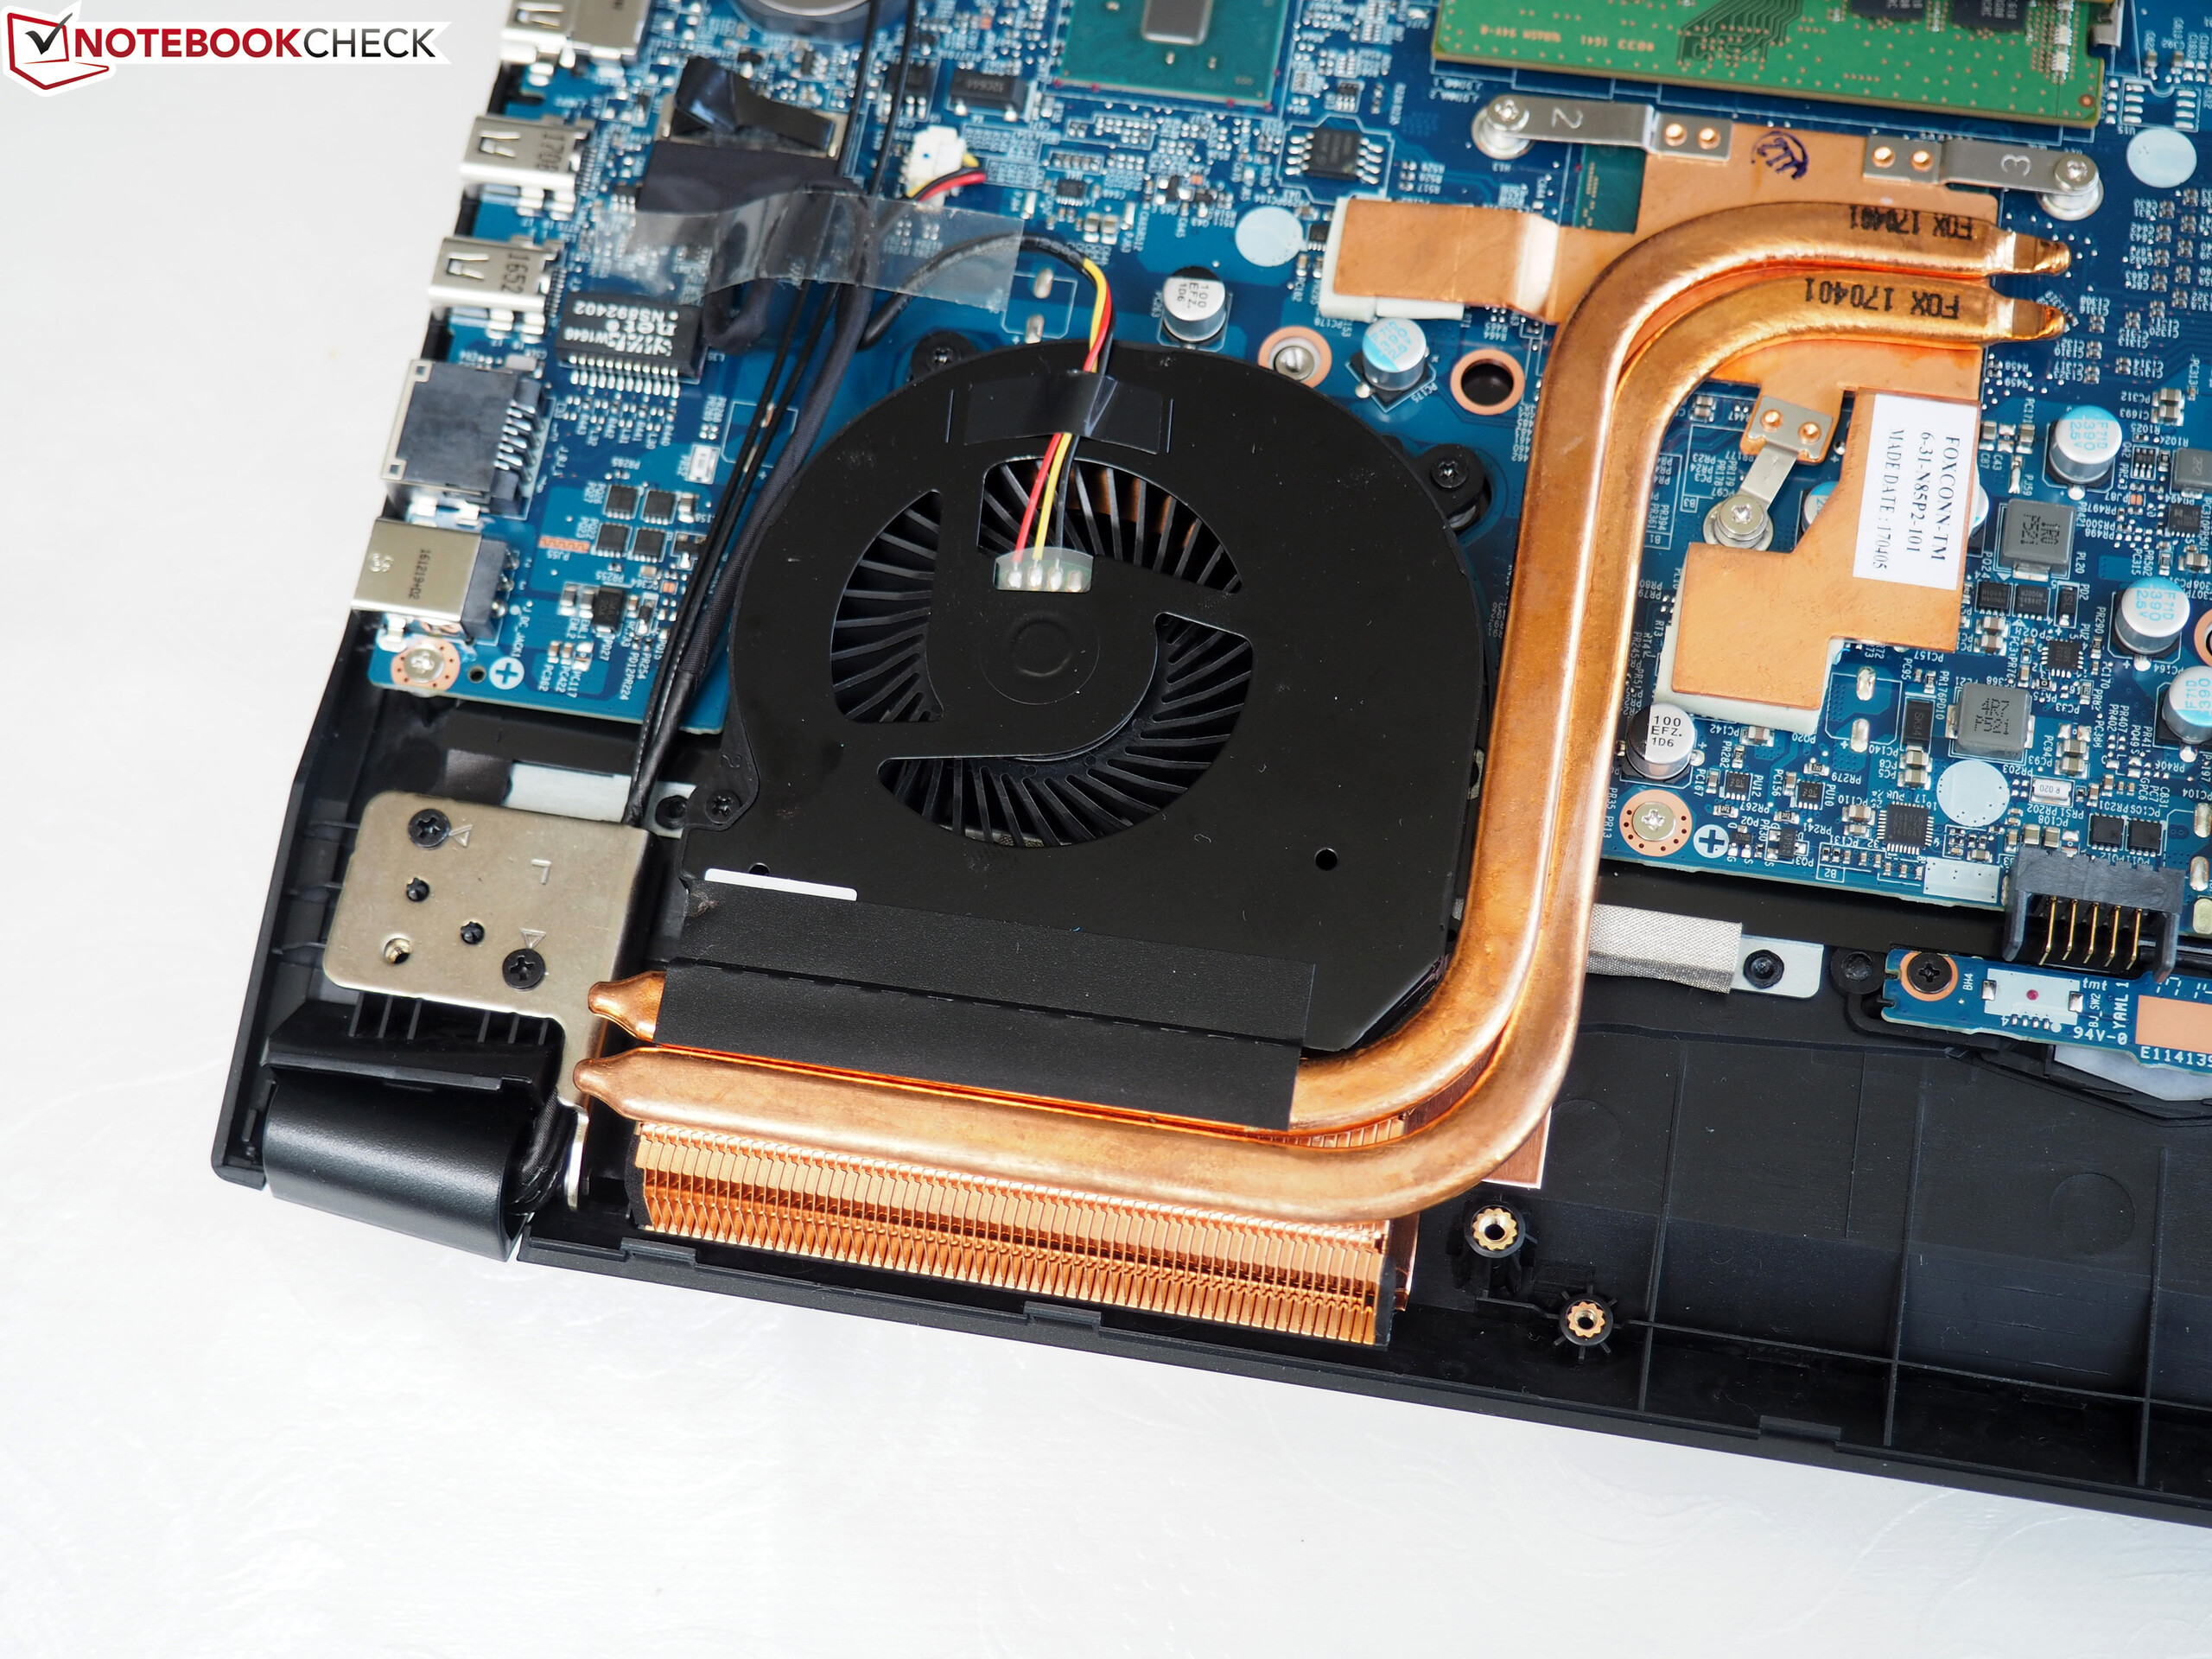
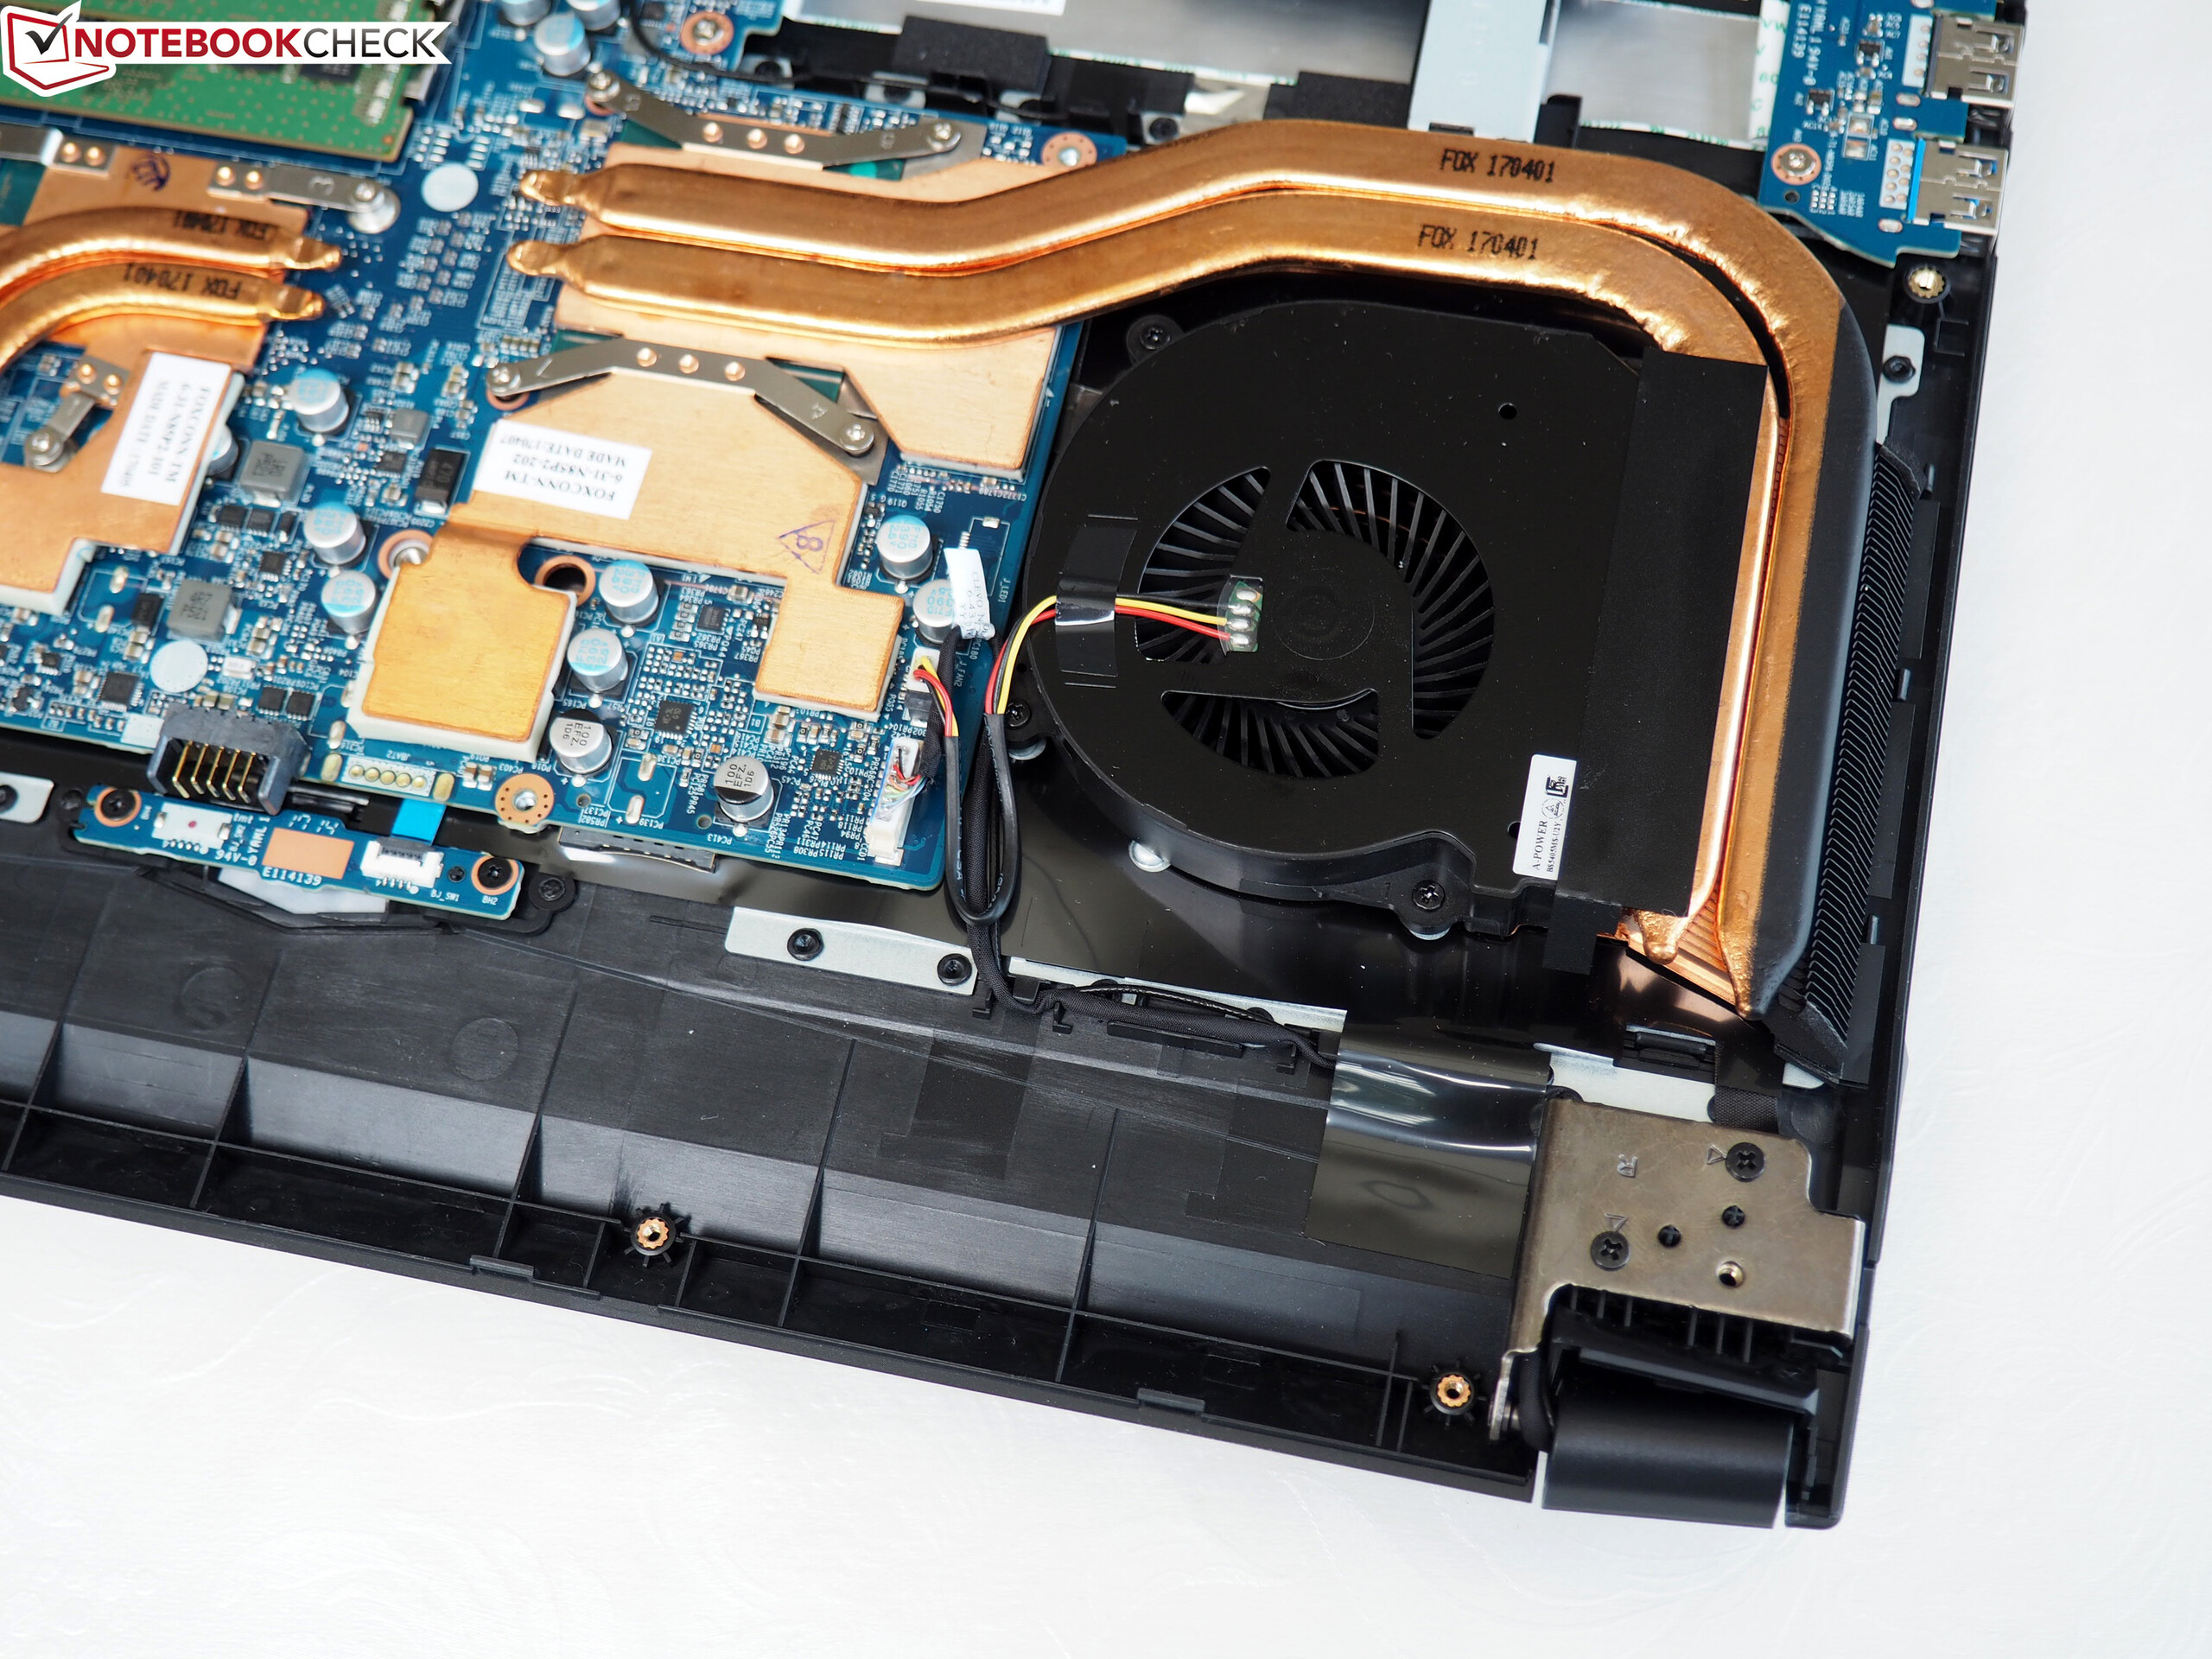
No geral, vale a pena dar uma olhada no aparelho, desde que você possa aceitar os pontos fracos mencionados acima. No entanto, não podemos oferecer uma recomendação de compra para o aparelho de 15 polegadas, dado que o fabricante Barebone Clevo cometeu muitos erros (especialmente no que diz respeito ao sistema de resfriamento e seu controle).
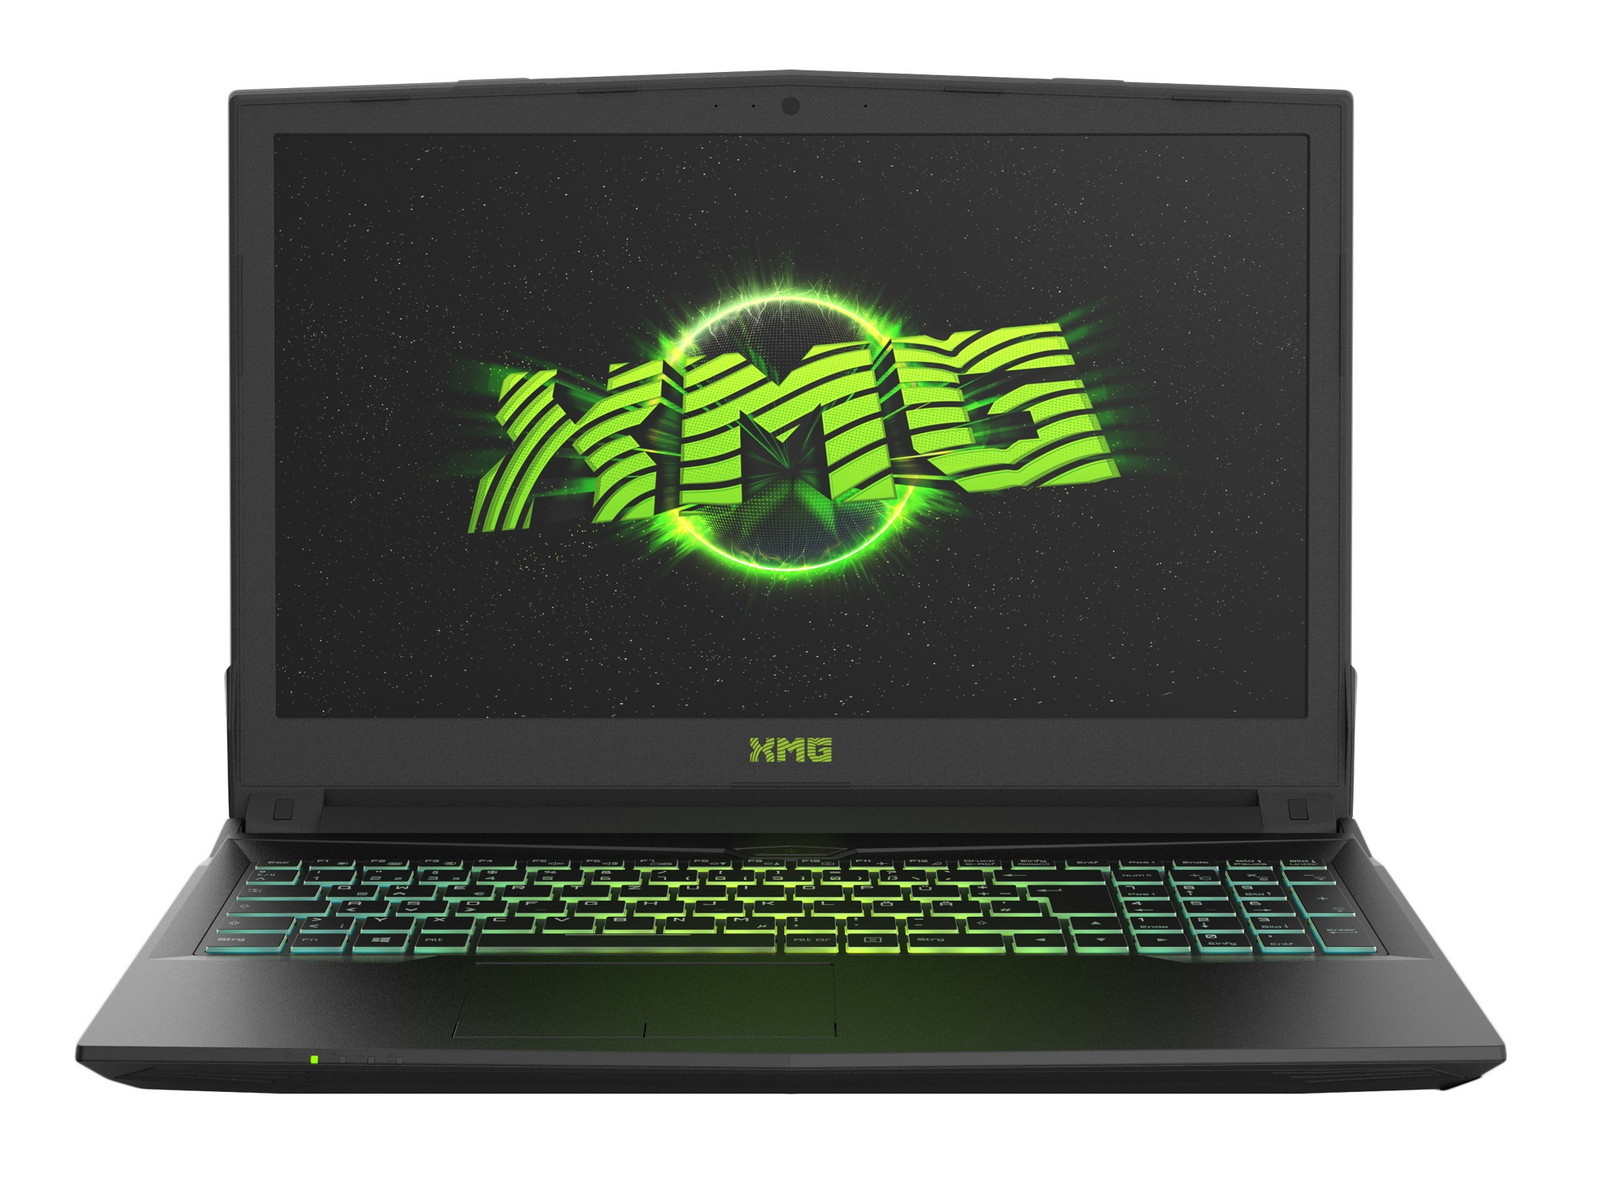
Schenker XMG A517
- 06/19/2018 v6 (old)
Florian Glaser
Price comparison