Breve Análise do Portátil Asus Zephyrus S GX531GX (i7-8750H, RTX 2080 Max-Q)
| Networking | |
| iperf3 transmit AX12 | |
| Asus Strix GL504GM | |
| Razer Blade 15 RTX 2070 Max-Q | |
| Asus Zephyrus S GX531GX | |
| Aorus 15 X9 | |
| Asus Zephyrus GX501 | |
| iperf3 receive AX12 | |
| Razer Blade 15 RTX 2070 Max-Q | |
| Asus Zephyrus GX501 | |
| Asus Zephyrus S GX531GX | |
| Asus Strix GL504GM | |
| Aorus 15 X9 | |
| |||||||||||||||||||||||||
iluminação: 91 %
iluminação com acumulador: 323.6 cd/m²
Contraste: 1116:1 (Preto: 0.29 cd/m²)
ΔE ColorChecker Calman: 3.31 | ∀{0.5-29.43 Ø4.71}
calibrated: 2.73
ΔE Greyscale Calman: 2.9 | ∀{0.09-98 Ø4.96}
91.8% sRGB (Argyll 1.6.3 3D)
59.7% AdobeRGB 1998 (Argyll 1.6.3 3D)
66.9% AdobeRGB 1998 (Argyll 3D)
92.2% sRGB (Argyll 3D)
65.6% Display P3 (Argyll 3D)
Gamma: 2.29
CCT: 6765 K
| Asus Zephyrus S GX531GX AU Optronics B156HAN08.2, IPS, 15.6", 1920x1080 | Aorus 15 X9 LG Philips LP156WFG-SPB2, IPS, 15.6", 1920x1080 | Alienware m15 GTX 1070 Max-Q AU Optronics B156HAN, IPS, 15.6", 1920x1080 | Razer Blade 15 RTX 2070 Max-Q LG Philips LGD05C0, IPS, 15.6", 1920x1080 | Asus Strix GL504GM AU Optronics B156HAN08.2 (AUO82ED), IPS, 15.6", 1920x1080 | Asus Zephyrus GX501 AUO B156HAN04.2 (AUO42ED), IPS, 15.6", 1920x1080 | |
|---|---|---|---|---|---|---|
| Display | 1% | -3% | 1% | 0% | -1% | |
| Display P3 Coverage (%) | 65.6 | 64.9 -1% | 63.5 -3% | 65.3 0% | 65.3 0% | 64.8 -1% |
| sRGB Coverage (%) | 92.2 | 95.6 4% | 89.4 -3% | 94.9 3% | 92.8 1% | 91.8 0% |
| AdobeRGB 1998 Coverage (%) | 66.9 | 66.3 -1% | 64.5 -4% | 66.3 -1% | 66.7 0% | 65.9 -1% |
| Response Times | -73% | -91% | -81% | -10% | -314% | |
| Response Time Grey 50% / Grey 80% * (ms) | 7 ? | 15.2 ? -117% | 18 ? -157% | 16.8 ? -140% | 7.8 ? -11% | 40.4 ? -477% |
| Response Time Black / White * (ms) | 9.6 ? | 12.4 ? -29% | 12 ? -25% | 11.6 ? -21% | 10.4 ? -8% | 24 ? -150% |
| PWM Frequency (Hz) | ||||||
| Screen | 3% | -12% | 0% | -11% | -26% | |
| Brightness middle (cd/m²) | 323.6 | 305.1 -6% | 353.6 9% | 314.7 -3% | 350 8% | 328 1% |
| Brightness (cd/m²) | 315 | 295 -6% | 346 10% | 312 -1% | 338 7% | 305 -3% |
| Brightness Distribution (%) | 91 | 78 -14% | 86 -5% | 90 -1% | 90 -1% | 83 -9% |
| Black Level * (cd/m²) | 0.29 | 0.33 -14% | 0.3 -3% | 0.38 -31% | 0.33 -14% | 0.25 14% |
| Contrast (:1) | 1116 | 925 -17% | 1179 6% | 828 -26% | 1061 -5% | 1312 18% |
| Colorchecker dE 2000 * | 3.31 | 2.58 22% | 4.55 -37% | 2.56 23% | 4.3 -30% | 6.02 -82% |
| Colorchecker dE 2000 max. * | 5.74 | 4.32 25% | 7.91 -38% | 4.89 15% | 7.78 -36% | 10.14 -77% |
| Colorchecker dE 2000 calibrated * | 2.73 | 1.33 51% | 3.37 -23% | 1.71 37% | 2.83 -4% | |
| Greyscale dE 2000 * | 2.9 | 3.4 -17% | 4.1 -41% | 3.4 -17% | 4.4 -52% | 6.32 -118% |
| Gamma | 2.29 96% | 2.28 96% | 2.27 97% | 2.3 96% | 2.26 97% | 2.28 96% |
| CCT | 6765 96% | 6374 102% | 7434 87% | 6435 101% | 7517 86% | 8194 79% |
| Color Space (Percent of AdobeRGB 1998) (%) | 59.7 | 60.7 2% | 57.9 -3% | 60.7 2% | 60 1% | 60 1% |
| Color Space (Percent of sRGB) (%) | 91.8 | 95.2 4% | 88.9 -3% | 94.6 3% | 92.5 1% | 92 0% |
| Média Total (Programa/Configurações) | -23% /
-7% | -35% /
-20% | -27% /
-10% | -7% /
-9% | -114% /
-59% |
* ... menor é melhor
Exibir tempos de resposta
| ↔ Tempo de resposta preto para branco | ||
|---|---|---|
| 9.6 ms ... ascensão ↗ e queda ↘ combinadas | ↗ 4.4 ms ascensão | 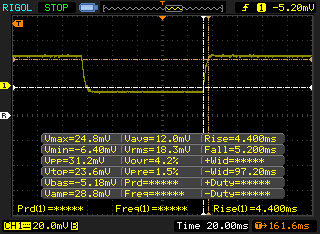 |
| ↘ 5.2 ms queda | ||
| A tela mostra taxas de resposta rápidas em nossos testes e deve ser adequada para jogos. Em comparação, todos os dispositivos testados variam de 0.1 (mínimo) a 240 (máximo) ms. » 26 % de todos os dispositivos são melhores. Isso significa que o tempo de resposta medido é melhor que a média de todos os dispositivos testados (19.8 ms). | ||
| ↔ Tempo de resposta 50% cinza a 80% cinza | ||
| 7 ms ... ascensão ↗ e queda ↘ combinadas | ↗ 3.6 ms ascensão | 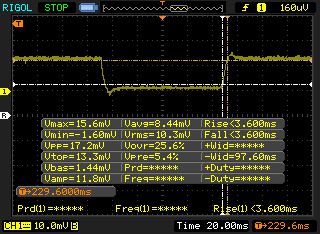 |
| ↘ 3.4 ms queda | ||
| A tela mostra taxas de resposta muito rápidas em nossos testes e deve ser muito adequada para jogos em ritmo acelerado. Em comparação, todos os dispositivos testados variam de 0.165 (mínimo) a 636 (máximo) ms. » 20 % de todos os dispositivos são melhores. Isso significa que o tempo de resposta medido é melhor que a média de todos os dispositivos testados (30.9 ms). | ||
Cintilação da tela / PWM (modulação por largura de pulso)
| Tela tremeluzindo / PWM não detectado | 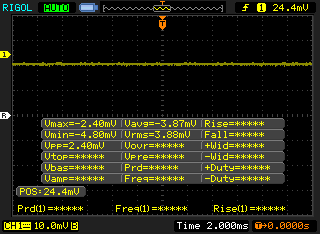 | ||
[pwm_comparison] Em comparação: 52 % de todos os dispositivos testados não usam PWM para escurecer a tela. Se PWM foi detectado, uma média de 7741 (mínimo: 5 - máximo: 343500) Hz foi medida. | |||
| PCMark 8 Home Score Accelerated v2 | 3979 pontos | |
| PCMark 8 Work Score Accelerated v2 | 5289 pontos | |
| PCMark 10 Score | 5492 pontos | |
Ajuda | ||
| Asus Zephyrus S GX531GX Intel SSD 660p SSDPEKNW512G8 | Aorus 15 X9 Intel SSD 760p SSDPEKKW512G8 | Razer Blade 15 RTX 2070 Max-Q Samsung SSD PM981 MZVLB512HAJQ | Asus Strix GL504GM Toshiba NVMe THNSN5256GPU7 | Asus Zephyrus S GX531GS WDC PC SN520 SDAPNUW-512G | |
|---|---|---|---|---|---|
| AS SSD | 40% | 83% | 20% | 50% | |
| Seq Read (MB/s) | 1239 | 1912 54% | 1840 49% | 1433 16% | 903 -27% |
| Seq Write (MB/s) | 920 | 1553 69% | 1822 98% | 1071 16% | 1261 37% |
| 4K Read (MB/s) | 45.74 | 56.5 24% | 52.3 14% | 32 -30% | 40.02 -13% |
| 4K Write (MB/s) | 95.7 | 119.6 25% | 110.7 16% | 96.5 1% | 103.6 8% |
| 4K-64 Read (MB/s) | 322 | 869 170% | 1126 250% | 832 158% | 1030 220% |
| 4K-64 Write (MB/s) | 722 | 584 -19% | 1717 138% | 520 -28% | 1285 78% |
| Access Time Read * (ms) | 0.073 | 0.049 33% | 0.047 36% | 0.072 1% | 0.129 -77% |
| Access Time Write * (ms) | 0.047 | 0.031 34% | 0.033 30% | 0.045 4% | 0.036 23% |
| Score Read (Points) | 492 | 1116 127% | 1362 177% | 1007 105% | 1161 136% |
| Score Write (Points) | 910 | 859 -6% | 2010 121% | 724 -20% | 1515 66% |
| Score Total (Points) | 1654 | 2544 54% | 4079 147% | 2233 35% | 3294 99% |
| Copy ISO MB/s (MB/s) | 1236 | 1329 8% | 1975 60% | 1006 -19% | |
| Copy Program MB/s (MB/s) | 703 | 404.3 -42% | 526 -25% | 752 7% | |
| Copy Game MB/s (MB/s) | 812 | 1071 32% | 1200 48% | 1088 34% |
* ... menor é melhor

| 3DMark 11 Performance | 21324 pontos | |
| 3DMark Cloud Gate Standard Score | 32978 pontos | |
| 3DMark Fire Strike Score | 17774 pontos | |
| 3DMark Time Spy Score | 7688 pontos | |
Ajuda | ||
| baixo | média | alto | ultra | |
|---|---|---|---|---|
| BioShock Infinite (2013) | 276.8 | 246.7 | 232.3 | 166 |
| The Witcher 3 (2015) | 263.4 | 215.2 | 142 | 80.3 |
| Rise of the Tomb Raider (2016) | 215 | 163.6 | 146.5 | 124 |
| Asus Zephyrus S GX531GX GeForce RTX 2080 Max-Q, i7-8750H, Intel SSD 660p SSDPEKNW512G8 | Aorus 15 X9 GeForce RTX 2070 Mobile, i7-8750H, Intel SSD 760p SSDPEKKW512G8 | Alienware m15 GTX 1070 Max-Q GeForce GTX 1070 Max-Q, i7-8750H, Toshiba XG5 KXG50ZNV512G | Razer Blade 15 RTX 2070 Max-Q GeForce RTX 2070 Max-Q, i7-8750H, Samsung SSD PM981 MZVLB512HAJQ | Asus Strix GL504GM GeForce GTX 1060 Mobile, i7-8750H, Toshiba NVMe THNSN5256GPU7 | Asus Zephyrus GX501 GeForce GTX 1080 Max-Q, i7-7700HQ, Samsung SSD SM961 1TB M.2 MZVKW1T0HMLH | Asus Zephyrus S GX531GS GeForce GTX 1070 Max-Q, i7-8750H, WDC PC SN520 SDAPNUW-512G | |
|---|---|---|---|---|---|---|---|
| Noise | -0% | 8% | 13% | 7% | 5% | -4% | |
| desligado / ambiente * (dB) | 28.7 | 28.2 2% | 28.6 -0% | 28.8 -0% | 28.5 1% | 31 -8% | 29 -1% |
| Idle Minimum * (dB) | 29.8 | 32.6 -9% | 28.6 4% | 28.8 3% | 30 -1% | 32 -7% | 33 -11% |
| Idle Average * (dB) | 32.4 | 32.7 -1% | 28.6 12% | 28.8 11% | 30 7% | 33 -2% | 34 -5% |
| Idle Maximum * (dB) | 38 | 32.7 14% | 28.6 25% | 29.4 23% | 30 21% | 34 11% | 40 -5% |
| Load Average * (dB) | 38.2 | 38.9 -2% | 40.8 -7% | 35.7 7% | 41.8 -9% | 39 -2% | 47 -23% |
| Witcher 3 ultra * (dB) | 56.6 | 51.8 8% | 49.6 12% | 42.5 25% | 47.6 16% | 42 26% | 51 10% |
| Load Maximum * (dB) | 56.6 | 64.1 -13% | 49.6 12% | 45 20% | 50 12% | 46 19% | 53 6% |
* ... menor é melhor
Barulho
| Ocioso |
| 29.8 / 32.4 / 38 dB |
| Carga |
| 38.2 / 56.6 dB |
 | ||
30 dB silencioso 40 dB(A) audível 50 dB(A) ruidosamente alto |
||
min: | ||
(-) A temperatura máxima no lado superior é 47 °C / 117 F, em comparação com a média de 40.4 °C / 105 F , variando de 21.2 a 68.8 °C para a classe Gaming.
(-) A parte inferior aquece até um máximo de 48.6 °C / 119 F, em comparação com a média de 43.2 °C / 110 F
(+) Em uso inativo, a temperatura média para o lado superior é 27.1 °C / 81 F, em comparação com a média do dispositivo de 33.9 °C / ### class_avg_f### F.
(-) Jogando The Witcher 3, a temperatura média para o lado superior é 38.1 °C / 101 F, em comparação com a média do dispositivo de 33.9 °C / ## #class_avg_f### F.
(+) Os apoios para as mãos e o touchpad estão atingindo a temperatura máxima da pele (33.4 °C / 92.1 F) e, portanto, não estão quentes.
(-) A temperatura média da área do apoio para as mãos de dispositivos semelhantes foi 28.8 °C / 83.8 F (-4.6 °C / -8.3 F).
Asus Zephyrus S GX531GX análise de áudio
(±) | o volume do alto-falante é médio, mas bom (###valor### dB)
Graves 100 - 315Hz
(±) | graves reduzidos - em média 13.3% menor que a mediana
(±) | a linearidade dos graves é média (14.9% delta para a frequência anterior)
Médios 400 - 2.000 Hz
(+) | médios equilibrados - apenas 1.9% longe da mediana
(+) | médios são lineares (5.2% delta para frequência anterior)
Altos 2 - 16 kHz
(±) | máximos mais altos - em média 5.6% maior que a mediana
(±) | a linearidade dos máximos é média (10.8% delta para frequência anterior)
Geral 100 - 16.000 Hz
(±) | a linearidade do som geral é média (18.3% diferença em relação à mediana)
Comparado com a mesma classe
» 58% de todos os dispositivos testados nesta classe foram melhores, 9% semelhantes, 33% piores
» O melhor teve um delta de 6%, a média foi 18%, o pior foi 132%
Comparado com todos os dispositivos testados
» 40% de todos os dispositivos testados foram melhores, 8% semelhantes, 52% piores
» O melhor teve um delta de 4%, a média foi 23%, o pior foi 134%
Apple MacBook 12 (Early 2016) 1.1 GHz análise de áudio
(+) | os alto-falantes podem tocar relativamente alto (###valor### dB)
Graves 100 - 315Hz
(±) | graves reduzidos - em média 11.3% menor que a mediana
(±) | a linearidade dos graves é média (14.2% delta para a frequência anterior)
Médios 400 - 2.000 Hz
(+) | médios equilibrados - apenas 2.4% longe da mediana
(+) | médios são lineares (5.5% delta para frequência anterior)
Altos 2 - 16 kHz
(+) | agudos equilibrados - apenas 2% longe da mediana
(+) | os máximos são lineares (4.5% delta da frequência anterior)
Geral 100 - 16.000 Hz
(+) | o som geral é linear (10.2% diferença em relação à mediana)
Comparado com a mesma classe
» 7% de todos os dispositivos testados nesta classe foram melhores, 2% semelhantes, 90% piores
» O melhor teve um delta de 5%, a média foi 18%, o pior foi 53%
Comparado com todos os dispositivos testados
» 5% de todos os dispositivos testados foram melhores, 1% semelhantes, 94% piores
» O melhor teve um delta de 4%, a média foi 23%, o pior foi 134%
| desligado | |
| Ocioso | |
| Carga |
|
Key:
min: | |
| Asus Zephyrus S GX531GX i7-8750H, GeForce RTX 2080 Max-Q, Intel SSD 660p SSDPEKNW512G8, IPS, 1920x1080, 15.6" | Aorus 15 X9 i7-8750H, GeForce RTX 2070 Mobile, Intel SSD 760p SSDPEKKW512G8, IPS, 1920x1080, 15.6" | Asus Zephyrus S GX531GS i7-8750H, GeForce GTX 1070 Max-Q, WDC PC SN520 SDAPNUW-512G, IPS, 1920x1080, 15.6" | Razer Blade 15 RTX 2070 Max-Q i7-8750H, GeForce RTX 2070 Max-Q, Samsung SSD PM981 MZVLB512HAJQ, IPS, 1920x1080, 15.6" | Asus Strix GL504GM i7-8750H, GeForce GTX 1060 Mobile, Toshiba NVMe THNSN5256GPU7, IPS, 1920x1080, 15.6" | Asus Zephyrus GX501 i7-7700HQ, GeForce GTX 1080 Max-Q, Samsung SSD SM961 1TB M.2 MZVKW1T0HMLH, IPS, 1920x1080, 15.6" | |
|---|---|---|---|---|---|---|
| Power Consumption | -25% | -3% | 22% | 18% | -0% | |
| Idle Minimum * (Watt) | 16.1 | 26 -61% | 17 -6% | 10.4 35% | 10 38% | 18 -12% |
| Idle Average * (Watt) | 20.9 | 30.8 -47% | 20 4% | 14.6 30% | 16.9 19% | 23 -10% |
| Idle Maximum * (Watt) | 27 | 34.9 -29% | 29 -7% | 16.3 40% | 21.1 22% | 31 -15% |
| Load Average * (Watt) | 93.4 | 90.7 3% | 112 -20% | 88.5 5% | 112.4 -20% | 79 15% |
| Witcher 3 ultra * (Watt) | 168.2 | 175 -4% | 152 10% | 155.4 8% | 135.5 19% | 148 12% |
| Load Maximum * (Watt) | 215.3 | 241.2 -12% | 211 2% | 182.4 15% | 157.3 27% | 196 9% |
* ... menor é melhor
| Asus Zephyrus S GX531GX i7-8750H, GeForce RTX 2080 Max-Q, 50 Wh | Aorus 15 X9 i7-8750H, GeForce RTX 2070 Mobile, 62 Wh | Alienware m15 GTX 1070 Max-Q i7-8750H, GeForce GTX 1070 Max-Q, 90 Wh | Razer Blade 15 RTX 2070 Max-Q i7-8750H, GeForce RTX 2070 Max-Q, 80 Wh | Asus Strix GL504GM i7-8750H, GeForce GTX 1060 Mobile, 66 Wh | Asus Zephyrus GX501 i7-7700HQ, GeForce GTX 1080 Max-Q, 50 Wh | |
|---|---|---|---|---|---|---|
| Duração da bateria | -47% | 157% | 117% | 97% | -27% | |
| WiFi v1.3 (h) | 3 | 1.6 -47% | 7.7 157% | 6.5 117% | 5.9 97% | 2.2 -27% |
| Reader / Idle (h) | 1.8 | 10.5 | 11.4 | 3.1 | ||
| Load (h) | 1 | 1.7 | 1.5 | 0.7 |
Pro
Contra

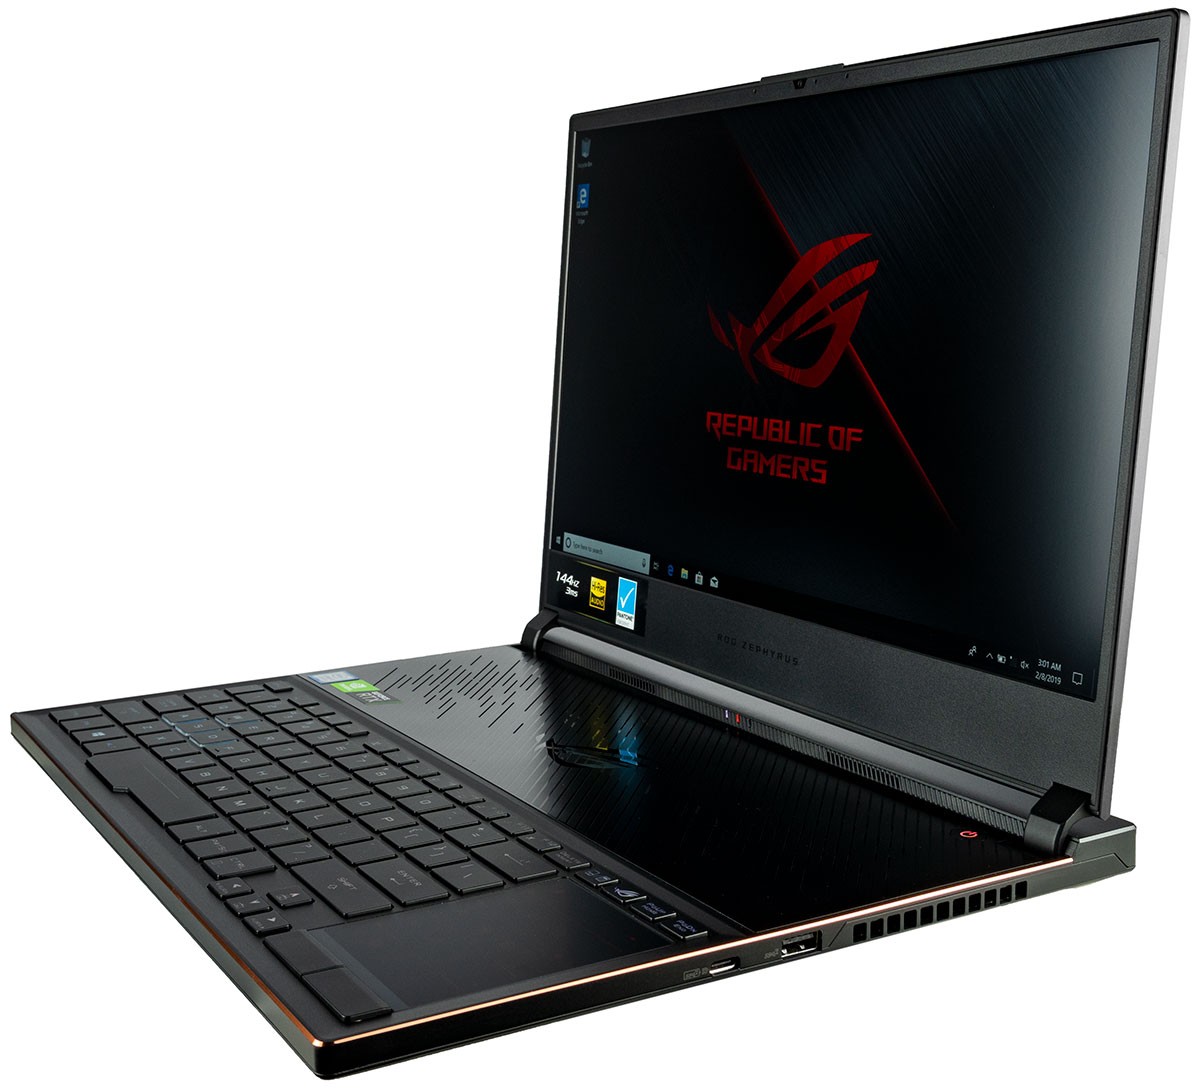
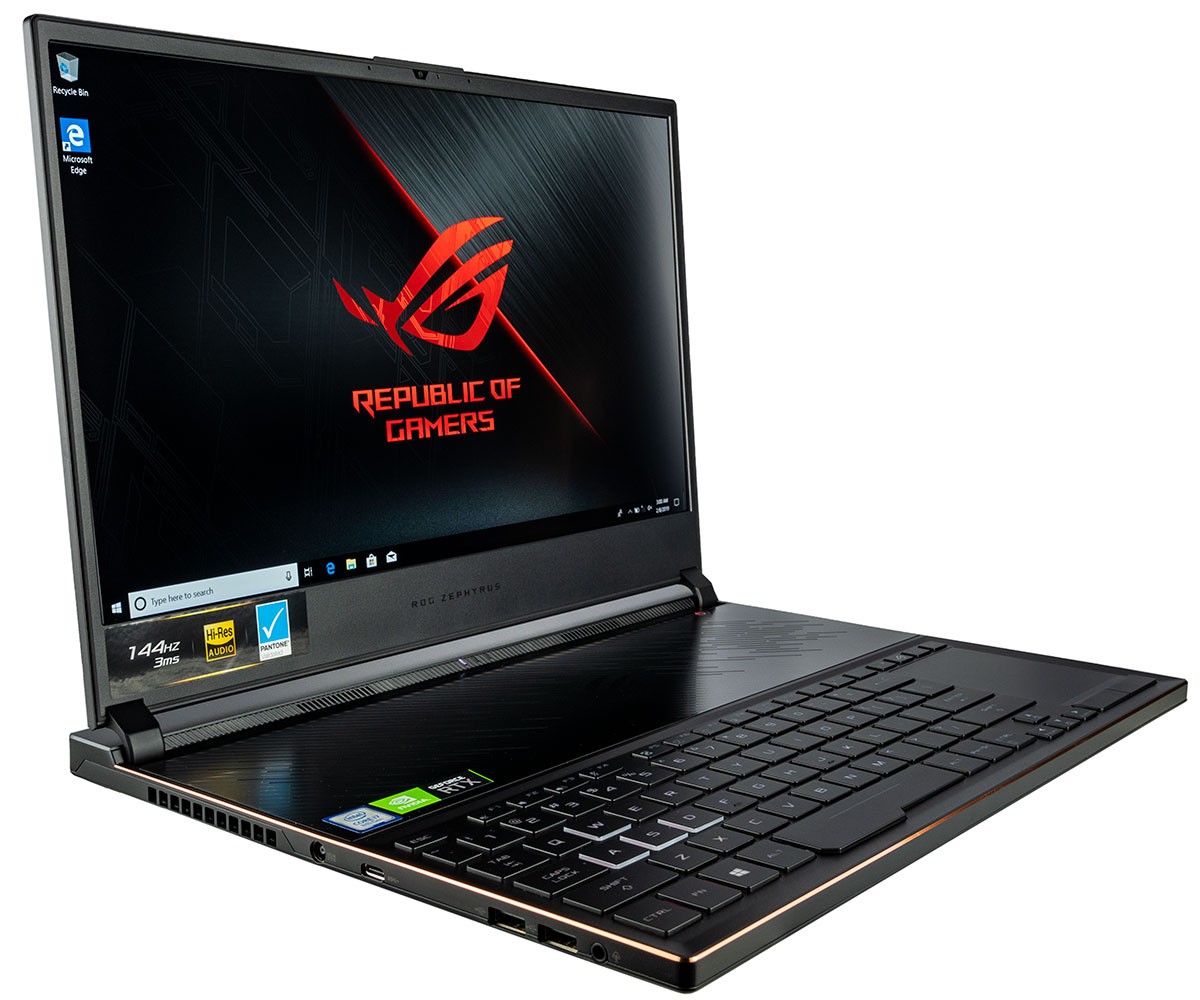
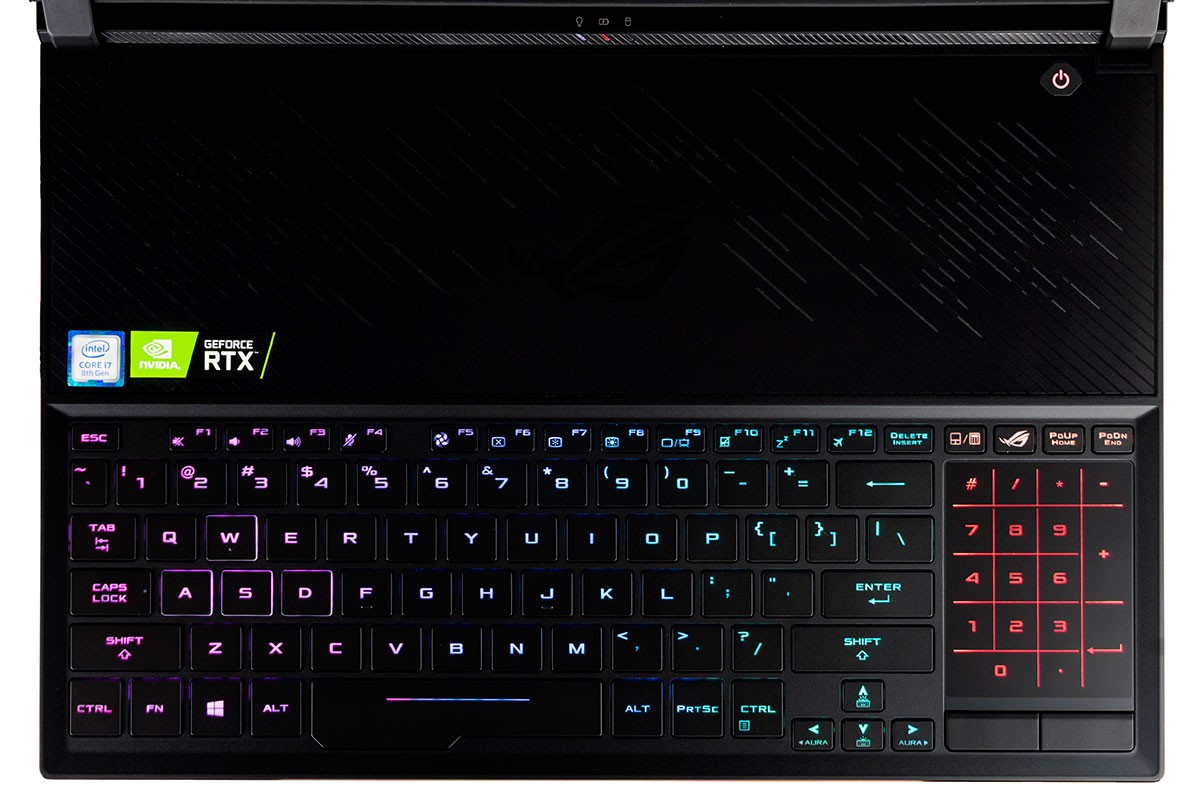
O GX531 se destaca em algumas áreas importantes. Além de ser atraentemente fino com marcos estreitos, as temperaturas centrais são mais baixas do que esperávamos quando os jogos e a tela em si são uma grande melhoria em relação à tela do GX501 onde o ghosting era muito notório. É claro que o design exclusivo do chassi significa que teclas desconfortavelmente quentes nunca serão um problema. Os usuários podem esperar de 17 a 45% melhor desempenho de jogos do RTX 2080 Max-Q em comparação com o GTX 1080 Max-Q.
Ainda há muito espaço para melhorias. O queixo da tela é muito grande e o ruído do ventilador é mais alto que nos concorrentes, incluindo o MSI GS65 ou Razer Blade 15. É necessário ter o portátil funcionando no Modo Turbo com os ventiladores no máximo para obter o máximo de desempenho dele, pois no Modo Balanceado acarretará uma penalidade no desempenho de 10%. Essas configurações de energia devem ser manipuladas por meio do aplicativo Armory Crate, pois elas operam independentemente dos perfis de energia padrão do Windows.
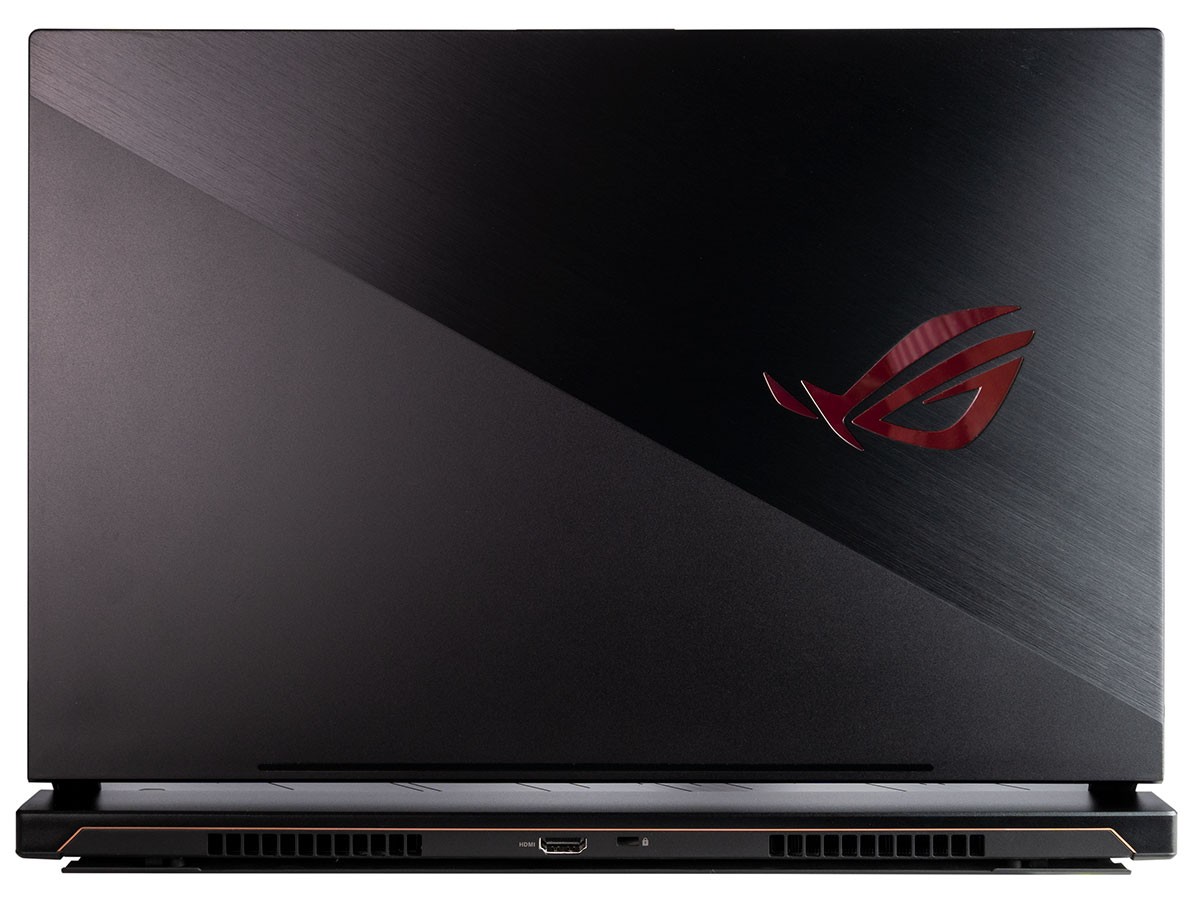
Outros recursos ausentes incluem o RJ-45, o leitor de cartões SD, a iluminação RGB por tecla e o Thunderbolt 3, que acreditamos ser padrão em portáteis de jogos carros chefe, que chegam aos US $ 2.500. Os entusiastas dos jogos podem preferir usar o G-Sync em vez do Optimus, já que a duração da bateria já é média, mesmo com a alternação de gráficos disponível. O perfil fino também exclui quaisquer opções de armazenamento secundário interno, o que pode ser um problema para usuários com grandes bibliotecas de jogos.
Devido às desvantagens do GX531, recomendamos que os usuários deem uma olhada na série Asus ROG GL504. Achamos melhor equilibrado com teclas mais firmes, tampa mais resistente, mais opções de armazenamento, mais portas e um trackpad maior. Ele ainda compartilha exatamente o mesmo painel IPS que o GX531. É uma alternativa mais grossa, mas achamos que sua longa lista de recursos úteis vale a pena.
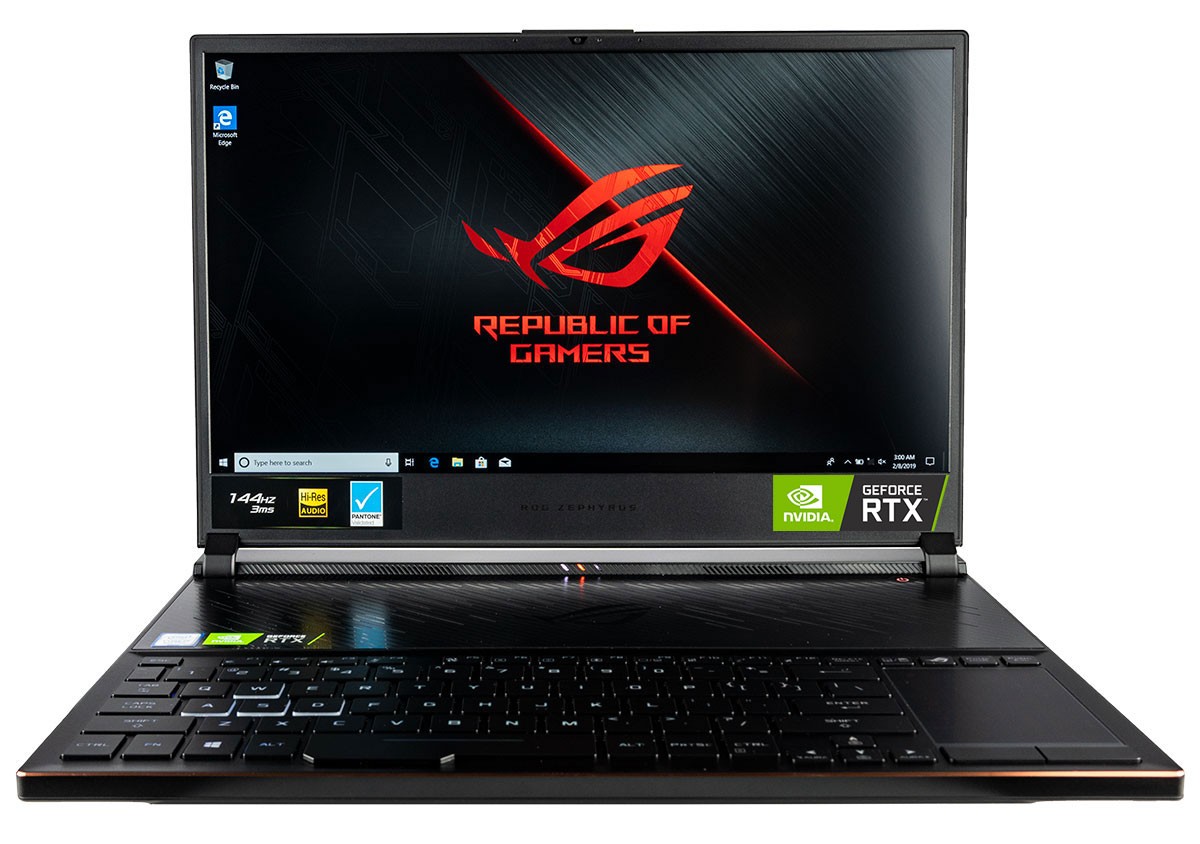
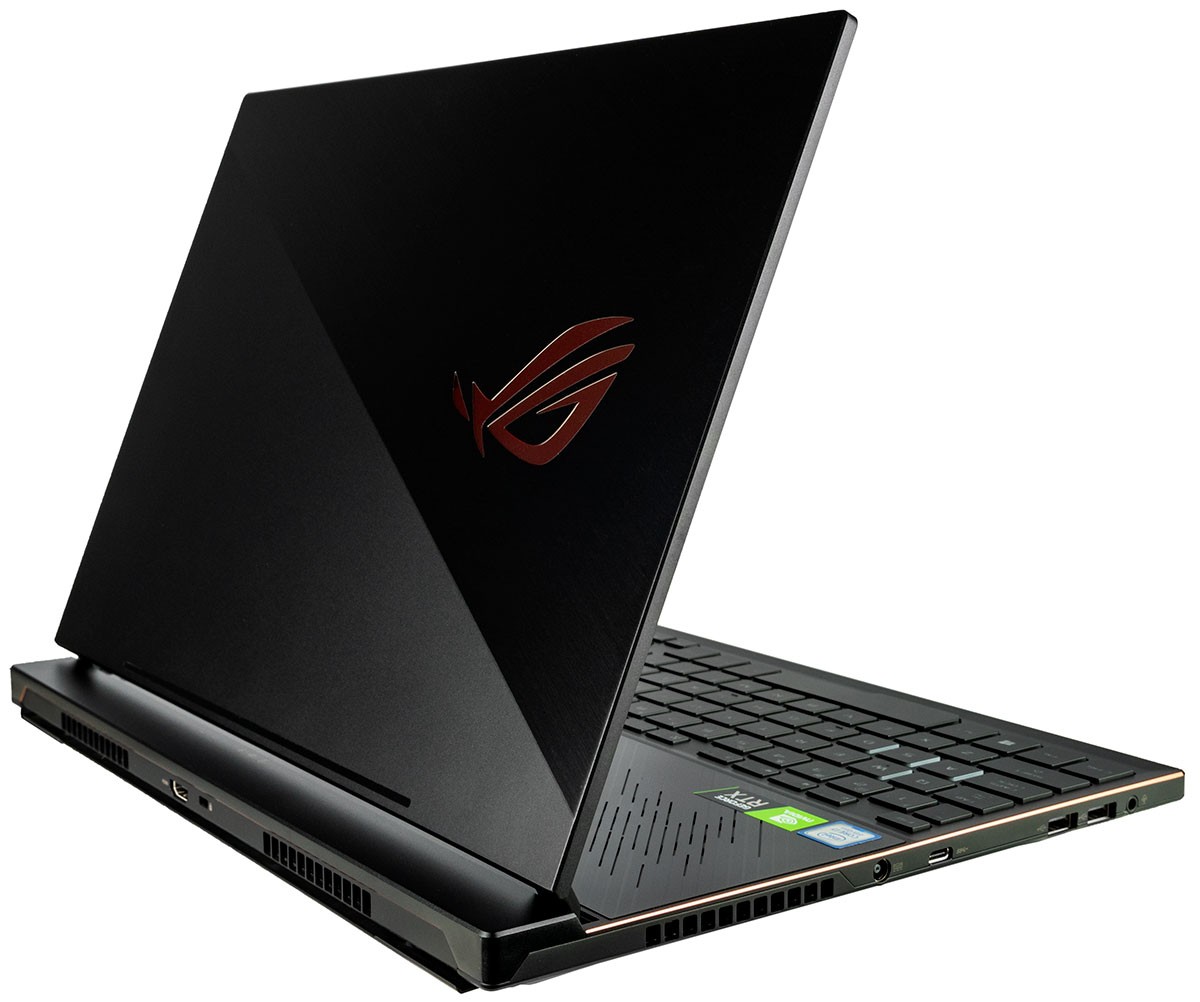
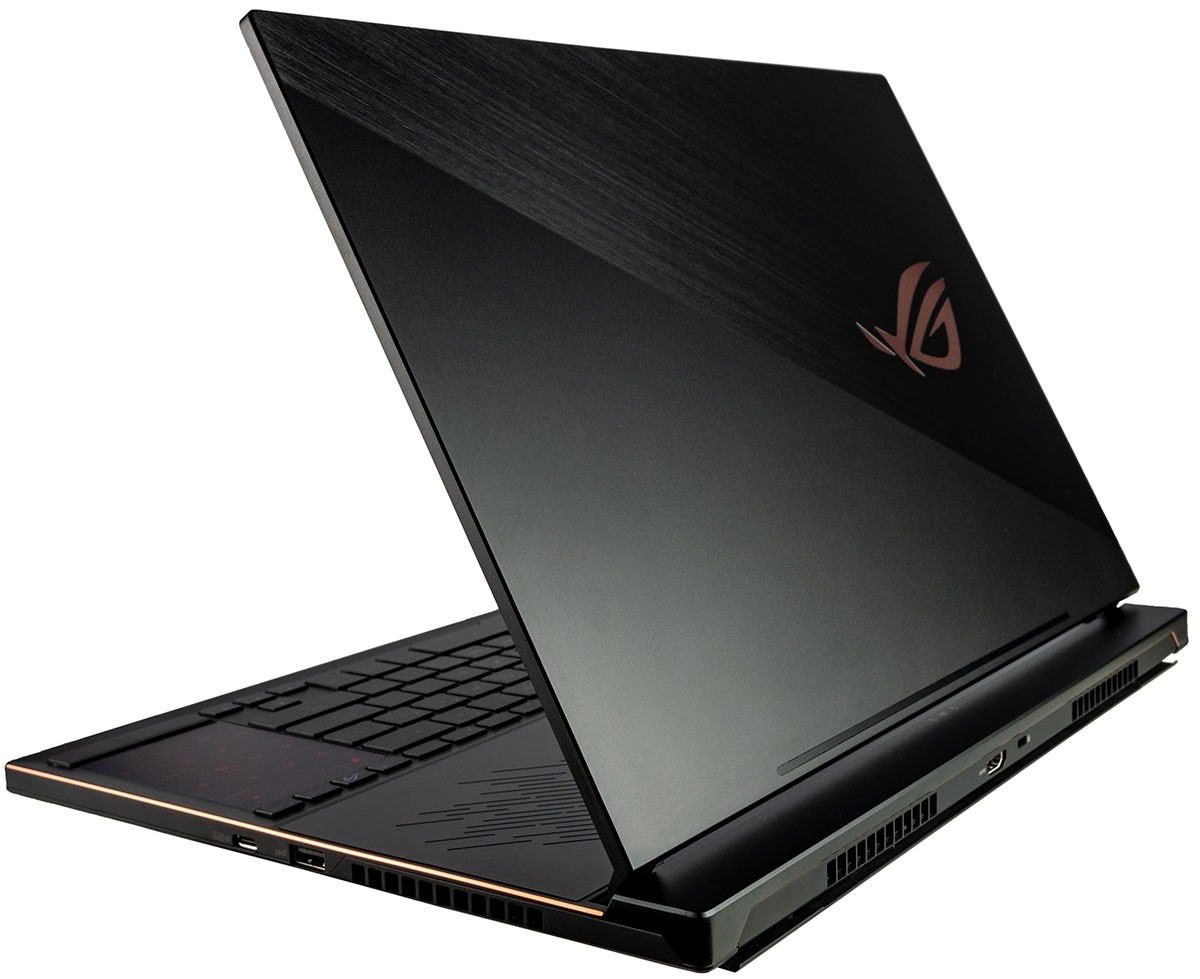
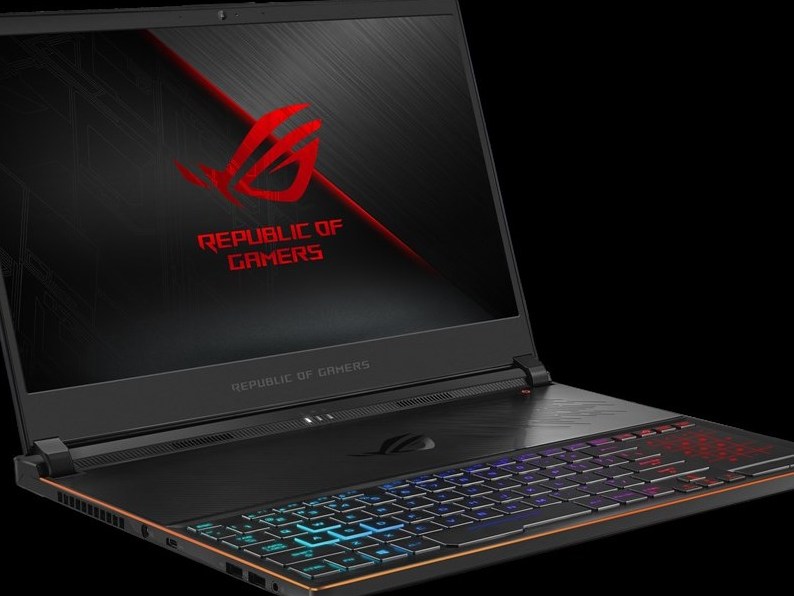
Uma atualização significativa em relação ao antigo GX501 em termos de desempenho, peso, espessura e aparência. O GX531 é o portátil de 15,6 polegadas mais visualmente impressionante da Asus até hoje, mas teve que sacrificar alguns recursos úteis para alcançar um formato tão fino e leve.
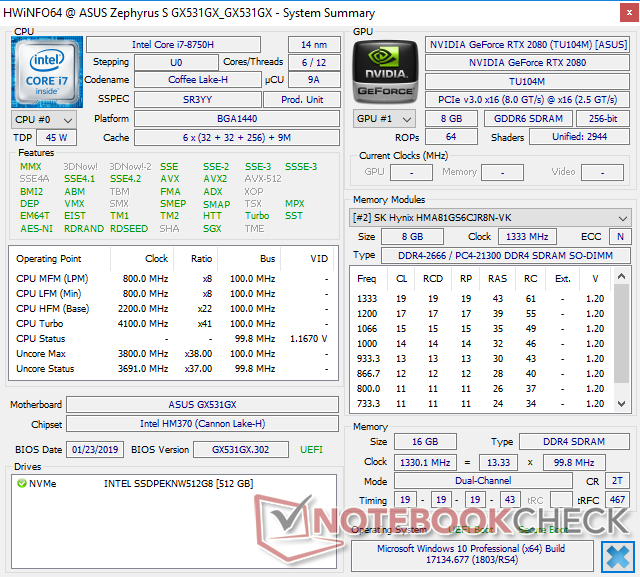
Asus Zephyrus S GX531GX
- 09/20/2019 v7 (old)
Allen Ngo
Price comparison
